analytical analysis and characterization of glass samples
TRANSCRIPT

Corso di Laurea magistrale In Scienze Chimiche per la Conservazione e il Restauro Tesi di Laurea Analytical analysis and characterization of glass samples from archeological sites of Donoratico and Santa Maria della Scala, Tuscany (Italy) Relatore Ch. Prof. Carlo Barbante Laureando Leonardo Bogana Matricola 819282
Anno Accademico
2012 / 2013

Master thesis realised with
Universiteit Antwerpen
Faculteit Wetenschappen
Departement Chemie Antwerp X-Ray Instrumentation and Imaging
Laboratory
Erasmus Project 2012/2013
Promotor:
Prof. Dr. Koen Janssens
Master Student:
Leonardo Bogana

INDEX
ABSTRACT…………………………………………………………………………………………………………………………5
1.GLASS PROPERTIES AND HISTORY………………………………………………………………………………6
1.1 DEFINITION OF THE GLASS: WHAT IS THE GLASS?.........................................7
1.1.1 MAIN PARTS OF GLASS………………………………………………………………………………………….7
1.2 NATURAL GLASSES……………………………………………………………………………………………………9
1.3 HISTORY OF GLASS………………………………………………………………………………………………..10
1.4 GENERAL GLASS FEATURES……………………………………………………………………………………15
1.4.1 CHEMICAL AND STRUCTURAL GLASS COMPOSITION ……………………………………….15
1.4.2 GLASS STRUCTURE………………………………………………………………………………………………15
1.4.3 VISCOSITY …………………………………………………………………………………………………………..18
1.4.4 THERMAL EXPANSION………………………………………………………………………………………….20
1.4.5 NETWORK FORMER………………………………………………………………………………………………21
1.4.6 FLUXING AGENTS ……………………………………………………………………………………………….23
1.4.7 STABILIZERS…………………………………………………………………………………………………......25
1.5 DYES, DECOLOURING SUBSTANCES AND OPACIFIERS………………………………………..26
2. THE ARCHAEOLOGICAL SITES OF SANTA MARIA DELLA SCALA (SIENA) AND
DONORATICO (LIVORNO)………………………………………………………………………………………………30
2.1 THE HOSPITAL OF SANTA MARIA DELLA SCALA…………………………….....................31
2.1.1 HISTORY OF SIENA AND OF THE HOSPITAL OF SANTA MARIA DELLA SCALA –
FROM THE ETRUSCAN PERIOD TO THE 11th CENTURY……………………………………………….32
2.2 DONORATICO…………………………………………………………………………………………………………..37
2.2.1 HISTOTY OF DONORATICO – FROM THE HELLENISTIC PERIOD TO THE
FIFTEENTH CENTURY……………………………………………………………………………………………………..37
3. ANALYTICAL METHODS……………………………………………………………………………………………..42
3.1 - SAMPLE PREPARATION………………………………………………………………………………………….43

3.2 - LA-ICP-MS…………………………………………………………………………………………………………….44
3.2.1 - LA–LASER ABLATION……………………………………………………………………………………….46
3.2.2 - ICP –INDUCTIVELY COUPLED PLASMA……………………………………………………………48
3.2.3 - MS –MASS SPECTROMETER…………………………………………………………………………….50
3.2.4 DATA ACQUISITION AND PROCESSING……………………………………………………………..52
4. RESULTS…………………………………………………………………………………………………………………….56
4.1 GLASSWARE DECRIPTIONS…………………………………………………………………………………….57
4.2 MAIN RESULTS…………………………………………………………………………………………………………63
4.3 COLOURING AGENTS……………………………………………………………………………………………….71
4.4 TRACE ELEMENTS…………………………………………………………………………………………………….75
5. COMPARISON OF GLASSES……………………………………………………………………………………….82
5.1 COMPARISON BETWEEN ROMAN AND MEDIEVAL GLASSES……………..................83
5.2 “HIMT” AND “LEVANTINE” GLASSES………………………………………………………………………85
6. CONCLUSIONS………………………………………………………………………………………………………………94
BIBLIOGRAPHY ………………………………………………………………………………………………………………97

5
ABSTRACT
This thesis is dedicated to the study of archaeological glass belonging to the Late
Antique period, found in the hospital of Santa Maria della Scala (Siena) and
Donoratico (Livorno) in Italy.
The 49 glass samples, object of this study were analysed by applying a scientific
approach. Such approach has led to the identification of the composition of the
samples, determining the raw materials that were used and where they were found,
what kind of glass (quality wise) was analysed as well as to the identification of the
colouring agents present in the vitreous matrix.
This study aims to identify the working processes and glassware trade in Italy during
a transition time, such as that between the end of the Roman period and the
beginning of the Middle Ages.
Numerous articles regarding glassware excavated from archaeological sites of the
Roman period in Italy and in the provinces of the Empire were analysed in order to
compare them with the samples object of this study.
The aim of this thesis was to aid archaeologists in understanding what has happened
between the Roman period and the Middle Ages in the village of Donoratico and in
the area where now lies the hospital of Santa Maria della Scala, identify the type of
materials used in the making of glass and its quality.
The Santa Maria della Scala archaeological excavations started in 1998 whereas the
Donoratico ones started in 2000. Both sites were sponsored by the University of Siena
together with the Sopraintendenza Archeologica of Tuscany. In addition to the glass
samples, other materials such as ceramics, stones and metals were found.
As regards the pre-Medieval period in Tuscany, the archaeological excavations were of
fundamental importance in determining the political and trading strategies, as no
written evidence exists until the Middle Ages.

6
CHAPTER 1: GLASS
PROPERTIES AND HISTORY

7
1.1 DEFINITION OF GLASS – WHAT IS THE GLASS?
The word “glass” is commonly used to identify many different objects: stem glasses,
optical lenses, ordinary glasses, bottles etc.. Glass is generally considered a hard,
fragile, transparent or coloured material, softening at a high temperature and quite
insoluble in water and in common solvents. From a scientific point of view, the term
glass is used for any non-crystalline and unstructured material: this comprises a wide
choice of materials with different chemical compositions, but also with physical and
chemical characteristics that define the vitreous state. This statement is too blurry
and generic, so the definition given by National Academy of Sciences of the US is now
accepted: “glass is a material that, once subjected to powder x-ray diffraction (XRPD)
does not show any peaks and, during temperature variation, shows a more or less
continuous variation of number of thermodynamic characteristics, such as specific
volume, enthalpy, specific heat and linear thermal expansion. The heat at which the
taking place is called the temperature of vitreous transition, Tg” [1].
A vitreous material can be obtained by condensation of a gaseous phase, by cooling or
polymerizing (from) a liquid phase or by disordering a solid phase; all these methods
lead to the formation of a non-crystalline structure. Cooling a liquid phase is the most
common method to obtain a glass [2]. Thus, there are glasses composed of inorganic
and organic compounds. Therefore, some types of candies, cotton candy, plastic
materials and some types of alloys can considered to be glassy materials.
1.1.1 MAIN PARTS OF GLASS
In daily usage, the word “glass” is employed for transparent glasses derived from
silicon, which is normally obtained from sand; if it is pure, the point of fusion of SiO2
is almost at 1730°C and its processing temperature is even higher. These
temperatures were unimaginable for the furnaces of some centuries ago and it is still
hard to get such high temperatures. In order to lower the fusion temperature, oxides
of other elements were added to the basic composition (e.g. Ca, Mg, Na, Al), which
may make glass chemically less stable, but, by adding some others, it was possible to
obtain an optimal blend. The result is an affordable glass, workable at 1100-1400°C.
A typical composition of modern soda-lime glass is: Si 72%, Ca 11,5%, Al 2%, Na
14,5% and Mg 4%, in addition to traces of oxides of other elements.. This
composition has remained almost the same since the Roman Empire [1]. Other

8
oxides, such as B2O3, PbO or P2O5, may be added in order to give glass specific
characteristics such as brilliance, thermal sheen, ease-of-cutting and others [3].
In order to obtain this type of glass, it is necessary to have network formers, network
modifiers (metal oxides that increase the workability of the molted glass) and
outriggers (oxides that improve specific chemical characteristics).
The main constituent of glass is silicon, which is normally obtained from sands. In
nature, three crystalline structures are encountered: quartz, tridymite and
cristobalite. The relation among these three forms is quite complex and their stability
depends on temperature. The stable room-temperature phase is quartz a. Glass is
the formless structure of silicon dioxide, is obtained with a fusion process at high-
temperatures and in nature can be found as obsidian, tektites, pumice and
lechatelierite.

9
1.2 NATURAL GLASSES
The above-mentioned natural glasses are spontaneously created, i.e. without human
intervention. Their vitreous nature is due to sudden cooling of lava cooling that did not
allow its atoms to reorganise in crystalline structures.
Th origin of Tectites is assumed to be meteoric, as their form suggests that they have
been heated by passage through the atmosphere while rotating. They are small and
elliptic and can be found in various parts of the world (e.g. Tasmania, Australia,
Bohemia and South America) and their composition is comparable to that of obsidian,
which has however a lower rate of iron and manganese [4].
Obsidian is a vitreous vulcanic rock. Its composition is a silicious compound of sodium,
potassium, aluminium and calcium and it is characterised by a concave fracture. It
can be found in all the volcanic areas of the world, so it has been used by prehistoric
men for aesthetic and utilitarianpurposes as an alternative to chert, for example for
making knives, arrow tips and spears [4].
Pumice is a vitreous lather, produced by gasses released from lava. It is a magmatic
effusive rock, very light thanks to its high rate of porosity and it originates from
explosives eruptions (acid, silicious or felsic magmas): its porosity is due to the
sudden cooling that leads to the formation of gas bubbles [4].
Lechatelierite is another type of natural silicious glass that originates from impact of
thunder onto the sand or silicious rocks. The resulting heat is so high that it melts the
silica: the air within is immediately expelled, leading to the formation of irregular
pipes of silica (fulgurites). It can also originate from the fusion of sand caused by the
impact of a meteorite: Lechatelierites like these have been found in Winslow, Arizona
(USA) [4].

10
1.3 HISTORY OF GLASS
To make the tools that man has been using since prehistory, obsidian, tectite, pumice
and lechatelierite were employed. They are visible on the chipped tips of arrows and
blades. The use of these natural glasses, originated after a fusion at high-
temperatures of the crystalline form, went on until the discovery of artificial glass [3].
The first proofs of vitrous paste date inthe Vth millennium B.C in Egypt and
Mesopotamia, where glass has ostensibly been synthesized for the first time. Real
glass, i.e. not joined to a base, dates back to III millennium B.C., still in Egypt and
Mesopotamia, while first discoveries of more well-defined tools, such as beads, seals
or marquetries, have been provided of documentary evidence only since XVI century
B.C..
The glass-production formulas found in Mesopotamia are really significant: small
boards with cuneiform scripts dated XVII century a.C that, because of their strange
mix of magic formulas, ritual chemistry, cryptograms and secret codes, look like
alchemist texts. These are instructions on how to add lead, copper and antimony to
two types of “crude” glass, whose chemical composition is not described. These
findings are the proof of a solid tradition of glass [5][6].
An old legend reported by Plinius the Elder in Naturalis Historia affirms that glass has
been invented by chance: some phoenician merchants were put up at the Belus river
and, not knowing where to place their cooking implements, they decided to use as a
base what they were carrying, the natron, and placed it on the underlying sand.
Natron (Na2CO3•NaHCO3•2H2O) is a sesquicarbonate of sodium and originates from a
slow evaporation of natural alkali waters of Egypt and Lebanese desert. The
combustion went on all night long and the following morning the merchants found a
new shining substance: glass, arose from the fusion at high temperatures of sand and
natron. This legend, however, has never been confirmed.
Glass has been more likely invented by chance by a former potter: he missed the
proportions of an enamel by putting in too much baking soda and left the furnace at
too high temperatures. So, it's not a surprise that the first workshop on glass have
been related to ceramic technologies and knowledge. It is necessary to remember
that glass is the most ancient synthetic substance ever invented by man [1].
In this early period, glass was an opaque conglomerate, coloured or not, in which
crystals of SiO2 were recognisable, partially or not liquefied; thus it is better to use
the term “vitreous pastry” rather than glass. This was due to its complicated

11
production proces: the temperatures of the former furnaces were not that high, and it
was difficult to reach a temperature high enough for a full fusion of the starting
materials. Former production furnaces and technologies have to be related to the
production technologies of already-known materials, such as pottery. That's why the
production process was divided into phases: Plinius affirms that there were even three
different phases. At the beginning, men fired coarsely mixed sand and natron and
obtained a crude glass, which, molten again, resulted in fritta. Fritta is a partially
amorphous glass that is ground up and then molten again in order to achieve the
amorphous state and release residual gas. In the end, a third glass fusion step results
in a pure and workable glass [1].
Later, during the II millennium B.C., Persia and Egypt developed the necessary
techniques and technologies for glass production in order to obtain transparent,
coloured or decorated glasses [1].
During the II millennium B.C, there were essentially two types of glass: HME and
LMHK. HME stands for High Magnesium Glass (or vegetable soda-lime-silica glass),
created with sand and sodium-rich ashes, obtained from the combustion of salt-loving
plants. These featureaverage Mg and K concentrations of about 4-8% (relative to dry
mass) LMHK stands for Low Magnesia High Potash Glasses, coming from Europe and
probably obtained by means of a blend of ash from coastal and hinterland plants [7].
During the Roman Empire the main glass fusing agent was natron, available in large
quantities. The discovery of glass blowing optimized the production of vitreous
objects, leading to a cheaper glass-production, affordable even for the lower classes
[3].
At the beginning, glass was in effect considered to be an expensive and precious
material, such as metals and gem stones, both because of the difficulty of production
and shaping and due to the substance pleasing aesthetical effect. Because of its high
price, glass was a prerogative of leisure classes and was used only as decoration. It
has been discovered that since the late Bronze Age, glass has been used together
with metals and gemstones. As an example, glass traces have been found in Fidia's
laboratory in Olympia (Greece), proving its ornamental use in a wealthy context. The
discovery of glass blowing in the Ist century B.C made the production of vitreous
objects much easier and allowed even poorer people to buy glass artefacts. There
were two resulting “types” of glass: the first was a high-quality glass that kept its
ornamental role; the second was a poor-quality one, used for tableware or as a

12
container for liquids, perfumes and unguents. Glass blowing was a revolutionary
discovery, strictly linked to the idea that broken glass shards (socalled cullet) could
be re-molten. The re-use of glass was practiced on a small scale even before the
invention of blowing, but it was not re-molten: for instance, glass fragments were re-
used in wall and floor mosaics, and some container scraps could be used to make the
eyes of bronze statues.
Literary sources suggest that the re-melting of vitreous materials is to be dated to the
first Flavian Age. Glass recycling has been proved by significant ingots, chunks and
cullet (glass pieces and junkers), which have been found in several ship wrecks in the
Mediterranean and Adriatic Sea. [2]. Another important proof is the discovery of the
Roman ship Julia Felix, six miles away from the coast of Grado, in the Adriatic sea,
whose main load were amphorae of various type. Thanks to the type of amphorae and
the ship equipment it's possible to date this ship up to before the first half of III
century a.D.. In the forepart of the ship, a wooden barrel containing 11.000
fragments glass cullet was present, weighting in total 140 kg. This proves the
remarkable effect that the recycling of glass had on the Flavian dynasty, comparable
to the discovery of glass blowing during the Augustan Age. [8] With the gradual rise
of the Roman Empire, even the number of authors that highlighted the use of glass in
the Roman “daily routine” increased: glass is quoted by Cicero, Plinius the Elder,
Petronio, Marziale, Ovid and many others that state that glass at that time was a good
within everyone's reach [2].
At that time glass production and manufacturing underwent two different phases.
Analysis on glasses of Roman-Imperial Age, originatinging from different areas and
times, show the extraordinary compositional uniformity of Roman glass. The most
plausible theory is that the Romans used the same type of sand: this suggests that
the main workshops were located in few areas and, that the resulting glass was sent
as “crude glass” to the various Emperial provinces, where it was re-molten and
shaped as needed. A prime example is the glass workshop in Anderitum, now Javols
(France): here a furnace, crude glass and vitreous masses of scraps were found next
to an certain number of slags, some beads and various vitreous masses, probably the
result ofworking on scraps. These types of scraps, slags and beads and the furnace's
structure reveal a craftsmen area, where only crude glass working, but not its
production from raw materials, was practised. It was much easier to transport crude
glass than raw materials, sand and natron, and the finished product, because the
13
latter was too fragile [1]. Presumably the primary glass workshops were located in the
East, probably in Palestine and Egypt [5].
With the decline of the Roman Empire (476 A.D.) and its resulting fall as a cultural
centre, also glass art suffered from those events and movements typical of the new
civilization in Europe. The independence of the various areas resulted in glasses of
different quality and importance, but typical of and related to all latitudes: from the
Iberian region to England, from France to Belgium, to the Netherlands, to
Scandinavian countries, even to distant Russia (especially the Caucasian regions and
Ukraine) between VII and XIII centuries [6].
During the Middle Ages, glass took on a new meaning, especially in Northern Europe,
where the gothic style was prevalent. Glass was considered a close-to-God material,
which was able to spread rays as divine expression. That's why all gothic churches are
full of beautiful and large glass walls, whose large dimensions and high sheen testify
to the technological progress achieven regarding glass-production: this knowledge
was gathered in the course of centuries and allowed to obtain glass of almost all
possible colours and desired transparency and opacity effects [1].
During the Renaissance, the city of Venice absorbs entirely the awareness and the
intensity of the new movement and inspires minor arts and, most of all, that of glass.
Actually, Venice started its production of glass already at the end of the Ist millenium
A.D, when pieces of glass (cullet) were imported from the Eastern Mediterranean
region. In the XII and XIII centuries, Venetians preferred to import directly raw
materials in order to focus on high-quality glass production [3]. The technical
progress of the Venetian glass makers led to a more refined material. The artisans of
Murano produced high-quality glasses that were not intended to ordinary usage:
Murano's excellent glasses, whether they were of crystal (colourless, transparent
glass), LATTIMO (opacified glass) or coloured glass, rich in golden and enamelled
decorations, was not only highly succesfull in all European courts, but unexpectedly
also in the Islamic Middle East, whose governors and merchants imported large
amounts of venetian glass during the XV century.
The fame and the prestige that the Venetian glass makers enjoyed all over Europe
caused them to emigrate during the XVI century and settle in affluent cities (such
London, Antwerp, Amsterdam), where, after 1541, a la façon de Venise, they
produced some wonderful glass objects [6] [9].
14
Soda glasses remained popular until the end of 1660, when the Englishman
Ravenscroft invented lead crystal that had better optical properties that soda lime
glass. In Europe, lead crystal and Bohemian potassium-based glasses remained the
very popular until the invention of Solvay process for the production of sodium
carbonate on an industrial scale.
As a result of this, sodium glass became once again the most popular type of glass.
Today, lead glasses are still used for artistic and ornamental purposes, while
borosilicates glasses are used when a high thermal resistance is needed.
In the course of the centuries, glass became more and more a material for mass
production and, thanks to the technological processes that lowered its cost, accessible
to all. Glass is no longer used only for ornamental purposes or as container material,
but influences our lives in a strong manner: even nowadays glass keeps its decorative
nature, it's not unusual to find contemporary artworks made of glass. Reading
glasses, microscope and telescope's lenses, light bulbs, cameras and video cameras,
optical fibres etc. are just some of the extraordinary inventions that have changed
human history that contain important glass parts and that have led to scientific and
technological progress.
In summary, glass is a perfect material because it can be shaped as needed, whether
colourless or coloured in any colours and shades, can be cut or pressed, has a high
chemical resistance, acleanliness that is guaranteed the possible to see the contents
within a container: all these features justify the huge success it has always had.
15
1.4 GENERAL GLASS FEATURES
1.4.1 CHEMICAL AND STRUCTURAL GLASS COMPOSITION
Glass can be identified as the fusion product of inorganic material that has been
cooled under critical conditions in such a way that the substance is not able to
crystallize. Important contributions to the discovery of the structure of glass are owed
to Frederik Zachariasen, a Norwegian physicist that in 1932 published the very
successful article “The atomic arrangement in Glass”. Here Zachariasen claims that
glass atoms are bound the one to another thanks to strong forces, that are the same
for the crystalline phase. So it's misleading to describe glass as a supercooled liquid,
at least when it's underneath TG, the transition phase temperature. Pure silica melts at
1730°C and at this temperature, together with a sudden cooling, it becomes a glass.
As already said, this temperature is difficult to reach and even more difficult is glass
working at these temperatures, so it's essential to add various oxides that function as
network modifiers, stabilisers and colorants: these oxides go into glass structure in
order to modify its final composition.
1.4.2 GLASS STRUCTURE
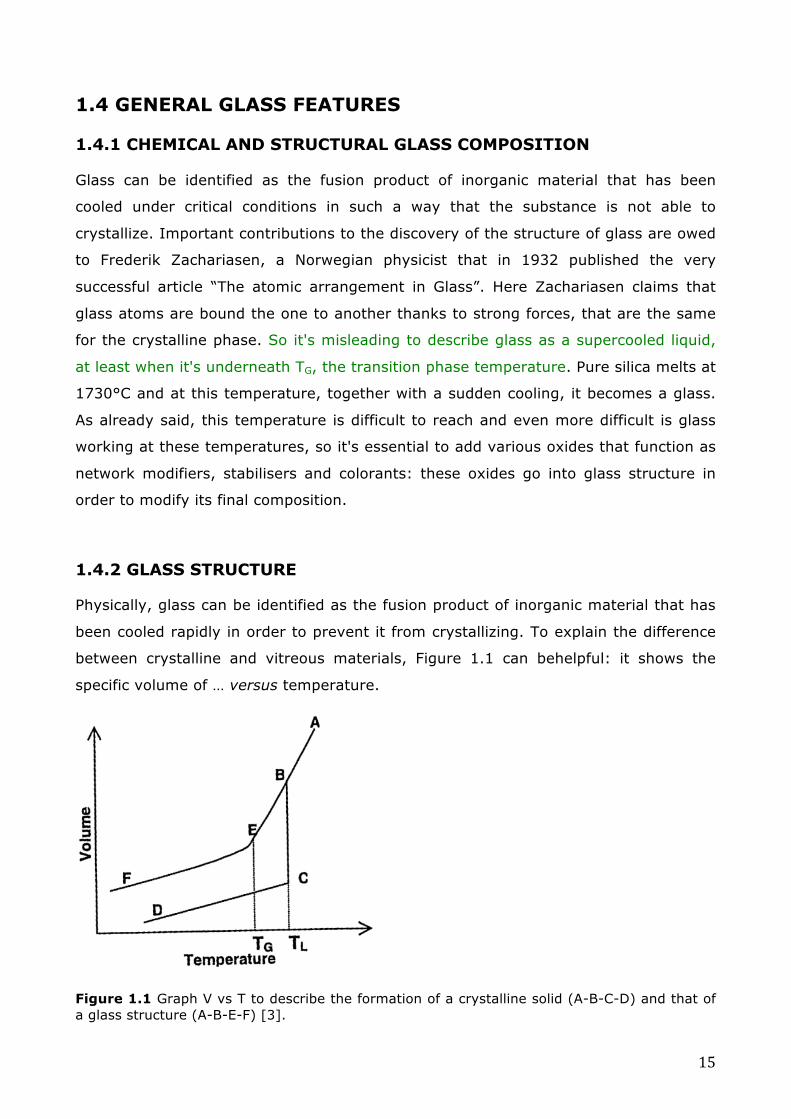
Physically, glass can be identified as the fusion product of inorganic material that has
been cooled rapidly in order to prevent it from crystallizing. To explain the difference
between crystalline and vitreous materials, Figure 1.1 can behelpful: it shows the
specific volume of … versus temperature.
Figure 1.1 Graph V vs T to describe the formation of a crystalline solid (A-B-C-D) and that of a glass structure (A-B-E-F) [3].

16
If heated at high temperatures, a crystalline solid liquefies (with related volume
increase) and, as shown in the diagram, point A stands for this representation.
Cooling to B leads to a decrease in total volume of the system, as a result of thermal
contraction and configuration constriction. If you keep on lowering the system
temperature, you can have two different situations.
In the first case, the system gets slowly cooled, letting molecules organize in a
crystalline structure. The diagram records a transition from point B to point C, which
coincides with temperature TL. TL is the fusion/crystallization temperature: at this
temperature, solid and liquid phases are in thermodynamic equilibrium, so that there
is no phase transition between the two phases. The sudden specific volume reduction
is due to the transition from liquid to crystalline form: the density increases
considerably because now molecules are organized and packed. The sudden volume
decrease is followed by a thermal volume reduction up to D.
In the second case the system gets slowly cooled, so molecules don't have the time to
re-organise in a crystalline structure. There is a transition from point B to point E,
which coincides with vitreous transition temperature (TG). This temperature makes
viscous liquid become an amorphous solid. Crystalline materials have a specific
fusion/freezing temperature; glass has indeed a temperature range with a localized
TG. TG depends on cooling velocity: the higher the speed, the higher TG will be. Unlike
B and C, there is not sudden volume decrease from point E onwards but only a slope
variation of the curve. The observed volume decrease is due only to thermal
contraction (up to point F). The volume of the after sudden cooling will be higher than
the one obtained after slow cooling: this is because configuration constriction cannot
keep up with the cooling velocity and causes a viscosity increase [2] [3].
The composition of the systemhas not changed in any of the two cases, but their
structural variation has: the atomic arrangement of the material is different.
Glass is often seen as a supercooled liquid, which behaves as a liquid, but, in same
cases, under conditions of cooling temperature, it crystalizes almost spontaneously if
a crystal is added as a seed. Glass has more energy than what is presumed to have at
a given temperature: it is said to be metastable, because it has been cooled at a
much lower temperature than the temperature at which it usually crystallizes. The
more the cooling progresses, the more the viscosity increases and gradually the
atomic mobility is prevented, so that atoms can be organized in a normal crystalline
structure.

17
Total stability can be reached through an high-energy halfway state in which normal
intermolecular bonds get broken and new ones are produced in order to form a
regular network (crystalline phase). In this network, both crystalline and glass atoms
can have only vitrational motions, but not rotational and translational ones: this is
why both crystalline and vitreous structures are rigid. So it is misleading to describe
glass as a supercooled liquid, at least when it is below thevitreous transition
temperature.
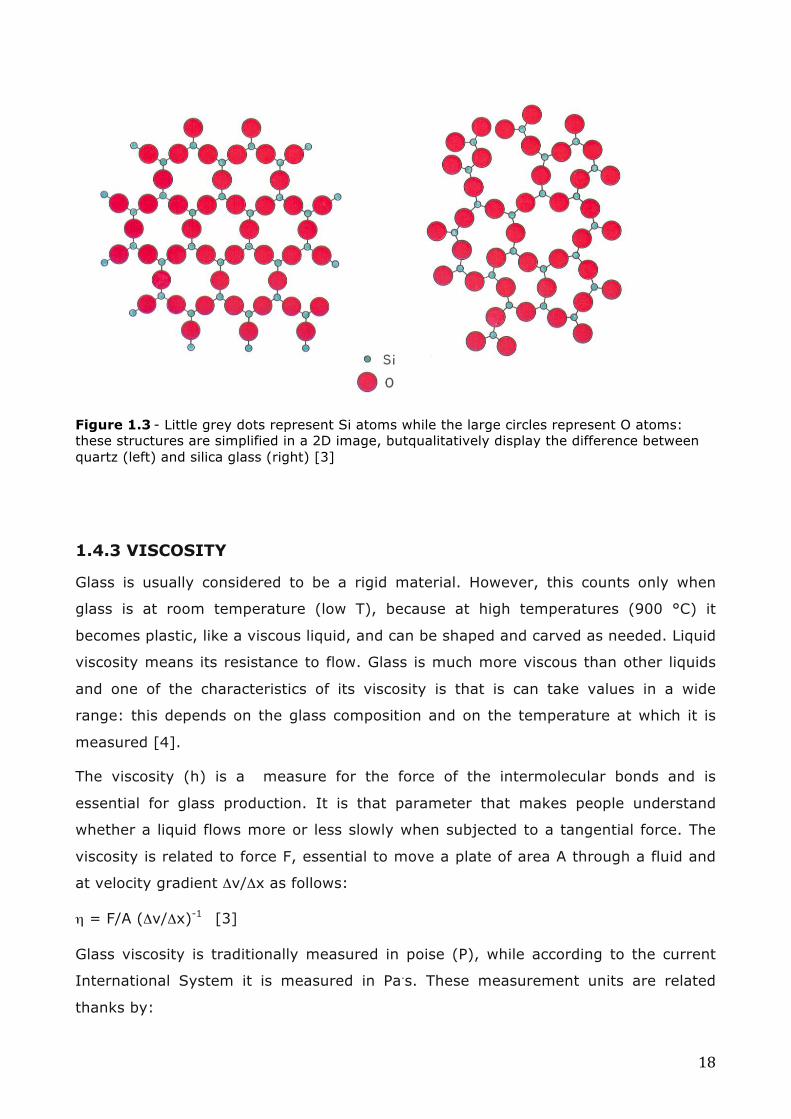
Silica crystalline structure is made up of a continuum network of tetrahedral SiO4:
silica atoms in the middle and the 4 oxygen on the corners (Figure 1.2). The 4
vertices are shared together with 4 adjacent tetrahedrons: oxygen function as bridge-
bonding among tetrahedrons and secure the network continuum. Si and O are tied
together thanks to strong covalent bonds and together they form a three-dimensional
structure. Silica's fusion temperature is so high because a big amount of energy is
needed to break this type of bonds. The structural difference between crystalline and
vitreous phase is the following: atoms in crystals geometrically and periodically
organize in a regular network, in glass they do it by chance, leading to a distorted
network. Glass is organized in short distance, but the difference becomes obvious if a
wider network's portion is considered; the glass structure is said not to have an
organization on large scale. The morphous structure takes more space than the
crystalline one, so a crystal is denser than the corresponding glassy material (Figure
1.3) [1] [2] [3].
Figure 1.2 - Tetrahedral structrure of silicon and oxygen atoms in a cristalline structure [3]
18
Figure 1.3 - Little grey dots represent Si atoms while the large circles represent O atoms: these structures are simplified in a 2D image, butqualitatively display the difference between quartz (left) and silica glass (right) [3]
1.4.3 VISCOSITY
Glass is usually considered to be a rigid material. However, this counts only when
glass is at room temperature (low T), because at high temperatures (900 °C) it
becomes plastic, like a viscous liquid, and can be shaped and carved as needed. Liquid
viscosity means its resistance to flow. Glass is much more viscous than other liquids
and one of the characteristics of its viscosity is that is can take values in a wide
range: this depends on the glass composition and on the temperature at which it is
measured [4].
The viscosity (h) is a measure for the force of the intermolecular bonds and is
essential for glass production. It is that parameter that makes people understand
whether a liquid flows more or less slowly when subjected to a tangential force. The
viscosity is related to force F, essential to move a plate of area A through a fluid and
at velocity gradient Δv/Δx as follows:
η = F/A (Δv/Δx)-1 [3]
Glass viscosity is traditionally measured in poise (P), while according to the current
International System it is measured in Pa.s. These measurement units are related
thanks by:

19
10 P = 1 Pa.s = 1 kg.m-1.s-1
η stands for the viscosity coefficient and is distinctive of any fluid. Newtonian liquids
are those fluids whose viscosity remains constant as the applied force, and so the
sliding velocity changes: there are only few of them in nature. Non-Newtonian liquids
are those liquids whose viscosity h changes as the applied force changes: glass is one
of these [1].
Viscosity decreases at high temperatures: many chemical bonds break and
possibilities of movement increase as a consequence [4].
The viscosity increases considerably when it cools down below the fusion temperature.
In glass production any phase must be characterised by a defined viscosity, which is
different from point to point (Figure 1.4). The viscosity clearly not only depends on
the temperature, but also on glass composition: two glasses with a different
composition have, at the same temperature, different viscosity values [1].
Figura 1.4 - Characteristic viscosity-temperature curve of a soda-lime glass showing the most important viscosity fixed points and viscosity ranges for the different steps of a glass fabrication process [2].

20
Glass viscosity at room temperature is very high, almost 1020 poise, while molten
glass is workable at levels of viscosity between 104 and 107 poise [4]. A temperature
vs. viscosity diagram (Figure 1.5) shows a difference between “long” and “short”
glasses. A “short” glass can be worked only in a limited temperature interval, so only
short work sessions are permitted between furnace's reheating [4].
Figura 1.5 - Viscosity log. vs temperature for the three different glasses (A,B,C) with their respective working range [3].
1.4.4 THERMAL EXPANSION
Most materials expand (i.e., their volume grows) when they are warmed up, while
they contract when cooled down: this is linked to the increase of the average inter-
atomic distance induced by absorption of thermal energy. Every material has its own
value of thermal expansion that distinguishes itself from the other materials. In a wide
temperature interval, volume variation, defined as volumetric expansion coefficient
(CVE), is regular. However, for practical purposes, the linear expansion coefficient,
caused by a thermal increase is more important, as it increases in length according to
unit length. In order to normalise this value, it's better to analyse the coefficient of
linear expansion α, defined as:
α= (L – L0)/L0 (T-T0)
where L stands for the final length, L0 for the initial length, T for the final temperature
and T0 for the initial temperature. α is expressed in °C-1 o K-1 units.

21
The coefficient of thermal expansion of pure silica is very low (0.005x10⁻⁷ K-1): it has a
high thermal shock resistance. The most part of glass elements have lower
coefficients, about 1.7x10⁻⁷, except for sodium and potassium alkali, that have
respectively 4.32x10⁻⁷ K-1 and 3.9x10⁻⁷ k-1[4]. So, when a network modifier oxide, like
sodium oxide, is added to the glass composition, its coefficient of thermal expansion
increases and has, in normal soda glass, values up to 80-90x10-7 [1]. This increase
leads to a worsening of the mechanical characteristics and of its thermal shock
resistance. Historical glasses might have a higher coefficient of thermal expansion
than the current ones. For example, medieval low silica, high potash and high lime
glasses have a thermal expansion twice that of modern silica-lime glasses. Medieval
glasses can have a composition of 40% SiO2, 30% CaO, 30% K2O and a related
coefficient of expansion of about 17x10-6, compared to modern glasses, whose
coefficient of expansion is 8.5x10⁻⁶ and their composition of 75% SiO2, 10% CaO and
15% Na2O [4].
Glass has a low coefficient of thermal expansion compared to other materials: this is
useful for some special decorative effects. In the second half of XVI century, thanks to
their extraordinary skills, Venetian glaziers could make “ice-like” glasses. Their rough
and frosty look was obtained by dunking hot glass into cold water in order to make
some little wrecks on glass surface without breaking it. At that time this type of glass
was a contrasting innovation to crystal-like perfectly smooth glass [6].
1.4.5 NETWORK FORMER
Silica (SiO2), whose primary source is sand, has been since ancient times the main
network former. Others are the oxides of boron (B2O3), lead (PbO) and phosphorus
(P2O5).
The sands of the mouth of the Belus River, now in Israel, together with some sands of
Italian origin are mentioned by Plinius as excellent source of Silica in order to get a
good glass. The coastal sands are the best to obtain glass, because they have the
correct amount of lime, which is assimilated thanks to potsherds and shells of sea
organisms sunk on the sea bottom. Since lime is a glass stabilizer, it gave a
chemically more stable and very long-lasting glass. Another important feature that
sand must have in order to obtain a good glass is a low rate of iron (Fe ≅ 1-3%): this
is fundamental if glass must be colourless or poorly coloured. Middle Eastern sands
have the right amount of Fe which makes them suitable for glass production.

22
The most part of European coast sands are too impure, and therefore unsuitable for
glass production. By using impure sands, it is probable to have the following
unwanted effects:
– unintentional glass colourings
– crystalline materials in vitreous matrix
– low-quality glass with consequent low chemical resistance (short-lasting glass).
Plinius claims that the sands of the Volturno River (Molise, South Italy), upon
purification process were suitable for glass production. In a recent study (2012) [11]
various Mediterranean coast sands in France, Italy and Spain have been analysed in
order to find out whether they were compatible with Roman glasses and to verify
whether there were primary workshops present in Western Europe. It has been
realized that sands suitable for Roman glassmaking can only be found in the following
locations:
– Basento and Bradano Rivers (Basilicata, Italy): sands suitable for making
natron-based glass.
– South-east of Brindisi (Puglia, Italy): only the Al2O3 concentration is slightly
lower than usual.
– Western part of Follonica gulf (Tuscany, Italy): suitable, except for low contents
of P2O5. In the Eastern part of the gulf the sand has a lower amount of Ca.
– Near Rio Guadiana (Huelva, Spain), Murcia (Spain), Bay Hyère (Département
du Var, Provence, France): suitable sands, if not for a lower amount of Ca.
However, raw glass production in Roman times in West Europe could not be directly
proven by any archaeological finds and their use in glass production cannot be firmly
acknowledged. Other sources of Silica can be obtained by grinding flint and quartz, as
venetian glaziers did when producing high-quality glass. Nowadays, colourless glass is
preferably obtained by ultra-pure sands, with the amount of iron at 0,1% w/w.
When a more dense and/or shiny glass was to be produced, lead oxide was added. As
sources of lead there were litarghe (PbO), minium (Pb3O4) and lead carbonates or
sulphides.
23
1.4.6 FLUXING AGENTS
Sodium and potassium are the main monovalent ions acting as network modifiers in
ancient glasses. Na and K lower silica's fusion temperature, so that it becomes easier
to melt its vitreous matrix. Furthermore, these elements delay the glass hardening
process: this is beneficial because there is more time to work it.
At high temperatures, Na and O atoms react with Silica, breaking the covalent bonds
between Silica and Oxygen. Since Na atoms, which have a positive charge, get into
the network structure, electroneutrality must be achieved by originating negative
charges. To do so, the structure goes from a O-Si-O-Si-O type to a O-Si-O- + -O-Si-O
type: i.e., from a solid network made up only by covalent bonds Si-O to a network
that between Na and Si-O- also has ionic bonds, which are weaker and non-
directional, with a consequent NBO (not-bonding oxygen) growth (Figure 1.6) [2][1].
The final result is a less thick, and therefore open, network structure: this results in a
material with a lower density than the glass itself. The lower density reduces the
chemical resistance of the glass, or rather a Soda surplus makes glass more sensitive
to moisture and CO2. Water is the most violent agent of glass deterioration: it
functions both as solvent and carrier, i.e., as a vehicle for other deteriorating
substances [11].

24
Figura 2.6 - Planar plot from the structure of a soda-lime glass with low content of Al2O3 [3].
In ancient times there were three types of melting agents: natron, sodium plant ashes
and potash plant ashes. Sodium oxide is easily obtained by burning saltmarsh plants
and obtaining sodium and potassium carbonates and nitrates. Salsola or Salicornia
genere, otherwise seaweed plants, were generally used.
Since the Hellenistic period, and especially with the Roman Empire, the main fluxes
agent has become Natron, which is mostly made up of hydrated sodium carbonate,
also called trona or tronite (Na2CO3, HNaCO3.2H2O). These salts originate from a low
evaporation of vaporization waters. This mineral gets its name from its source, lake
Wadi Natrun in Egypt: it is located in a valley 100 km north-west from Cairo, slightly
south of the “Desert Road” between Cairo and Alexandria. There are a lot of seasonal
vaporization lakes here, whose shape depends on their location and the weather
conditions. Natron had been used up until XVIII A.D., but it use was suddenly stopped
around 1000 A.D.: since XI A.D, it has been replaced by potash ash as the main
fluxing agent. This is due to the sudden demand of glass for its application in
windows. Maybe the decrease of the use of Natron is linked to its unavailability: it is

25
supposed that other causes are the climate changes and/or the worsening commercial
relations with Middle East, largely conquered by Arabs [3] may also have played a
role.
1.4.7 STABILIZERS
As above seen, the use of Soda and Potassium makes glass chemically less stable. To
give glass its stability again, stabilizing substances must be added: they tighten its
structure up, so that glass chemical resistance can increase. Bivalent alkaline earth
oxides, especially calcium and magnesium oxides (CaO and MgO), are used as
stabilizers: these alkaline metals have a double positive charge and are considered to
be stabilizers because they neutralise the negative charge of two non-bridging
oxygen, forming ionic bonds [1].
In Roman natron-based glasses, these metals were added to the vitreous blend in the
form of natural sand impurities. Plinius reports how the sand of the Belus River was
optimal for glassmaking: it has the right amount of Ca, thanks to the calcium
carbonate included in sea organisms' seashells.
Ca and Mg can be found also in those glasses whose fluxing agent is ash in the form
of impurities of ash itself. In these cases, sand can be made up of pure silica, or
powdered quartz can also be used, giving as well a high-quality glass.
Alumina is another glass stabilizer: it could have already been there as impurity or
wilfully added to the vitreous matrix in the form of feldspars.
Probably man used also limestone as Ca source, but we don't have any sure proof of
this [3].

26
1.5 DYES, DECOLOURING SUBSTANCES AND OPACIFIERS
In ancient times glass could be coloured in three ways:
– Thanks to the presence of transition metals (Co, Cu, Fe, Ni, Mn etc.) in the
silicate network. By using different ions and concentration it's possible to have the full
colour scale.
– Thanks to the colloidal dispersion of insoluble particles in glass matrix, for
example in silver stains yellow or in copper and gold rubies glasses. The resulting
colouring depends on the dimensions of the colloidal dispersion. It is often necessary
to add other oxides, such as lead and tin, for the full development of the colour.
– Opacity and translucent effects can be obtained through the introduction of
larger grains of opacifying agents. [4]
In ancient times only a few metal oxides were used to colour glass: copper, iron,
cobalt and manganese. These elements get into and take part in the silica network
thanks to the formation of new bonds. These elements' oxides are still used by
glaziers to colour glass.
Ancient glasses often have a green/light blue colouring due to the presence of iron as
sand impurity: to prevent this from happening, ancients used to de-colour glass
through metal oxides, such as MnO2 or Sb2O5 and a control of the furnace's
atmosphere, which could be reducing or oxidizing. To obtain a specific glass colour, a
specific chromophore oxide is not enough: it's necessary to consider also the possible
presence of other oxides and the furnace's conditions (temperature and reducing or
oxidant atmosphere).
Clearly, metal oxides used as dyes might have different oxidation states, so they can
give glass different colours. For example, Fe2+ gives a blue colouring, while Fe3+ gives
a yellow/dark one: with the right mix of Fe2+/Fe3+ it's possible to obtain all green
tonalities. The iron oxidation state is determined by the furnace's atmosphere. As
above said, the glass colour can change if in the glass batch there are other colouring
oxides. If in the vitreous matrix iron and manganese are simulataneously present,
there will be a balance between the different oxidation states of these two elements.
This balance is very important for glaziers.
Fe2+ (blue) + Mn3+ (colourless) = Fe3+ (yellow) + Mn2+ (purple)
27
Since Fe3+ and Mn2+ are the most stable among the oxidation states of these 2
elements, the balance will be moved to the right.
In a reducing atmosphere (the balance of the previous reaction is forced to the left),
manganese is colourless and iron gives glass an intense blue colouring due to Fe2 ions
(equivalent FeO). Only 0.5-1% iron is needed to give glass this colouring.
In an oxidant atmosphere instead (the balance is on the right by adding oxidant
agents or extending the melting point) iron gives a dark colouring, while manganese a
violet one, so that glass appears brownish-purple. By controlling the furnace's
atmosphere, neither completely reducing nor oxidising, it's possible to obtain a lot of
shades (such as green, yellow, pink). Fe3+ by itself gives a weak yellow colouring; if
the yellow is very intense, it means that in the vitreous matrix there are other
chromophores[6]. When the manganese-violet is balanced with the iron-yellow, it is
possible to obtain other colourless glasses only if Mn is not in excess: manganese
decolouring effect reacts only with iron ions. In ancient glasses, Mn amounts <1,5%
w/w are to be considered natural impurities in raw materials, while bigger amounts
mean the use of manganese as colouring or de-colouring.
Manganese was widely used as decolouring by Romans. However, iron decolouring
can be obtained as well by controlling the melting conditions or adding other colouring
oxides, such as As2O5 or Sb2O5. These oxides have a decolouring effect on iron, but
they can't neutralise yellow. In addition, antimony can work both as decolouring and
opacifier: it depends on the Sb amounts and the firing conditions.
Small amounts of cobalt are needed to give glass a deep blue colouring: only 0.025%
w/w of Co are necessary to give a light blue colouring, while 0.1% w/w of Co gives a
deep blue colouring. Cobalt was already used by Egyptians to give blue or purple
glasses. Together with zinc and magnesium, cobalt gives a red or green colouring
instead of blue.
Copper was already known as glass colouring substance in Egypt and Mesopotamia. It
can be added through its minerals, but oxides and carbonates are preferred, and,
depending on the presence of other glass modifiers, it can give green or blue
colourings by phasing 2-3% w/w of copper in the vitreous matrix. In lead glasses it
gives a green colouring, while in soda-potash glass a blue one. In many other ancient
glasses there is a relation among copper, tin, lead and/or other elements, suggesting
that bronze alloys were used to give glass certain colourings.

28
In reducing conditions, copper gives glass a red colouring thanks to the particle
dispersion of Cu2O in glass matrix.
Each ion of the third group of transition metals gives glass a specific colour. These
elements and their peculiar colourings are shown in table 1.1.
Element Colour Ti3+ Violet Cr3+ Green Mn3+ Purple Fe2+ Blue Fe3+ Yellow/brown Co2+ Blue Ni2+ Brown Cu2+ Blue
Table 1.1 - Transition element and characteristic coloration that confer
There are three ways to obtain a red colouring in silica-soda-lime glasses:
– Glass characterised by high quantities of K and Mg (K2O:1-2%, MgO: 3-4%),
irrelevant quantities of lead and medium-high concentrations of copper in its
crystalline form Cu2O (Cu2O:3-12%). Traces of this type of red-opacifiers glasses have
been found already in II millennium B.C in Amarna (Egypt) and in some Roman glazes
dated I-IV A.D in Europe.
– Glasses that are rich in lead (Pb:25%) and copper (Cu2O:12%) in the form of
big dendritic crystals of cuprite inside the vitreous paste. The first findings of this kind
of glass date back to I millennium B.C in Toprak Kale (Turkey) and in Nimrud (Iraq),
and then it has been found in Celtic glazes of IV-I centuries B.C.
– Low rates of lead and copper glasses, a less developed dendritic microstructure
and a compact phase of metal copper. It has been first found in Alakh (Afghanistan)
and also in Roman-Gallic cards dated IV century A.D.
To precipitate cuprite and metal copper, a reducing atmosphere together with some
vitreous matrix reducing agents (e.g iron) were needed:
Cu2O + 2FeO = 2Cu + Fe2O3

29
In this way, the oxidation and the deteriorating of Cu2O and Cu crystals in the
vitreous matrix during cooling process were prevented [7]
Glass opacity can be obtained thanks to small bubbles or other scattered materials,
but the most part of opaque glasses are made thanks to opacifying agents forming
microcrystalline areas within the glass.
It has become clear that in three different ages have been used three different
opacifying agents: In the pre-Roman and Roman Age calcium antimoniate was used to
reach a white opacity. This method begins during the melting process, when antimony
reacts with the calcium. Since V century A.D, tin oxide replaced calcium antimoniate,
which was still used, but its applications were less and less. In XVII century A.D the
main opacifying agents were calcium floride and lead arseniate.
Lead antimoniate was first used to give yellow opacified glasses, but then it was
replaced by lead and zinc oxide.
Below a summary table (Table 2) of the opacifiers used in time is presented.
Period Type of glass Opacifying agent
1450 BC to fourth century AD
Opaque white and blue
Opaque yellow
Opaque red
Ca2Sb2O7 (occasionally CaSb2O6)
Cubic Pb2Sb2O7
Cu2O + Cu
Fifth century AD to seventeeth
century AD
Opaque white and blue
Opaque yellow and green
Opaque red
SnO2
Cubic PbsSnO4
Cu
Eighteenth century AD to present day
Opaque white
3Pb2(AsO4)2. PbO2 (apatite-type structure)
CaF or CaF3+NaF (Na2Ca)2Sb2O6F
Table 1.2 - The glass opacifiers used in different time periods [4].

30
CHAPTER 2
THE ARCHAEOLOGICAL SITES OF SANTA MARIA DELLA SCALA (SIENA) AND
DONORATICO (LIVORNO)

31
2.1 THE HOSPITAL OF SANTA MARIA DELLA SCALA
The hospital of Santa Maria della Scala is located in the center of Siena, Piazza Duomo,
right in front of the cathedral. It was one of the oldest and largest hospitals in Europe
and one of the first xenodochio (free hospice for pilgrims and strangers). The hospital
has maintained its activities until 1995, when the premises were given a new
destination, that of a new museum (Complesso Museale Santa Maria Della Scala).
The restoration of the building is still a work in progress. The intenton is to
implement the museum functions while maintaining the particular characteristics of a
multi-purpose space. Today it is one of the leading museums and cultural centers in
the city. In this hospital St. Catherine of Siena (14th century) and San Bernardino
(15th century) provided their charitable activities.
Siena is located in Tuscany and is the capital of the province. The city is worldwide
famous for its artistic, historical and landscape heritage and for the substantial
stylistic unity of the urban buildings that date to the middle ages. The city is located
at the center of a vast landscape of hills between the valleys of the rivers Arbia, Merse
and Elsa, among the Chianti hills to the north, the hilly area of Mantagnola to the west
and the Crete Senesi to the south.
The archaeological excavation of Santa Maria della Scala started in July 1998. The
survey has allowed us to study consistent stratigraphic deposits dating from the 6th to
the 11th century AD, which were kept well below 15 hospital environments, set on
three levels, along the medieval inner road. Numerous fragments of glassy materials
were foind but no signs of glass production.
The above excavations (?) were directed by Riccardo Francovich and Daniel
Manacorda and coordinated by Alessandra Molinari and Emanuele Papi.
This excavation is essential to gather more information about the history of Siena
because written sources until the advent of the Middle Ages are non-existing.

32
2.1.1 HISTORY OF SIENA AND OF THE HOSPITAL OF SANTA MARIA DELLA
SCALA – FROM THE ETRUSCAN PERIOD TO THE 11th CENTURY
Until a short time ago in Siena the archaeological traces related to Etruscan times
were limited to the location of some burials; the excavation at Santa Maria della Scala
(?) has instead unearthed the remains of a large structure. This building appears to be
an aristocratic residence, located in the southern slope of the hill of the cathedral,
dating from the 7th century BC. It is a hut with a masonry foundation and raised in
perishable materials, perhaps with a fence outside that enclosed an area of respect.
Near the hut, to the east side, a concentration of pottery’s pieces from the same
period allow us to hypothesize the presence of similar buildings below the hospital,
overlooking the Fosso di S. Ansano. From the second century BC, this part of town
(Santa Maria della Scala and the surrounding area), the landscape is characterized by
the presence of structures of perishable materials, as evidenced by post-holes, which
coexist with stone buildings of a certain size and basement structures. The layers
related to the attendance of these structures yield black glazed pottery of the second
century BC [13].
More obvious are the traces of Siena from the Roman period,when its name was
Saena or Senesis Colonia, although the history of the city in this period remains
poorly understood.
Together with other Etruscan cities to the north of Rome, the Roman citizenship
probably was awarded around 90 BC and a few years later it was recogniezed as a
city. In the second half of the first century BC it became a military colony under the
name Julia Saena; it appears in Tabula Peutingeriana (Roman map that showed the
military roads of the empire) refer numerous funerary inscriptions found in the Roman
world until the end of the 4th century AD refer to it and its soldiers. There is no
written information about the city and its people from the imperial age, and the
importance and the information that can originate from archaeological research is
even more limited for these particular historical sources. Areas of particular intensity
of population, during this period, are in Castelvecchio (private housing and urban
fortifications), on the hill at the Cathedral and Santa Maria della Scala (imposing
masonry structures), although there are also traces of these in the peripheral areas
[13]. Between first and third century AD, the hill was affected by a number of artificial
cuts with almost vertical profile that regularized the slope and created large terraces
where the town grew again, among buildings and allotments. In different areas of the

33
hill occupied by the hospital, archaeological investigations have brought to light the
remains of stone walls mixed by mortar. These were part of buildings expected to
have functioned as housing facilities and documented in many Italian cities of that
period [14]. A marble head that perhaps was part of its decoration and an abundant
number of fragments of painted plaster were encountered that, together with the
discovery of rather refined pottery, coins, glass and various precious artifacts, testify
to the richness of the settlement.
From the second half of the 4th century to the second half of the 5th century,
archaeological finds reveal a city that seems to have had a certain vitality, as
evidenced by the construction of a large spa building. Epigraphic sources tell us that,
thanks to a representative of the city's aristocracy, schools were built and the water
systems renovated. The town is open to trade with the Mediterranean area; African
and Valdoresi amphorae were excavated and Tunisian sigillate flanked some local
production of vases for the table, varnished or ingobbiati with red paint [14]. In the
same century, on one of the terraces overlooking the ditch of St. Ansano the
construction of a large new building was realised. This involved a great, elongated hall,
terminating on the two short sides with apses open to the outside. To the north part
of this area, and perhaps to the east, the last part of the complex was developed,
probably identifiable with the thermal structure mentioned above. Between the 3th
century and half of 4th century we witness the decline of Castelvecchio, where the
first burials are located, which in Late Antiquity will occupy the area where is the
cathedral [13].
The late 5th and early 6th century show the stratigraphic levels of the city covered by
rubble and cut from large pits filled with the materials of the activities of
dispossession of the Roman buildings. The coincidence of these signals with the crisis
years of the greek – gothic war leads us to suggest that they are a direct consequence
of it; these wars cross Italy in the first half of the 6th century [14]. Probably towards
the end of the 6th century AD the city fell into the Lombard hands, perhaps on the
occasion of the descent towards Rome by Agilulf. During this period, Siena takes a
role of particular importance, being on the only passable road route between Rome
and northern Italy. The crisis does not seem to finish in the middle of the 6th and
early 7th century, when the apsidal structures that served as entrance to the spa are
under heavy spoliation and nothing remains of the floors and deposits associated with
the attendance of the building [13]. In addition there is a crisis of imports of foreign

34
ceramics, present but in lesser quantities, balanced by the production of the local
pottery. The picture offered by the study of pottery, tableware and kitchen kits of
good quality, is difficult to reconcile with the stratigraphic data: this side of the hill,
now devoid of residential structures, starts from the middle of the 6th century, to
become a landfill of a settlement that is probably elsewhere (area located above the
landfill, identifiable with the plan of Santa Maria or Castelvecchio). The presence of
houses on the floor of Santa Maria is certified by the discovery of the remains of a
building with walls made of plinth masonry dating from the 6th to 7th centuries. The
part of the area occupied by the architectural complex of the hospital seems to be
confirmed also in the first half of the 7th century, when large amounts of debris to
cover the urbanized areas in Roman times, where the first burials also appear grouped
in the ruins of the great spa building. The appearance of burials in urban areas,
combined with abandoned spa facilities, found many comparisons in Tuscany:
Florence, Lucca, Fiesole, Volterra, Arezzo and Luni [14]. Traces of a house were found
at the southern edge of Piazza Duomo, where a large wall is used for the construction
of a small building. One of the apses of the baths, now in ruins, is even reused for the
construction of a wooden shack. It is most likely a hut functional to the activities of
spoliation of the Roman baths, used as storage for tools. The area in front of the
apses of the thermal building is left uncluttered by waste and further enclosed by a
dry stone wall made with materials obtained from the Roman structures. Around this
structure, the landscape is dominated by the presence of large piles of stones, tiles
and mortar produced by numerous disassembly activities of the Roman buildings;
currently, only small fragments of walls or large pits of dispossession remain.
For the 6th, 7th and 8th centuries the archaeological excavation has shown a
remarkable growth of deposits that cover the remains of the oldest buildings. These
deposits appear to prepend the model already formulated by many Italian cities
during the time of transition (in northern Italy as early as the third century, in Siena
from the 5th century) from Late Antiquity to the High Middle Ages: a "vertical growth"
of urban levels with accumulation of black layers rich of organic decomposed material
that obliterates the imperial stratigraphy. In particular, near the spring that flows into
the ditch of St. Ansano was found a dry wall structure in which heterogeneous
materials (limestone blocks derived from the ancient Roman buildings composed by
clay, fragments of tiles and amphorae) were reused, that probably formed the base of
a wooden fence, built to protect the high part of the hill. This structure seems to be
dated between the 7th and the second half of the 8th century, when, in the

35
Carolingian era it lost its function, collapses (marking the full transition to the early
medieval period).
During the 9th century, some information about Siena are provided by historical
sources. We know that in 883 AD a certain Alderat was the count of the city, while
between 867 and 881 the same position is covered by the count Guinigi. Of particular
relevance was the discovery of some fragments of the heavy window dating from the
second half of the 9th century and the 10th century. This type of ceramic production,
until now unknown to the city of Siena, testifies to business contacts with Lazio or at
least with the southern Tuscany. The back of the hillside shows traces of settlement in
the late 9th and 10th centuries AD, where the remains of a large building blocks of
limestone and sandstone were found. In the 9th century Piazza Duomo was made up
of terraces dotted with wooden huts along a road that led up the slope. These
structures have left footprints in the ground: post holes of circular shape, with
reinforcements in yellow tuff. Among these wooden huts had to be traces of stone
masonry structures. Surely there are still in sight on the western part of the apse of
the Roman baths. During the 10th century this structure undergoes a new action of
dismantling, as evidenced by the discovery of some post-holes; due to their curved
shape, they seem to refer to a functional wooden scaffolding. Just to the east and
built ex novo, another stone wall is constructing again by reusing Roman building
material. Definitely had to be part of building a public type and perhaps also of some
importance, as suggested by the special care in setting up and finishing of the outer
as well as the abundant use of mortar. Here the presence of a series of underground
rooms dug into the tuff layer is documented, covering the hillside, before the
construction site that will give life to the first buildings of the hospital of Santa Maria
della Scala. It is assumed that the hospital was built on the other side of the square,
in the rectory, opposed to the current position in which it is therefore 'repositioned' at
the end of the 13th century.
During the 10th century Siena is at the center of important trade routes that led to
Rome and thanks to what became an important medieval city. In the 12th century the
city was equipped by communal ordinament and expanded its territory helped by its
first alliances. This position, both politically and economically, led Siena to fight for the
domination of Tuscany, with Florence on the other side. From the first half of the 12th
century Siena prospered and became an important commercial center, keeping good

36
financial relations with the the Papal state, to whom the Sienese bankers were
offering their financial services [15].

37
2.2 DONORATICO
Donoratico is located in the town of Castagneto Carducci, in the province of Livorno
(Tuscany). The castle of Donoratico is placed on top of a hilly plateau of almost a
hectare garden, located at 129 m above sea level, at 3.75 km from the line of the
Tyrrhenian coast and 2.5 km south of the center of the housing Castagneto Carducci.
The site falls within the territory of the Bassa Val di Cecina. This castle is famous for
having hosted a figure as Ugolino della Gherardesca, who was an owner of the castle
during the 13th century. Ugolino was made famous by Dante Alighieri, who quotes the
count in the XXXIII canto of the Divina Commedia. Here as in Siena the historical and
literary sources are very poor; Donoratico is mentioned for the first time in 1161,
when a document stipulates that the Della Gherardesca are recognized as the domini
of the area [16].
The archaeological research project started in 2000 has enabled to increase the
knowledge of the historical castle of Donoratico, especially with regard to his pre-
medieval period.
2.2.1 HISTOTY OF DONORATICO – FROM THE HELLENISTIC PERIOD TO THE
FIFTEENTH CENTURY
The excavations have revealed a continuity of population from the Hellenistic period
up to the destruction of the castle by the Spanish in the 15th century. Materials
attributable to a proto-historic occupation of the hill or a phase of Orientalising and
Archaic settlement [16] have not be recovered.
Donoratico has its roots right in the Hellenistic period, when the settlement was
probably an important outpost at the northern border Ager Populoniensis (today
Populonia, Tuscany), to defend the coast and the mining district, up to the stage of
Roman domination throughout the period of Late Antiquity. A continuity of settlement
so stable in ancient times is not surprising for the good location of the site and in an
area particularly rich in resources. Nearby the site there are salt marshes, ponds,
coastal plains exploitable for grain crops, forests and large metal veins found in the
mountains of Campigliese. These features must be combined with a good road
network that during the Early Middle Ages still included the Via Aurelia.

38
The oldest materials accepted until now seem to attest to a first occupation of the hill
in the second half of the 6th - the first half of the 5th century BC. It is part of the rim
and handle of an Etruscan commercial amphora and some fragments of truncated
conical bowls. From the results obtained by archaeological research, you can highlight
five key points relating to the Etruscan settlement of Donoratico: the fortified area,
the topographic proximity to the mining area of Campigliese, the presence of dated
materials not before the end of the 6th - early the 5th century BC, the very high
percentage of pottery attributable to a residential context of the Hellenistic period and
the presence of two chamber tombs [17]. It is not possible to know if the walls have
been high in the same time of the primitive foundation of the settlement (5th century
BC) or whether it should be seen as a fortification of the settlement that took place in
the growth phase of the second half of 4th - beginning of 3th century B.C. The size
and grandeur of the city walls, which had to cover about an acre of land, means that
we should attribute particular importance to the settlement.
The almost complete identity between the productions, the classes and the ceramic
forms attested in the settlement of Donoratico and those present in Populonia, allows
you to assign the fortress and the activities to the business class of Populonia. The
materials found of the Roman period, staggered between the first and half of the 4th
century AD allow us to confirm the strategic importance of the settlement with the
changing political and institutional situation of the city and the region. The settlement
following the adventures of it and seems to break away from the organization of
political and economic Populonia in the second century AD, when it became part of the
production sites related to some house or monastery in the area [17].
This area, like other parts of Tuscany affected by the greek-gothic war (6th century),
returned early within the Lombard domains. The confiscation of lands (some of them
imperial property) by kings and dukes created a new chessboard of power and formed
of settlement that was superimposed on the existing landscape, survived until the
threshold of Late Antiquity, when the region of Donoratico was characterized by the
presence of farms and country houses. Archaeological research has shown that this
part of Tuscany, to the late Roman period and the early Middle Ages, is characterized
by the presence of larger or smaller villages, mostly in wood and placed on top of the
hills with a very low attendance settlement of the surrounding plains. One of them
identified in Donoratico a number of post-holes due to the wooden houses that dates
back to the 6th and 7th centuries. It is possible that in these centuries, in defense of

39
the plateau, these holes were l part of the massive stone walls of the Hellenistic
period that surrounded the whole top [16].
A reorganization of the settlement took place in the 8th century, when the
construction of some circular huts with a diameter of 3.50 m are documented. The
reduced perimeter of the circular huts would lead to hypothesize a non-residential
function of them.
To understand who were the political references in Donoratico in those centuries, we
rely to a documentary attestation of 753-754. This document attest that in the area of
Castagneto there was a curtis owned by the pisan Valfredo, donated to the monastery
of Monteverdi at the time of its foundation [16]. As for the geographical proximity to
Castagneto, we can assumed Donoratico as a town of the hill in the center of
Castagneto. If we look the extension of the settlement (about 8000 sqm), especially
when compared to the size of the castles around during the 12th century, it could be
assumed that Donoratico was a center of a dominico of a curtis and about which
remains no trace in the documentary sources. Its proximity to Castagneto is not
unusual, whereas further south, in the Val di Cornia (Lucca), many dominici centers
were placed at a distance close enough to each other.
One of the biggest changes of the settlement came in the 10th century, when the
village of huts turned into a residential area of greater complexity, starting to use
stone and lime as construction materials. There a mono-apse church was built in the
upper part of the plateau and a boundary stone in part superimposed to the
Hellenistic period, which went to encircle the entire plateau. Contemporary to the
circuit is a construction of a thick wall, perpendicular to the wall, that split the
southern portion of the settlement into two distinct areas. In facing of the circuit has
been possible to identify the presence of two different masonry techniques. The first
technique is characterized by the use of unworked stones, while the second one
involved the use of polished and semi-hewn stones in order to regulate and make
uniform the average size of the elements to obtain an installation as possible regular.
This means two groups of mastery with different levels of expertise who work side by
side for a few years, but without interactions or exchanges between their different
ways of building. It is assumed that this was the original mastery of Pisa, a city at the
forefront for that period. These two groups have worked, always separately, also in
the construction of the mono-apsed church set out above. The high level of
specialization is then evident from the discovery of a circular structure: it is a
40
'machine' for the mortar, used to mix the lime with the aggregates, sands or gravels,
and for producing larger quantities of it, compared to the simple manual mixing with
the mattock [16]. A similar structure, which finds few parallels in Italy and other
countries, addressed the assumptions to a commission from a figure of a certain
political and economic relevance. A commitment aware of the need to enrich the
settlement of spatial reference points and settlements with a well-defined and their
symbolic power which could have, in those years, a mighty masonry in defense of a
village still made up of wooden huts or mixed materials. From the same point of view
could be read the building of the church. The excavation of the only hut found at the
end of the 9th century, unlike the other so far investigated, highlights the adoption of
buildings that approach the north European longhouses. The absence of civil buildings
contrasts even more with the constant investment in the construction of the church .
The analysis of the pottery of the 10th and 11th centuries attests a circulation of
ceramics produced in the workshops of the area, influenced by the production of Pisa
that from 11th century seems to become the center of sales for such products. The
11th century is also characterized by an increased amount of metal objects due to the
agricultural activities but also crafts such as woodworking.
During these centuries Donoratico seems to be under the domain of the monastery,
the same protagonist in policy-making and building, or tied to the fate of any dealers
that intended to acquire more power.
In the 12th century these lay representatives have a name by the time of the act of
1161: the domains of Castagneto and Donoratico have relied on three Gherardeschi
counts. From this time the family came into the management on the contrary of the
monastic authority that seems more focused on the control of the inland town. With
regard to the overall look of the site, in the second half of this century, was built one
of the two towers, the first safe building built a few meters away from the church. At
the same time was extended the facade of the church with a new system of pillars
and was rebuilt lower part of the walls.
Net changes occurred even during the 13th century, in particular in the second half of
it. This century is related to the construction of production facilities as the olive mill,
the construction of new housing lots and stately buildings, such as the second tower.
One question is whether the Gherardesca or their representatives had always lived in
the castle, exercising their rights granted by the monastery, or whether this
41
transformation of the building and housing site, at the end of the 12th and over the
next one, corresponded to a new presence of the representatives in relation to a
decrease of the monastery’s control.
In this century many castles arise, losing, against Pisa, a city that had fully asserted
its political powers in the entire coastal area and inland. Donoratico does not seem to
rebel against this power, and probably the Gherardesca house is allied with Pisa,
confirmed by the fact that Ugolino helped the city in the fight with the Visconti in
Sardinia.
Different situation occurs in the 14th century, when the settlement began to be linked
mainly to the needs of its inhabitants. The gradual abandon of the settlement should
not be sought in a process of decay of the family, who nominally kept possession until
the Florentine conquest, but probably in a decrease of interest in respect of the same
lineage of the castle, which coincides with the crisis experienced by Pisa just during
the last fifty years of the 14th century. The houses with tiled or stone walls were
turned into stables, large batch settlement began to be broken down and the road
was changed. The phase of abandonment was slow and gradual, involving first the
houses located on the terraces and then, after the collapse of the roof and part of the
walls of the church during the 15th century, even the interiors situated in its proximity.
During the 16th century the settlement had completely lost its original function and its
inhabitants probably migrated to nearby towns, first of all to Castagneto who
continued to live even after the conquest of Florence.

CHAPTER 3
ANALYTICAL METHODS

3.1 - SAMPLE PREPARATION
LA-ICP-MS allows the analysis of even the smallest samples. This is why every
vitreous finding has been cut in small fragments, preserving the remaining
archaeological findings from sealing within resin.
The fragments collected in this study are no bigger than half a centimetre. The cutting
process requires a low-speed diamond circular saw. It is fundamental to use low
speed in that, although cutting time increases significantly, higher speed might cause
the loss of the glass fragments just cut.
After being cut, the fragments were placed in 5 resin casts. VersoCit-2 resin
purchased from Powder was used in this analysis: it is an acrylic resin for cold curing.
The following table (Table 3.1) shows the two resin elements:
NAME COMPOSITION
VersoCit-2 Powder
Dibenzoil peroxide, Methyl methacrilate
VersoCit-2 Liquid 2-Hydroxypropyl methacrilate
Table 3.1 - composition of the resin.
The glass fragments collected were sealed in 5 resin blocks (A, B, C, D, E). It is well
documented that glass deteriorates with time and this is revealed as an alkali
reduction in the superficial layers. The 5 resin blocks were smoothed using sandpaper
and polished with diamond paste. This study involved the use of sandpaper
respectively measuring 320, 500, 800, 1200, 1400 and of a diamond paste of 3 µm,
1µm and 0.25 µm. The polishing process is essential because it gives a smooth and
uniform surface, which is perfect for this analysis. For our purposes, only a 500-1000
µm layer is to be removed [3].

3.2 - LA-ICP-MS
In the field of cultural heritage, non-destructive and micro-destructive tests are
becoming more and more established. This type of analysis is preferred as it
guarantees the safeguard of the examined item, preventing the damage caused by
destructive testing (most techniques used for archaeological glass analysis).
Some of the traditional analytic methods are not suitable if the sampling of
archaeological glass is not possible (when, for example, glass itself is too precious) or
is too little: these techniques are atomic absorption spectroscopy, inductively coupled
plasma, optical emission spectrometry and quantitative X-ray fluorescence. The shape
of the vitreous item or the presence of oxidised material on its surface restrict the use
of many non-destructive analyses, such as X-ray fluorescence, proton induced X ray
emission (PIXE) and proton induced gamma ray emission (PIGE) [3].
This is the main reason why since the 90s, LA-ICP-MS has been increasingly used in
the study of archaeological glassware. This instrument makes it possible to conduct
micro-destructive analysis thanks to its laser line that ranges from micrometres to
millimetres, so that the ablated quantity is very little. The damage created by the
laser is not visible to the naked eye (Figure 3.1), thus preserving the cultural artefact.
Figure 3.1 - the damage created by the laser ablation.
LA-ICP-MS makes it possible to detect the main and the minor parts of glass and,
above all, the trace elements, whose observation is necessary in order to find the
geological origin of the glass raw materials [3]. This technique allows fast analysis
with minimal sample preparation and with very low observation limits: usually a small
fragment from the sample is sealed in resin, but recently specific ablation rooms were
created for archaeological research, that allow the total integration of the sample
without any damage (Figure 3.2).

Figure 3.2 - The different laser ablation cells available for analysis at the Centre Ernest-Balelon. These cells of 5, 8 and 12 cm in diameter have been designed specifically for archaeological object studies. A well in the middle of the cell allows the positioning of large objects [2].
LA-ICP-MS can identify almost all the elements on the periodic table, from Li to U, and
can be applied to solids, gases and solutions. LA-ICP-MS functions as follows (Figure
3.3): the laser ablation system (LA) provides the material analysed by ICP-MS, where
an inductively coupled plasma (ICP) atomizes and ionizes the ablated material while
the mass spectrometer (MS) separates and counts those ions generated by ICP as a
function of their mass/charge ratio (m/z)
Figure 3.3 - Schema of the LA-ICP-MS.
3.2.1 - LA–LASER ABLATION
Laser ablation is used to vaporize solid samples that would be difficult to attack
chemically, such as glass. This system consists of a laser unit, a lens, an ablation cell
and a transfer line to move the ablative material to ICP. Laser ablation produces a
noise during the time-dependent signal and requires a sudden (or simultaneous)
acquisition sequence [3].
The general functional scheme of laser ablation is as follows: the sample is placed
under the collection cell and a little gap of about 1/2 mm is left between the two; the
laser is directed to the sample through a quartz window and the diameter of the beam
is balanced by optical lenses; when the laser comes into effect, the absorbed light
warms the surface, removing some material [17].
The amount of material removed depends on the wavelength used, the power of the
laser beam, the duration of the pulse and the optical and thermal properties of the

sample. The amount of ablated sample, in the form of little particles, is removed by
gas transfer (He or Ar) to the ICP torch. The cell and the laser beam are fixed, while
the sample is moved between one laser pulse and another.
In the analysis of archaeological glassware, the ablation crater usually changes from a
minimum of 20 to a maximum of 200 mm [2]; the laser repetition rate can change
from 1 to 10 Hz; the maximum possible energy that the ray can reach is 2 mJ [2].
Samples in the ablation room are controlled by a high-resolution camera connected to
a monitor, to point the laser beam in the selected point of the sample.
The observation of major elements requires 40-80 mm craters, while for minor
elements and trace elements the size of the craters is 80-150 mm [2].
There are two types of laser ablation: Nd:YAG (solid active medium) and excimer
laser (gas active medium).
Solid-state lasers use ions as active medium in a crystalline matrix. In Nd:YAG lasers,
the crystal is a yttrium and aluminium garnet (YAG), which is neodymium-doped (Nd).
Neodymium is a replacement for yttrium, and it partially substitutes it as a trivalent
cation in YAG crystal: usually in these cases the added Nd percentage is of 1%, but
this amount is not stable and can vary depending on the desired use.
Such lasers radiate in the infrared spectrum at a radiation of 1064 nm in wavelength.
It has been noticed that the use of this type of wavelength produces a high elemental
fractionation and has a low ablation field, so the use of shorter wavelengths (266 nm
and, recently, 213 nm) is now preferred [2].
The use of shorter wavelengths causes an intense reduction in chemical fractioning
and, at the same time, sets the ablation field for a clearer analysis. This type of laser
system can produce both pulses and continuous wave. Continuous wave lasers usually
need a smaller amount of Nd than the pulsing ones. Nd:YAG lasers have a cylindrical
cavity so their laser beam will have a round shape; excimer lasers have a rectangular
cavity, so the resulting laser beam will have a rectangular shape.
Excimer lasers (or exciplexes) are the second type of laser system used. The word
“excimer” is the fusion between “excited” and “dimer” and is derived from the
material constituting laser radiation.
This laser system is based on molecules that are stable in their excited state and
unstable (they dissociate) in their ground state. Laser radiation originates at the

molecular dissociation, leading to the formation of a photon whose energy is linked to
the force of an established chemical bond [3].
Noble gasses are preferred in laser formation, because they are inert in their ground
state. When the two noble gas molecules are excited, for example through an electric
shock, two atoms from the noble gases can bond, forming a dimer.
Within a very short time (picoseconds) the newly formed molecules separate into two
atoms, going back to their ground state, and consequently they radiate a photon,
whose wavelength depends on the molecule forming the dimer. It usually falls in the
ultraviolet frequencies.
Lasers are defined “excimer” when gases are made up of two molecules of the same
type (as X2 or Ar2), whereas “exciplexes” refers to noble gases bonding to a halogen
(as ArF or KrF). Exciplex lasers work just like the excimer ones: after stimulation, the
two molecules, halogen and noble gas bond together, but they are unstable in their
ground state. When the stimulation is over, the two molecules divide, originating a
light radiation.
3.2.2 - ICP –INDUCTIVELY COUPLED PLASMA
An inductively coupled plasma torch can be used to atomize and ionize the sample
analysis through the mass spectrometer. Plasma is an ionized gas, made up of
positively charged electrons and ions.
It is particularly used in chemistry and physics thanks to these two features: its
energy is so high that it can atomize, ionize and excite all elements and it is very
sensitive to electromagnetic fields, because it has many ions and electrons [17].
In ICP, plasma is characterised by a continuous flow and is induced into a flow of
argon, helium or both. The energy provided by a radiofrequency electromagnetic field
keeps the gas ionized (after activation through a spark). The field accelerates the
electrons in the plasma: these hit the surrounding atoms, causing heating and
consequent ionization that supports plasma.
The torch operates at temperatures ranging from 6000-10000 K: the sample
compounds are atomized in their constitutive elements and a portion of each
elementary species of the atoms is simultaneously ionized [17]. The torch is made
with quartz because it has a high melting point and it is transparent to RF radiation.

In the analysis using a mass spectrometer it is preferable to use the monocationic
form (1+), even if a small portion of some ions might have a double charge, therefore
originating an instrumental signal at a value that is half that of the expected m/z
ratio.
Figure 3.4 might help to understand how the plasma torch works: ionization activates
through the spark generated by a Tesla reel; argon and helium are kept excited and
ionized by spreading energy to the reel in a radiofrequency field. Upon acceleration of
the electrons through the radiofrequency field generated next to the reel, these collide
with the neutral gas, creating to ionized plasma. Such collisions create other electrons
and hence plasma can support itself. The gases carrying the nebulized sample flow
upwards from the bottom together with other gas flows, which are kept separate and
help to cool the quartz pipe [17].
If the gas flow and the radiofrequency field are appropriately regulated, a toroidal-
shaped area on the base of the torch cone keeps its temperature high and constant.
The aspirated and nebulized sample gets into the plasma through the centre of this
toroid. The plasma cone hangs through the quartz walls as a result of the union of the
helical path of the cooling gas flow and the shape of the radiofrequency
electromagnetic field. The resulting gap prevents plasma high temperatures from
melting the quartz.
Figure 3.4 - scheme of a torch and ICP. [3]
Thanks to an interface that allows ions extraction, a part of the plasma and of the
sample ions are moved from the plasma (air pressure) to the mass spectrometer
(high vacuum).
This interface consists of concentric cones, cooled by water. A first cone, called
sampler or extraction cone (Figure 3.5), is placed in the plasma and has a diameter of
1 mm. The second cone, called skimmer (Figure 3.5), is responsible for sampling
plasma and directing ions through its hole located in a high-vacuum area. A double
vacuum-pumping system is used to bring the plasma from the high-vacuum air
pressure to the mass spectrometer (from about 1 Torr to 10-5 Torr).

Figure 3.5 - Sampler and skimmer cones [3].
3.2.3 - MS –MASS SPECTROMETER
The mass spectrometer is responsible for splitting and counting the ions originated by
the ICP depending on the mass/charge ratio. It is possible to obtain information
regarding:
- The quantitative and the qualitative composition of organic and inorganic analytes,
even in complex blends.
- The structure of many complex molecular species.
- Isotopic relations of the samples atoms.
The basics of a mass spectrometer are as follows: a steam molecule becomes a mono-
positive ion through atomization and ionization. Subsequently, this mono-positive ion
can, spontaneously or through crashes, split in many fragments: each molecule has
its own specific fragmentation depending both on its nature and on the experimental
conditions. This is why the mass spectrometer spectrum is specific for every molecule.
The resulting ions are classified depending on electrical or magnetic separation or
both.
Before reaching the mass spectrometer, ions originated in the ICP pass through a
negatively charged ionic lens, which further focuses the ionic flow and repels
electrons. There is also a metallic plate that prevents photons and neutral substances
from getting into the mass spectrometer and increasing ground noise (18).
A mass spectrometer can be divided into three different parts:
- source (volatilizes, fragments and ionizes the sample)
- analyser (the instrumental hearth: it differentiates the ions depending on their m/z
ratio)
- detector (it measures the intensity of the ionic flow)
In our study, the source of the mass spectrometer is ICP.

The quadruple, the time-of-flight, the ion trap and the magnetic analyser are all
possible analysers that mass spectrometer can have.
The mass spectrometer used in these analyses had a quadruple analyser.
The quadruple analyser consists of a vacuum rectilinear pipe, in which are found two
parallel bars symmetrically placed around the pipe axis of circular or hyperbolical
section (Figure 3.6). There is an electrical contact between the diametrically opposite
boards, while between the adjacent bars a two-component voltage is applied: a
continuous potential difference and a high-frequency oscillatory one. The ion enters
the quadruple analyser parallel to the Z axis and is “pushed” by continuous and
oscillatory electrical fields until it reaches a spiral trajectory. By controlling the
electrical field, it is possible to choose the m/z value for the ions going through the
quadruple; the other ions, those with different m/z ratios, follow other trajectories
ending up outside the electrical field without reaching the detector. This allows the
detection of a specific ion or the scan of the various m/z, by regularly changing the
electrical field [18].
The quadruple is called “mass filter” as it internally selects ions: all ions get in, but
only the ion with a specific m/q ratio is let out.
Figure 3.6 - Scheme of a quadrupole filter [3]
MS detectors are dynodes (that is, electron-multipliers), because the resulting ionic
current is very low and difficult to determine. The ions hit the metal surface of the
detector, giving rise to electrons which in turn multiply. In other words, the ionic
signal is converted into electricity and amplified. The resulting signals are sent to a
calculator, which expresses the abundance of each ion according to its mass: the final
spectrum.
3.2.4 DATA ACQUISITION AND PROCESSING
In the analysis of the samples herein, linear and not single spot ablation was used:
the final signal is more stable when using linear ablation than after analysis with
continuous hits on a single spot [2][3][18].
Furthermore, by choosing linear ablation, fractionation of the chemical elements
constituting the sample decreases. In opposition to spot ablation, linear ablation is
more affected by a "dirty" sample surface (when some oxidised material or residues
are present on its surface) that might alter the analysis result. To prevent this from
happening, pre-ablation on the same area was preferred, but with less energy and
with a wider laser beam diameter. Linear ablation for each sample is 1 mm.
External and internal standards have been used for the calibration.
As for the external calibration, reference materials of known concentrations were
used. Widely used materials in glass production are NIST or Corning glass reference
materials. NIST 610 has been chosen as external standard in our study: its
composition is the most similar to the samples under consideration.
The external standard is used to balance the variability during measurements. Laser
ablation does not guarantee the reproducibility of the “raw signal” that can be
observed from a sample to another. This non-reproducibility is due to the variable
interaction efficiency between the laser and the glass sample [3]. The internal
standard must have similar ablation features to the analysed samples and usually is
one of the major or minor isotopes of one of the main sample components. Its
concentration is obtained through other analysis techniques. The internal standard for
this analysis is 43Ca.
The following equation was used to calculate the concentration of each element into
µg/g [3]:
with:
= the calculated concentration of the element of interest in the sample in µg/g
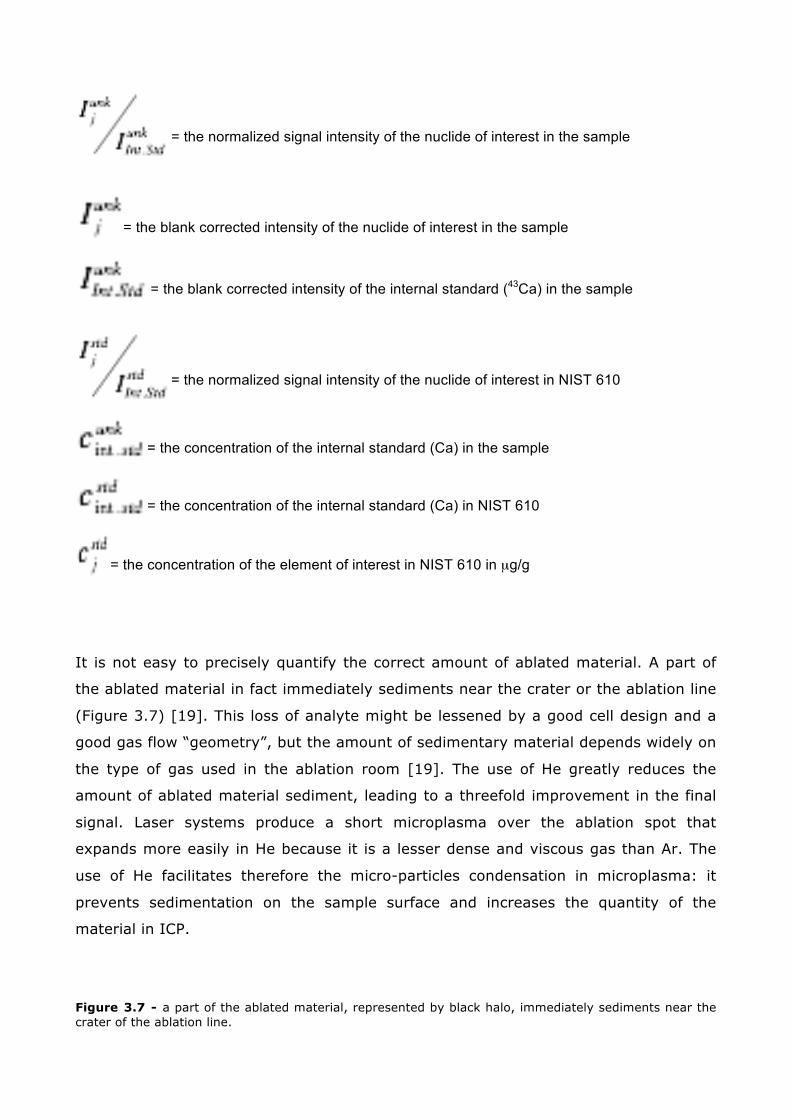
= the normalized signal intensity of the nuclide of interest in the sample
= the blank corrected intensity of the nuclide of interest in the sample
= the blank corrected intensity of the internal standard (43Ca) in the sample
= the normalized signal intensity of the nuclide of interest in NIST 610
= the concentration of the internal standard (Ca) in the sample
= the concentration of the internal standard (Ca) in NIST 610
= the concentration of the element of interest in NIST 610 in µg/g
It is not easy to precisely quantify the correct amount of ablated material. A part of
the ablated material in fact immediately sediments near the crater or the ablation line
(Figure 3.7) [19]. This loss of analyte might be lessened by a good cell design and a
good gas flow “geometry”, but the amount of sedimentary material depends widely on
the type of gas used in the ablation room [19]. The use of He greatly reduces the
amount of ablated material sediment, leading to a threefold improvement in the final
signal. Laser systems produce a short microplasma over the ablation spot that
expands more easily in He because it is a lesser dense and viscous gas than Ar. The
use of He facilitates therefore the micro-particles condensation in microplasma: it
prevents sedimentation on the sample surface and increases the quantity of the
material in ICP.
Figure 3.7 - a part of the ablated material, represented by black halo, immediately sediments near the crater of the ablation line.

In order to achieve a satisfactory quantitative and qualitative analysis with La-ICP-MS,
it is necessary to obtain good ablation, transport, excitation and collection of a large
part of the sample. Any deviation from these prerequisites is usually called “elemental
fractionation”.
Fractionation can be described as a time-dependent variation in the intensity index for
different elements during a uniform sample ablation. It can occur in the ablation
room, in the transport pipe or in the ICP. When in the ablation room, fractionation it is
related to laser parameters such as wavelength, fluency, lateral energy distribution,
pulse repetition rate and focal length of the lens.
It is known that the use of a infrared radiation (1064 nm), which is used in Nd:YAG
lasers, involves a higher fractionation than the use of UV radiation (266, 213, 193
nm), which is indeed used by excimer lasers. Moreover, the use of helium compared
to argon gives a smoother signal with less time-dependent fractionation.
Fractionation occurring in the ICP is indirectly influenced by the ablation process, since
it is mainly due to the aerosol particles size. Aerosol particles that are too big struggle
to atomize and ionize completely in ICP, with the consequent increase of signal noise.
The use of short-wavelength UV radiation during the ablation causes the formation of
smaller aerosol particles, so the final signal will be undeniably better.
In summary, a minor fractionation can be obtained by using short-wavelength UV
radiations and He as a transfer gas [19].

56
CHAPTER 4
RESULTS

57
4.1 GLASSWARE DECRIPTIONS
49 glassware samples were found in the Donoratico sites, in the province of Livorno
(Italy) and in Santa Maria della Scala, in the centre of Siena: 5 of those from the
Donoratico site and the remaining 44 from Santa Maria della Scala.
The excavation works in Donoratico started in 2000 and the research project is yet to
be completed. The excavations were headed by Dr. Francovich Riccardo and Dr.
Bianchi Giuliana, both lecturers in the department of Historical Studies and Cultural
Heritage at the University of Siena. As regards the Santa Maria della Scala excavation,
it was headed by Dr. Francovich Riccardo and by Dr. Daniele Manacorda whereas the
glass findings were dealt with by Dr. Marja Mendera. This excavation started in 1998
and was completed in 2005, with the exception of few precautionary investigations for
new restorations, which did not lead to any new findings.
The majority of the glassware analysed, 33 samples, were green/light green in colour,
the remaining are yellow, brown or colourless. None of the glasses examined was
blue.
From an observation of the Santa Maria della Scala samples in Siena, it was observed
that the consumption of glass artefacts in Siena between the end of the 5th and 10th
century did not differ from other Italian locations of the same time [13]. Few shapes
were observed and they did not display any significant morphological changes
throughout the high Middle Ages. Among the glass findings, there were remains of
lamps, bottles, glasses, stem glasses, bowls and unguentaria. More precisely, there
were: 5 wine glass stems, 22 stem glasses, 8 bottles, 11 lamps, 1 glass, 1 bowl and 1
unguentarium. It is interesting to note that all wine glass stems were from the
Donoratico site, of those, four were smooth whereas one was ‘twisted’ (tortile). Of the
8 bottles examined, four displayed a stem-less and slightly indented bottom, two
display one side with globular ring, one has an outward flaring border and one with
stemless bottom and the beginning of a globular ring along one of the sides. Of the 11
lamps found in Santa Maria della Scala, 3 were conical with drop shaped bottom, four
were Isings 134 style glass, two have a ‘band border’, one is an Uboldi IV.2 and
another an Uboldi II.2.
Isings 134 type lamp: this was a popular lamp in the East during the Roman and
late Roman period. It is thought that these lamps may have been produced even in
the Western world as imitation of the original Eastern prototypes. It has been found in
Italy from the middle of the IV century (Siracusa, Vignia Cassia) right through to the

58
late Middle Ages. According to Dr. Isings, this type of lamp was diffused only in
Southern Italy up to Rome but in light of the new findings in stratigraphic layers, they
have been found also in central and northern Italy [20].
Isings 134: this type is characterised by a truncated cone shape or flared and one
edge is thicker or ring-like, to which are hot applied three small handles vertically. 8
small handles were attributed to this type, although none belonging to the same
object. The pinched handle, due to its shape, may be closer to the Uboldi I.3. Dated
between 4th and 7th cent. A.D. [21]
Uboldi II.2 – Isings 106d – Karanis VI.A types: this type differs from the Isings
106b/c type in its markedly conical bottom, which does not guarantee a stable
support, but may only be placed on a ring element in a polycandelon. Dated between
4th and 6th cent. A.D. [21]
Uboldi IV.2: this type is characterised by a hollow appendix and hemispherical and
truncated cone shaped belly; it is rather common in northern Italy between 6th and
8th cent. [21]
The glasses of this study are in good preservation conditions. Some samples display a
thin oxidative layer on the surface; such layer is not bonded to the underlying glass
and flakes off with a light touch. This kind of degradation are fundamentally due to
the effect of water that, acting both as a solvent and a carrier (vehicle for other
degrading substances), represents by far the most aggressive agent of decay [11].
The archaeological glassware described has different shapes and sizes. The glassware
found in the Donoratico site, being mostly wine glass stems, all display a long
cylindrical shape. Four of those (1,2,3,4) are between 2.5 to 4.5 cm in length and a
diameter measuring between 8 and 12 mm. Sample 5 is slightly different: it is the
only one with a twisted stem and measures 0.6 cm in length and 11 mm in diameter.
As regards the findings in Santa Maria della Scala, it is more difficult to calculate an
average size for the glassware. This is due to the large sample size, forty-four, and
their differing shapes and sizes.
The table below (Table 3.1 and Table 3.2) outlines the main characteristics of the
findings.

59
SAMPLE SHAPE COLOUR N. INV. DATING KIND
DATING CONTEXT
1 Stem smooth chalice
Light green 7160.1
11th-12th 9th-10th
2 Stem smooth chalice
Light green 10599.4 11th-12th 9th-10th
3 Stem smooth chalice
Green 10599.5
11th-12th 9th-10th
4 Stem smooth chalice
Not id.
10599.6 11th-12th 9th-10th
5
Stem tortile chalice
colorless 10757.2 11th-12th 9th-10th
Table 4.1 - Main characteristic of the glass from Donoratico.
SAMPLE SHAPE COLOUR N.INV DATING KIND
DATING CONTEXT
LEO1 Cup with filaments
Yellow/brown 3025.26 7th 6th-7th
LEO2 Glass Color less 3027.01 5th 6th-7th
LEO3 Bottle Colorless 3059.5 5th-7th 7th
LEO4 Bottle Light green 3118.1 5th-6th 7th
LEO5 Chalice Color less 3118.4 6th-8th 7th
LEO6 Chalice with filaments
Light green 4208.1 6th-7th 7th-8th
LEO7
Lamp Light green 4226.1 6th-7th 6th-7th
LEO8 Lamp Colorless 4231.1 6th-7th 6th-7th

60
LEO9 Chalice colorless 4119.1 6th-7th n. id.
LEO10 Chalice Light green 4138.1 6th-7th 9th
LEO11
Chalice Water green 4148.2 6th-7th 9th
LEO12 Chalice Light green 4155.1 6th-7th 9th
LEO13 Chalice Colorless 4170.1 6th-7th 9th
LEO14 Lamp Green 4190.1 6th-7th 7th-8th
LEO15 Lamp Water green 6162.1 6th-7th 7th
LEO16 Chalice Light green 6162.3 6th-7th 7th
LEO17 Chalice Light yellow 6217.1 6th-7th 7th-8th
LEO18 Chalice Colorless 6171.1 6th-7th 9th
LEO19 Lamp Light green 6235.2 5th-6th 7th
LEO20 Lamp Light green 6165.1 6th-7th 9th
LEO21 Bottle Green 10001.1 6th-7th n.id
LEO22 Bottle Sky blue 10007.2 6th-7th VII-VIII
LEO23 Bottle Dark yellow 10007.4 6th-7th 7th-8th
LEO24 chalice Green 10036.2 6th-7th n. id.

61
LEO25 Toilet Light green 10044.5 V VII-VIII
LEO26 Chalice Light green 10050.2 VI-VIII VII-VIII
LEO27 Chalice Water green 10134.1 VI-VIII n. id.
LEO28 Lamp Light green 10163.1 V-VI VII-VIII
LEO29 Chalice with filaments
Colorless 10165.1 VI-VIII VII-VIII
LEO30 Chalice Light water green 10179.1 VI-VIII VII
LEO31 Chalice Olive green 10199.1 VI-VIII VI-VII
LEO32 Chalice Light yellow 10199.2 VI-VIII VI-VII
LEO33 Chalice Light green 13243.1 X-XI X-XI
LEO34 Chalice Light green 13261.1 X-XI X-XI
LEO35 Bottle Green 13297.2 V-VI VII-VIII
LEO36 Lamp Olive green 13315.1 VI-VII VII-VIII
LE037 Bottle Yellow/green 13385.2 V-VI VII
LEO38 Lamp Light water green 13407.1 VI-VII VII
LEO39 Chalice Light green 17030.1 VI-VIII V-VI
LEO40 Bottle Light green 17030.5 V-VI V-VI

62
LEO41 Chalice Water green 17046.2 VI-VIII V-VI
LEO42 Lamp Colorless 30174.1 VI-VII n. id.
LEO43 Bottle Water green 39015.1 V-VI V-VI
LEO44 Chalice Light green 39015.2 VI-VIII V-VI
Table 4.2 - Main characteristic of the glasses from Santa Maria dell Scala

63
4.2 MAIN RESULTS
The results from LA-ICP-MS made it possible to make a first distinction of the
glassware, that is, to distinguish between the main, minor and trace components
present in the analysed glasses.
The use of binary and ternary graphs has highlighted the characteristics of the glass
composition, making it possible to divide the fragments into subgroups. Furthermore,
the above-mentioned graphs proved of primary importance in the comparison
between the glassware examined in this study and other Roman age archaeological
glassware found in Italy, Europe and other Mediterranean Countries.
Figure 4.1 - Ternary plot of the normalized Na2O, MgO+K2O and CaO contents in the San Genesio glass finds; the normalization was done against the sum of the Na2O, MgO+K2O and CaO contents. The four main groups of historical glass are evidenced by the ellipses and triangle: (1) mineral silica- soda-lime glass typical of the 1st millennium BC-1st millennium AD; (2) vegetable silica-soda-lime glass of the medieval period; (3) mixed alkali glass of late Bronze Age and post-medieval period; (4) potash glass of the medieval period.
Na2O* (MgO+K2O)*
CaO* 0
0
0 100
100
100
1
2
3
4

64
The ternary graph above displays normalised concentrations of Na2O, CaO and
MgO+K2O of our archaeological glassware samples. This graph enabled the
classification of the glassware findings according to their "basic source", they can
hence be divided into four major groups: (1) mineral silica-soda-lime-glass common
glass of the 1st millennium BC – 1st millennium AD and the modern era, (2) vegetable
silica-soda-lime ash glass typical of the medieval period, (3) mixed alkali glass of late
Bronze Age and post-medieval period and (4) the potash glass of the medieval and
post medieval period. As may be easily observed from the graph, all glassware found
in the Donoratico and Santa Maria della Scala sites were mineral silica-soda-lime
glasses. This glass type is characterised by high Na values and low K and Mg values.
This is due to the use of Natron (Na2CO3 10H2O) and not vegetable ashes as fusing
agent, which would be otherwise rich in potash and magnesium oxides. In fact,
amounts of K20<1% and MgO<1,5% in the glassware are to be considered as
impurities. Natron is a Sodium sesquicarbonate (or sodium carbonate decahydrate)
and forms from slow evaporation of sodium rich waters. Its name may also be linked
to its ancient extraction source: the Wadi Natrun, a seasonal Egyptian lake located
between Alexandria and Cairo [12]. This type of glass is among the most commonly
found in the Roman and Byzantine periods. Natron was used approximately from the
eighteenth century B.C. to the eighteenth century A.D. and was the only fusing
substance used by the Romans. Natron was used as fusing agent thanks to its sodium
content, which lowered the fusing temperature of silica thus making it much easier to
work the glass. Furthermore, soda "lengthens" the hardening phase allowing more
time for craftsmen to work the glass. It is important to remember that a lower fusing
temperature was appreciated, as the technological advancements of the time hardly
allowed for the construction of furnaces able to reach the fusion temperature of pure
silica. Craftsmen of the time were knowledgeable enough to know the right amount of
soda: a surplus of the latter may have rendered the glass too sensitive to water and
carbon dioxide, two of the main degrading agents for glassware.

65
Figure 4.2 - K vs Mg contents (% w/w)
The graph (Figure 4.2) above confirms the results of the ternary graph: all glassware
analysed displayed values for K<0,84 and for Mg<1,30 and hence fall within the range
of Natron glasses. It should be noted that glassware belonging to the HFe subgroup
distinctly separate from the others as their magnesium oxide values are among the
highest whereas their potash values are among the lowest.
0,00
0,10
0,20
0,30
0,40
0,50
0,60
0,70
0,80
0,90
0,200 0,300 0,400 0,500 0,600 0,700 0,800 0,900 1,000 1,100 1,200 1,300 1,400 1,500
K2O
MgO
K vs Mg
HFe
HPb
LowPb

66
Figure 4.3 - Ca vs Na contents (% w/w) <Is this Ca, Na or CaO vs. Na2O, as in Fig 4.2 ? >
Figure 4.3 displays the "compactness" of the glassware with regard to Na and Ca. The
total average Ca content in the glassware is approximately 6.5 %. This value is in line
with those of Roman type glassware. As previously mentioned in chapter 1, calcium is
a typical stabiliser in glass. Large amounts of soda present in Roman glass made them
vulnerable to atmospheric agents. One of the most common phenomena is that of
leaching: an acid or basic aqueous solution may interact with the surface layers of the
glass, thus depleting it of its mobile metal ions and leaving only the silicic network
skeleton. This impoverishment leads to the formation of various micro-layers of
hydrated silica which partially reflect visible light giving rise to interference
phenomena; these create a shiny iridescent surface effect. Calcium provides
resistance both to water as well as to glass even if it makes it harder to work. It was
introduced in the vitreous mix in the form of impurity in sand (due to seashells) in the
case of Natron glass, and in the form of ash for other glass types; up until now no
evidence has been proven of the voluntary addition of CaCO3 from calcite or
marble/limestone [3]. It is for this reason that the ancient craftsmen did not refine
sand too much: the benefits of the process may have been nullified by an easily
degradable glass caused by a mixture lacking the necessary stabilisers.
00
02
04
06
08
10
12
0,00 5,00 10,00 15,00 20,00 25,00
Ca
Na
Ca vs Na
HFe
HPb
LowPb

67
Figure 4.4 - Mn vs Fe contents (% w/w)
Group Mn Fe
HFe 1.96 2.32
HPb 0.62 0.79
LowPb 0.65 0.48
Table 4.3 - Average amounts of MnO and Fe2O3 (% w/w).
Figure 4.4 displays the manganese and iron contents of the glass.
Values for Mn<1 and for Fe<1.5 are to be attributed to normal impurities of sand.
Differently, high Mn values may refer to an involuntary introduction of the latter; in
this case manganese may be used as a decolouring agent or, if present in larger
amounts, as a colouring agent capable of giving glass a purple colour. Differently,
high Mn values may in any case indicate the systematic presence of Mn in raw glass,
as in the case of HIMT. Iron however, may create blue, yellow or green colours
depending on its oxidation state.
As may be observed from Table 4.3 and Figure 4.4 glassware belonging to the HFe
0,00
0,50
1,00
1,50
2,00
2,50
0,000 0,500 1,000 1,500 2,000 2,500 3,000 3,500 4,000 4,500
MnO
Fe2O3
Mn vs Fe
HFe
HPb
"LowPb"

68
group (samples LEO23, LEO31, LEO36, LEO37, LEO39) were characterised by high Mn
and Fe amounts. This suggests that they must not have been voluntarily added but
rather are systematically present in raw glass as in the case of HIMT.
The situation changes when looking at glassware belonging to HPb and LowPb groups,
which Mn and Fe values that may be attributed to normal amounts present in the sand
used by master glass-workers. Samples LEO9 and LEO13 are worthy of mention as
they present Mn and Fe values as shown below:
Sample MnO Fe2O3
LEO9 1.6 0.9
LEO13 1.2 0.5
Table 4.4- Amount of MnO and Fe2O3 of the LEO9 and LEO13 samples (% w/w).
These two samples display high Mn values and low Fe values and glasses are
colourless: probably in this specific case manganese was deliberately added as a
decolouring agent [22]. All the other samples are green, yellow or brown whereas no
blue glasses were identified.
All other glasses display marked differences in their Mn and Fe contents. There are
samples with very low values for both elements (A3, LEO1, LEO2, LEO5, LEO8, LEO18,
LEO42, LEO43) whereas others have more significant values (LEO10, LEO17, LEO19,
LEO32, LEO38). In particular, samples LEO2, LEO5, LEO8, LEO18 and LEO42 are
colourless. Lacking other decolouring substances, this coloration must have been
obtained using very pure sands or from the purification of the sand itself prior to the
fusion process.
This suggests that the master glass-workers may have used different sands to make
these glasses, sands with differing purity gradients, or that they may have purified the
sand prior to the fusion process.

69
Figure 4.5 - Cu vs Pb contents (% w/w) <oxides or elements ?>
Figure 4.5 clearly shows that the HPb samples display a significant amount of Pb and
Cu. This graph will be analysed later, in the coloured compounds section.
Thanks to the results of this graph it was possible to divide the 49 glass findings into 3
subgroups: High Iron (HFe), High Lead (HPb) and Low Lead (LowPb). This division is
based solely on the composition characteristics of the findings and does not consider
their origin. Below are reported the main characteristics of the different groups:
- High Iron Group (HFe): this group is characterised by high percentages of Fe (2-
3%), Mn (2%) and Ti (0,4%); compared to the other groups, it displays high contents
of Al (3%), Na (18%) and Mg (1%) and a low Ca (5%) content. It is the group with
the smallest samples size (5).
The following samples belong to this group: LEO23, LEO31, LEO36, LEO37, LE039.
- High Lead Group (HPb): this group displays high Pb, Cu, Sn and amounts. Its
characteristics are similar to those of the HFe group, with the exception of a smaller
0,000
0,100
0,200
0,300
0,400
0,500
0,600
0,700
0,800
0,000 0,500 1,000 1,500 2,000 2,500
Cu
Pb
Cu vs Pb
HFe
HPb
LowPb

70
percentage of Fe, Mn and Ti.
This group includes 10 samples. The following samples belong to this group: 1, 2, 5,
LEO6, LEO12, LEO21, LEO24, LEO27, LEO33, LEO35.
- Low Lead Group (LowPb): this group displays a high Ca (7%) content and a low
percentage of Fe, Mn, Ti, Mg, Cu and Pb. It is the group with the largest sample size
(34).
The following samples belong to this group: 3, 4, LEO1, LEO2, LEO3, LEO4, LEO5,
LEO7, LEO8, LEO10, LEO9, LEO11, LEO13, LEO14, LEO15, LEO16, LEO17,
LEO18, LEO19, LEO20, LEO22, LEO26, LEO28, LEO29, LEO30, LEO32, LEO38,
LEO41, LEO43, LEO44.

71
4.3 COLOURING AGENTS
Figure 4.5 - Cu vs Pb contents (% w/w) <oxides ?>
As shown in the previous paragraph, this graph demonstrates that only glassware
belonging to the HPb group report high copper and lead amounts whereas in the other
2 groups these elements are found in irrelevant amounts.
Copper is the most common colouring agent for glass; it creates shades ranging from
blue to green depending on the oxidation state. With regard to the samples in the HPb
group, the amount of copper varies from 0.03 to 0.7%. A correlation between the
concentration of cooper and lead may be observed in Figure 4.5. Lead provides glass
with a number of different qualities: it is a melting agent (it lowers fusion
temperature), it increases glass brilliance (Pb increases glass refraction index) and
decreases hardness (making it easier to be cut) [11].
In Roman times, it was common practice to introduce in the fusing mix some flakes
from bronze alloys to create different colouring shades; this has already been
observed in glassware found in Pompei.
When analysing the Pb:Cu ratio, it is noteworthy to point out that for the glassware
examined, there are two different Pb:Cu ratios: 1.3 and 2.5 respectively. It is
0,000
0,100
0,200
0,300
0,400
0,500
0,600
0,700
0,800
0,000 0,500 1,000 1,500 2,000 2,500
Cu
Pb
Cu vs Pb
HFe
HPb
LowPb
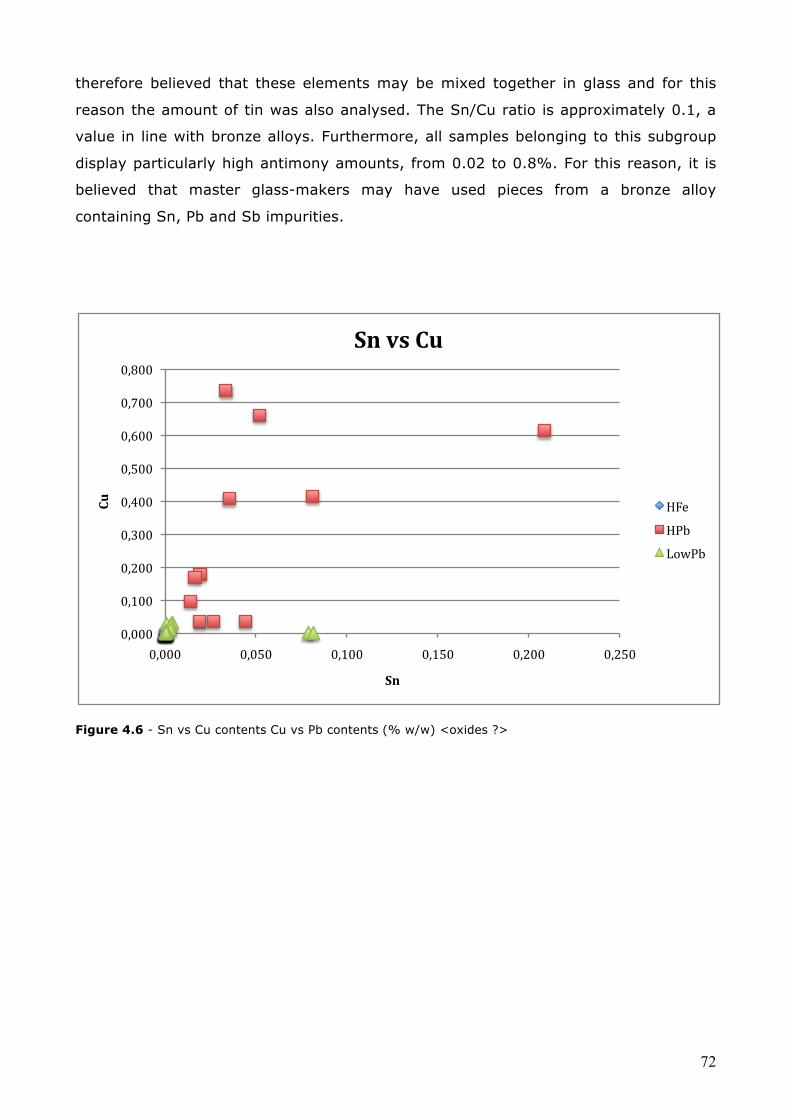
72
therefore believed that these elements may be mixed together in glass and for this
reason the amount of tin was also analysed. The Sn/Cu ratio is approximately 0.1, a
value in line with bronze alloys. Furthermore, all samples belonging to this subgroup
display particularly high antimony amounts, from 0.02 to 0.8%. For this reason, it is
believed that master glass-makers may have used pieces from a bronze alloy
containing Sn, Pb and Sb impurities.
Figure 4.6 - Sn vs Cu contents Cu vs Pb contents (% w/w) <oxides ?>
0,000
0,100
0,200
0,300
0,400
0,500
0,600
0,700
0,800
0,000 0,050 0,100 0,150 0,200 0,250
Cu
Sn
Sn vs Cu
HFe
HPb
LowPb

73
Figure 4.7 - Sn vs Pb contents Cu vs Pb contents (% w/w)
Figure 4.6 show the correlation between Pb-Cu-Sn: Figure 4.6 is very similar to Figure
4.5. Moreover, from the Sn/Pb graph, the direct correlation between lead and tin may
be clearly observed.
These two graphs seem to confirm the theory that the two elements may have been
added to the glass in the form of a bronze alloy.
However, such high amounts may be linked also the re-use of left over pieces of
coloured or opaque glasses. Furthermore, antimony may have been intentionally
added to increase glass opacity and not attributable exclusively to bronze alloy
impurities.
LEO1, LEO6 and LEO29 samples present a whitish filamentous opacity. During the
Roman period, antimony was often added to the mix to confer an opaque look.
Opacity of the glass was obtained by precipitating compounds containing Sb2O5 in the
glass matrix. More precisely, glass opacity was caused by the phenomenon of
diffusion of incident radiation, generated between the glass and solid inclusions or air
bubbles present in the glass itself. In the case of silica-soda-lime glass the main
antimony compounds used as opacifying agents are calcium antimony oxides, in the
0,000
0,050
0,100
0,150
0,200
0,250
0,000 0,500 1,000 1,500 2,000 2,500
Sn
Pb
Sn vs Pb
HFe
HPb
LowPb

74
following two forms Ca2Sb2O7 or CaSb2O6, whereas should the samples have been of
lead glasses, bindheimite (yellow) would have been used, PbxSb2-z(O,OH,H20). It is
assumed that the mineral from which antimony was originally obtained was stibnite
Sb2S3.
Due to lack of time it was impossible to carry our XRD or XRD analyses, which would
have proven the type of opacifying agent used.

75
4.4 TRACE ELEMENTS
The analysis of trace elements found in archaeological glass is very important as it
provides essential information for the identification of the raw materials used in the
formation of glass as well as a valid contribution in understanding of the recycling
value of ancient glass.
Table 4.5 outlines the standard deviation and strontium content in each of the three
groups, as may be easily observed, the amount is fairly constant. Such a high
strontium value, suggests the use of coastal sands as silica sources. This is due to the
fact that strontium is easily incorporated in aragonite, a sedimentary mineral whose
main component is CaCO3 [23]. This mineral is incorporated in the hard parts of
marine organisms, such as molluscs’ shells or cnidarian skeletons (corals). Freestone
et al (2003) reports high Sr values around 300 µg/g, referring to coastal sands
whereas values between 100 and 200 µg/g refer to a limestone-bearing sand.
Group Sr
HFe 570 ± 50
HPb 545 ± 100
LowPb 530 ± 120
Table 4.5 - Average and standard deviation on the Sr (in μg/g).
Even Ba values are important in determining where the sand comes from. The values
outlined in Table 4.6 refer to alkali-feldspar rich sands, a mineral which is introduced
as impurity in the sand together with aluminium. This explains the correlation
between the amounts of these elements [3].
Group Ba
HFe 560 ± 300
HPb 380 ± 85
LowPb 290 ± 120
Table 4.6 - Average and standard deviation of the Ba (in μg/g)..
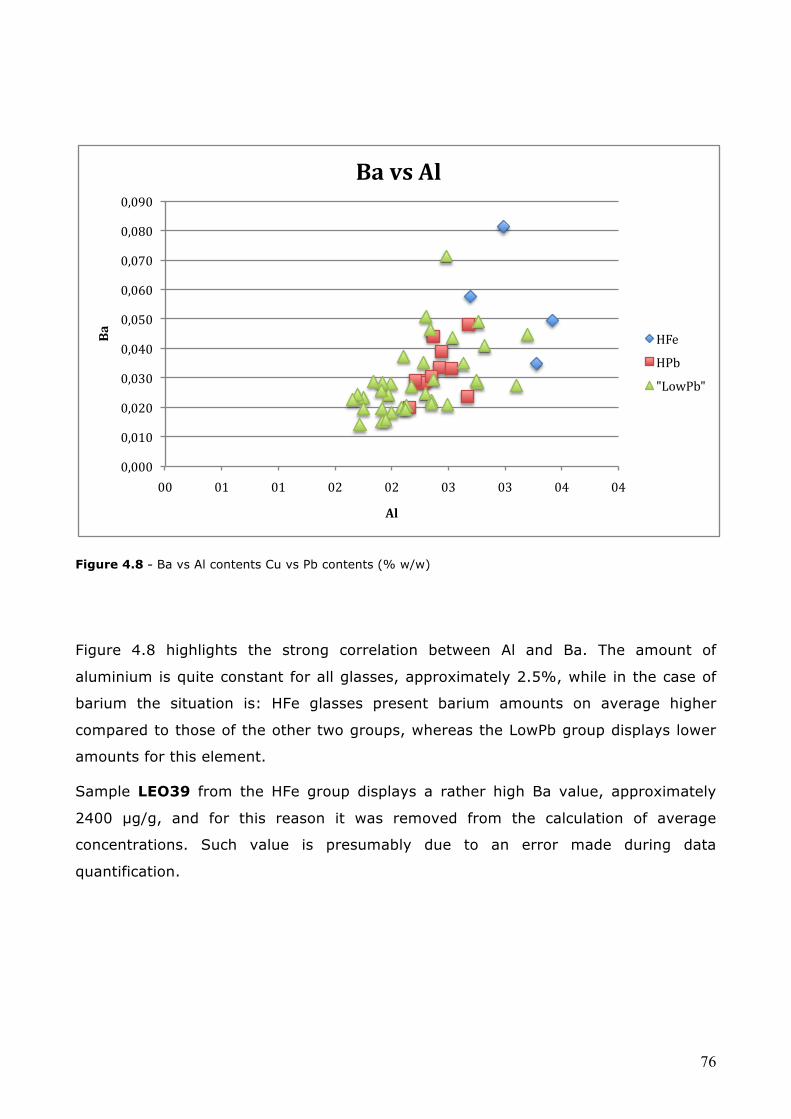
76
Figure 4.8 - Ba vs Al contents Cu vs Pb contents (% w/w)
Figure 4.8 highlights the strong correlation between Al and Ba. The amount of
aluminium is quite constant for all glasses, approximately 2.5%, while in the case of
barium the situation is: HFe glasses present barium amounts on average higher
compared to those of the other two groups, whereas the LowPb group displays lower
amounts for this element.
Sample LEO39 from the HFe group displays a rather high Ba value, approximately
2400 µg/g, and for this reason it was removed from the calculation of average
concentrations. Such value is presumably due to an error made during data
quantification.
0,000
0,010
0,020
0,030
0,040
0,050
0,060
0,070
0,080
0,090
00 01 01 02 02 03 03 04 04
Ba
Al
Ba vs Al
HFe
HPb
"LowPb"
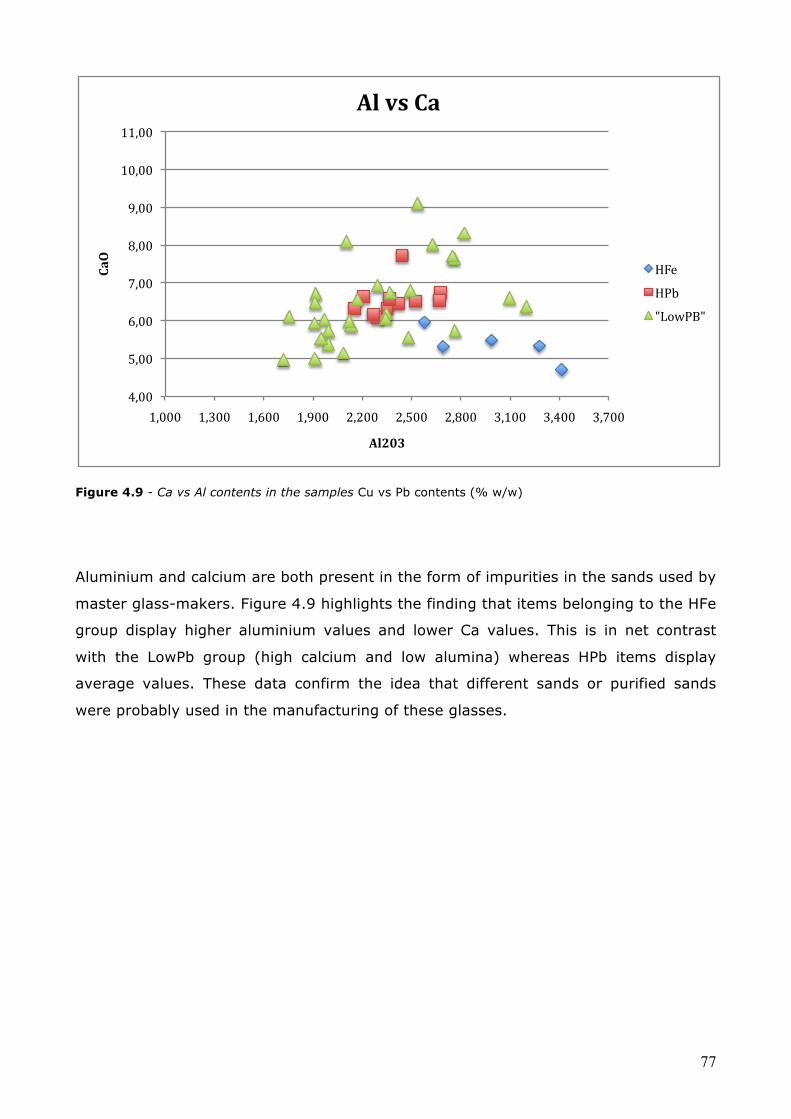
77
Figure 4.9 - Ca vs Al contents in the samples Cu vs Pb contents (% w/w)
Aluminium and calcium are both present in the form of impurities in the sands used by
master glass-makers. Figure 4.9 highlights the finding that items belonging to the HFe
group display higher aluminium values and lower Ca values. This is in net contrast
with the LowPb group (high calcium and low alumina) whereas HPb items display
average values. These data confirm the idea that different sands or purified sands
were probably used in the manufacturing of these glasses.
4,00
5,00
6,00
7,00
8,00
9,00
10,00
11,00
1,000 1,300 1,600 1,900 2,200 2,500 2,800 3,100 3,400 3,700
CaO
Al203
Al vs Ca
HFe
HPb
"LowPB"

78
To further understand the origin of the raw materials used and in this case especially
to identify the origin of the sand, levels of Ti, Zr and Hf were measured. Titanium and
zircon are typical sand impurities, they are found respectively in ilmenite and
Zirconium. Hafnium is an accessory element to zirconium, it is always found in
zirconium compounds and in nature it does not exist as a free element. Low values of
the abovementioned elements in the glass composition suggest the use of pure sands.
Figure 4.10 - Ti vs Zn contents in the samples Cu vs Pb contents (% w/w)
0,000
0,100
0,200
0,300
0,400
0,500
0,600
0,700
0,0000 0,0050 0,0100 0,0150 0,0200 0,0250 0,0300 0,0350 0,0400 0,0450 0,0500
Ti
Zr
Ti vs Zr
HFe
HPb
LowPb

79
Figure 4.11 – Hf vs Zr contents in the samples Cu vs Pb contents (% w/w).
Figure 4.10 displays the relationship between titanium and zirconium. It is
immediately evident that HFe group presents the highest values for those two
elements, suggesting the use of not so pure sands. It is not accidental that HFe
glasses display colours varying between yellow and green, colours which are easily
obtained from very impure sands. On the contrary, LowPb items display lower
concentrations for these elements, suggesting the use of an even purer sand for those
glasses. From the Ti and Zr values it may be inferred that two different sands were
used in the glasses found in the Santa Maria della Scala and Donoratico sites. HPb
glasses however, stand right in the middle: this is probably due to the use of cullet
(scraps of broken glass) in the production of glass.
Figure 4.11 displays a comparison between the amounts of zirconium and hafnium. It
should be noted that hafnium is an accessory element to zirconium and hence their
amounts are strictly correlated. This graph confirms what stated above: on average,
the HFe items display higher values for those elements than do LowPb items.
0,0000
0,0002
0,0004
0,0006
0,0008
0,0010
0,0012
0,0000 0,0050 0,0100 0,0150 0,0200 0,0250 0,0300 0,0350 0,0400 0,0450 0,0500
Hf
Zr
Zr vs Hf
HFe
HPb
"LowPb"

80
Group Ti Zr
HFe 0.45 0.2
HPb 0.10 0.01
LowPb 0.07 0.01
Table 4.7- Average of Ti and Zr (% w/w).
Table 4.7 outlines the average percentage values per weight for chlorine, sulphur and
phosphorus. High Cl values (Cl>1 wt%) and S (approx. 0.2 wt%) refer to the use of
natron. Sodium chloride NaCl, and sodium sulphate Na2SO4 compounds, are often
present in natron, in various proportions as contaminants [24].
Additionally, even low P values, generally P<0.15 w%, are to be attributed to the use
of natron [24].
In summary, the values displayed for these elements confirm once again the use of
natron as a source of sodium in the Donoratico and Santa Maria della Scala glassware.
Group Cl S P
HFe 1.90 0.14 0.08
HPb 1.98 0.26 0.09
LowPb 2.31 0.16 0.05
Table 4.8 - Average of Cl, S and P (% w/w).
This last diagram is a trace element Earth-crust normalized plot. As may be easily
inferred, the various groups display the same trend, with large amounts of Sr and low
amounts for all the other crust elements. This may imply the use of a relatively pure
sand, and suggests the use of a Sr rich coastal sand (high incidence of aragonite –
shells).

81
Figure 4.12 – Trace element Earth-crust normalized plot. The elements are respectively Ti, V, Rb, Sr, Y, Zr, Ba, La, Ce, Hf.
0
10
20
30
40
50
60
70
80
0.000 0.002 0.004 0.006 0.008 0.010 0.012
HFe
HPb
LowPb

82
CHAPTER 5
COMPARISON OF GLASSES

83
5.1 COMPARISON BETWEEN ROMAN AND MEDIEVAL GLASSES The major oxides composition for glasses collected from the Donoratico and Santa
Maria della Scala sites were comparable with typical Roman glassware of the same
period. The following table shows the percentage of sodium, calcium, potassium and
magnesium in the glass objects evaluated in this study and those studied by Cagno
2011 (San Genesio, Tuscany) [26], Foy et al. 2003 (centre and south of France,
Tunis and Egypt) [27] and Freestone et al. 1994 (Carthage) [28].
Donoratico and
Santa Maria Scala Cagno Foy et al.
(Group 2) Foy et al. (Group 3)
Freestone et al.
Na2O (w%)
17.65 18.90 18.37 16.77 17.9
CaO (w%)
6.53 7.10 7.73 7.81 6.9
K2O (w%)
0.39 0.60 0.79 0.55 0.5
MgO (w%)
0.64 0.90 1.2 0.62 1.1
Table 5.1 - comparison between the major oxides of Roman glasses collected in various parts of the Empire
The glasses examined in this study were probably produced (as crude glass) in the
Middle East (Palestine or Egypt) and then sent to Europe (Spain or Greece), where
they were re-molten for the second time. Finally, when they arrived in Italy, glasses
were worked to obtain their final shape.

84
As already mentioned in the previous chapters, glasses analysed in this study are
different from the medieval ones, whose melting agent was plant ash, and not natron,
which was instead used in Roman glasses. Plant ash glasses have higher amounts of K
and Mg than Roman glasses: quantities of K>1 (w%) and Mg>1.5 (w%) are usually
attributed to the use of ash as the melting agent, and not as an impurity.
The following table (Table 5.2) shows the values for magnesium and potassium in the
glasses of this study and in the medieval ones studied by Cagno 2011 (San Genesio,
Tuscany) [26] and by Brill 1999 (Montfort, France) [29].
Donoratico and Santa Maria della
Scala
Cagno Brill
K2O (w%) 0.4 3.1 3.4
MgO (w%) 0.6 2.1 2.5
Table 5.2 - Comparison between K and Mg amounts in glasses from the current study and Medieval ones.

85
5.2 “HIMT” AND “LEVANTINE” GLASSES
Many studies have been made on archaeological glasses of the Roman age. As for the
late ancient period, the most part of Roman glasses were characterised by two
different compositions, namely “HIMT” and “Levantine”, both presumably coming from
the Middle East or Egypt.
Freestone et al. and Foy et al. (e.g. Freestone et al. 2000 [25], 2002 [23]; Foy et al.
2003 [27]) were the first to classify these two large Roman glass “classes” from the
4th century AD to the 11th century AD:
– HIMT are glasses characterised by high amounts of iron (Fe>0,7%), manganese
(about 1-2%) and titanium (Ti>0.1%). This type of glass displays a strong correlation
between iron and titanium, but a weaker one between iron and manganese. They are
also characterised by high amounts of sodium (about 18-19%), magnesium (usually
>0.8%) and calcium (about 6%): their coloration is usually yellow or green, thanks to
the high quantities of iron in the form of impurities. This suggests the use of not-very-
pure sands that may come from the near East, presumably Egypt.
– Levantine 1, this type of glass is characterised by small amounts of sodium
(about 15%) and iron (usually 0.4%), but large amounts of calcium (about 9%) and
aluminium (about 3%). A purer sand than that of HIMT has been preferred for this
kind of glasses. It presumably comes from the Syrian-Palestinian region, maybe on or
near the mouth of the Belus River (Levantine coast)
Both these types of glass have been largely found throughout the Roman Empire.
Fe Mn Ti Na Mg Ca
> 0.7% ~ 1.2% 0.1% ~ 18-19% 0.8% 6%
Table 5.3 - Typical HIMT glass composition:

86
Fe Al Na Ca
~ 0.4% 3% ~ 15% 9%
Table 5.4 – Typical Levantine 1 glass composition
Figure 5.1 and 5.2 show the relation between iron and titanium and between iron and
manganese for “HIMT” glasses. These are all samples from the Roman Age. The graph
below shows the “Leo Hfe” samples (samples from this study belonging to in HFe
group); SG2a and SG2b (Cagno, 2001) [26]; “HIMT 1” and “HIMT 2” (Foster and
Jackson 2008) [30]
Figure 5.1 – Fe vs Ti contents (% w/w)
Fe
Ti
Fe vs Ti
Leo HFe
SG2a
SG2b
HIMT 1
HIMT 2

87
Figure 5.2 – Fe vs Mn contents (% w/w)
Samples from the HFe group are classified as HIMT: samples from this group have a
similar composition to those glasses classified as HIMT by Foy 2003 (Group 1) [27]
and Arletti 2009 [30]. Table 5.5 shows the values of the main elements constituting
these glasses.
Arletti HFe Group 1 (Foy)
Na 18 ± 1 18.01 ± 1.43 19.1 ± 1.3
Mg 1.2 ± 1 1.1 ± 0.1 1.2 ± 0.2
Al 3.3 ± 0.2 2.9 ± 0.3 2.9 ± 0.3
Si 65.3 ± 0.3 65.1 ± 1.5 64.5 ± 1.4
K 0.6 ± 0.2 0.3 ± 0.04 0.4 ± 0.12
Ca 6.3 ± 0.4 5.4 ± 0.5 6.2 ± 0.8
Mn 2.1 ± 0.3 2 ± 0.3 2 ± 0.4
Fe
Mn
Fe vs Mn
HFe
SG2a
SG2b
HIMT 1
HIMT 2
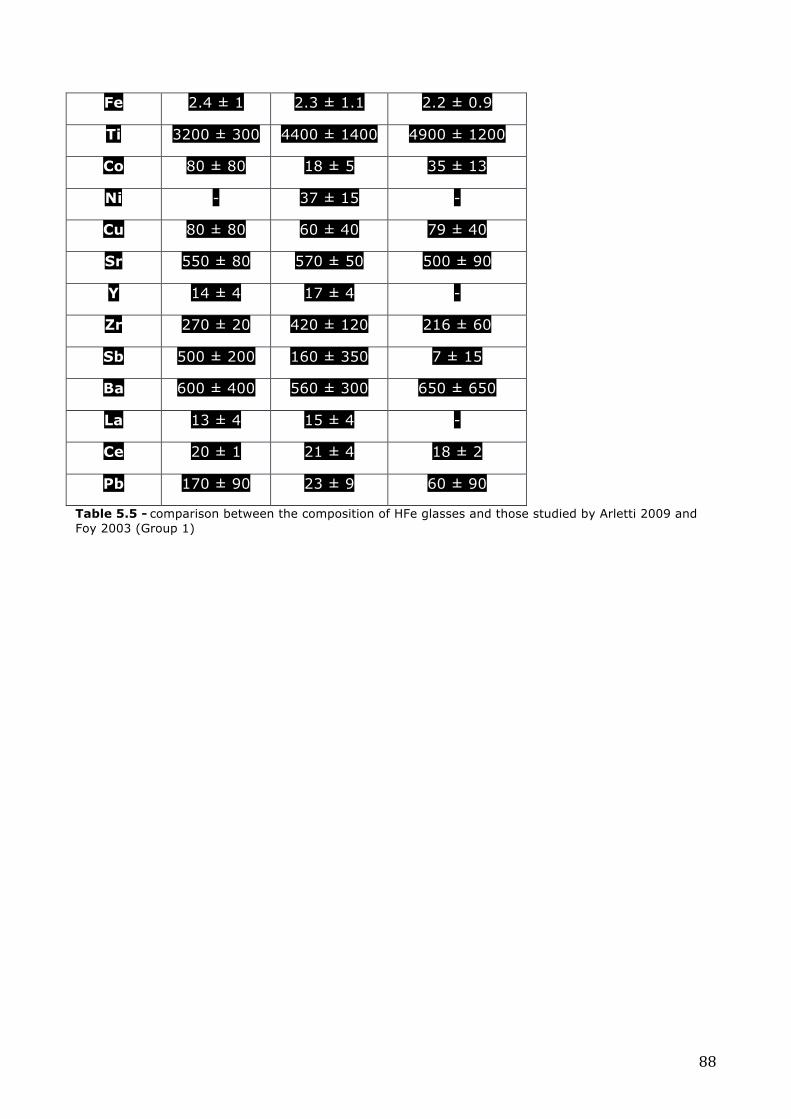
88
Fe 2.4 ± 1 2.3 ± 1.1 2.2 ± 0.9
Ti 3200 ± 300 4400 ± 1400 4900 ± 1200
Co 80 ± 80 18 ± 5 35 ± 13
Ni - 37 ± 15 -
Cu 80 ± 80 60 ± 40 79 ± 40
Sr 550 ± 80 570 ± 50 500 ± 90
Y 14 ± 4 17 ± 4 -
Zr 270 ± 20 420 ± 120 216 ± 60
Sb 500 ± 200 160 ± 350 7 ± 15
Ba 600 ± 400 560 ± 300 650 ± 650
La 13 ± 4 15 ± 4 -
Ce 20 ± 1 21 ± 4 18 ± 2
Pb 170 ± 90 23 ± 9 60 ± 90
Table 5.5 - comparison between the composition of HFe glasses and those studied by Arletti 2009 and Foy 2003 (Group 1)

89
Samples from the HPb group have a similar composition to those studied by Cagno
2011 (SG1a) [26] and those analysed by Foster and Jackson (2008) [31]. The
quality of the glass observed in these samples has been classified as HIMT 2: HIMT 2
glasses have the same HIMT features, but with lower quantities of iron, titanium,
manganese and some other trace elements.
In the classification of HPb samples, the large amounts of copper, lead, tin and
antimony have been ignored: these elements may have been added to the vitreous
matrix to give glass a peculiar colouring (in this case a green shade).
Much like for glasses from San Genesio (Tuscany, Italy) studied by Cagno 2011 (more
precisely the SG1a group), these elements are thought to have been added through a
copper alloy with antimony impurities or through pieces of cullet containing these
elements.
Figure 5.3 and 5.4 show the relation between Fe and Mn and between Fe and Ti. The
samples in the graphs are part of the HPb group of this study, of the SG1 group
studied by Cagno (2011) and of the HIMT 2 group analysed by Foster and Jackson
2008. Table 5.6 compares the compositions of glasses from the HPb group with those
studied by Cagno 2011 (SG1a) and those by Foster and Jackson 2008.

90
Figure 5.3 – Fe vs Mn contents (% w/w)
Figure 5.4 - Fe vs Ti contents (% w/w)
Fe
Mn
Mn vs Fe
HPb
SG-‐1a
SG-‐1b
HIMT 2
Fe
Ti
Fe vs Ti
HPb
SG-‐1a
SG-‐1b
HIMT 2

91
SG1a HIMT 2 HPb
Na 18.4 ± 0.5 20 ± 1 17.1 ± 0.4
Mg 0.7 ± 0.1 0.8 ± 0.1 0.7 ± 0.2
Al 2.2 ± 0.3 2.3 ± 0.3 2.4 ± 0.2
Si 66 ± 1 - 67 ± 1.2
K 0.7 ± 0.1 0.6 ± 0.1 0.5 ± 0.1
Ca 6.7 ± 0.5 6.0 ± 0.6 6.6 ± 0.4
Mn 0.6 ± 0.2 1.0 ± 0.3 0.6 ± 0.3
Fe 1.0 ± 0.2 1.4 ± 0.3 0.8 ±0.1
Ti 640 ± 50 700 ± 100 1000 ± 200
Co 50 ± 30 4 ± 2 45 ± 37
Ni 15 ± 7 12 ± 3 16 ± 7
Cu 7000 ± 4000 100 ± 100 3100 ± 2700
Sr 420 ± 50 450 ± 50 545 ± 100
Y 5 ± 1 8 ± 1 9 ± 1
Zr 52 ± 6 30 ± 20 82 ± 16
Sb 8000 ± 3000 900 ± 500 5200 ± 2800
Ba 250 ± 40 290 ± 70 330 ± 90
La 7 ± 1 - 9 ± 1
Ce 14 ± 2 - 15 ± 1
Pb 13000 ± 8000 20 ± 40 7700 ± 6100
Table 5.6 - comparison between the composition of HPb glasses and those analysed by Cagno 2011 and by Foster and Jackson (HIMT 2).

92
Glasses belonging to the LowPb group have a similar composition to those of Group
3 studied by Foy 2003 [27]. These glasses have a similar composition to those called
Levantine. Table 5.7 shows the relation between the major and minor elements of
LowPb group glasses with those of Group 3 studied by Foy 2003.
Low Pb Group 3
Na 17.7 ± 1.3 16.8 ± 1.6
Mg 0.5 ± 0.2 0.6 ± 0.1
Al 2.2 ± 0.4 2.5 ± 0.4
Si 70 ± 1.7 69.4 ± 1.7
K 0.4 ± 0.1 0,6 ± 0.1
Ca 6.7 ± 1.2 7,9 ± 0.9
Mn 0.6 ± 0.5 0,7 ± 0.6
Fe 0.5 ± 0.2 0,5 ± 0.2
Ti 750 ± 220 700 ± 200
Co 3 ± 3 40 ± 100
Ni 8 ± 3 -
Cu 60 ± 90 90 ± 340
Sr 530 ± 120 500 ± 420
Y 8 ± 1 -
Zr 70 ± 20 50 ± 30
Sb 1300 ± 1900 160 ± 470
Ba 290 ± 120 320 ± 340
La 8 ± 1 -
Ce 13 ± 2 12 ± 10
Pb 100 ± 150 120 ± 400
Table 5.7 - comparison between the composition of LowPb glasses with those of group 3 analysed by Foy 2003

93
HIMT glasses, compared to the Levantine ones, are characterised by a lower-quality
sand: this is highlighted by the large amounts of Fe, Mn, Ti and trace elements, and in
line with their usual peculiar colouring (yellow-greenish). Thanks to their high sodium
content, a lower temperature is required for manufacturing.
Levantine glasses are characterised by a higher-quality or purified sand: they have
small amounts of Fe, Mn, Ti and trace elements and may be classified as higher-
quality glasses as compared to HIMT ones. The high temperatures necessary for
manufacturing Levantine glasses made this type of glass expensive and with high
production costs. This is the main reason why, since 4th century AD, the production of
HIMT glasses was preferred to that of Levantine ones. Nevertheless, this study
investigates predominantly samples of Levantine glasses.

94
CHAPTER 6
CONCLUSIONS

95
6 CONCLUSIONS
The use of LA-ICP-MS in the characterisation of archaeological glasses excavated from
the Donoratico and Santa Maria della Scala sites has guaranteed a scientific approach
in the classification of archaeological findings. This particularly sensitive instrument
has made it possible to determine the amounts of trace elements present and hence
the origin of the raw materials used.
Generally speaking, the amounts of the main and minor oxides were very similar in all
samples and are compatible with those found in other Roman glass samples of the
same period. None of the analysed glasses displayed high magnesium and potassium
values, thus excluding the presence of medieval glasses where vegetable ash was
used as melting agent instead of natron (used instead in Roman glasses). The use of
natron may also be inferred by the percentages of chlorine, sulphur and phosphorus
found, typical of natron glasses.
The study of trace elements is of importance in determining the origin of the sand
used. As regards the glass items studied here, two types of sand were probably used.
The first type of sand is characterised by high amounts of Ti, Zr and Fe; high
percentages of trace elements as well as iron indicated the use of not-so-pure sand,
which reflects in glass of poorer quality. Such sand has also been observed in HIMT
glasses and was used in samples belonging to the HFe and HPb groups. The second
type of sand displayed lower trace element and iron concentrations, suggesting the
use of a purer sand and hence higher quality glasses. This kind of sand was used in
glass items belonging to the LowPb group and similar to the one used in the
production of Levantine 1 glass. One cannot exclude the fact that the latter sand type
may have been purified prior to use.
High Sr percentages observed in all glass types suggest the use of coastal sand. This
is because strontium is easily combined with aragonite, a mineral present in shells of
marine organisms. Lower Sr amounts are to be attributed to the use of limestone
bearing sand (however, this was not observed in this study).
The percentage of zirconium observed (approx. 100 µg/g) is typical of Mediterranean
coastal sands.
The amounts of barium detected are to be referred to the use of sands that are rich in
alkali feldspars. Such minerals introduce both Ba and Al in the sand, in the form of
impurities, and it is for this reason that the amounts of both elements are correlated.

96
All the glass items studied were yellow, green and brown, while none were blue. Glass
samples LEO9 and LEO13 were colourless and displayed high manganese amounts.
Manganese in these two samples was presumably added as a decolouring agent and
its amount is not attributable to sand impurity.
Glass items belonging to the HPb group were characterised by high amounts of Cu,
Pb, Sn and Sb and their amounts were correlated. Such elements were added to give
glass its characteristic colour, thus suggesting the use of glass fragments or a copper
alloy with Sb impurities in the vitreous matrix.
Glass items belonging to the HFe and HPb groups are HIMT type glasses, and
correspond to ‘Group 1’ and ‘Group 2’ described by Foy et al. 2003. These glasses are
characterised by high amounts of Fe, Mn and Ti and display a positive correlation
between Fe and Ti and between Fe and Mn. This type of glass is also characterised by
high amounts of Na and Mg and low amounts of Ca. These are usually yellow-greenish
in colour, due to the high Fe amounts present in form of impurities, suggesting the
use of not-so-pure sand. Recent studies (Freestone et al., 2005) suggest the use of
sands found in the near east, presumably Egypt.
Glass items belonging to the LowPb group are similar to the ones called ‘Levantine 1’
and correspond to ‘Group 3’ in Foy et al. 2003. They are characterised by low Na and
Fe values and high Ca and Al values. Low trace elements amounts suggest the use of
purer sand compared to the one used for HIMT samples and for this reason these are
higher quality glasses. It is believed that this kind of sand was collected close to the
Belus river or at its estuary, in the Syrian-Palestinian peninsula.
HIMT and ‘Levantine 1’ glasses are typical of the Late Roman period and have been
found from the 4th to the 11th century AD. The constant composition of all glass
items found throughout the area of the Empire suggests the existence of a primary
workshop where raw glass was produced. The analysis of the trace elements present
leads to the hypothesis that such workshop may have been located in the Middle East.
Raw glass artefacts were then sent to the western part of the Empire, to numerous
secondary workshops were the glass was re-fused and modelled into desired shapes.
The experimental evidence gathers in this work is consistent with this hypothesis.
97
Bibliography:
[1] L. Campanella, Chimica per l’arte (2007), Zanichelli (Bo).
[2] Koen H.A. Janssens, Modern methods for analyzing archaeological and historical
glass (2013), Wiley
[3] S. Gagno, Compositional analysis of historic glass (2012) PhD dissertation,
University of Antwerp.
[4] R. Newton and S. Davison, Conservation of glass, Butterworth-heinemann ltd
1989.
[5] Il vetro dall’antichità all’età contemporanea: aspetti tecnologici, funzionali e
commerciali. Atti 2a giornata nazionale di studio AIHV – comitato nazionale italiano.
14-15 dicembre 1996 Milano, Edizion Et, Milano.
[6] G. Maniache, Il vetro soffiato. Da Roma antica a Venezia (1960), Electra editrice
(Mi).
[7] G. Artioli, I. Angelini, A. Polla, Crystal and phase transition in protohistoric glass
materials, Phase Transitions 81 (2-3) (2008) 233-252.
[8] A. Silvestri, G. Molin, The colurless glass of Julia Felix, Journal of Archaeological
science 35 (2008) 331-341.
[9] H. Tait, Five thousand years of glass (1991), Harry N. Abrams Incorporated.
[10] D. Brems, P. Degryse, Western Medeterranean sand deposits es a raw material
for Roman glass production, Journal of Archaeological science 39 (2012) 2897-2907.
[11] P. Croveri, I. Fragalà, E. Ciliberto, Analysis of glass tesserae from the mosaics of
the “Villa del Casale” near Piazza Armerina (Enna, Italy). Chemical composition, state
of preservation and production technology, Applied Physics 100 (2010) 927-935
[12] A. J. Shortland, Evapotites of the Wadi Natrun: seasonal and annual variation
and its implication for ancient exploitation, Archaeometry 46, 4 (2004) 497-516.
[13] F. Cantini, Archeologia urbana a Siena; l’area dell’Ospedale di Santa Maria della
Scala prima dell’Ospedale; alto medioevo, All’insegna del Giglio (2005).

98
[14] F. Cantini, P. Brogini, Accademia dei rozzi, rivista accademica n° 18, Il Leccio
(2003).
[15] R. Francovich, I grandi temi del dibattito europeo, archeologia, storia,
valorizzazione, innovazione. Atti del convegno, Siena, Santa Maria della Scala, 15-17
novembre 2007.
[16] G. Bianchi, Castello di Donoratico, i risultati delle prime campagne di scavo
(2000-2002), Edizioni all’insegna del Giglio 2004.
[17] R. Francovich, G. Bianchi, “Capanne e muri in pietra. Donoratico nell’alto
Medioevo” (pp. 105-116) article in Il medioevo nella provincia di Livorno. I risultati
delle recenti indagini by C. Marcucci, C. Megale, Pisa 2006.
[17] A. Kenneth, Rubinson, Chimica analitica strumentale, Zanichelli 2002
[18] Taylor, HE, 2001, Inductively Coupled Plasma-Mass Spectrometry, Practices and
Techniques, Academic Press
[19] Heirich, art. tesi_ICP C. Heinrich, Quantitative multi-element analysis of
minerals, fluid and melt inclusions by laser-ablation inductively-coupled-plasma mass
–spectrometry, Geochimica et Cosmochimica Acta vol. 67, No. 18, pp. 3473-3496,
2003.
[20] C. Isings, Roman glass from dated finds, J. B. Walters 1957
[21] Vetri antichi del museo archeologico nazionale di Aquileia, ornamenti e
oggettistica e vetro pre- e post-romano, Luciana Mandruzzo, 2008, per conto del
comitato nazionale italiano dell’AIHV
[22] Schreiber H.D., Peters L.J., Beckman J.W., Schreiber C.W. (1996) Redox
chemistry of iron-manganese and iron-chromium interactions in soda lime silicate
glass melts, Glastech. Ber. Glass Sci. Technol. 69, 9, 269-277.
[23] Freestone I.C., Leslie K.A., Thirlwall M., Gorin-Rosen Y. (2003) Strontium
Isotopes in the Investigation of Early Glass Production: Byzantine and Early Islamic
Glass from the Near East, Archaeometry 45, 1, 19-32.
[24] A.Silvestri, The palaeo-Christian glass mosaic of St. Prosdocimus (Padova, Italy):
archaeometric characterisation of tesserae with antimony- or phosphorus-based
opacifiers, Journal of archaeological science 39 (2012) 2177-2190

99
[25] Freestone, I.C., Gorin Rosen, Y., Hughes, M.J., 2000. Primary glass from Is- rael
and the production of glass in Late Antiquity and the Early Islamic period. In: Nenna,
M.D. (Ed.), La route du verre. Travaux de la Maison de l’Orient Me ́diterrane ́an, Lyon,
pp. 65e83.
[26] S. Cagno, Evidence of early medieval soda ash glass in the archaeological site of
San Genesio (Tuscany), Journal of Archaeological Science 39 (2012) 1540-1552.
[27] Foy, D., Picon, M., 2003. Caractérisation des verres de la fin de l’Antiquité en
Méditerranée occidentale: l’émergence de nouveaux cou- rants commerciaux. In: Foy,
D., Nenna, M.D. (Eds.), Échanges et commerce du verredans le monde antique, actes
du colloque de l’Association Française pour l’Archéologie du Verre, Aix-en-Provence et
Marseille, 7e9 juin 2001, Editions Monique Mergoil, Montagnac
[28] Freestone, I. C., 1994, Chemical analysis of ‘raw’ glass fragments, in Excavations
at Carthage, Volume II, 1 The Circular Harbour, north side (ed. H. R. Hurst), Oxford
University Press for the British Academy.
[29] R. H. Brill Chemical Analyses of Early Glasses, Volumes 1 & 2, The Corning
Museum of Glass, Corning, New York, 1999
[30] R. Arletti, Archaeometric investigation of Sicilian early Byzantine glass: chimica
and spectroscopic data, Archaeometry 52, 1 (2010) 99-114.
[31] Foster and Jackson, The composition of ‘naturally coloured’ late Roman vessel
glass from Britain and the implications for models of glass production and supplì,
Journal of Archaeological Science 36 (2009) 189-204.