analytical modeling of the effect of crack depth, specimen
TRANSCRIPT
WSRC-MS-94-0463
Analytical Modeling of the Effect of Crack Depth, Specimen Size, and Biaxial Stress on the Fracture Toughness of Reactor Vessel Steels (U)
by P. S. Lam Westinghouse Savannah River Company Savannah River Site Aiken, South Carolina 29808 Y. J. chao Uniiensty of South Camlii Dept of Mechatrical sc USA
A document prepared for (1)1995 AMERICAN SOCIETY OF MECHANICAL ENGINEERS PRESSURE VESSUS AND PIPING CONFERENCE (2) SUBMITTED TO ASME JOURNAL OF PRESSURE VESSEL TECHNOLOGY at Honolulu from 07/23/95 - 07/27/95.
DOE Contract No. DE-AC09-89SR18035
This paper was prepared in connection with work done under the above contract number with the U. S. Department of Energy. By acceptance of this paper, the publisher andlor recipient acknowledges the U. S. Government's right to retain a nonexcIusive, royalty-free license in and to any copyright covering this paper, along with the right to reproduce and to authorize others to reproduce all or part of the copyrighted paper.
DISCLAIMER
Portions of this document may be illegible in electronic image products. Images are produced from the best available original document.
t

W SRC-MS -94-0463
Analytical Modeling of the Effect of Crack Depth, Specimen Size, and Biaxial Stress on the Fracture Toughness of Reactor Vessel Steels
Y.J. Chao Department of Mechanical Engineering University of South Carolina Columbia, South Carolina 29208
and
P.S. Lam Westinghouse Savannah River Company Savannah River Technology Center Aiken, South Carolina 29802
A final paper proposed for presentation and publication at the American Society of Mechanical Engineers (ASME) Pressure Vessels and Piping Conference in Honolulu, Hawaii, July 23-27, 1995.
This paper will also be submitted to ASME Journal of Pressure Vessel Technology for publication.
The information contained in this paper was developed during the course of work under Contract No. DE-AC09-89SR18035 with the U. S. Department of Energy. By acceptance of this article, the publisher and/or recipient acknowledges the U.S. Government's right to retain a nonexclusive, royalty-free license in and to any copyright covering this article, along with the right to reproduce and to authorize others to reproduce all or part of the copyrighted article.
DISCLAIMER
This report was prepared as an account of work sponsored by an agency of the United States Government. Neither the United States Government nor any agency thereof, nor any of their employees, makes any warranty, express or implied, or assumes any legal liability or responsibility for the accuracy, completeness, or usefulness of any information, apparatus, product, or process disclosed, or represents that its use would not infringe privately owned rights. Reference herein to any specific commercial product, process, or service by trade name, trademark, manufacturer, or otherwise does not necessarily constitute or imply its endorsement, recommendation, or favoring by the United States Government or any agency thereof. The views and opinions of authors expressed herein do not necessarily state or reflect those of the United States Government or any agency thereof.
This report has been reproduced directly from the best available copy.
Available to DOE and DOE contractors from the Office of Scientific and Technical Information, P.O. Box 62, Oak Ridge, TN 37831; prices available from (615) 576-8401.
Available to the public from the National Technical Information Service, U.S. Department of Commerce, 5285 Port Royal Road, Springfield, VA 22161.

November 1994 Manum 'ntjre-pared for ASME 1995 PVP Cogfe rence
ANALYTICAL MODELING ON THE EFFECT OF CRACK DEPTH, SPECIMEN SIZE, AND BIAXIAL STRESS ON THE FRACTURE
TOUGHNESS OF REACTOR VESSEL STEELS
Yuh-Jim Chao* and Poh-Sang Lam**
*Department of Mechanical Engineering University of South Carolina
Columbia, SC 29208 **Westinghouse Savannah River Technology Center
Aiken, SC 29802
Abstract
Fracture toughness values for A533-B reactor pressure vessel (RPV) steel obtained from test programs at Oak Ridge National Laboratory ( O W ) and University of Kansas 0 are interpreted using the J-A2 analytical model. The analytical model is based on the critical stress concept and takes into consideration the constraint effect using the second m e t e r A2 in addition to the generally accepted first parameter J which represents the loading level. It is demonstrated that with the constraint level included in the model effects of crack depth (shallow vs. deep), specimen size (small vs. large), and loading type (uniaxial vs. biaxial ) on the hcture toughness from the test programs can be interpreted and predicted.
Introduction
Constraint effect in fracture is qualitatively referred to as the dependence of fracture toughness of materials upon the specimen thickness, in-plane geometry and loading configuration. To understand this fracture behavior considerable effort has been devoted to tests and development of analytical models in recent years. While tests attempt to simulate the actual structural loading and geometric situations as closely as possible, analytical models serve to interpret and predict the fracture of test specimens of different geometries. More importantly, any analytical model validated by existing test data will provide a quantitative tool to be utilized to predict the fracture behavior of actual structures such as nuclear reactor vessels under realistic loading conditions.
To prevent fracture of nuclear W V , fracture mechanics methodologies are generally applied to evaluate the structural integrity of the vessels. As more nuclear power plants become aged and reactor vessel steels get further embrittled, structural integrity of reactor vessel has become an extrc mely important and timely issue. The Nuclear Regulatory Commission (NRC) has commissioned Oak Ridge National Laboratory to conduct a series of tests and modeling in an attempt to investigate the fracture behavior of reactor vessel steels. In particular, the constraint issue has been studied extensively. It has been reported that specimens with shallow cracks produce high toughness values compared to deep or standard ASTM fracture test specimens [see, e.g. 1-31; small specimens yield high toughness values compared to large specimens [4]; and biaxially loaded specimens that simulate a crack in RPV wall subjected to thermal shock loads experience low toughness values compared to uniaxially loaded specimens [S-81.
1
In this paper, experimental data from OFWL [1,5] and KU [2] are interpRted using the J-A2 analytical model developed by Chao, et al. [9] and Chao and Ji [lo]. These experimental data are from the material, A533-B RPV steel, tested at different temperatures. Our analysis used the data tested at about -40 OC which is at the lower portion of the ductile-to-brittle transition curve of the material. In both [l] and [2], toughness values are obtained for shallow (a/w=O.l) and deep (a/w=0.5) single-edge-notch-bend (SENB) crack specimens. The KU tests [Z] used the broken specimens from ORNL and thus are smaller in size. In [5] , the fracture toughness values are obtained by testing a six-point-bend cruciform specimen under either uniaxial or biaxial loads. Using these data, this paper is able to address the constraint issues in specimen size (KU vs. ORNL), crack depth (4~4.1 vs. 0.5), and loading configurations (uniaxial vs. biaxial) using the EA2 model.
The theoretical background of the J-A2 methodology is briefly reviewed in the next section. Detailed specimen dimensions and loading configurations from [ 1,231 are presented then. The KU test data [2] are used to construct the failure curve in the J-A2 space for the RPV steel, A533-B. Using this material failure curve and numerical finite element analysis, fracture toughness values reported in [ 1,5] are predicted. Good agreement between the predicted values and the test results is obtained. Discussion and comments are provided to conclude the paper.
Theoretical background
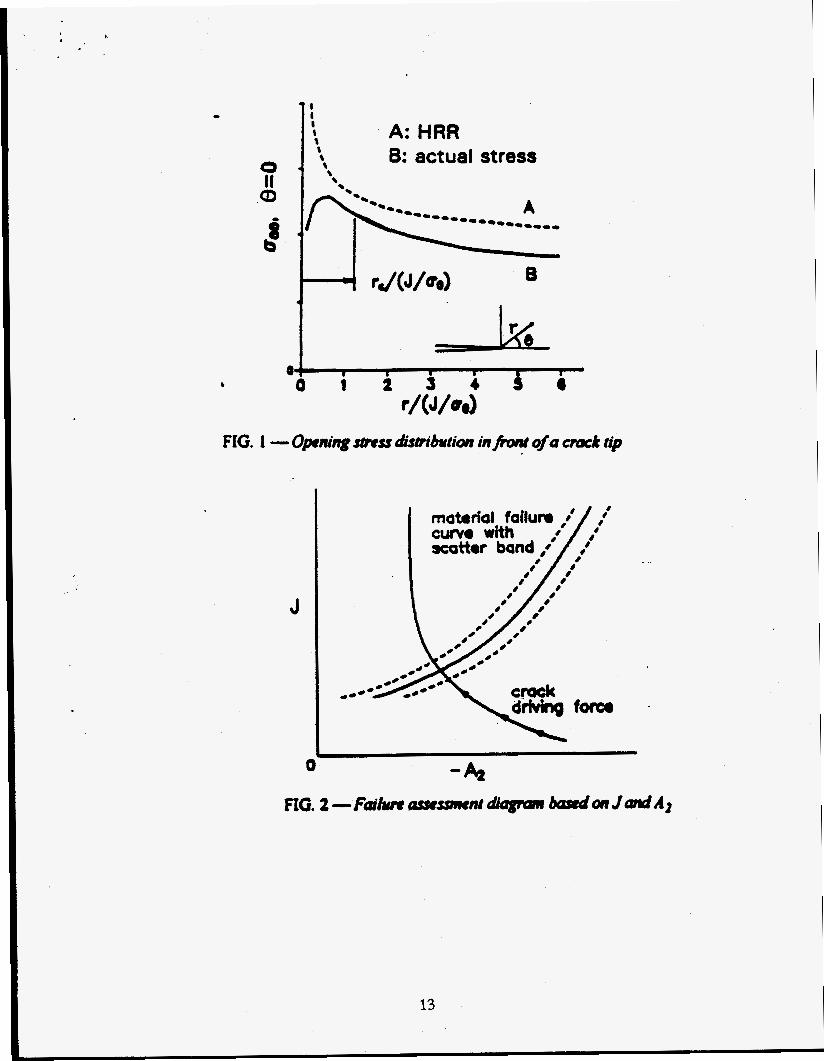
brittle transition temperature, the predominant mode of fracture is cleavage. It is generally recognized that a cleavage fiacture event initiates when a critical tensile stress oc is attained at a critical distance rc ahead of the crack tip, or the RKR model [ll-131. A large scatter in the toughness data observed in experiments for cleavage fracture could be due-to a combination of statistical sampling [ 141 and constraint effects. In this paper, the constraint effect on the fracture toughness is investigated. Referring to fig.1, if the critical stress oc can be represented by the well known asymptotic solution, HRR fields, after Hutchinson [15,16] and Rice and Rosenpn [17], the fracture can be well characterized by a single parameter J since the strength of the HRR solution is uniquely governed by J. Note that the HRR solution is valid as r+O. Only under stringent conditions, a structure or specimen can posses a stress at afinite distance r, close to the HRR stress. This is indeed the underlying principle for the severe size requirements by ASTM for fracture toughness testing. In the general case, the critical stress at the finite distance rc deviates a certain amount from the HRR stress. When this deviation is large, a single parameter, J or CTOD (crack tip opening displacement), is insufficient to characterize the fracture event. This is the fundamental reason for the constraint effect in fracture.
For structural steels fracturing at lower shelf and lower portion of the ductile-to-
To quantify the stress at a furite distance rc (in contrast to r-4) ahead of the crack tip, it is nature to examine the analytical asymptotic solutions including higher order terms. Li and Wang [18] presented a procedure for determining the second tern in the asymptotic expansion. Sharma and Aravas [19] completed the second order analysis using a somewhat different method than used by Li and Wang [18]. Recent results by Xia, et al. [20] include higher order terms. O'Dowd and Shih [21-231 introduced a Q-stress term to collectively represent all the higher order terms for the stress fields. Note that these analyses [ 18-23] are for plane strain, Mode I conditions. A more complete theoretical asymptotic analysis including higher order terms for the stress and deformation fields around a crack tip embedded in Ramberg-Osgood nonlinear materials for Mode I and Mode
2
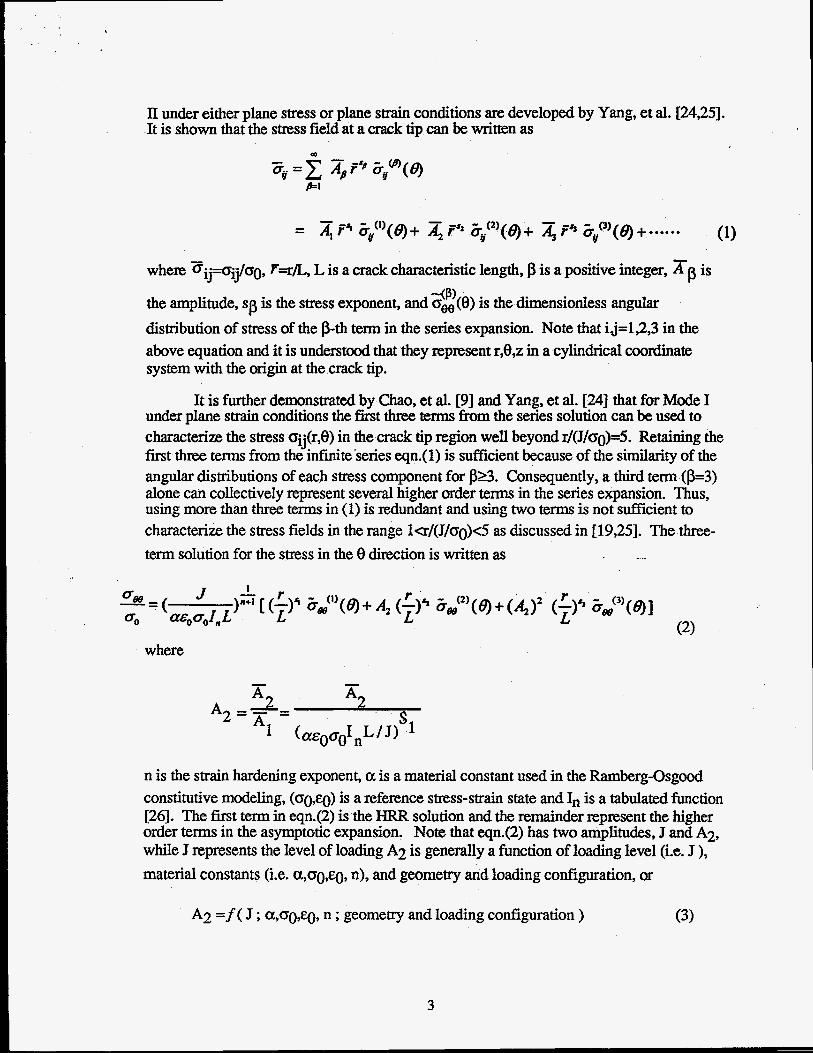
11 under either plane stress or plane strain conditions are developed by Yang, et al. [24,25]. It is shown that the stress field at a crack tip can be written as
- where ~..-o../a 1J- 1J 0 , F=r/L, L is a crack characteristic length, p is a positive integer, A 13 is
the amplitu&, sp is the stress exponent, and oee (e) is the dimensionless angular distribution of stress of the p-th term in the series expansion. Note that ij=1,2,3 in the above equation and it is understood that they represent r,O,z in a cylindrical coordinate system with the origin at the crack tip.
+PI
It is further demonstrated by Chao, et al. [9] and Yang, et al. [24] that for Mode I under plane strain conditions the first three terms from the series solution can be used to characterize the stress Oij(r,O) in the crack tip region well beyond r/(J/Go)=5. Retaining the first three terms from the infinite series eqn.( 1) is sufficient because of the similarity of the angular distributions of each stress component for p23. Consequently, a third term ( k 3 ) alone can collectively represent several higher order terms in the series expansion. Thus, using more than three terns in (1) is redundant and using two terms is not sufficient to characterize the stress fields in the range l<r/(J/~o)d as discussed in [19,25]. The three- term solution for the stress in the 8 direction is written as
where
n is the strain hardening exponent, a is a material constant used in the Ramberg-Osgood constitutive modeling, (oo,~)) is a reference stress-strain state and In is a tabulated function [26J. The fmt term in eqn.(2) is the HRR solution and the remainder represent the higher order terms in the asymptotic expansion. Note that eqn.(2) has two amplitudes, J and A2, while J represents the level of loading A2 is generally a function of loading level (Le. J ), material constants (i.e. a,oo,q, n), and geometry and loading configuration, or
A2 =f( J ; a,oo,q, n ; geometry and loading configuration ) (3)
3
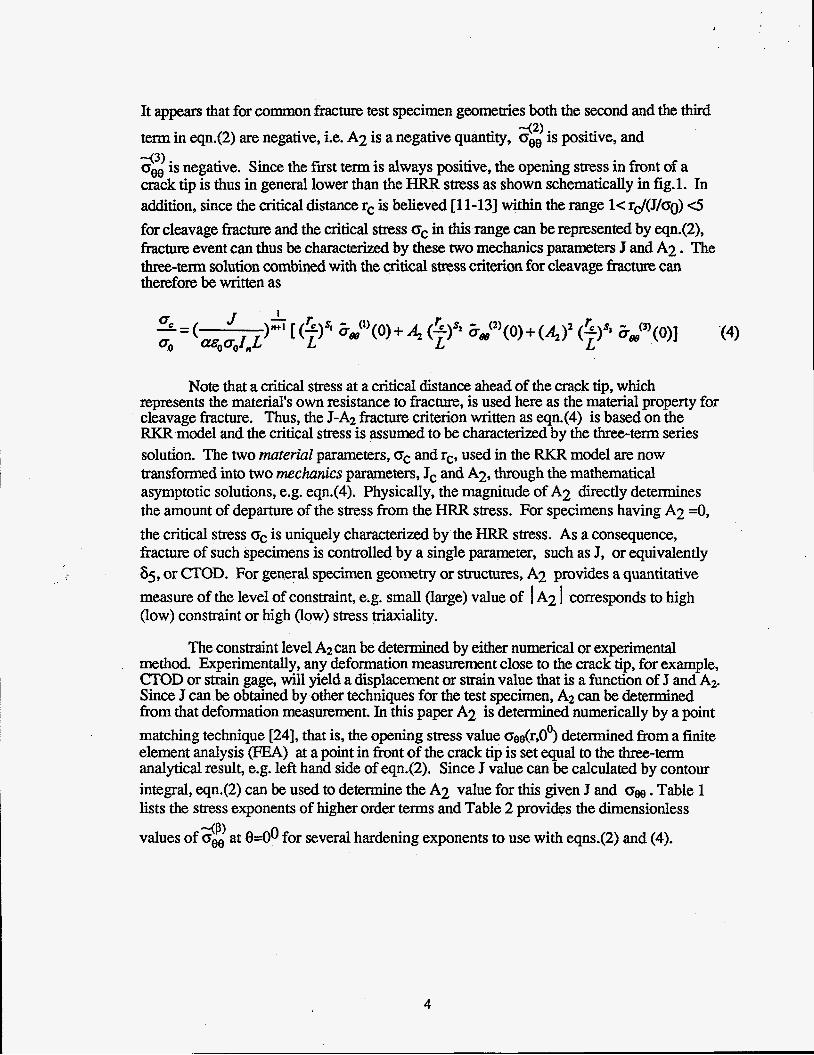
It appears that for common fracture test specimen geometries both the second and the third tern in eqn42) are negative, i.e. A2 is a negative quantity, gi is positive, and
2:; is negative. Since the first term is always positive, the opening stress in front of a crack tip is thus in general lower than the HRR stress as shown schematically in fig.1. In addition, since the critical distance rc is believed [l l-131 within the range 1< rJ(J/oo) c5 for cleavage fracture and the critical stress oc in this range can be represented by eqn.(2), fracture event can thus be characterized by these two mechanics parameters J and A2. The three-terrn solution combined with the critical stress criterion for cleavage fracture can therefon: be written as
Note that a critical stress at a critical distance ahead of the crack tip, which represents the material's own resistance to fracture, is used here as the material property for cleavage fracture. Thus, the J-A2 fracture criterion written as eqn.(4) is based on the RKR model and the critical stress is assumed to be characterized by the three-term series solution. The two material parameters, oc and rc, used in the RKR model are now transformed into two mechanics parameters, 3, and A2, through the mathematical asymptotic solutions, e.g. eqn.(4). Physically, the magnitude of A2 directly determines the amount of departure of the stress from the HRR stress. For specimens having A2 4, the critical stress oc is uniquely characterized by the HRR stress. As a consequence, fracture of such specimens is controlled by a single parameter, such as J, or equivalently 65, or CTOD. For general specimen geometry or structures, A2 provides a quantitative measure of the level of constraint, e.g. small (large) value of I A2 I corresponds to high (low) constraint or high (low) stress triaxiality.
The constraint level A2 can be determined by either numerical or experimental method, Experimentally, any deformation measurement close to the crack tip, for example, CTOD or strain gage, will yield a displacement or strain value that is a function of J and Az. Since J can be obtained by other techniques for the test specimen, A2 can be determined from that deformation measurement. In this paper A2 is determined numerically by a point matching technique [24], that is, the opening stress value oee(r,Oo) determined h m a finite element analysis (FEA) at a point in front of the crack tip is set equal to the three-term analytical result, e.g. left hand side of eqn.(2). Since J value can be calculated by contour integral, eqn.(2) can be used to determine the A2 value for this given J and om. Table 1 lists the stress exponents of higher order terms and Table 2 provides the dimensionless
values of oee at 8dO for several hardening exponents to use with eqns.(2) and (4). -4)
4
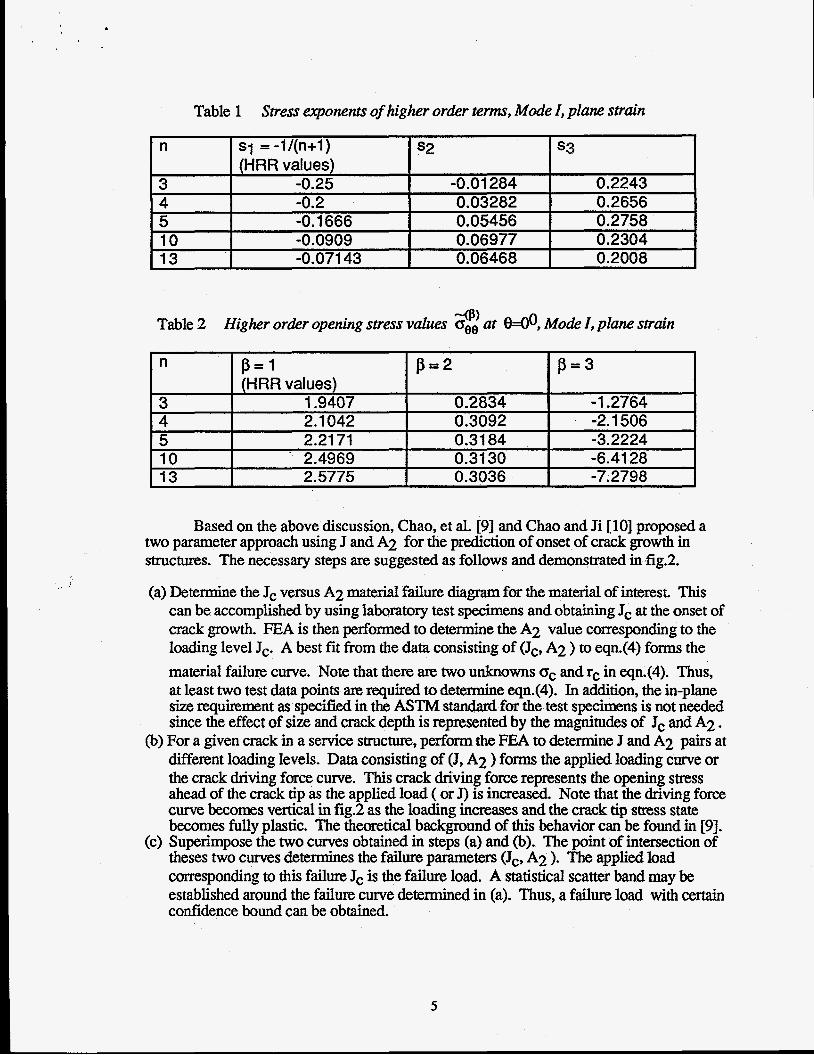
Table 1 Stress exponents of higher order terms, Mode I, plane strain
n SI =-l/(n+l) s2
4 -0.2 1 0.03282
(HRR values) 3 -0.25 -0.01 284
5 -0.1 666 0.05456 10 -0.0909 0.06977 13 -0.071 43 0.06468
s3
0.2243 0.2656 0.2758 0.2304 0.2008
Table 2 Higher order opening stress values 8: at 640, Mode I , plane strain
n p = 1 p = 2 (HRR values)
3 1.9407 0.2834 4 2.1042 0.3092 5 2.21 71 0.31 84 10 . 2.4969 0.31 30 13 2.5775 0.3036
p = 3
-1.2764 -2.1 506 -3.2224 -6.41 28 -7.2798
Based on the above discussion, Chao, et al. [9] and Chao and Ji [ 101 proposed a two parameter approach using J and A2 for the prediction of onset of crack growth in structures. The necessary steps are suggested as follows and demonstrated in f i g 2
(a) Determine the Jc versus A2 material failure diagram far the material of interest. This can be accomplished by using laboratory test specimens and obtaining Jc at the onset of crack growth. FEA is then performed to determine the A2 value corresponding to the loading level Jc. A best fit from the data consisting of (Jc, A2 ) to eqn.(4) forms the material failure curve. Note that there are two unknowns oc and rc in eqn.(4). Thus, at least two test data points are required to d e t e d e eqn.(4). In addition, the in-plane size requirement as specified in the ASTM standad for the test specimens is not needed since the effect of size and crack depth is represented by the magnitudes of Jc and A2.
(b) For a given crack in a service structure, perform the FEA to determine J and A2 pairs at different loading levels. Data consisting of (J, A2 ) forms the applied loading curve or the crack driving force curve. This crack driving force represents the opening stress ahead of the crack tip as the applied load ( or J) is increased. Note that the driving force curve becomes vertical in fig.2 as the loading increases and the crack tip stress state becomes fully plastic. The theoretical background of this behavior can be found in [9].
(c) Superimpose the two curves obtained in steps (a) and (b). The point of intersection of theses two curves determines the failure parameters (Jc, A2 ). The applied load corresponding to this failure Jc is the failure load. A statistical scatter band may be established around the failure curve determined in (a). Thus, a failure load with certain confidence bound can be obtained.
5
The above procedure has been successfully applied to a series of test data composed of various crack depths [ 101. Constraint effects in fracture such as size effect and transferability are also studied in [lo]. In the c m n t paper, this procedure is applied to the interpretation and prediction of the test data from KU [2] and ORNL [1,5] for the A533-B RPV steel. The test data show a significant dependence of the fracture toughness values on specimen size, crack depth, and loading configurations.
Material failure curve for A533-B reactor pressure vessel steel
The material used in [1,2,5] is an A533 grade B, Class 1 steel and is typical of a RPV steel. The material was heat-treated to simulate RPV conditions. The mechanical properties are : Young's modules, E=206,850 MPa (30,000 ksi); Poison's ratio, v=0.3; yield stress, 0 4 5 2 MPa ( 66 ksi) at Temperature -4OOC. The stress-strain curve shown in [l] is curve-fit to the Ramberg-Osgood constitutive equation and is shown in fig. 3. The curve fit gives: strain hardening exponent n=6.3, ~ 2 . 7 1 . In addition, In = 4.85,
q,=~& and L=l mm. Note that the use of L= 1 mm is arbitrary as long as it is used for all data studied.
%:=2.2898, +a- 000-0.317, G=-4.05 19 at e=Oo, sl=-O.137, s2=0.05851, spO.264,
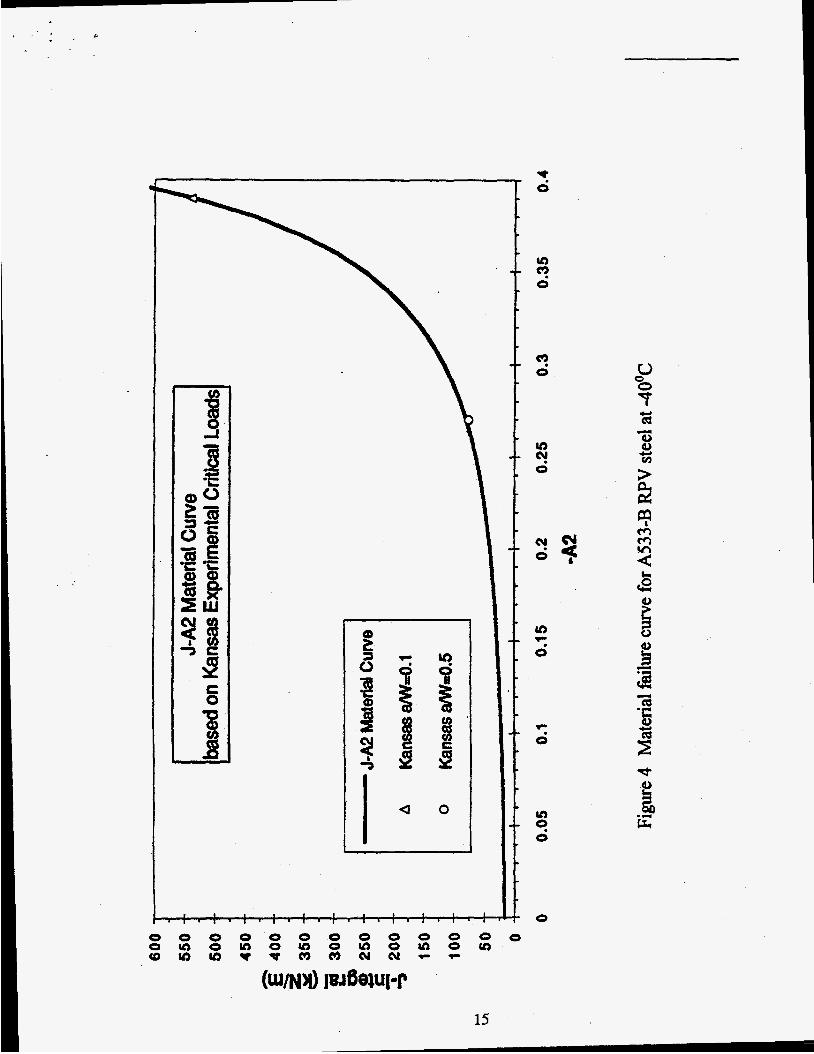
Table 3 lists the specimen geometry and test conditions of A533-B steel from ORNL [1,5] and KU [2]. The average values of the KU test results for a/w=O.l or 0.5 are used here to generate the material failure curve. The finite element program ABAQUS [27] is used and plane strain assumptions are adopted for the models. Deformation theory with the Ramberg-Osgd material is used in the analysis. Following the procedure described in (a), the specimen was loaded until the critical load P, (P,= 78.7 kN and 22.5 kN for a/w=O.l and 0.5, respectively ) is reached. The J value corresponding to this critical load is calculated from the ABAQUS code and designated as J,. The A2 value corresponding to this load or Jc is then calculated numerically using the opening stress ahead of the crack tip. These (J,, A2) pairs are (539 kN/m, -0.39) and (76 kN/m, -0.27 ) for a/w=O. 1 and 0.5, respectively, and the value of A2 was determined at r/(JJ 00)=2. Substituting these two data points into equation (4) as (J, A2), the two material fracture parameters are obtained as oC=2.23oo and r,=1.54 mm. Knowing these two parameters, equation (4) can be plotted in the J and A2 space as shown in fig.4. This curve represents the failure curve for A533-B steel assuming that the fracture is controlled by the opening stress ahead of the crack tip, i.e. the RKR model. A flawed structural member made of this material is expected to fail if the point (J, AZ) under a postulated load is located above ( or the left ) of the material failure curve.
Prediction of ORNL fracture toughness data ----- Size effect
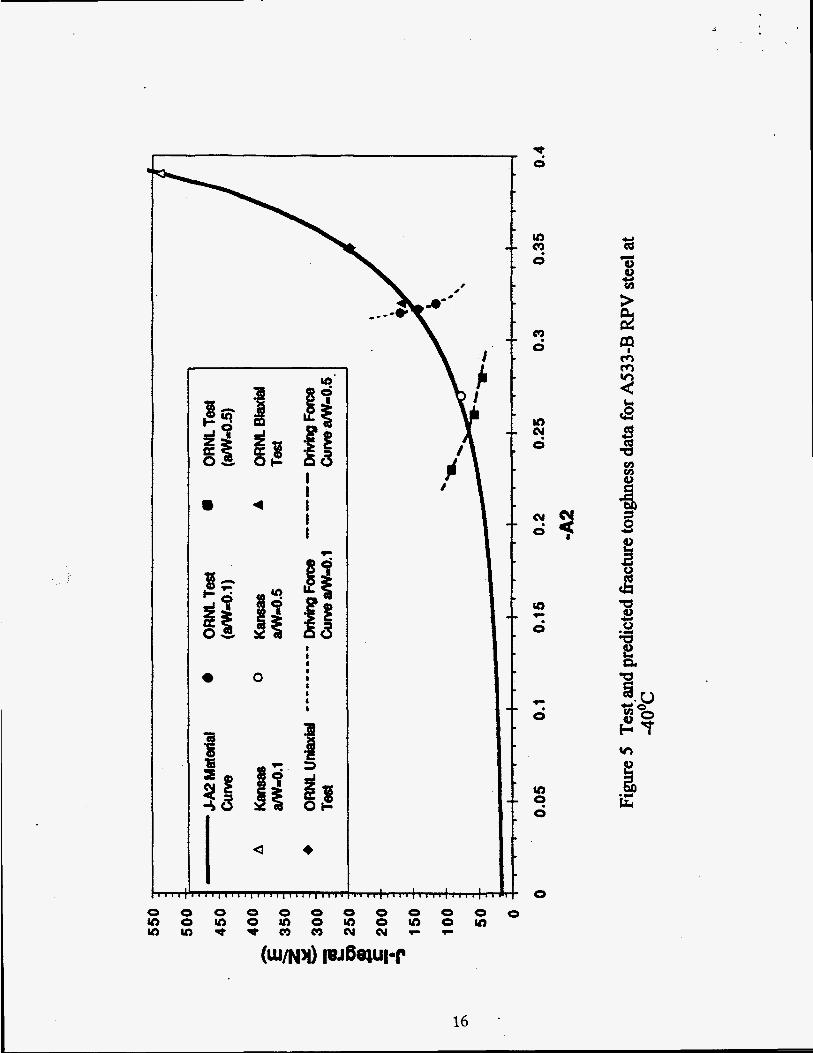
With the failure curve available, we will proceed to predict the fracture toughness of the ORNL test specimens reported in [1,5]. The ORNL test specimens have shallow (a/w=O. 1) and deep (dw4.5) configurations. They are different from the KU data in the overall size as shown in Table 3. Following the procedure (b) in the "Theoretical background" section, crack driving forces are obtained and plotted in f ig5 Note that since the critical distance is known as rc=1.54 mm, the A2 value at an applied J was determined at rJ(J/oo) from the crack tip. The crack driving force intersects with the material failure curve at Jc=148 MPa-mm (kN/m) for shallow crack and 65 MPa-mm (kN/m) for deep crack. Fracture toughness J, from ORNL tests are plotted on the crack driving forces
6

shown in fig. 5. Notice that the materiel failure curve passes right through the scatter band of the test data.
It can be concluded from the prediction demonstrated here that the (J, A2) fracture criterion can predict the effect of crack depth and specimen size on the fracture toughness values of the A533-B RPV steels.
Prediction of ORNL fracture toughness data ----- Biaxial vs. uniaxial Ioadings
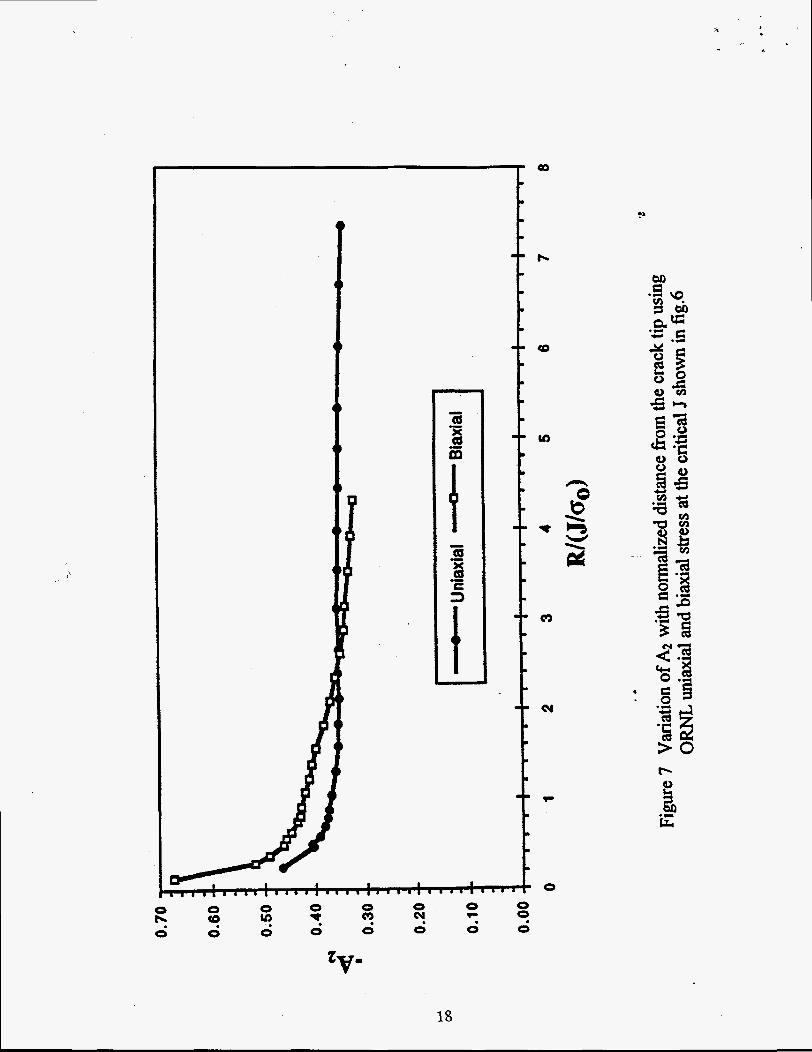
It has been found that cracks embedded in RPV are subjected to far field biaxial stress fields (Le. a positive tensile stress parallel to the crack front in addition to the common Mode I loading) under thermal shock loading conditions. ORNL has initiated a comprehensive testing and modeling program to investigate the fracture behavior of RPV steels. A six-point-bend cruciform specimen was designed and tested to apply the biaxial load to the crack specimen. The specimen has a/w=O.l 1, thus a shallow flaw. Three dimensional finite element analysis was performed by ORNL to reveal the crack tip stress fields. Detailed data and testing procedures can be found in [SI. Figure 6 shows the opening stress distributions at the critical loads of the cruciform specimen under uniaxial (three-point-bend) and biaxial ( six-point-bend) loading conditions [SI. Since the opening stress ahead of the crack tip is available, we proceeded to use these stresses @e. shown in fig.6) with eqa(4) to calculate the A2 corresponding to the applied J. The A2 calculated at various positions are shown in fig.7. Note that the stress distribution shown in fig.6 is determined from finite element analysis using piecewise liiear uniaxial material stress-strain curve in contrast to Ramberg-Osgd power law model. This could explain the variation of A2 with distance from the crack tip. Again, the A2 value at rc= 1.54 mm is chosen which corresponds to r,-J(J/o0)=2.9 and 4.1 for uniaxial and biaxial case, respectively. The experimental (J,, A2) points, (246,-0.35) for uniaxial and (167, -0.32) for biaxial case, are shown in fig.5. Note that if the failure curve is exact, the experimental dap should be located on the curve. As shown in fig.5, the prediction of the fracture toughness from the failure curve is excellent.
It should be noted that the RKR model is based on the failure stress of the material or the resistance of the material to fracture. It should be able to apply to either two- dimensional or three-dimensional cracked geometries. The approximation used here is that the stress distribution in front of the crack tip, Le. eqn.(4), is from a two-dimensional plane strain solution. However, it has been shown in [9] that J and Azcan be utilized to characterize the crack tip opening stress in a three-dimensional surface crack. The data shown in fig.5 further indicates that the J-A2 method may be a useful analytical model to predict fracture in three-dimensional structures.
Discussion and Conclusion
1. The predicted results in this report are excellent. It indicates that the J-A2 methodology can be effectively used to interpret and predict fracture toughness values under various levels of constraint. It is further demonstrated that test data from small specimens can be utilized to predict fracture of large specimens or structures if the constraint level such as A2 can be included in the analytical model.
2. The Jc values for the KU data used in this paper are calculated by the domain integral built into the ABAQUS code corresponding to the critical loads [28] applied to the specimens. As shown in Table 3, these J, values are lower than the J, reported [2] where they were determined using a formula developed by Gordon and Wang [29] for
7
load versus CMOD record. The difference could be due to the small size of the KU specimens so that the formula may not be applicable.
3. As stated in "Themtical background" section, procedure (a), to determine the material failure curve in the (J,A2) space or to determine 0, and r, in eqn.(4), at least two experimental data consisting of (J,,AZ) are required. Two data points from KU are available and used in this study to determine the failure curve for the W V A533-B steel. Although it does not seem to affect the predictions reported in this paper, more experimental data that cover a large range of A2 are recommended to construct the material failure curve to account for the scatter of the experimental data.
4. The physical meaning of r, should be the distance farm the original fatigue crack tip to the cleavage initiation site in front of the crack tip including any stable ductile crack growth. The r, value obtained from KU data in this paper is 1.54 mm and is used to predict the failure J of the ORNL test data. This value is well within the estimated plastic zone radii of 14 and 9.6 mm for the ORNL uniaxial and biaxial specimens at failure, respectively [5]. However, this value is larger than the measured r, from post-test fractography studies where 0.13 to 0.22 mm are reported for the cruciform specimens and 0.08 to 1.5 mm for the shallow and deep SENB specimens [SI. It is difficult to judge the accuracy of the obtained r,=1.54 mm value since no fractograph data is reported and only two geometries at this temperature are tested in [2]. In applying the procedure (a), a statistically meaningful r, could be obtained if more experimental data are used in determining the material failure curve.
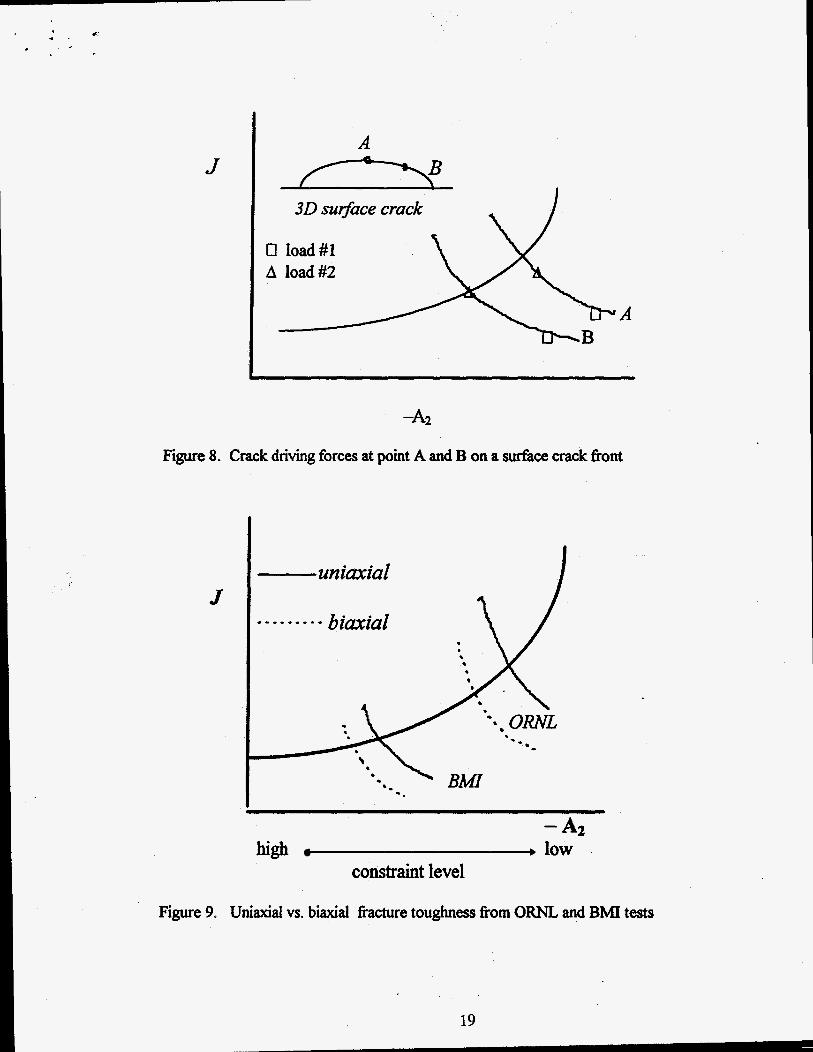
5. Note that the J-A2 fracture criterion is based on the RKR model, that is, the opening stress oee ahead of the crack tip controls the cleavage fracture. Therefore, the opening stress, not the applied J, should be used as the crack driving force. For three dimensional (3D) cracked geometry, both J and the opening stress are not uniform along the crack front and the location of maximum J may not coincide with the location of the maximum opening stress ( see, e.g. refs. 9 and 30). Under such conditions, the opening stress ahead 0: the crack tip at the location where used to interpret the fracture. One possible scenario is shown in fig.8. In fig.8, we assume that point A has maximum J and point B has maximum opening stress along a 3D crack front under an applied load. As the load is increased, the crack driving forces associated with points A and B are depicted in fig.8. In this case, initial fracture will occur at point B instead of A. The fundamental reason for this behavior is that the J-A, method uses a critical opening stress as the fracture criterion in contrast to using J as the fracture criterion. The opening stress distribution for the 3D cruciform specimen used in this paper, fig.6, is from the center point of the cruciform specimen where J is maximum [5]. The distribution of the opening stress along the crack front is not reported in [5] and hence the effect due to this cannot be evaluated.
is maximum should be
6. In addition to the cruciform specimen tested at ORNL under biaxial load, Battelle Memorial Institute @MI) also performed biaxial tests on a Merent specimen geometry made of the same material. The BMI specimen is a double-edge-notch specimen under tension ( D E N 0 ) with a/w=0.54 while the ORNL specimen is primarily SENB (single- edge notch bend) with dwd.11. The test data by BMI shows only a slight decrease in Jc comparing uniaxial to biaxial results ( 124.34 to 120.14 kN/m). A quantitative prediction is not possible since no opening stress distribution is available for the BMI test specimen. However, it is attempted here to qualitatively interpret the test results using the J-Az model which includes the constraint effect. The BMI's D E N 0 specimen is a lower constraint geometry relative to the ORNL's SENB specimen for the same a/w
8
1.
2.
3.
4.
5.
6.
7.
8.
9.
ratio and in-plane size 191. But the BMI specimen is a deep crack (dwd.54) compared to the ORNL specimen (a/w=O. 11). It is anticipated that the BMI specimen has a higher constraint than the ORNL specimen considering the combined effect of a/w, geometry and size. Figure 9 shows the predicted J, values for the two specimens. Since the failure curve is relatively flat on the high constraint side, it is anticipated that the BMI test results should yield only a small deduction in the hcture toughness value compafing uniaxial to biaxial&&
In conclusion, the results shown in this paper indicate that the J-A2 fracture methodology is a viable analytical model in predicting hcture of RPV steels. Further studies and validations axe needed in the inteqetation of three-dimensional cracked geometries and extension of the methodology to mixed fracture of cleavage and ductile modes.
Acknowledgement
The information contained in this paper was partially developed during the course of work of the second author (PSL) under Contract No. DE-AC09-89SR18035 with the U.S. Department of Energy.
References
Theiss, T.J., Shum, D.K., and Rolfe, S.T., “Experimental and Analytical Investigation of the Shallow-Flaw Effects in Reactor Pressure Vessels,” NUREG/CR- 5886,0RNL/TpvI-12115, Oak Ridge National Laboratory, 1992. Smith, J.A. and Rolfe, S.T., “The Effect of Crack Depth (a) and Crack Depth to Width Ration (a/w) on the Fracture Toughness of A533-B Steel,” ASME Journal of Pressure Vessel and Technology, vol. 116, pp.115-121, May 1994. Whorley, R.A. and Rolfe, S. T., “The Significance of the a/w Ratio on Fracture Toughness of A36 Steel,” WRC Bulletin 375. Sumpter, J.D.G. and Forbes, A.T., “Constraint Based Analysis of Shallow Cracks in Mild Steel,” Proceedings of the TWIIEWIIIS International CoMerence on Shallow Crack Fracture Mechanics, Toughness Tests and Applications, Cambridge, UK, 23-24 September, 1992. Bass, B.R., Bryson, J.W., Theiss, T.J., and Rao, M.C., “Biaxial Loading and Shallow-Flaw Effects on Crack-Tip Constraint and Fracture Toughness,” NUREG/CR-6132,ORNL/TM- 12498, Oak Ridge National Laboratory, 1994. Aurich, D., Brocks, W., Jordan, R., Olschewski, J., Veith, H., and Ziebs, J., “The Influence of Multiaxial Stress States on Characteristic Parameters for Cleavage Fracture in the Elastic-Plastic Range,” Proceedings of the International Conference on Application of Fracture Mechanics to Materials and Structures, Freibug, Germany, June 1983, pp.345-356. Olschewski, J., Jordan, R., Brocks, W., Veith, H., and Ziebs, J., Aurich, D., “The Influence of Biaxial Loading on Fracture Toughness -Further Results,” Transactions of the 7th International Conference on Structural Mechanics in Reactor Technology, Chicago, Illinois, August 1983, pp.225-232. Aurich, D. et al., “The Influence on the Stress State of &,” Paper G 5/2 in Proceedings of the 4th International Conference on Structural Mechanics in Reactor Technology, San Francisco, CA, August 15-19,1977. Chao, Y.J., Yang, S., and Sutton, M.A., “On the Fracture of Solids Characterized by One or Two Parameters: Theory and Practice,“ Journal of Mechanics and Physics of Solids, Vo1.42(4), 1994, pp.629-647.
-
9
10. Chao, Y.J. and Ji, W., "Cleavage Fracture Quantified by J and A2," Constraint Eflects in Fracture: Theory and Applications, ASTM STP 1244, Mark Kirk and Ad Bakker, Eds., American Society for Testing and Materials, Philadelphia, to appear in 1995.
11. Ritchie, R.O., Knott, J.F., and Rice, J.R., "On the Relationship Between Tensile Stress and Fractw Toughness in Mild Steel," Journal of the Mechanics and Physics of Solids, 21, 395-410, 1973.
12. Ritchie, R.O., Server, W.L., and Wullaert,R.A., "Critical Fracture Stress and Fracture Strain Models for the Prediction of Lower and Upper Shelf Toughness in Nuclear Pressure Vessel Steels," Metallurgy Transaction, lOA, 1557, 1979.
13. Wullaert, R.A. and Server, W.L., "Small Specimen Predictions of Fracture Toughness for Nuclear Pressure Vessel Steels," Nuclear Engineering and Design, 57,
14. Wallin, K., "Statistical Aspects of Constraint with Emphasis to Testing and Analysis of Laboratory Specimens in the Transition Region," Constraint Eflect in Fracture, ASTM STP 1171, eds E.M. Hackett, K. -H. Schwalbe, and R.H. Dodds, Jr., 264-288, 1993.
15. Hutchinson, J.W., "Singular Behavior at the End of a Tensile Crack in a Hardening Material," Journal of the Mechanics and Physics of Solids, 16, p.337, 1968.
16. Hutchinson, J.W. "Plastic Stress and Strain Fields at a Crack Tip," Journal of the Mechanics and Physics of Solids, 16, p.13, 1968.
17. Rice, J.R. and Rosengren, G.F., "Plane Strain Deformation Near a Crack Tip in a Power Law Hardening Material," Journal of the Mechanics and Physics of Solids,
18. Li, Y. and Wang, Z., "Higher Order Asymptotic Field of Tensile Plane Strain Nonlinear Crack Problems," Scientia Sinica (Series A ) 29,941-955, 1986.
19. Sharma, S.M. and Aravas, N., "Determination of Higher-Order Terms in Asymptotic Elastoplastic Crack Tip Solutions," J. Mech. Phys. Solids 39, 1043- 1072, 1991.
20. Xia, L., Wang, T.C., and Shih, C.F., "Higher Order Analysis of Crack Tip Fields in Elastic-Power Law Hardening Materials," J. Mech. Phys. Solids, 41, 665-687, 1993.
21. ODowd, N.P. and Shih, C.F., "Family of Crack-Tip Fields Characterized by a Triaxiality Parameter - I. Structure of Fields," J. Mech. Phys. SoZids, 39,989- 1015, 1991.
Triaxiality Parameter - 11. Fracture Applications," J. Mech. Phys. Solids, 40, 939.
23. O'Dowd, N.P. and Shih, C.F., "Two Parameter Fracture Mechanics: Theory and applications," to appea in the ASTM STP resulting from the National Fracture Symposium on Fracture Mechanics, Gatlinburg, Tennessee, June 29-July 3, 1992.
24. Yang, S., Chao, Y.J., and Sutton, M.A., Higher Order Asymptotic Crack Tip Fields in a Power-Law Hardening Material," Engineering Fracture Mechanics,
25. Yang, S., Chao, Y.J., and Sutton, M.A., "Complete Theoretical Analysis for Higher Order AsymptDtic Terms and the HRR Zone at a Crack Tip for Mode I and Mode 11 Loading of a Hardening Material," Acta Mechanica, 98,79-98,1993.
26. Shih, C.F., Tables of Hutchinson-Rice-Rosengren Singular Field Quantities, Brown University Report, MRL E-147, 1983.
27. ABAQUS, version 5.3, Hibbit, Karlson and Sorensen, Inc., Providence, RI, 1994. 28. Smith, J.A. and Rolfe, S.T, private communication, October 1994. 29. Gordon, J.R. and Wang, Y.Y., "An International Research Project to Develop
153-173, 1980.
16, 1-12, 1968.
22. ODowd, N.P. and Shih, C.F., "Family of Crack-Tip Fields Characterized by a
45(1), 1-20, 1993.
Shallow Crack Fracture Mechanics Tests," EWI Report 56098-23-92, 1992.
10
30. Wang, Y.Y., A Two-Parameter Characterization of Elastic-plastic Crack Tip Fields and Application to Cleavage Fracture, Ph.D. Thesis, Department of Mechanical Engineering, MIT, 1991.
3 1. Rudland, D. L., Mohan, R., Ghadiali, N.D., Detty, D., Rosenfield, A.R., and Wilkowski, M., “The Effect of Constraint Due to Out-of-plane Stress Field on Fracture of Reactor Pressure Vessel Steel -- An Experimental and Analytical Study,” Constraint Egects in Fracture: Theory and Applications, ASTM STP 1244, Mark Kirk and Ad Bakker, Eds., American Society for Testing and Materials, Philadelphia, to appear in 1995.
11
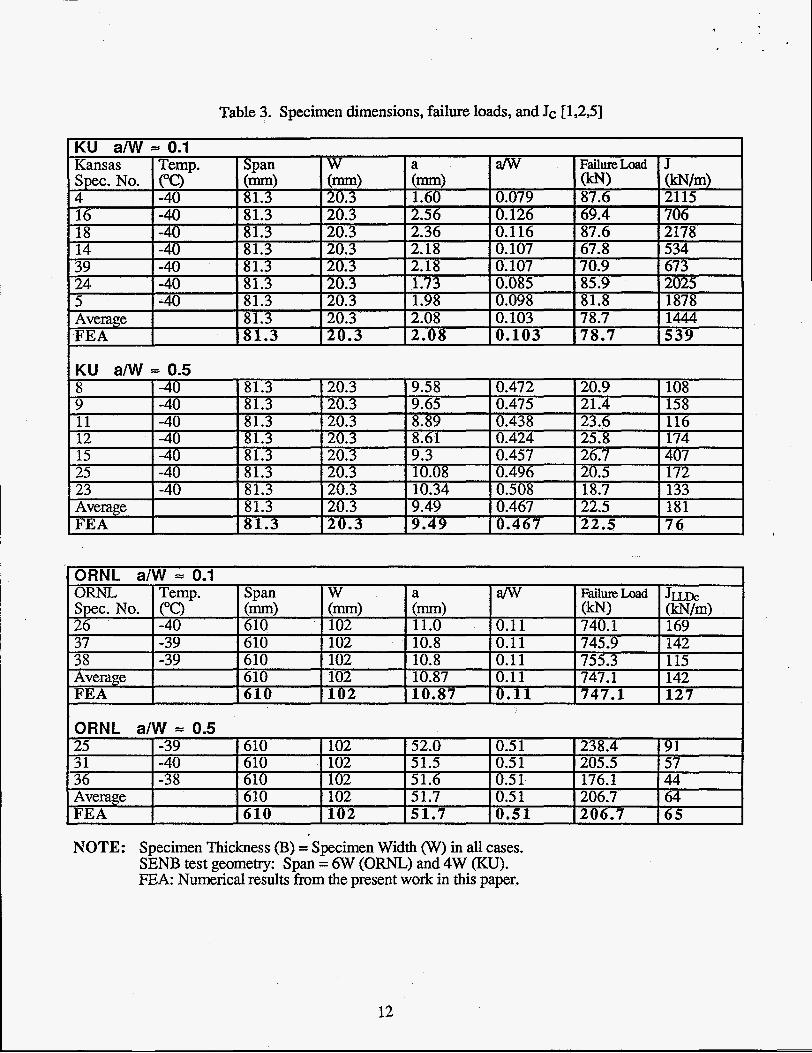
Table 3. Specimen dimensions, failure loads, and JC [1,2,5]
IORNL a/W = 0.1 I
NOTE: Specimen Thickness (B) = Specimen Width (W) in all cases. SENB test geometry: Span = 6W (ORNL) and 4W (KU). EA: Numerical results from the present work in this paper.
12
b
0 II
Q)
b 8
0. 1
8 8 I t 1 t 1
A: HRR 8: actual stress \
\ 8
FIG. I - Opning tbvu &rabutiim in- uf a cmck tip
3
-4
13

b
2 4
1.8 7-
1.6
1.4
1.2
1
0.8 - - 0.6 - - 0.4 0 -
0.2 0 -
r
0 ORNL NUREWR-5886 Fi.6 - Power Law: Nr6.7, Alphat2.71 A
0 - , , , , ~ , , , , ; , g , , ; , , , , ; , , I , ; , , g , ' , , 1 m , , , , , , , , , ; , , , I I
0 50 60 70 80 90 100 10 20 30 4 0
Figure 3 The uniaxid stress vs. plastic strain curve for the A533-B RPV steel at -40'~.
._ .
Y
I 3 h
t
- -
e-
--
v)
0 c?
c3. 0
v) '1 0
'T. 0
In 0 9
0
u 0
5
.U
cz,
15
I be
0
a
s 0
Y cd
c? 0
P
0
5 . 0
m m m 2
16

. . P
4.5
4
3.5 b
3
2.5
2
1 .S
Figure 6 Opening stress ahead of crack tip for the SSY solution and uniaxial and biaxial ccucifom spacimens at critical values of J ( NUREG/CR-6 132, figure 3.30)
17
*a' 9 b
0 b 0
0
0 '4
0 v) 0
t t
h
ua
0 0
0 7
0 ru.
18
0
0 0
J
c1 A
A m
\B I
30 su@ace crack
load #I load #2
A
Figure 8. Crack driving forces at point A and B on a surface crack fkont
J uniaxial
- A2 high b low
constraint level
Figure 9. Uniaxial vs. biaxial fracture toughness fiom ORNL and BMI tests
19