analytical performance verification
TRANSCRIPT

Analytical Performance Verification studies on the Integra 400 analyzer: Precision
and Comparison of Values with Methods in Center of Medical Laboratory Service, Faculty of Medical Technology,
Mahidol University
13 February 2015
By Kamonwan Khotchapan 5406004
Faculty of Medical Technology , Mahidol University

2
SelectDiagnostic Test
Select Methodof Analysis
Validate MethodPerformance
Implement Method
PerformTests
AcquireSpecimens
Check withStatistical QC
ReportResults
A Routine Laboratory Testing Process
Maintain MethodPrevent Problems
Develop MethodImprovements
Process for Establishinga Routine Test
http://www.westgard.com/lesson20.htm 2

Select, EvaluateDiagnostic Test
Select Methodof Analysis
Validate MethodPerformance
Implement Method
PerformTests
AcquireSpecimens
Check withStatistical QC
ReportResults
A Routine Laboratory Testing Process
Maintain MethodPrevent Problems
Develop MethodImprovements
Process for Establishing a Routine Test
http://www.westgard.com/lesson20.htm 3

Precision Accuracy
Reportable Range
Reference Interval
Method Verification
Verification is the process of evaluating a system or component to determine whether the products of a given development to assure the test system is
accurately measuring samples throughout the reportable range .
Analytical Performance Verification4

• A measure of closeness of agreement between measurement results obtained stipulated condition .
Precision
• How close a result comes to the true value.
Accuracy
• A span of test result values over which the laboratory can establish or verify the accuracy of the measurement response.
Reportable range
• A basis for a physician or other health professional to interpret a set of results for a particular patient.
Reference Interval
Analytical Performance Verification
5

Quality Control Planning Definition: The process to selected tools or rules for control the quality of the result in the laboratory.
QC requirement
% TEa
Analytical performance process
%CV
%Bias
Select QC planning tools
Sigma metric
Used Rule of Thumb for selected
QC procedure
Plot Power function graph
- Evaluate P ed, Pfr
- Selected QC procedure
EZ rule program
OPSpecs chart , Sigma metric
– Evaluated P ed, Pfr
- Selected QC procedure
6

Direct Bilirubin AmylaseTotal Bilirubin Calcium
Hemoglobin A1c PhosphorusCreatine kinaseLactate dehydrogenase
TEST
7

ObjectiveTo evaluate the performance of the new analyzer
by use method verification in term Precision and Accuracy
and find the best Quality Control planning tool for Amylase
, Direct Bilirubin , Total Bilirubin, Calcium , Hemoglobin A1c
, Phosphorus , Creatine kinase and Lactate dehydrogenase
in Cobas Integra 400 .
Cobas Integra 400
Tests
Amylase Total Bilirubin
Calcium Phosphorus
Creatine kinase Hemoglobin A1c
Direct Bilirubin
Lactate dehydrogenase
8

Materials and Methods
• Cobas Integra 400 Analyzer*
• Cobas modular P800 Analyzer*
• D-10 (Bio-rad)
Instrument
• Auto pipette 200 µl
• Pipette tips
• Cups
Equipments
• C.f.a.s calibrator (Roche Diagnostic company)
• Reagents (Roche Diagnostic company)
Reagents
*(Roche Diagnostic company)9

Materials and Methods
• PreciControl ClinChem Multi 1(PCCC1)
• PreciControl ClinChem Multi 2(PCCC2)
• PreciControl HbA1c Norm
• PreciControl HbA1c Path
• 40 samples
Sample
• Excel
• EZ rules programProgram
• TEa from CLIA ,CAP, BV and NGSP
• Medical decision level
Supportingdata
10

Materials and Methods
Tests Manufacture Methods Unit
Amylase Roche Diagnostics(Thailand) Roche liquid stable pNPG7 U/L
Calcium Roche Diagnostics (Thailand) Cresolphthalein complexone mg/dl
Creatine kinase Roche Diagnostics (Thailand) CK-NAC (IFCC) U/L
Direct Bilirubin Roche Diagnostics (Thailand) Diazo with Sulphanilic Acid mg/dl
Total Bilirubin Roche Diagnostics (Thailand) Diazonium ion mg/dl
Lactate dehydrogenase Roche Diagnostics (Thailand)
P to L, German methods U/L
Phosphorus Roche Diagnostics (Thailand) Phosphomolybdate UV U/L
Hemoglobin A1c Roche Diagnostics (Thailand)Turbidimetric inhibition immunoassay (TINA)
mg/dl
11

Quality Requirement
Tests TEa Source
Amylase 30 CLIA
Calcium 9.3 CLIA
Creatinine kinase 30 CLIA
Direct Bilirubin 20 CAP
Total Bilirubin 20 CLIA
Lactate dehydrogenase 20 CLIA
Phosphorus 10.11 BV
Hemoglobin A1c 6 NGSP
12

PRECISION
13

Within run Between run-Run each sample 20 times on the same run or at a minimum within the same day.-Sample: PCCC1 & PCCC2* Johns Hopkin University
No. PCCC1 PCCC2
1
2
3
4
…
20
Mean
SD
%CV
-Run each sample 2 times per day for 20 days or at a minimum within the same day.-Sample: PCCC1 & PCCC2*EP5-A2
DayPCCC1 PCCC2
1 2 1 2
1
2
3
…
20
Mean
SD
%CV
PRECISION
14

DayPCCC1 PCCC2
1 2 1 2
1
2
3
…
20
Mean
SD
%CV
Within run Between run-Run each sample 20 times on the same run or at a minimum within the same day.-Sample: PCCC1 & PCCC2* Johns Hopkin University
No. PCCC1 PCCC2
1
2
3
4
…
20
Mean
SD
%CV
-Run each sample 2 times per day for 20 days or at a minimum within the same day.-Sample: PCCC1 & PCCC2*EP5-A2
Statistical analyses
Used the results from Within-run and Between-run to calculated for Mean , SD and %CV
mean
SD =
% CV = (SD/mean) x 100
PRECISION
15

DayPCCC1 PCCC2
1 2 1 2
1
2
3
…
20
Mean
SD
%CV
Within run Between run-Run each sample 20 times on the same run or at a minimum within the same day.-Sample: PCCC1 & PCCC2* Johns Hopkin University
No. PCCC1 PCCC2
1
2
3
4
…
20
Mean
SD
%CV
-Run each sample 2 times per day for 20 days or at a minimum within the same day.-Sample: PCCC1 & PCCC2*EP5-A2
Statistical analyses
Acceptability Criteria%CV < 0.25 TEa
Acceptability Criteria%CV < 0.33 TEa
PRECISION
16

ACCURACY
17
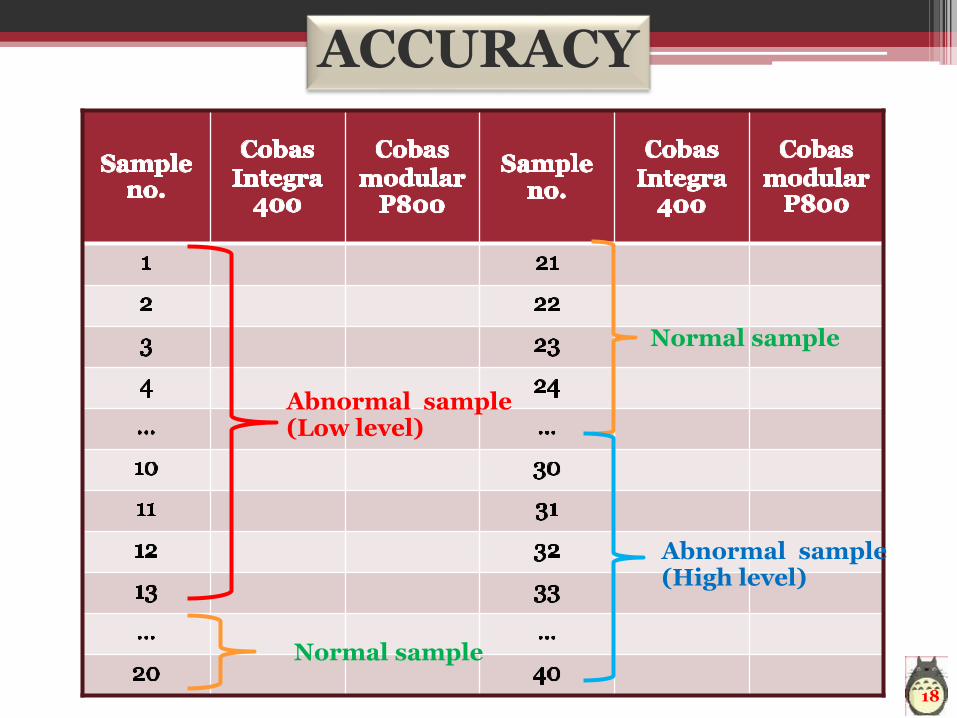
ACCURACY
Abnormal sample (High level)
Normal sample
Abnormal sample (Low level)
Normal sample
18

Method Comparison & Bias Estimation
Coefficient (R)
R< 0.975
Add more data
R > 0.975
Error Index (Y-X/TEa)
% Specimen have
Error index within ± 1
< 95 % ≥ 95%
Accept Accuracy
linear regression analysis Yc = a + bXc
a = intercept
b = slope
19

QC Planning
20

Quality Control Planning
Vital Prerequisite of Analytical QC
Analytical Performance Verification
Precision
Accuracy
Verify Reportable Range
Verify Reference Interval
Quality Control Planning
EZ rules program
%CV , % Bias , TE a , MDL
Sigma metric
- %CV ,% Bias, TE a, , MDL
-Rule of thumb’s table
; MDL (medical decision level)TE a (Total allowable error)
N (Number of measurement )
- % ed , % fr- Rules , N , Run
21

RESULTSPrecision
22

Results: Within Run Precision

Results: Between Run Precision
24

Results: Precision
Example : Amylase
Control level
Within-run Between-run
mean SD %OCV mean SD %RCV
PCCC1 82.45 0.51 0.62 82.10 0.85 1.04
PCCC2 211.2 0.62 0.29 213.21 2.20 1.03
TEa of Amylase = 30%OCV < 0.25TEa = 30/4 =7.5 %RCV < 0.33TEa =30/3 = 10
PASS PASS25

TE a (%)/
source
Precision
Within-run (%OCV) Pass
/Fail
Between-run(%RCV) Pass
/Fail
0.25TEa PCCC1 PCCC2 0.33TEa PCCC1 PCCC2
AMYL 30 CLIA 7.5 0.62 0.29 Pass 9.9 1.04 1.03 Pass
CA 9.3 CLIA 2.33 0.32 0.31 Pass 3.07 1.38 0.91 Pass
CK 30 CLIA 7.5 0.79 0.67 Pass 9.9 1.12 1.03 Pass
TBIL 20 CLIA 5 3.7 1.46 Pass 6.6 3.32 3.21 Pass
DBIL 20 CAP 5 1.74 1.09 Pass 6.6 2.30 1.98 Pass
LDH 20 CLIA 5 0.88 0.44 Pass 6.6 1.39 1.45 Pass
PHOS 10.11 BV 2.5 0.77 0.45 Pass 3.34 1.2 0.93 Pass
HbA1C 6 NGSP 1.5 0.8 0.73 pass 1.98 1.65 1.23 Pass
Results
26

RESULTSAccuracy
27

Results: Accuracy
28

Results: Accuracy
29

y = 1.0065x - 0.0472R² = 0.9996
0.00
5.00
10.00
15.00
20.00
25.00
30.00
35.00
40.00
0.00 5.00 10.00 15.00 20.00 25.00 30.00 35.00 40.00
Cobas MODULAR P800
Total Bilirubin Comparison
CO
BA
SIN
TE
GR
A 4
00
y = 1.0046x - 0.0132R² = 0.9995
0.00
4.00
8.00
12.00
16.00
20.00
0.00 4.00 8.00 12.00 16.00 20.00
Cobas MODULAR P800
Direct bilirubin Comparison
CO
BA
SIN
TE
GR
A 4
00
y = 1.0145x - 0.1479R² = 0.9955
0.00
4.00
8.00
12.00
16.00
20.00
0.00 4.00 8.00 12.00 16.00 20.00
Cobas MODULAR P800
Calcium Comparison
CO
BA
SIN
TE
GR
A 4
00
y = 1.033x + 4.9447R² = 0.9997
0.00
100.00
200.00
300.00
400.00
500.00
600.00
0.00 100.00 200.00 300.00 400.00 500.00 600.00
Cobas MODULAR P800
CK Comparison
CO
BA
SIN
TE
GR
A 4
00
30

y = 1.0424x - 16.323R² = 0.9992
0.00
200.00
400.00
600.00
800.00
1000.00
1200.00
0.00 200.00 400.00 600.00 800.00 1000.00 1200.00
Cobas MODULAR P800
LDH Comparison
CO
BA
SIN
TE
GR
A 4
00
plu
s
y = 1.0467x - 0.3747R² = 0.9924
0
2
4
6
8
10
12
14
16
0 2 4 6 8 10 12 14 16
D-10
HbA1c Comparison
CO
BA
S I
NT
EG
RA
40
0 p
lus
y = 1.0588x - 0.119R² = 0.9989
0.00
4.00
8.00
12.00
16.00
0.00 4.00 8.00 12.00 16.00
Cobas MODULAR P800
CO
BA
SIN
TE
GR
A 4
00
Phosphorus Comparison
y = 0.9988x + 2.6704R² = 0.9982
0.00
50.00
100.00
150.00
200.00
250.00
300.00
350.00
0.00 50.00 100.00 150.00 200.00 250.00 300.00 350.00
Cobas MODULAR P800
CO
BA
SIN
TE
GR
A 4
00
Amylase Comparison
31

Results: Accuracy
Example : Amylase
Test
Accuracy
MDL(Xc)
Intercept (a)
Slope(b)
Yc (a+bXc)
Coefficient(R) %Bias
Error index
Amylase 200 2.67 0.9988 202.43 0.9991 1.21 0.09
; MDL= Medical decision level PASS32

TEST
ACCURACY
% Bias Coefficient (R) Error index
Amylase 1.21 0.9991 0.o9
Calcium 0.11 0.9977 -0.02
Creatine kinase 5.36 0.9999 0.26
Direct bilirubin 0.15 0.9993 0.21
Total bilirubin 2.14 0.9998 -0.4
Lactase dehydrogenase1.2 0.9998 -0.02
Phosphate 3.5 0.9996 0.28
Hemoglobin A1c 0.68 0.9982 -0.11
Results: Accuracy
PASS
PASS
PASS
PASS
PASS
PASS
PASS
PASS
33

Results:Precision & Accuracy
PASS
PASS
PASS
PASS
PASS
PASS
PASS
PASS
%OCV < 0.25TEa
%RCV < 0.33TEa
Error index ± 1
34

QC requirement
% TEa
Analytical performance process
%CV
%Bias
Select QC planning tools
Sigma metric
Used Rule of Thumb for selected
QC procedure
Plot Power function graph
- Evaluate P ed, Pfr
-Selected QC procedure
EZ rule program
OPSpecs chart, Sigma metric
– Evaluated P ed, Pfr
-Selected QC procedure
Quality Control Planning

Results: QC Planning
• For example Sigma metric of Amylase
PCCC 1Sigma metric = (TE a - %Bias)/%CV
= (30 – 1.21)/ 1.04
= 27.68
PCCC 2
Sigma metric = (TE a - %Bias)/%CV= (30 – 1.21)/ 1.03
= 27.98
Select tools from Rule of Thumb's table = 13.5s ,N=2 ,R=1
Rules of thumb
Sigma metric
Rule
≥ 6 1 3.5s, 1 3s
5 1 3s , 1 2.5s
41 3s
/ 22s /R4s /14s
< 4 maximum QC procedure
< 3 Find new method
36

Results: Sigma metric
37

Results: QC Planning
• Example :EZ rules program >> PCCC 1 of Amylase
Ped > 0.89 Pfr = 0.0Rule = 13.5s N = 2 R = 1
Ped = 0.9 Pfr = 0.0 Rule = 13.5s N = 2 ,R = 1
38

Results: QC Planning
• Example :EZ rules program >> PCCC 2 of Amylase
Ped > 0.89 Pfr = 0.00Rule = 13.5s N = 2 R = 1
Ped = 0.9 Pfr = 0.00Rule = 13.5s N = 2 R = 1
39

Test
OPSpecs chart by EZ rule
PCCC1 PCCC2
Ped Pfr Rule N R Ped Pfr Rule N R
Amyl 0.9 0.0 13.5s 2 1 0.9 0.0 13.5s 2 1
CAL 0.9 0.0 13.5s 2 1 0.9 0.0 13.5s 2 1
CK 0.9 0.0 13.5s 2 1 0.9 0.0 13.5s 2 1
DBIL 0.9 0.0 13.5s 2 1 0.9 0.0 13.5s 2 1
TBIL 0.9 0.0 13s 2 1 0.9 0.0 13s 2 1
LDH 0.9 0.0 13.5s 2 1 0.9 0.0 13.5s 2 1
PHOS 0.9 0.0 13s 2 1 0.9 0.0 13.5s 2 1
Hb A1c 0.5 0.0 13s / 22s
/R4s /14s
4 1 0.9 0.4 12.5s 4 1
Results : OPSpecs chart by EZ rules program
40

Comparison : Sigma metric & EZ rules program

TESTQC
SpecificationQC
Procedure
Ped Pfr Control Rule N R
Amylase 0.9 0.0 1 3.5s 2 1
Calcium 0.9 0.0 1 3.5s 2 1
Creatine kinase 0.9 0.0 1 3.5s 2 1
Total Bilirubin 0.9 0.0 1 3s 2 1
Direct Bilirubin 0.9 0.0 1 3.5s 2 1
Lactase dehydrogenase
0.9 0.01 3.5s 2 1
Phosphorus 0.9 0.0 1 3s 2 1
Hemoglobin A1C 0.5 0.3 1 3s / 22s /R4s /14s 4 1
Results & Discussion
42

Conclusion
Analytical performance verification (Precision & Accuracy) of the Cobas Integra 400 instrument were evaluated in 8 tests (Amylase, Direct Bilirubin , Total Bilirubin, Calcium, Hemoglobin A1c, Phosphorus , Creatine kinase and Lactate dehydrogenase)
Good within-run and between run precision were observed for all the tests.
Method comparisons demonstrated a good agreement with the systems used for comparison, coefficient value varying typically from 0.997 to 0.999 and error index plus and minus 1 to accept accuracy were observed for all eight tests.
The instrument performs well on many of the tests.
43

Quality Requirement, %CV, and %bias from all tests were used to determine what are the best control procedures to use for each test by using six-sigma and EZ Rules® as the QC design tools.
The majority of the tests (7 of 8) can be controlled with a single control rule with fairly wide limits and this rule would guarantee over 90% error detection and false rejection would go zero except HbA1c.
HbA1c is still hard to control since NGSP limits on these analyte are tight. So, in this test is going to need Max QC - "Westgard Rules" with at least 4 controls.
Conclusion
44

Acknowledgements
Dr. Tararat Khaokhiew47

Acknowledgements
All Staffs in the Center of Medical Laboratory Service, Faculty of Medical Technology, Mahidol University
Staffs from Roche Diagnostic company (Thailand). 46

Thank You For Your Attention

Support Units

Test %TE aAccuracy TE (PCCC1) TE (PCCC2)
Analytical performance
%BiasError index
%bias+1.65%cv
%bias+1.65%cv
TE<TE a
Amylase 30 1.21 -0.02 2.93 2.91 passCalcium 9.3 0.11 0.26 2.38 1.61 passCreatinine kinase 30 5.36 -0.40 7.21 7.06 passTotal Bilirubin 20 1.24 -0.02 6.72 6.53 passDirect Bilirubin 20 1.11 -0.40 3.49 3.59 passLactase dehydrogenase 20 1.20 0.28 4.91 4.38 passPhosphate 10.11 3.50 -0.11 5.48 5.03 passHemoglobin A1C 6 0.68 -0.49 3.41 2.71 pass
Results

Quality Control Planning
EZ rules program
Sigma metric
Analytical Performance Verification
Precision
•Within run
•Between run
Accuracy
•Comparison method

%CV < 0.25TEa
PASS
Results: Within Run Precision
Test 0.25TEa
TB 5
DB 5
CPK 7.5
LDH 5
CA 2.33
PHOS 2.5
AMY 7.5
HbA1c 1.5

%CV < 0.33TEa
PASS
Results: Between Run Precision
Test 0.33TEa
TB 6.6
DB 6.6
CK 9.9
LDH 6.6
CA 3.07
PHOS 3.34
AMY 9.9
HbA1c 1.98

Results: Accuracy
PASS

Results: Accuracy
PASS

% Bias for comparison method
Book of know why know how the vital prerequisite of clinical Laboratory Quality Control’s book ( Kulnaree Sirisali and congeries ))

Clinical Laboratory Improvement Amendments (CLIA)
National Glycohemoglobin Standardization Program(NGSP)
College of American Pathologists (CAP)
Biological Variation (BV)