analytics systems for anti-money laundering - school of computing
TRANSCRIPT
B. Comp. Dissertation
Analytics Systems for Anti-Money Laundering
By
Ruchi Bajoria
Department of Computer Engineering
School of Computing
National University of Singapore
2010/2011

ii
B. Comp. Dissertation
Analytics Systems for Anti-Money Laundering
By
Ruchi Bajoria
Department of Computer Engineering
School of Computing
National University of Singapore
2010/2011
Project No: H114270
Advisor: Prof Limsoon Wong
Deliverables:
Report: 1 Volume
Program: 1 Diskette

iii
Abstract
The use of automated analysis tools for data mining in the field of fraud
detection has become increasingly popular over the past few decades as a
result of the growth in data volumes. This project describes our approach
to learn and detect patterns in relational data using a graph representation.
We have developed a web application which allows users to search for
suspicious patterns in relational data through graphical query creation.
Our application uses graph-based mining to analyze the query pattern
consisting of relational links among clients and companies with the
purpose of finding matching sub graphs in the data. The system can
discover unknown and known patterns in data in the domain of anti-
money laundering. This could be a useful tool for credit card companies in
dealing with fraud prevention and monitoring.
Keywords:
Data Mining, Pattern Recognition, Anti-Money Laundering
Implementation Software and Hardware:
Windows 7, Adobe Flash Builder 4.0, Flex 4, Action Script 3.0, PHP,
Apache HTTP Server, MySQL Database

iv
Acknowledgement
This final year thesis has been written at the National University of Singapore. My
topic, which was part of a more comprehensive project at the Institute for
Infocomm Research (I2R), has been both enriching and challenging. The
experience I have obtained from this project is priceless to me. I would like to take
this opportunity to express my gratitude towards some people who have
significantly helped me throughout this final year project and beyond.
First, I would like to thank Professor Wong Limsoon at National University of
Singapore for his valuable supervision during this project. I would like to express
my regards to Mr Soh Cheng Lock Donny and Mr Tew Kar Leong from I2R for
their generous help, discussions and guidance in shaping the project. I also thank
Miss Luo Xueqi Annaliese at Fusionopolis and Miss Pamela Lim Mai Fun, Miss
Tan Poh Suan at National University of Singapore for coordinating this Final Year
Project for their help in managing the administrative affairs.
Lastly, this project would not have been possible without the huge contribution of
my classmate Linxiang Du who worked on this project along with me.

v
Table of Contents
Title .......................................................................................................................... ii
Abstract ................................................................................................................... iii
Acknowledgement .................................................................................................. iv
Table of Contents ..................................................................................................... v
List of Figures ........................................................................................................ vii
1 Introduction ........................................................................................................... 1
1.1 Objective ........................................................................................................ 1
1.2 Chapter Guide ................................................................................................ 3
2 Background ........................................................................................................... 4
2.1 Problem Definition ......................................................................................... 4
2.2 Motivation ...................................................................................................... 5
2.3 Possible Uses .................................................................................................. 5
3 Design ................................................................................................................... 6
3.1 Proposed Approach ........................................................................................ 6
3.2 Illustration of Examples ................................................................................. 7
3.3 User Interface Design Criteria ........................................................................ 9
3.4 Graph-mining Algorithm .............................................................................. 11
4 Implementation ................................................................................................... 12

vi
4.1 Application Setup ......................................................................................... 12
4.2 Application Workflow .................................................................................. 14
4.3 Graphical User Interface .............................................................................. 17
4.4 Iterative development of interface ................................................................ 17
5 Analysis ............................................................................................................... 19
5.1 Results and Interpretation ............................................................................. 19
5.2 User Feedback .............................................................................................. 21
5.3 Related Work ................................................................................................ 22
6 Summary ............................................................................................................. 25
6.1 Problems Encountered .................................................................................. 25
6.2 Limitations.................................................................................................... 26
6.3 Recommendation for future work ................................................................ 27
6.4 Conclusion .................................................................................................... 28
References .............................................................................................................. 29
Appendix A – How to install the program ............................................................. 30
Appendix B – CD Contents ................................................................................... 32

vii
List of Figures
Figure 1 Graph with a single node ........................................................................... 7
Figure 2 Graph with a single relation and two nodes .............................................. 7
Figure 3 Graph with several nodes and relations ..................................................... 8
Figure 4 The input and output format of our graph-mining algorithm .................. 11
Figure 5 Compilation process from Adobe Flash Builder IDE to Flash .swf ........ 12
Figure 6 Architecture diagram of the application .................................................. 13
Figure 7 Sample Query Graph ............................................................................... 14
Figure 9 Pairs of relations searched at the backend for forming results ................ 15
Figure 10 Structure of XML file passed from the interface to the backend .......... 15
Figure 11 Initial interface of our application ......................................................... 17
Figure 12 Final Interface of our application .......................................................... 17
Figure 13 Graph query of two persons living at same address .............................. 18
Figure 14 A relation graph with 2 persons and 1 Address ..................................... 19
Figure 15 Average response time vs. number of edges ......................................... 20
Figure 16 An i2 product to identify key individuals within target networks with
Social Network Analysis ........................................................................................ 21

viii

1
Chapter 1 1. Introduction
1.1 Objective
Money laundering is a way by means of which people, groups or organizations can
conceal the origin or destination of their financial transactions. Traditionally, these
transactions are not transparent and hence the practice is illegal. Most financial
institutions, for example, credit card companies, today are faced with issue of
combating this serious problem. These companies have a requirement to monitor
and report transactions of a suspicious manner to an investigation unit. For
instance, a credit card company should verify every customer’s identity and track
their transactions for possible fraudulent activities such as money laundering. For
this purpose, these financial institutions collect data about their clients and their
transactions.
Data mining applications are often deployed in this field since the amount of data
to be scrutinized is vast. Often the relevant information is hidden within massive
amounts of irrelevant data and appears harmless when studied individually (K. A.
Taipale, 2003). Traditional methods of information retrieval from a relational
database using simple SQL queries alone are not capable of detecting such hidden
patterns. Hence, the need for data mining arises to discover new knowledge in
existing data.

2
This project explores the use of graph-based data mining in anti-money laundering
practices. We have developed an application which uses such analysis for fraud
detection by recognizing patterns within a prevalent set of relational data. A user
can define a desired query graph pattern to detect a potential money laundering
activity and the system will provide the data that matches such a pattern.

3
1.2 Chapter Guide
Chapter 2: Background
This Chapter includes a brief definition of the problem at hand and the data mining
technique we use in this project. We also discuss the motivation and the
applications of our project in the finance industry.
Chapter 3: Design
This Chapter provides an overview of our proposed approach with illustrative
examples. We also discuss the interface design criteria used for this project and
short description of the searching algorithm used for this project.
Chapter 4: Implementation
This Chapter describes the selection of software specifications, the creation and
design of the user interface and other aspects of the implementation phase of the
project.
Chapter 5: Analysis
This chapter provides an analysis of the project in terms of its overall
performance. We discuss user feedback obtained and present a comparative study
of the software with relevant existing work.
Chapter 6: Summary
This chapter provides a summary of the entire project with a conclusion.

4
Chapter 2
2. Background
2.1 Problem Definition
The application of automated analysis and knowledge discovery helps to reveal
relationships among data that was earlier unknown and may be potentially useful.
A significant problem in data mining for fraud detection is that often the relevant
information is hidden within vast amounts of irrelevant data and appears harmless
when studied individually. With the rapid increase in the amount of data collected
by companies on activities of their customers, it is sensible to utilize the massive
volumes of data with a tool which automatically analyses and extracts useful
knowledge from it.
In the context of financial fraud detection, the purpose of data mining is to isolate
frequently repeated patterns of activity (for example, not paying taxes) which may
help organizations in further predicting and tracking down future suspicious
behaviour. Simple methods of information retrieval for identifying unusual
activity in data may not be as useful in the current world as much of the
information may go unnoticed when studied in isolation or may in fact hold no
meaning unless studied in relation of their link to other data.
Therefore, to discover useful patterns in data the systems must uses existing
databases containing customer information and employ advanced mining

5
techniques to identify and analyze known and unknown patterns. One such
technique is graph-based mining.
2.2 Motivation
This project led to the development of a system to sieve out fraud circles
by filtering their relations with other entities in the dataset. This project
can be further improved and used in banks in order to allow banks to
adhere to their KYC (Know Your Customer) and AML (Anti Money
Laundering) compliances.
The main goal for this project sprung from a desire this solve an important
real-world problem. Additionally this project is an excellent platform to
get a first-hand experience of the crucial skill of product design. This
project was an ideal opportunity to develop a broad understanding of
interfacing between business needs and technological capabilities.
2.3 Possible Uses
The resultant program from this project and the techniques used to achieve this
have several possible uses. The application itself with further development would
be a useful tool for pattern recognition and to help financial organizations in
detecting and preventing fraud. The techniques used in our application would be
useful for other similar applications. With some modifications, the application
would be even usable on mobile devices and PDA. Overall, this project and its
research have many benefits for future development.

6
Chapter 3
3 Design
3.1 Proposed Approach
The data that we use for our project has been obtained from a bank, and
consists of “anonymized” information about real clients (both people and
companies) and the relationship among these clients. The data is stored in
SQL as a relational database in binary form. In this project, we use a
graph query representation to provide an effective visualization of
complex patterns.
A node in the query graph is an entity that the user is searching for, e.g. a
person or a company and a connecting edge implies a relation between
two entities. The nodes have defining attributes and the edges have types.
For example, a “person” node can have attributes like: First Name, Last
Name, Position, Passport Number and so on. Similarly, an edge between a
“person” node and a “company” node may have the type “Founder”
implying that the person is a founder of the company. The purpose of
attributes is to help the user specify details of a pattern they are looking
for. In such a setting, we want to find sub graphs that match a user-defined
query pattern.

7
3.2 pr Illustration of Examples
In this section we construct some examples to demonstrate how our
system will analyze scenarios with different structures of query graphs:
• Graph with a single node
Figure 1 Graph with a single node
In this example, the user is looking for a pattern of people who
satisfy the attributes specified for “person” node A. These
attributes may be the person’s title, location, country of origin and
so on. This node could even be a company where the attributes
would be different. In this case, our application will query the
database for people who match this pattern in terms of the
attributes alone, irrespective of their relation with other data.
• Graph with a single relation and two nodes
Figure 2 Graph with a single relation and two nodes
In this example, the user is looking for a pattern where a person
has founded a company. Similar to above case, the user may
further specify the attributes for the two nodes which will further
A
A B
Founder

8
provide more relevant results. In this case, our application will
query the database for a person-company pair which matches this
pattern in terms of the attributes and the relationship “Founder”.
• Graph with a several nodes and relations
Figure 3 Graph with several nodes and relations
In this example, suppose we have the following attributes for the nodes above:
A: Is the “Founder” of company B
B: Is a company located in Singapore
C: Is a “Director” at company B who owns company C
D: Is a company in Japan
For such a graph, the script on the application server will search for each
relation that is represented as a connection between two entities. The
query output is then consolidated to form a further reduced set of results.
Similarly, another query could help spot a money laundering circle.
Although it seems feasible to use standard SQL to address this problem, if
exact match does not exist, SQL will not be able to approximate an
answer. On the other hand, if there are many exact matches in SQL, it
A
B
C D
Founder Director
Owner

9
would be worthwhile to automatically rank them in order of a scoring
function. In some cases, exact matching may not reveal the best possible
answer. Our method can be improvised by ranking exact matches as well
as the other connections present among nodes.
3.3 User Interface Design Criteria
In any software, the graphical user interface (GUI) is the first thing a user
will see when he/she run the application and hence it is extremely
important for the interface to attract the user’s attention. The second most
important factor for a GUI is to be intuitive or easy to use. The design of a
system which is intuitive and efficient depends on a variety of factors
including usability, performance, reliability, functionality, innovation
among others.
In the recent years, more emphasis is being laid on the quality and
usability of web user interfaces. Since all software is made for a certain
target group of users, it is essential that the intended users be able to
understand the basic functionality of the software and use the menus and
interface without a manual. If the graphical user interface is not intuitive
and efficiently designed, the software isn’t likely to become very popular.
For this project, the GUI was a very significant part. As this project is
concerned with constructing and editing graphical query structures, it was
necessary that the GUI be user-friendly and simple. It is for this reason
that in the early stages of the development cycle, a research was
conducted to assimilate the essential and important features for designing
a good GUI. A strong emphasis has been laid on the conceptualization and

10
prototyping of the interface before delving into the implementation. To
evaluate the initial design, a consultation was carried out with the help of
research papers and feedback. We wanted to make out interface
interactive and simple while maintaining high coding standards.
To develop a user interface for this project we decided to follow available
principles on user interface design and summarize the common criteria
listed in the selected papers we studied. The three main principles which
must be followed to design a good user interface (John D. Gould and
Clayton Lewis, 1985) are:
• Early Focus on Users and Tasks
As a designer, it is important to identify the users of a system and
the scope of the field the software will be used in.
• Empirical Measurement
The use of prototypes and mockups during development phase is a
good practice.
• Iterative Design
The software must be tested and fixed in small cycles as the
development proceeds. The paper mentions that iterative
development cycles.
While these principles are helpful and intuitive, they are not enough to
ensure a good interface design. These guidelines only direct the designer's
attention to the common issues which must be considered. In reality,
however, there is no one approach to user interface design. The user
interface features depend on each individual system and the intended

11
users. A good design maintains a trade-off between several conflicting
features.
3.4 pr Graph-mining Algorithm
Given a query pattern like below, our algorithm will match the pattern with the
entire set of the relational database and output the resulting sub graphs which
match the pattern.
Figure 4 The input and output format of our graph-mining algorithm
In the example shown, the left column indicates the query graph pattern. On the
right, the circled pairs of nodes are the matching sub graphs in the database that
form the output of the pattern recognition algorithm in our application. As we can
observe here, the input does not need to be complete graph but in the actual
database, there may be other relations to this sub graph.
A B
Co-worker
Input Output

12
Chapter 4 4 Implementation
4.1 Application Setup
The data for our application is kept back on the application server and the
necessary processing for the user interface is done on the web client. The
scripting at the server end is done using PHP. We use an Apache HTTP
server for our application deployment. The interface is developed on
Adobe Flash Builder IDE using a programming language (Action Script),
an XML language (MXML) and the Flex library. The following diagram
provides a better overview of how the application was developed:
Figure 5 Compilation process from Adobe Flash Builder IDE to Flash .swf
Adobe Flash Builder

13
The application can be run in a web browser and hence does not require any
software installation. So far, we have tested the interface to work on the following
browsers: Internet Explorer, Google Chrome, and Mozilla Firefox.
The browser must have Adobe Flash Player installed on it so as to be able to use our application. The interface communicated with the web server through the browser and the internal exchange of data is done by using the HTTP Service in Flex. The components used for developing the interface were obtained from various Flex libraries.
Figure 6 Architecture diagram of the application

14
4.2 Application Workflow
Figure 7 Sample Query Graph
Let us consider the example attributed query graph shown above. Given
this graph, we want to find all such entities in the database where this
pattern applies. Once the user has created the above query graph in the
interface and specified the relations, he/she can then search for this pattern
in the database.
This can be done by clicking a search button on the left accordion panel.
When the user clicks this button, an ActionScript method is called which
will generate the XML document for the query and invoke the PHP script
on the application server. Each link between two entities in the query
graph represents a relation that the script would query the database for.
For a given set of relations the script would individually query each
relation and take the union of the results obtained to form the final output.
For example, the relations to search for in this graph are A-B, B-C and B-
D. These results are then consolidated using a join algorithm in the PHP
script to form sets of matching data.
A
B
C
D

15
Figure 8 Pairs of relations searched at the backend for forming results
The query data is passed to the application server as an XML file with
parallel structure. The information is passed as node pairs that form a
relation and nodes may be repeated for various relations that it is a part of.
A sample relation tag node is shown here:
Figure 9 Structure of XML file passed from the interface to the backend
<relation>
<type> Founder</type> <company>
<Tag>Node1</Tag> <Name> … </Name> <Type> … </Type> <Industry>…</Industry> <Location>Singapore</Location> <Found_Year> …. </Found_Year> <Employees>…. </Employees> ……
</company> <person> <Tag>Node2</Tag> <Last_Name>… </Last_Name> <First_Name>… </First_Name> <Position>… </Position> <Age>…</Age> …….
</person> </relation>
A B CA B A B B B D

16
4.3 Graphical User Interface
In this project, we mainly focused on two features of the user interface:
presentation and usability. The presentation of the data in an understandable
manner is much more valuable than putting the data onscreen and letting the user
try to decode it. As one of my main contributions to the project was designing the
user interface, I was working extensively to create mock-ups for the interface and
rework on the initial interface design.
4.4 Iterative Development of interface
In order to demonstrate that the interface for this project went through an
evolution cycle before it reached its final design, two particularly significant
designs are included. In the two figures displayed below, the first one is the
original design and the second is the modified final design. While both the
interfaces were developed with the intent of simple and functional design, the
second is much more refined and interactive.
In the figure below, the drawing area provided to the user for the graph is quite
small and much of the screen space is not effectively utilized. The layout seems
quite plain and not very intuitive. The table on the right side of the interface was
meant for displaying the results of the searched patterns.

17
Figure 10 Initial interface of our application
In the later stages of design, much of the similar user interface elements were
consolidated. This helped to produce a cleaner design with little clutter and more
space for the user to draw the graph. We used collapsible accordion panels for
rich interactions.
Figure 11 Final Interface of our application

18
Chapter 5 5 Analysis
5.1 Results and Interpretation
In the initial stages of development, we created a web interface which
communicated with the database through a method called URL passing. In
this method, the query information is appended to the URL string. On the
server, a PHP script simply extracts all the information from the URL uses
the information to form a SQL query. The obtained results were passed
back to the web interface encapsulated in XML format. With a complex
relation graph, there are more than one ways to interpret it and each
different interpretation may lead to a different set of expected results.
Figure 12 Graph query of two persons living at same address

19
In the above example, we have a query graph with a house where two
people live. This graph can be decomposed into two person-house
relations with all the information constraints specified. Our interface will
identify all houses with at least these two people in it and each of the
people must satisfy the criteria mentioned.
With a complex relation graph, there are more than one ways to interpret
it and each different interpretation may lead to a different set of expected
results. For instance, in the example shown earlier there is another
possible interpretation. The example can also be interpreted either as a
house that has exactly these two people living in it and no more. In this
interpretation, we are also concerned with other members living in the
house. Thus, it is evident that the interpretation varies with the focus of a
query. If we are searching for all the people that share a house with a
particular person, instead of querying for a house that accommodates only
these two people, the number of people living in the house would be
irrelevant. In our final implementation, we have used the interpretation
described in example below as it appear more intuitive to us:
Figure 13 A relation graph with 2 persons and 1 Address
The above graph has entities A, B, C with edges {A, B} and {B, C}. In
our interpretation, A! = C. There may be other entities that are not
included in this graph which have relations with these entities but we are
not concerned with those since that has not been specified in this query.
For example, there may be another person D also living at the same
address, where A! = D and C! = D.
A B C

20
5.2 User Feedback
As we have used graphs as a visualization medium in our project to make
it more user-friendly, it is important to consider whether the interface and
medium used in our project is intuitive and expressive. These features
help us to evaluate the overall usability of our application and help guide
us in the path for future improvements. We asked users to record the
response time for certain graphs and based on their data, below is the
indicator of our application’s performance:
0
20
40
60
80
100
120
1 2 3 4
Performance
Figure 14 Average response time vs. number of edges
We discovered that on the whole, first-time users were quite satisfied with
most of the features and performance of our application and found it easy
to learn and use. The focus of future development in this project should be
based on the areas where users find less satisfying and still use often. This
user feedback exercise helped us to collate qualitative information
regarding further improvisation and a review of the application interface
from a user perspective.
Edges in graph
Average response time (sec)

21
5.3 Related Work
We have found that a company named i2 (a provider of intelligence and
investigation management software for defense and security) has done
similar work in the area of financial fraud detection. Their fraud solution
helps analysts to search multiple data sources simultaneously, find hidden
links and entities, and visualize transactions and timelines.
Figure 15 An i2 product to identify key individuals within target networks with
Social Network Analysis
The technique they have applied is social network analysis (SNA). SNA is
an approach where the structure of relations among entities such as
people, organizations, and locations and so on is examined. It emphasizes

22
on the linkages between these nodes and is geared towards uncovering
patterns of interaction in these linkages. The most distinguishing feature
of this technique is the assumption that all people are interdependent. It is
possible to unveil the structure of a network by observing the relational
patterns among entities. Similarly, the same idea can be extended to a
criminal network where a relationship between nodes aids in identification
and detection of patterns in communication.
The study of social networks and linkages can prove particularly helpful
in the credit card industry in combating collaborative fraud circles. SNA
can be utilized to reveal fraud patterns based on the information that links
fraudsters and help to reveal hidden criminal connections. This produces a
more sophisticated fraud detection process. An interactive reporting
system enables investigators and analysts to query data and search for
interesting or unusual connections.
Another related paper on pattern-matching in attributed graphs (H. Tong
et al., 2006) uses an algorithm which searches for inexact matches based a
graph input pattern. The paper describes a method where near-matches are
returned and ranked in order of “goodness”. This is a feature which we
wanted to incorporate in our application as a scoring function. However, it
is still in development at this stage.

23
Chapter 6 6 Summary
6.1 Problems Encountered
In the development phase, we encountered situations where certain
scenarios could be represented as a network on the interface but proved
challenging to query with our scripting algorithm. While we are able to
successfully match positive patterns in the data, finding outliers posed an
enhanced level of difficulty.
For example, if we want to find all the people in Germany who have never
paid taxes, we would need to modify our interface to incorporate negated
relations between nodes.
The outlier detection approach tackles this problem better as it is designed for
identifying unusual patterns in data (Martijn Onderwater, 2010). While such
scenarios are not so challenging to represent visually, to process it in the server
requires significant modifications in our existing algorithm in future.

24
6.2 Limitations
In this section, some of the main limitations of the approach used in this
project are described.
• Inaccuracy in data
If the data collected in the database be incomplete, the accuracy of the
discovered patterns can be compromised. Data cleaning techniques, more
sophisticated statistical methods to identify hidden attributes and their
dependencies, as well as techniques for identifying outliers are therefore
required.
• Presentation of the discovered patterns
In most of the applications, it is important to represent the discovered
patterns in more human understandable form such as visual or graphical
representation. In this project, we did not have sufficient time to develop a
sophisticated representation technique for displaying our results and hence
we used a simple table representation.

25
6.3 Recommendation for future work
In this section, some areas for improvement of our project are described.
• Adaptability for constantly evolving data and knowledge base
In the context of credit card companies, the transactional data collected is
increasing on a daily basis and hence it may render some previously
discovered patterns invalid. Also, the attributes recorded for a given
database may be changing with time. A good improvement would be to
include incremental learning techniques to handle these cases. This may
also be done by allowing a user to input the database to search for patterns
in.
• Adaptability for different kinds of mining from the same data
Different users may be find different kinds of knowledge relevant
depending on the context. Thus, it would be beneficial if the system could
allow for a wider scope of analysis and pattern detection scenarios. The
negation case described earlier would be a significant addition to the
application.
• Ranking of results
For some query graphs there may be many exact matches in SQL. Our
application does not implement any method to rank these results in order
of relevance. Including a scoring function in the application would be a
very helpful improvement to our algorithm.
26
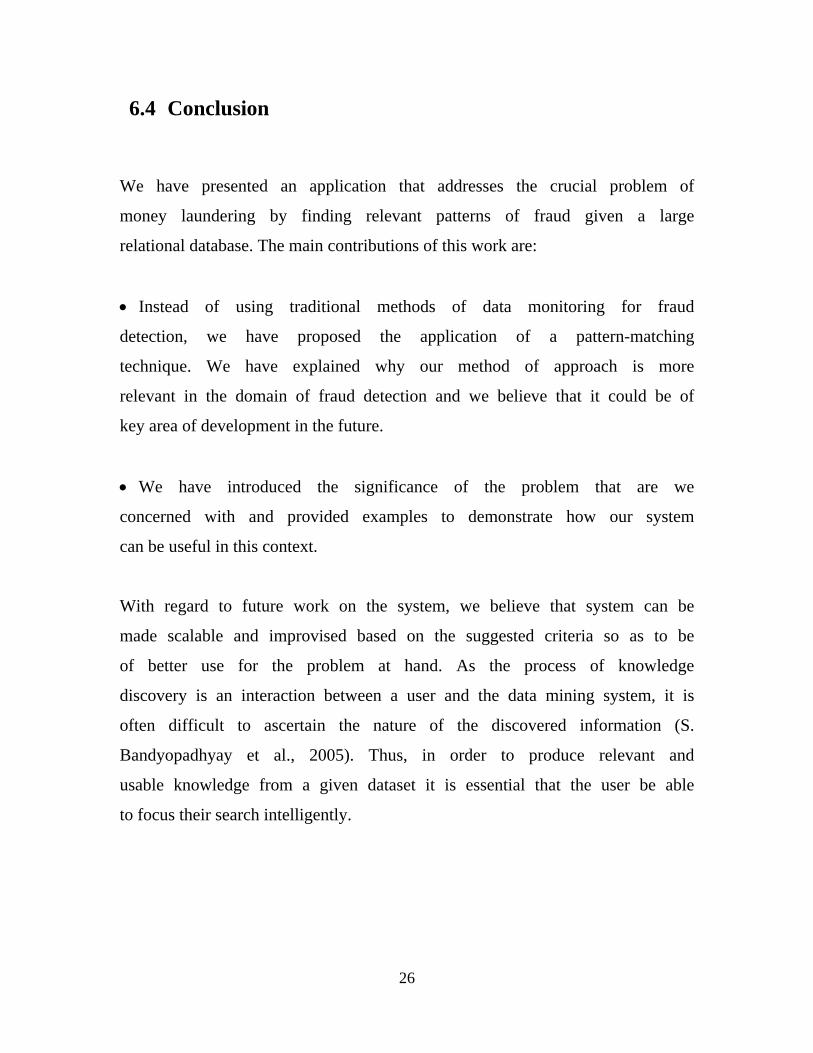
6.4 Conclusion
We have presented an application that addresses the crucial problem of
money laundering by finding relevant patterns of fraud given a large
relational database. The main contributions of this work are:
• Instead of using traditional methods of data monitoring for fraud
detection, we have proposed the application of a pattern-matching
technique. We have explained why our method of approach is more
relevant in the domain of fraud detection and we believe that it could be of
key area of development in the future.
• We have introduced the significance of the problem that are we
concerned with and provided examples to demonstrate how our system
can be useful in this context.
With regard to future work on the system, we believe that system can be
made scalable and improvised based on the suggested criteria so as to be
of better use for the problem at hand. As the process of knowledge
discovery is an interaction between a user and the data mining system, it is
often difficult to ascertain the nature of the discovered information (S.
Bandyopadhyay et al., 2005). Thus, in order to produce relevant and
usable knowledge from a given dataset it is essential that the user be able
to focus their search intelligently.

27
References
[1] K. A. Taipale. Data Mining and Domestic Security: Connecting the Dots to
Make Sense of Data. (2003).
[2] Inokuchi, A., Washio, T., Motoda, H.: Complete Mining of Frequent Patterns
from Graphs: Mining Graph Data. (2003), pp. 321–354.
[3] John D. Gould and Clayton Lewis. Designing for Usability: Key Principles and
What Designers Think. (1985).
[4] H. Tong, C. Faloutsos, B. Gallagher, and T. Eliassi-Rad. Fast best-effort
pattern matching in large attributed graphs. In KDD ’07: Proceedings of the 13th
ACM SIGKDD international conference on Knowledge discovery and data
mining, NY, USA, pp. 737–746.
[5] S. Bandyopadhyay, U. Maulik, Lawrence B. Holder and Diane J. Cook.
Advanced Methods for Knowledge Discovery from Complex Data. (2005).
[6] Martijn Onderwater. Detecting unusual user profiles with outlier detection
techniques, September 2010

28
Appendix A
How to install the program
To run the program, you will need to install a local Apache HTTP Server
along with MySQL and phpMyAdmin on your computer. You may install
them individually but we recommend using XAMPP. Alternatively, you
can also deploy the application on your own web server. This application
has been developed and tested in Windows alone, so there may be
potential issues on other operating systems.
How to install a local server:
Please download the XAMPP installer from “http://www.apachefriends.org/en/”
suitable for your operating system. Follow the steps to install XAMPP at a desired
location on your computer.
How to set up the database:
Access the URL "https://localhost/security/xamppsecurity.php" to set the
password for user "root" to "password". This is need to login to the database
admin on the server.
To set up the required database for the application, please navigate to the
URL "https://localhost/phpmyadmin/" and login with username as "root"
and password as "password".

29
Once logged in, create a new database called "searchdatabase" and import
the file "searchdatabase.sql" which is provided in this application folder.
Where to place the application web content:
The main directory for all WWW documents is \xampp\htdocs. Put the files
"connection.php", "pairwise.php" and "initialize.php" in this directory.
Make a new subdirectory for the application (e.g. "Application") inside the
directory "\xampp\htdocs". Copy all the remaining contents from folder “Search”
on the CD to this subdirectory. You can now access and use the application by
navigating to "https://localhost/Application/Search.html".

30
Appendix B
CD Contents
The attached CD contains a working version of the completed application.
It also contains the source code for the program and instructions on how
to install and run the program. The “Final Year Project” folder in the CD
contains the following:
ProjectReport.pdf
A PDF version of this report, viewable in Adobe Reader.
Source Code folder
This folder the complete Adobe Flash Builder project files. These files can
be imported to a new project in the Adobe Flash Builder 4 IDE and used
for further development.
Installation Details Folder
This folder contains all the necessary files to run the application and
instructions on how to deploy it on a web server. The following is a list of
the folders contents in more detail:
Readme.txt
This file contains the same instructions as Appendix A on how to install a
local web server and how to set up the application files on it.

31
Searchdatabase.sql
This is a script file which contains the schema of the database that is used
by the application and the populated data as obtained from our industry
partner.
Search Folder
This folder contains all the files, PHP scripts and images required to run
the application on a local web server.