analyzing and classifying energy consumption in …analyzing and classifying energy consumption in...
TRANSCRIPT

Analyzing and Classifying Energy Consumptionin Android Applications
Marco Coutoa,b, Jacome Cunhac,b, Joao Paulo Fernandesd, Rui Pereiraa,b, Joao Saraivaa,b
aUniversidade do Minho, PortugalbHASLab / INESC TEC
cUniversidade Nova de LisboadRELEASE, Universidade da Beira Interior, Portugal
Abstract
The use of powerful mobile devices, like smartphones, tablets and laptops, is changing the way pro-grammers develop software. While in the past the primary goal to optimize software was the run timeoptimization, nowadays there is a growing awareness of the need to reduce energy consumption.
This paper presents techniques and tools to detect anomalous energy consumption in Android appli-cations, and to relate it directly with the source code of the application. We present a methodology toclassify program execution and program methods according to the energy consumed. Thus, we monitoredand analyzed the results of energy consumed by a corpus of Android applications, and we defined greenawareenergy thresholds. Such thresholds are used to classify program methods according to energy consumption.Moreover, we manually inspect the source code of both energy efficient and inefficient methods and weidentify program features that influence energy consumption.
Keywords: Green Software Computing, Energy-Aware Software, Source Code Analysis
1. Introduction
The software engineering and programming languages research communities have developed advancedand widely-used techniques to improve both programming productivity and program performance. For ex-ample, they developed powerful type and modular systems, model-driven software development approaches,integrated development environments that, indeed, improve programming productivity. These communitiesare also concerned with providing efficient execution models for such programs, by using compiler-specificoptimizations (such as, tail recursion elimination), partial evaluation [1], incremental computation [2], just-in-time compilation [3], deforestation and strictification of functional programs [4, 5, 6], for example. Most ofthose techniques aim at improving performance by reducing both execution time and memory consumption.
While in the previous century computer users were mainly looking for fast computer software, this isnowadays changing with the advent of powerful mobile devices, like laptops, tablets and smartphones. Inour mobile-device age, one of the main computing bottlenecks is energy-consumption. In fact, mobile-devicemanufacturers and their users are as concerned with the performance of their device as they are with batteryconsumption/lifetime.
This growing concern on energy efficiency may also be associated with the perspective of software de-velopers [7]. Unfortunately, developing energy-aware software is still a difficult task. While programminglanguages and their programming environments/compilers provide several compiler optimizations [8], de-buggers and fault localization tools [9], memory profiler tools [10, 11], testing tools [12, 13, 14], refactoring
Email addresses: [email protected] (Marco Couto), [email protected] (Jacome Cunha), [email protected] (JoaoPaulo Fernandes), [email protected] (Rui Pereira), [email protected] (Joao Saraiva)
Preprint submitted to Science of Computer Programming September 13, 2016

tools [15], benchmark and runtime monitoring frameworks [16], there are no equivalent tools/frameworks toprofile/optimize energy consumption.
In this paper we propose a methodology to monitor and detect anomalous energy consumption for theAndroid ecosystem: a widely used ecosystem for mobile devices. More precisely, our methodology aims atproviding Android application developers techniques and tools to analyze and localize in the software sourcecode abnormal energy consumption. We propose a three layer methodology to monitor energy consumptionand to relate it to different executions of an Android application:
• Firstly, we reused and adapted the power tutor framework that provides a precise energy consumptionmodel for the Android ecosystem [17]. This is an open source model that considers all major hardwarecomponents of an Android device, which includes cpu, gps, wifi, etc. It is also able to calculate not onlythe total amount of energy consumed by the device, but also the energy consumed by each runningapplication individually. Although power tutor was developed as a stand alone software tool, we haveupdated its source code so that it can be used as an API to monitor the energy consumption of anAndroid application that invoked it.
• Secondly, we develop an Android application that automatically instruments the source code of a givenAndroid application the developer wishes to monitor its energy consumption. The instrumentationis performed by embedding calls to an API, which stores the information of the method when it isinvoked. This is then used to generate a program trace for each program execution.
• Thirdly, we use a testing framework for Android applications in order to execute the (previouslycompiled) instrumented application. For each execution of a test case, we collect the consumed energy(obtained using the calls to the power consumption model API), the runtime execution of each test,and the methods call tree (the program trace).
For different executions of an application, this methodology per se allows the monitoring of energyconsumption only. In order to locate abnormal energy consumption in an application, however, we need tocompare the different executions. Different program executions have different energy consumption, and wedefine an energy-wise classification of program executions which considers four levels: red, orange, yellow,and green, where red is the most energy inefficient program execution and green the most efficient one. Todefine proper energy thresholds for those four categories, we have instrumented and monitored the energyconsumption of a corpus of open source Android applications together with their test cases.
The methodology that we now propose extends our previous work [18] where we presented a simplermethod-classification algorithm: for a given application, a method was considered as having an abnormalenergy consumption whenever it was called in a program execution consuming more energy than the averageof all monitored runs of that application. As a consequence, that approach compares energy consumption ofdifferent executions, but only within the scope of the same application. Now, the use of a corpus to definethe classification thresholds avoids this limitation.
To validate our methodology, we analyze in detail the energy consumption of two Android applications.According to the automatic (energy-wise) classification of their test case executions, we manually inspectthe methods associated with purely green and red executions. The aim is to identify source code featuresthat do influence energy consumption. Our results show that:
1. green methods usually consists of few lines of loop-free statements and with few invocations of othermethods;
2. red methods are methods with more (when compared to green methods) lines of code that include theuse/manipulation of recursive data structures (collections or arrays) and that access to databases orhold HTTP connections.
Finally, we have implemented our methodology in our GreenDroid framework: one tool was developedto automatically instrument the source code of an application whose developer wishes to monitor in termsof energy consumption. A second tool performs the monitoring of the previously instrumented application:it executes it with a given set of test cases and updates our method classification thresholds.
2

This paper is organized as follows: Section 2 presents the Android power consumption model. We alsodetail the changes made to the power tutor consumption model so it can be used to monitor power consump-tion at the source code level, as well as the changes which the framework applies to the application sourcecode. In Section 3 we describe our techniques to automatically classify program executions and method interms of energy consumption. Section 4 introduces the GreenDroid framework, which automatically instru-ments Android applications, given their source code, and monitors its energy consumption by executing itwith test cases. In Section 5 we analyze in great detail the results produced by our techniques giving twoandroid applications. Moreover, we discuss the source code features of methods associated to green and redexecutions. Finally sections 6 and 7 present the related work and the conclusions, respectively.
2. Energy Consumption in Android Source Code
Modern programming languages offer their users powerful compilers, which include advanced optimiza-tions, to develop efficient and fast programs. Such languages also offer advanced supporting tools, such asdebuggers or execution and memory profilers, so that programmers can easily detect and correct anomaliesin the source code of their applications.
We begin this section by briefly discussing the Android power consumption model [17]: This is a staticallycalibrated model that considers the energy consumption of the main hardware components of a mobile device.Afterwards, we present our approach which uses/adapts the previously defined power consumption model,to be the building block of an energy profiling tool for Android applications. The idea is to offer Androidapplication developers an energy profiling mechanism, very much like the one offered by traditional programprofilers [10, 11]. This is to say that we wish to provide a methodology, and respective tool support,that automatically locates, within the source code of the application being developed, the responsible codefragments for abnormal energy consumption.
Our methodology consists of the following three steps:
1. the source code of the monitored application is instrumented with calls to the calibrated power model;
2. the instrumented version of the source code is compiled, and the resulting application is executed witha set of test cases;
3. the result of such executions are statistically analyzed in order to determine which packages/methodsare responsible for abnormal energy consumption.
These three steps are presented in the next three sections.
2.1. The Android Power Tutor Consumption Model and Calibration
We know that different hardware components have different impacts on a mobile device’s power con-sumption. As a consequence, an energy consumption model needs not only to consider the main hardwarecomponents of the device, but also its characteristics. Mobile devices are no different from other computerdevices: they use different hardware components and computer architectures that have completely differentimpacts on energy consumption. If we consider the CPU, different mobile devices can use very differentCPU architectures (not only varying in computing power, but also, for example, in the number of CPUcores), which can also run at different frequencies. The Android ecosystem was designed to support alldifferent mobile (and non-mobile) devices (ranging from smart-watches to TVs). As a result, a power con-sumption model for Android needs to consider all the main hardware components and their different states(for example, CPU frequency, percentage of use, etc).
There are several power consumption models for the Android ecosystem [17, 19, 20, 21, 22], that usethe hardware characteristics of the device and possible states to provide a power model. Next, we brieflypresent the power tutor model [17]: a state-of-the-art power model for smartphones [19]. The Power Tutor[17] model currently considers six different hardware components: CPU, Display, GPS, Wi-Fi, 3G and Audio,and different states of such components, as described next.
3

CPU. : CPU power consumption is strongly influenced by its use and frequency. The processor may run atdifferent frequencies when it is needed, and the percentage of usage can vary between 1 and 100, dependingon what is being done; There is a different coefficient of consumption for each available frequency usedby the processor. The consumption of this component at a specific time is calculated by multiplying thecoefficient associated with the frequency in use with the percentage of utilization.
Display. : The LCD display power model considers only one state: the brightness. There is only onecoefficient to be multiplied by the actual brightness level (that has 10 different levels).
GPS. : This component of the power model depends on its mode (active, sleep or off). The number ofavailable satellites or signal strength end up having little influence on the power consumption, so the modelhas two power coefficients: one to use if the mode is on and another to use if the mode is sleep.
Wi-Fi. : The Wi-Fi interface has four states: low-power, high-power, low-transmit and high-transmit (thelast two are states that the network briefly enters when transmitting data). If the state of the Wi-Fi interfaceis low-power, the power consumption is constant (coefficient for low-power state), but if the state is high-power the power consumption depends on the number of packets transmitted/received, the uplink data rateand the uplink channel rate. The coefficient for this state is calculated taking this into account.
3G. : This component of the model depends on the state it is operating on, similar to the Wi-Fi component.The states are CELL DCH, CELL FACH and IDLE. The transition between states depends on data totransmit/receive and the inactivity time when in one state. There is a power coefficient for each of thestates.
Audio. : The audio consumption is modeled my measuring the power consumption when not in use andwhen an audio file is playing at different volumes, but the measures indicate that the volume does notinterfere with the consumption, so it was neglected. There is only one coefficient to take into account if theaudio interface is being used.
2.1.1. Static Model Calibration
In order to determine the power consumption of each Android device’s component, the power model needsto be “exercised”. That is to say, we need to execute programs and tests that vary the variables of eachcomponents state (for example, by setting CPU utilization to highest and lowest values, or by configuringGPS state to extreme values by controlling activity and the visibility of GPS satellites), while measuringthe energy consumption of the device. By measuring the power consumption while varying the state of acomponent, it is possible to determine the values (coefficients) to include in a device’s specific instantiationof the model.
The Power Tutor framework provides a set of training applications that exercise the six hardware com-ponents considered on the model. These training applications were compiled by the Power Tutor developersand are used to calibrate the model for any Android device. Power Tutor uses a static model calibrationapproach: the training applications are executed in a specific device (which is instrumented in terms ofhardware) so that an external energy monitoring device1 is used to measure the energy consumption. Asdescribed in [17] this approach produces a precise model for the device being calibrated. Figure 1 shows thearchitecture of the calibration of the power model.
2.1.2. The Model as an API
In order to be able to instrument the source code of an application, with energy profiling mechanisms,we need to adapt the current implementation of power model described in Section 2.1. That power model isimplemented as a stand alone tool able to monitor executing applications. Thus, we needed to transform that
1A widely used devise is available at http://www.msoon.com/LabEquipment/PowerMonitor.
4

CPULCDWIFI
...
4,3; 3,42,4121; 20...
POWERMODEL
INSTANCEβfreq1;βfreq2
βbr
βwifi_l;βwifi_h ...
POWERCONSUMPTION
MODEL
TRAINING APPS
ANDROIDDEVICE
CALIBRATION APP
CPULCD
WIFI...
Figure 1: The architecture to calibrate the power model for different devices
implementation into an API-based software, so that its methods can be reused/called in the instrumentedsource code.
To adapt the power tutor implementation, we introduced a new Java class which implements the methodsto be used/called by other applications and respective test cases. Those methods work as a link interfacebetween the power consumption model and the applications’ source code which is to be monitored.
The methods implemented in the new Java class, called Estimator, and which are accessible to otherapplications are:
• traceMethod(): The implementation of the program trace.
• config(): Performs the initialization of auxiliary variables.
• start(): Starts the energy monitoring thread.
• stop(): Stops the energy monitoring thread and saves the results.
2.2. Source Code Instrumentation
Having updated the implementation of the power model so that its energy profiling methods can becalled from other applications, we can now instrument an application source code to call them.
In order to automatically instrument the source code, we need to define the code fragments to monitor.Because we wish to do it automatically, that is by a software tool, we need to precisely define which fragmentswill be considered. If we consider code fragments which are too small, for example a line in the source code,then the precision of the power model may be drastically affected: a neglected amount of energy wouldprobably be consumed. In fact, most approaches do not consider power consumption estimates at such afine grained level2.
On the other hand, we should not consider fragments which are too large, since this will not give aprecise indication where an abnormal energy consumption exists in the source code.
We choose to monitor application methods, as they are the logical code unit used by programmers tostructure the functionality of their applications. To automatize the instrumentation of the source code of an
2The exception is the use of an external device to measure energy [23, 24]. Since we wish to automatically analyze andclassify energy consumption in Android, the use of external devices for calibration is not an option: there are too many newdevices to calibrate at an almost daily rate!
5

application we use the JavaParser tool3: it provides a simple Java front-end with tool support for parsingand abstract syntax tree construction, traversal and transformation.
We developed a simple instrumentation tool, called jInst, that instruments all methods of all Java classesof a chosen Android application project, together with the classes of an Android test project. The behaviorof this tool is described in Figure 2.
INSTRUMENTED SOURCE CODE
ANDROID APP& TESTS
SOURCE CODE
mW???
DEVELOPERCPULCDWIFI
...
4,3; 3,42,4121; 20...
POWER MODELINSTANCE
jInstINSTRUMENTATION
TOOOL
<XML>
AndroidManifest File(App & Tests)
<XML>
InstrumentedAndroid
Manifest File(App & Tests)
Figure 2: The behavior of the instrumentation tool
jInst injects a new code instruction just before a return instruction (or as the last instruction in methodswith no return), as shown in the next code fragment:
public class Draw{
...
public int funcA (){
...
Estimator.traceMethod ("funcA", "Draw", Estimator.END);
return result;
}
This code injection allows the final framework to monitor the application, keeping trace of the calledmethods and consumed energy.
It is important to refer that not only is the Java source code instrumented. Since Android uses XMLto define, among other things, the name of the project, the version of the API used, the name of the testrunner, etc., we used the standard Java XML parser (DOM parser)4 as well, in order to edit some necessarydefinitions, which are:
3Java parser framework webpage: https://code.google.com/p/javaparser.4More information about DOM parser can be found here: http://docs.oracle.com/javase/tutorial/jaxp/dom/
readingXML.html.
6

• The name of the project (both for application and test project): this is needed so if the instrumentedprojects are opened in Eclipse IDE they do not generate name conflict with the original projects.
• The list of permissions given to the application (for the application project): needed to execute thePower Tutor API.
• The test runner (for the test project): the JUnit test runner needs to be different than the one bydefault. The next chapter will explain the reason behind this.
After the instrumentation of the application’s source code, jInst also updates the Android Manifest fileof both the application and test projects.
2.3. Automatic Execution of the Instrumented Application
After compiling the instrumented source code, an Android application is produced. When executingthis new application, the energy consumption metrics are produced. In order to automatically execute theapplication with different inputs, we use the Android testing framework5 which is based on jUnit.
The code injection made by jInst on the application source code is intended to produce the program trace,i.e., the list of methods invoked. Such program trace will be associated to each test execution. We also needto have consumption values, and for that each test needs to call the start() and stop() methods before/afterit is executed. Both jUnit and Android testing framework allow test developers to write a setUp() and atearDown() method, which are executed after a test starts and after a test ends, respectively. Given that,our jInst tool basically instruments those methods so we can measure the consumption for each test, asshown in the following example:
public class TestA extends ActivityInstrumentationTestCase2 <ActivityA >{
...
@Override
public void setUp(){
Estimator.config (" package", android.os.Process.myUid (), this.getContext ());
Estimator.start();
...
}
...
@Override
public void tearDown (){
Estimator.stop();
...
}
With this approach, we assure that every time a test begins, the Estimator.start() method is called.This method starts a thread to collect information from the operating system and then apply the powerconsumption model to estimate the energy to be consumed. The Estimator.config() method is necessary sincethe energy monitor needs to know the UID of the application being tested, for each test. The tearDown()method is responsible for stopping the thread and saving the results.
3. Energy-wise Classification of Tests and Methods
In the previous section, we introduced a technique to measure the amount of energy spent by an Androidapplication test execution. In this section, we will use this information to classify each test energy-wise.We will also introduce a technique to use this information to give some insight about the methods of theapplication to the programmer.
5Android testing web page: https://developer.android.com/tools/testing/index.html.
7

3.1. Classification of Test Executions
Knowing the exact energy consumption of a method or test is as important as understanding what suchconsumption means. As with household-electronics, where each new model is compared with its peers, wewant to classify a program execution, but in the context of other program executions. For instance, to saythat in a test execution the energy consumption is of 200 mW per second does not mean much. But to saythat its energy consumption is lower than the energy spent by 90% of the other tests does have a meaning:that such a test is good when compared to others. On the other hand, if its consumption is above 90% ofthe existing tests, then something is probably wrong.
To automatically classify test runs regarding their energy consumption, we will use a methodologyintroduced in Alves et al. [25] to classify source code using metrics. This methodology compares each sourcecode metric value, of the software under analysis, to the metric values of other software systems. For instance,it compares the size of a method with the size of the methods used in other systems of a software corpus.Usually, such corpus contains many different systems so it represents a wide variety of applications. Thismethodology allows the setting of thresholds to classify what a good or bad metric value is. This techniquehas also been successfully applied to find the thresholds for bad smells in spreadsheets [26]. We will use thistechnique to find the thresholds for low and high consuming tests. As in the previous applications of thistechnique, we will compare a given test run against a corpus of several other tests.
In our case we will be using 6 different applications: App Tracker, Catlog, Chord Reader, Connectbot,Google Authenticator, and News Blur. We consider these six applications because they were the only oneswhere both the source code and the test cases are available in open source repositories 6. Moreover, theycover different domains of mobile applications. Using the technique presented in the previous section, werun the available 193 tests of those six applications. We used a Sony xperia miro smartphone with 512Mb ofRAM and a 800 MHz Cortex-A5 CPU, running Android 4.0.4, build number 11.0.A.2.10, where the powerconsumption model was previously calibrated using the training applications. We present the quantiles ofthe energy consumption of these test executions, per second, per number of method calls, in Figure 3.
In Figure 3, we present the distribution of energy consumption for the tests that were executed using aquantile plot. We may observe, for example, that 50% of all test executions consume up to 0.6 milliwattsper second.As we can see, and as it happens in [25] and [26], the energy consumption of the test runs followsa power law distribution, with the highest variability in the tail. Thus, we use the same method to definethe thresholds, which are at 70%, 80%, and 90%. A test that fits below 70% is considered energy efficientand is classified as green, between 70% and 80% yellow, between 80% and 90% orange, and above 90% isconsidered energy inefficient and is classified as red.
In this case, 70% corresponds to an energy consumption of 1.8 mW/s, 80% to 3.4, and 90% to 10.2.Table 1 summarizes this information.
Table 1: Thresholds for energy consumption of test executions.
Quantile Energy Consumption Classification< 70% < 1.8 mW/s green70–80% 1.9–3.4 mW/s yellow80–90% 3.5–10.2 mW/s orange> 90% > 10.3 mW/s red
We have applied this methodology to 6 open-source Android applications whose test cases are alsoavailable. Because this methodology greatly depends on a representative corpus of the programming languagebeing analyzed, our classification should be updated as soon as new Android applications with associatedtest suites are available and/or analyzed by our tools.
6Although there are thousands of open source mobile applications available, unfortunately only a very few provide testcases.
8

0 0.2 0.3 0.4 0.5 0.6 1 1.8 3.4
10.2
88.9
0
10
20
30
40
50
60
70
80
90
100
0% 10% 20% 30% 40% 50% 60% 70% 80% 90% 100%
ener
gy c
onsu
ptio
n (m
W/s
)
quantiles
Figure 3: Quantiles of the energy consumption of test executions.
3.2. Methods’ Energy Consumption Information
We will now use the gathered information on the execution of the program tests to give some insightabout the behavior of each method of an application, to the programmer.
Our main goal is to guide the programmer to find the worst methods in terms of energy consumption. Tothis end, we devised a visualization of the gathered consumption information of the tests, including whichmethods were used in each test, and present it to the programmer. For each method, we calculate thenumber of times it was used in a green test, in a yellow test, in an orange test, and in a red test. This is thenrepresented as a vertical bar chart, where the y-axis represents the percentage of times a method was usedin each test type, and the x-axis represents each of the methods of the underlying application. Figure 47
represents this information for one method, getOidFromPkcs8Encoded, in the Connectbot application:In this case, we can see that this method was involved only in red and green tests; indeed, mostly in red
ones. This information alone is probably not too helpful, but when compared to other methods, it gainsanother importance. In Figure 5 we show all the methods of the Connectbot application:
In this application, we can see that the methods had a tendency to be involved in more red tests, andas such, we can consider this application to be a high consuming one (in fact this is the worst applicationwe used).
A second example is shown in Figure 6; here the application is the Google Authenticator.In this case, we can see that most methods tend to be on the greener side. In fact, form the corpus we
used, and for the tests that were available, this is the application that consumes the least amount of energy.
4. GreenDroid: An Android Framework for Energy Profiling
At this point, we defined how to adapt the consumption model to work as an API, what to instrumentin the source code in order to enable the monitoring of both execution trace and consumption, and howtests execution can be used to perform an automatic execution of the application under test.
Nevertheless, these are all independent tasks, and we want to include them all in one final tool thatexecutes them one after another. In this section, we will describe the work flow of that tool, GreenDroid8,from the first task (instrumentation) to the last one (displaying the results), explaining what each task isexpected to use as input and what to generate as output for the next one.
7Figures use colors and we assume they are visible through the digital version of this paper.8This tool is available at https://github.com/greensoftwarelab/GreenDroid
9

Figure 4: Example of the visualization of a method’s energy consumption profile.
Figure 5: Energy consumption profile of the methods of the Connectbot application.
4.1. Workflow
It is important to refer that GreenDroid expects as input some details about the application to be tested.Besides indicating the name of the tool, it must also be specified the path to both the application projectfolder and the application tests folder. It is also necessary to specify the package of the application, sincethis is the unique identifier of it and is needed for the process of compilation, installation and tests execution.
These four attributes that define the application under test will then be used as the starting point of theanalysis. Each one of the next items will describe one task performed by GreenDroid and how it relates tothe others.
1. Instrument the source code:
• Expected input: path to the source code of the application under test and path to the tests.
10

Figure 6: Energy consumption profile of the methods of the Google Authenticator application.
TEST CASES
INSTRUMENTED SOURCE CODE
THE APP(INSTRUMENTED)
TESTINGFRAMEWORK
0 0.2 0.3 0.4 0.5 0.6 1 1.8 3.4
10.2
88.9
0
10
20
30
40
50
60
70
80
90
100
0% 10% 20% 30% 40% 50% 60% 70% 80% 90% 100%
ener
gy c
onsu
ptio
n (m
W/s
)
quantiles
BASE OF KNOWLEDG
E
Figure 7: The behavior of the monitoring framework
• Expected output: path to the instrumented version of the application under test and path toinstrumented test project.
This is the starting point for the tool. Using the ideas and techniques defined in Section 2.2, thetool takes the path to the application under test and flags the code as described, injecting the twoenunciated method calls. Then, it takes the path to the tests and changes the setUp() and tearDown()methods (or creates them, if they were not already created), as explained before. The tests that donot fill the requirements (tests that do not use the Android testing framework, and so do not executein a device) are simply ignored and will not be included in the instrumented test project.The tool produces as output in this phase the path of both the instrumented version of the applicationand the instrumented test project.
2. Install the application and execute the tests:
• Expected input: path to the source code of the instrumented application under test (ApplicationUnder Test) and path to the instrumented test project.
• Expected output: path to the folder with the testing results (in the device).
11

With the source code instrumented, the next step is to install the instrumented application and executethe tests that will simulate the execution of the application. They will be executed twice: the firsttime to get the trace (list of called methods) and the second one to measure power consumption.We need the application trace so we know exactly what methods are called in each test, and if weget the power consumption at the same time we may have a problem with the tracing overhead: themore methods we trace, the more power consumption we have, because tracing works as a part of theapplication. To avoid this, we first get the trace (by running tests over the instrumented application),and then we analyze the power consumption (by running the same tests over the original application,not instrumented).The tracing results will be saved in files (one for each test), containing a list of the methods called. Wealso saved the number of times each method was called. Although we did not consider this informationt classify the methods, we can adapt our methodology later, and this information seems relevant.The execution time is also needed, and for that we used a different JUnit test runner than the usualAndroid Test Runner. This new runner is called Android JUnit Report Test Runner9. With this testrunner we were able to generate a XML file containing the JUnit information for each test, and fromthat we took the execution times of each test.The total value of the energy consumed, in mW, is saved in a single file, where each line is a mappingbetween a test and the value of the energy consumed.
3. Pull files from the device
• Expected input: path to the folder with the testing results (in the device).
• Expected output: path to the folder with the testing results (locally).
All the information referring to test execution is obviously stored in the device. After the test executionphase, they need to be pulled out from the device in order to be properly analyzed and computed.Android SDK offers a tool that can easily do this task if we passed it two arguments: the sourcefolder in the device you wish to pull out, and the destination folder in your computer. We includedan instruction in our tool that simply does the invocation of the command as if it was invoked from ashell, and it does all necessary work associated with this task.
4. Classify the tests:
• Expected input: path to the folder with the testing results (locally).
• Expected output: list of the tests from the application under test classified.
At this point, the tool will analyze the files previously pulled out from the device.In first place, it creates a list containing the tests executed. Each entry in that list contains theinformation of the corresponding test, i.e. the methods traced, the execution time and the total powerconsumption. Then, with this information it calculates the energy consumed (mW per second pernumber of method calls), which is the standard comparison reference for the tests. As we alreadyreferred, this value is saved in a base of knowledge that contains the consumption per second pernumber of method calls of every test of every application analyzed so far.Considering the classification approach described in Section 3, the tests are then classified, accordingto their consumption, execution time and number of method calls, as Red, Orange, Yellow or Green.
5. Display the results:
• Expected input: list of the tests from the application classified.
• Expected output: a radar diagram for each method.
The last task is responsible for generating two visual representations of the results. First, a barchart indicating the percentage of Red, Orange, Yellow or Green tests in which a method was called,where each bar corresponds to a method, and is divided in 4 sections (the four test types). This
9More information and tutorials can be found at http://www.alittlemadness.com/2010/07/14/Android-testing-xml-
reports-for-continuous-integration/.
12

representation gives information about the general quality of the methods, and an example of it wasalready shown in Figure 5 and 6. Second, the tools generates a diagram that displays the informationabout the involvement of each method in the tests of the application. This means that the methodhas associated to it the number of times that it was called in a test with a particular classification.We choose to display this information in a radar diagram (as seen before in Figure 4), where each axisrepresents one of the four classification for the tests. The ideal scenario for a method would be tohave a single line in the Green axis (meaning that it was only called when the consumption was notconsidered high, but completely normal.
Figure 8: A radar diagram displaying the results of one method
5. Results
In this section we analyze in detail the results produced by our techniques when analyzing and automat-ically classify (energy-wise) two Android applications. To validate these results, we manually inspect themethods involved in green/red executions and we describe which source code characteristics may positive-ly/negatively influence energy consumption.
5.1. Case study
As a case study we compare the results generated by our GreenDroid tool using two of the six applicationsanalyzed. We selected the applications Google Authenticator and Connectbot, since they are the ones withthe greatest number of tests (127 and 32, respectively) and method coverage (74% and 4%, respectively). Inorder to better understand the differences between both applications, we first performed a statistical analysisconsidering the consumption, number of called methods and execution time per test, of both applications.This analysis is shown in Table 2 for Google Authenticator and Table 3 for Connectbot.
13

Table 2: Statistical analysis for the Google Authenticator application.
Consumption (mW) Number of calls Execution time (s)Average 162.71 84.44 0.58Standard Deviation 197.61 93.93 0.56Maximum 1333.00 812.00 2.84Minimum 17.00 10.00 0.02
Table 3: Statistical analysis for the Connectbot application.
Consumption (mW) Number of calls Execution time (s)Average 919.53 56.34 0.17Standard Deviation 765.14 213.03 0.58Maximum 3555.00 1041.00 3.24Minimum 16.00 15.00 0.02
As we can see in these tables, apparently Connectbot is the one with more probability to have prob-lematic methods, between the two applications. It has much higher values for the maximum and averageconsumption, and the column regarding execution times is not so different.
The first thing we tried to understand at this point is how different the global classification results arefor both applications, i.e., verify if Connectbot actually has more tests classified as Red when compared withGoogle Authenticator, and if these red tests contain few or many associated methods.
Our tool first generates a normalized stacked bar chart, for each project, where each bar represents oneanalyzed method and the percentage of Red, Orange, Yellow and Green tests when it was called. This gives aclear view of the influence of an application and its methods in the consumption classified as anomalous. Ifthere is one application with a clear high red area, it means that it is most likely composed of methods whichare leading to anomalous consumption. We generated the results for our tested applications, and obtainedthe graph represented in Figure 5 for Connectbot and the graph for Google Authenticator represented inFigure 6.
The results shown in Figure 5 for Connectbot present a wide red area, meaning that most of the methodshave more calls in red tests. We can also see that there are several methods with very short green bars andvery long red ones, which indicates they are most likely the less energy efficient ones. Additionally, thereare only three that have at least 50% of their calls associated with green methods, which are most likelymethods more energy efficient than the others in the applications. Regardless, we have three particularmethods (the three left-most bars) that have a 100% green bar, so this either means that they were calledseveral times, where none of them were related to an anomalous consumption test, or that they were rarelycalled in the Red tests and always in Green tests.
Regarding Google Authenticator, we expected to have better results with a wider green area but did notanticipate how wide that area would be. With the obtained results, where we can see a very wide green area,it is fair to conclude that the majority of this application’s tests were not related to anomalous consumption.Nevertheless, we also have indication that, between the analyzed methods, there are some with a strongevident relation with Red and Orange tests (situated in the right half of the chart).
Another feature that our tool provides is a more detailed view of the method that the programmer wantsto analyze. For a selected method, we display a radar chart showing exactly the number of times that themethod was called. We again chose to analyze one situation for each of the applications, and so we selectedone method for each. The selection criteria was simple: we wanted to know the detailed information ofone method of each application with the biggest number of calls in Red tests. Figure 9 shows the resultsof the resetForIntegrationTesting method (from Google Authenticator) and Figure 10 shows the radar graphgenerated for a method called getOidFromPkcs8Encoded (from Connectbot). Comparing both methods wecan understand why the majority of the methods from Connectbot had higher red areas, and the methodsfrom Google Authenticator were considered more energy efficient.
14

Figure 9: Green, Yellow, Orange and Red testcalls of the method resetForIntegrationTesting(Google Authenticator)
Figure 10: Green, Yellow, Orange and Red testcalls of the method getOidFromPkcs8Encoded(Connectbot)
Another feature we thought would be interesting to include in our tool was a way to visually comparemethods from the same applications. For the programmer, it would be interesting to not only know if amethod has more calls in Red or Green tests, but also how good is a method when compared to others. Forexample, if a method A has 6 calls in total, 3 of which are in Red tests, and a method B has 10 calls where2 of are in Red tests and the other 3 are in Orange tests, then perhaps it is wiser to improve method B sinceit is called more times and half of its calls are in tests with anomalous consumption. Figure 11 shows anexample of a comparison between three methods of the Connectbot application.
In this particular case, it might be useful to focus the attention in optimizing the onCreate method (bluearea), since it appears to be the one with the worst ratio (higher values for Red and Orange, and smallervalues for Yellow and Green), although it is the one with higher number of calls (larger area). The methodwith higher value in the Red axis (close) is also the one with the higher values in the Orange, Yellow andGreen axis, so the ratio is not as bad as the previous one. The deleteAllData method is apparently the lessproblematic one, since around 50% of its calls were in Green tests.
5.2. Empirical Study of Energy-wise Methods Features
In order to try to validate the results presented in Section 5.1, we manually inspected the source codeof the two applications to identify program characteristics which may influence the energy consumption ofthe methods. With this analysis, we aimed to understand if there were similarities among methods mostlycalled in Red and/or Orange tests, and methods mostly called in Green and Yellow tests. We also aimed tofind differences between methods called mostly in different types of program tests.
For this study, we wanted to compare two kinds of methods: the ones that were mostly invoked in Redtests and less in Green tests (which we will refer to as +Red methods), and the ones that were mostly invokedin Green tests and less in Red tests (which will be called for now +Green methods). For the purpose of ourstudy, we believe that selecting thirty methods of each kind represents a good and significant sample.
In order to perform the selection of such methods, we merged all the methods analyzed in GoogleAuthenticator with all the ones analyzed in Connectbot. Then, we assigned to each one of them a ratio value,that reflects how much a method is related to excessive energy consumption executions (Red tests). Suchvalue is calculated using the following formula:
ratio = (#Ired/#Itotal) × 1 + (#Iorange/#Itotal) × 0.66 + (#Iyellow/#Itotal) × 0.33 (1)
15

Figure 11: Comparison between 3 methods from Connectbot
In this formula, #Ired,#Iorange and #Iyellow represents the number of calls of a method in Red, Orangeand Yellow tests, respectively, and #Itotal represents the total number of calls registered for that method.
As we can see, this formula gives more weight to calls in Red tests, and absolutely no weight to callsin Green tests. The resulting value from this formula will indicate whether a method is more related toexcessive energy consumption executions (Red and Orange tests), or more related to non-excessive/normalenergy consumption ones (Green and Yellow tests). For example, using this formula, a method that has allits calls in Red tests only will have a ratio of 1. As opposed, one method with all its calls in Green tests willhave a ratio of 0.
Once the ratio value was obtained for all methods, we sorted them in descending order according toit. The +Red methods were the top 30 of the sorted table, while the +Green ones were the ones from thebottom 30.
We were interested in investigating if there was a relation between certain software metrics/code charac-teristics (or a set of metrics) and the +Red/+Green methods. We started by investigating with a commonset of metrics, such as number of parameters, or cyclomatic complexity. Unfortunately, we could not findany relation between such metrics and the energy consumption of the methods. We then manually inspectedthe code and collected a set of metrics and characteristics that we believe form a pattern. For the purposeof this analysis, we considered the following set of metrics/characteristics:
• Number of instructions;
• Method contains loops or is recursive;
• Number of calls to other methods;
• Method contains operations over HTTP connections;
• Method contains operations over data structures (and which ones);
• Method is the static, synchronized, or final;
16

• Return type;
Table 4 and Table 5 show the results of the analysis for the 30 +Red and +Green methods, respectively.
Table 4: Metrics analysis for the +Red methods
Method Green Yellow Orange Red RATIO #InstructionsLoops orRecursive?
#Calls HTTP?Data Structureoperations?
(St)atic/(Fi)nal/(Sy)ncronhized
Return
1 0 0 0 3 1 8 8 x St void2 0 0 0 3 1 12 3 x St Object3 0 0 0 3 1 3 4 x St Object4 0 0 0 2 1 2 x 1 void5 0 0 0 2 1 15 x 9 boolean6 0 0 0 2 1 24 20 St Object7 0 0 0 2 1 7 3 St void8 0 0 0 1 1 3 3 void9 0 0 0 1 1 1 2 St String10 0 0 0 1 1 23 x 4 byte[ ] String11 0 0 0 1 1 1 0 String String12 0 0 0 1 1 2 2 void13 0 0 0 1 1 3 3 void14 0 0 0 4 1 28 15 boolean15 0 0 0 4 1 8 4 int16 0 0 0 2 1 1 0 boolean17 0 0 0 2 1 6 x 0 byte[ ] St String18 0 0 0 1 1 15 11 void19 0 0 0 1 1 1 1 List<String> St void20 0 0 0 1 1 1 1 List<String> St void21 0 0 1 3 0,915 7 6 void22 0 0 1 2 0,887 4 3 void23 1 0 0 7 0,875 14 7 St String24 1 0 0 6 0,857 1 0 int25 1 0 0 6 0,857 4 0 byte26 1 0 0 6 0,857 7 1 byte[ ] byte[]27 1 0 0 6 0,857 9 5 byte[ ] BigInteger28 1 0 0 6 0,857 14 x 2 int29 1 0 0 6 0,857 8 4 byte[ ] byte[]30 1 0 0 6 0,857 3 0 byte[ ] void
As we can see from the tables, there are some patterns which can be identified in the +Red methodsand others in the +Green methods. Moreover, we can also see that there are some similarities among themajority of the +Green methods which are not verified in the majority of the +Red methods, and vice versa.
Considering the previously referred metrics, we identified a set of similarities that we believe are thereason why methods are considered +Red or +Green.
Regarding +Green methods, we can observe that:
• Only 4/30 have what we consider possible computing intensive operations (namely data structuremanipulation, HTTP connections, loops/recursive calls, and/or number of calls to other methodshighly above the average);;
• 13/30 have up to one call to other methods;
• 26/30 are void or return values from native types (boolean or long), which means that storing theresult of the method is a less computing intensive task than storing an Object or a data structure;
• Only 1 method manipulates data structures;
• Only 5/30 methods are Static, which is a feature of methods that implies more RAM usage.
• The average number of instructions per method is 6;
Regarding +Red methods, we can observe that:
• 18/30 have what we consider possible computing intensive operations (namely data structure manipu-lation, HTTP connections, loops/recursive calls, and/or number of calls to other methods highly abovethe average);
17
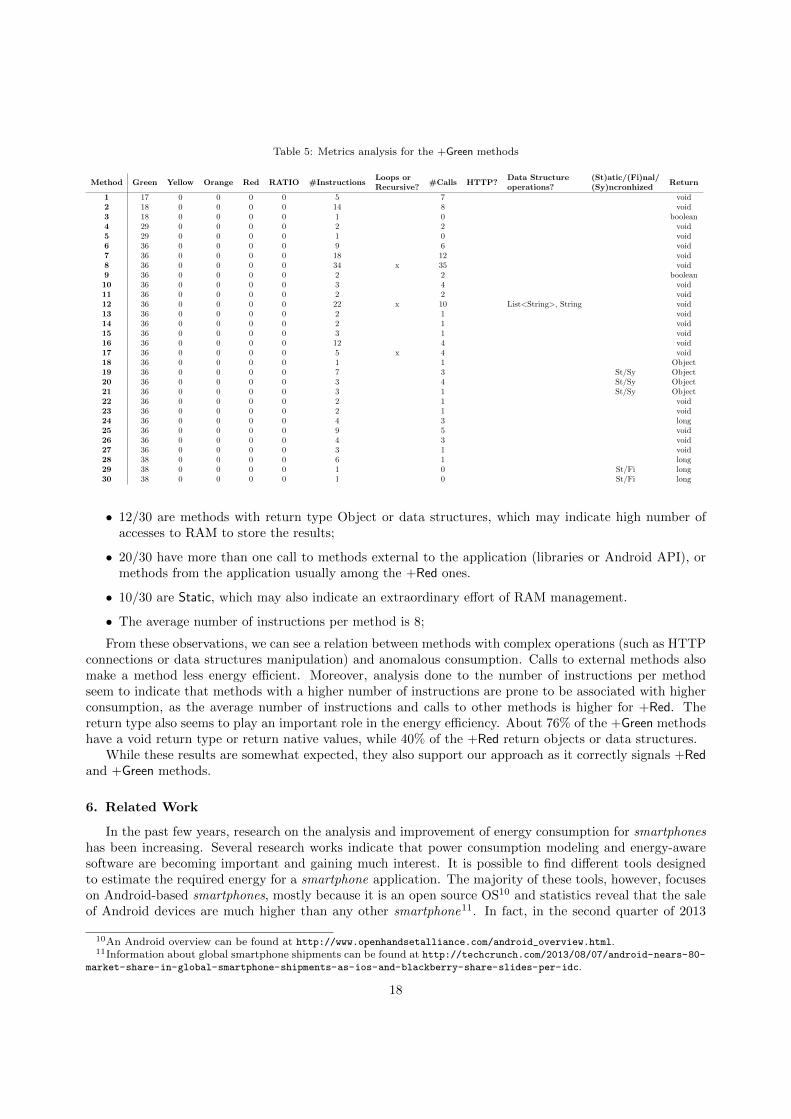
Table 5: Metrics analysis for the +Green methods
Method Green Yellow Orange Red RATIO #InstructionsLoops orRecursive?
#Calls HTTP?Data Structureoperations?
(St)atic/(Fi)nal/(Sy)ncronhized
Return
1 17 0 0 0 0 5 7 void2 18 0 0 0 0 14 8 void3 18 0 0 0 0 1 0 boolean4 29 0 0 0 0 2 2 void5 29 0 0 0 0 1 0 void6 36 0 0 0 0 9 6 void7 36 0 0 0 0 18 12 void8 36 0 0 0 0 34 x 35 void9 36 0 0 0 0 2 2 boolean10 36 0 0 0 0 3 4 void11 36 0 0 0 0 2 2 void12 36 0 0 0 0 22 x 10 List<String>, String void13 36 0 0 0 0 2 1 void14 36 0 0 0 0 2 1 void15 36 0 0 0 0 3 1 void16 36 0 0 0 0 12 4 void17 36 0 0 0 0 5 x 4 void18 36 0 0 0 0 1 1 Object19 36 0 0 0 0 7 3 St/Sy Object20 36 0 0 0 0 3 4 St/Sy Object21 36 0 0 0 0 3 1 St/Sy Object22 36 0 0 0 0 2 1 void23 36 0 0 0 0 2 1 void24 36 0 0 0 0 4 3 long25 36 0 0 0 0 9 5 void26 36 0 0 0 0 4 3 void27 36 0 0 0 0 3 1 void28 38 0 0 0 0 6 1 long29 38 0 0 0 0 1 0 St/Fi long30 38 0 0 0 0 1 0 St/Fi long
• 12/30 are methods with return type Object or data structures, which may indicate high number ofaccesses to RAM to store the results;
• 20/30 have more than one call to methods external to the application (libraries or Android API), ormethods from the application usually among the +Red ones.
• 10/30 are Static, which may also indicate an extraordinary effort of RAM management.
• The average number of instructions per method is 8;
From these observations, we can see a relation between methods with complex operations (such as HTTPconnections or data structures manipulation) and anomalous consumption. Calls to external methods alsomake a method less energy efficient. Moreover, analysis done to the number of instructions per methodseem to indicate that methods with a higher number of instructions are prone to be associated with higherconsumption, as the average number of instructions and calls to other methods is higher for +Red. Thereturn type also seems to play an important role in the energy efficiency. About 76% of the +Green methodshave a void return type or return native values, while 40% of the +Red return objects or data structures.
While these results are somewhat expected, they also support our approach as it correctly signals +Redand +Green methods.
6. Related Work
In the past few years, research on the analysis and improvement of energy consumption for smartphoneshas been increasing. Several research works indicate that power consumption modeling and energy-awaresoftware are becoming important and gaining much interest. It is possible to find different tools designedto estimate the required energy for a smartphone application. The majority of these tools, however, focuseson Android-based smartphones, mostly because it is an open source OS10 and statistics reveal that the saleof Android devices are much higher than any other smartphone11. In fact, in the second quarter of 2013
10An Android overview can be found at http://www.openhandsetalliance.com/android_overview.html.11Information about global smartphone shipments can be found at http://techcrunch.com/2013/08/07/android-nears-80-
market-share-in-global-smartphone-shipments-as-ios-and-blackberry-share-slides-per-idc.
18

devices running Android reached almost 80% market share.As previously described, Power Tutor [17] was the starting point for our work, as it was for many other
research works. For example, DevScope [22] is a tool which creates a power consumption model relatingthe different hardware components of a device to its different states and consequent power consumptionvalues. This model is used by AppScope [21] to estimate the energy consumption of an application, andby UserScope [27] to create a user-specific profiler for a smartphone. However, instead of an independentAndroid application to create the power consumption model for these tools, they use a Linux kernel module.Additionally, these tools are neither an API library, nor are they open-source.
ADEL (Automatic Detector of Energy Leaks) [28] uses an external power consumption meter to detectunnecessary network communication by tracing the indirect use of received data. However, this and otherexamples of works based on power consumption models [20, 29, 30], are not as powerful as the previouslymentioned ones. SEMO [31] is an energy monitoring system and application for Android smartphones whichprofiles application energy usage based only on the battery discharge level, and unfortunately produces lessreliable results due to this.
Corral et al. [32] measured the amount of energy required to complete different tasks in Android applica-tions using Java, Native C, and Regular C and report in what cases it is advisable to reallocate the job fromthe Java environment to an external execution environment. Noureddine et al. [33] introduced a softwareframework which infers the energy consumption model of software libraries from measuring the executiontraces through a large number of tests. They also support that these models can be used for energy classifi-cations, but they themselves do not classify the applications methods, and the energy values are CPU-basedonly. These works demonstrate that it is possible to have different values on energy consumption for differentsoftware designed to do the same tasks. This can be a very good indicator that helping developers choosethe most energy-aware solution for a software implementation is of great importance. In fact, this has beendemonstrated in [7].
Recently, Li et al. [23] developed a framework that is capable of calculating source line level energyconsumption for android applications. In [24] the same authors propose a methodology for estimating mobileapplication’s energy consumption. This methodology considers a power consumption model instantiated fora specific device and it uses program analysis techniques to infer the energy consumption of blocks of codewithout actually execute the application. Both works, however, rely on an external devices to measure energyconsumption. Thus, they highly depend son the sampling frequency of the external device. Since, in theAndroid eco-system, new devices become available almost daily, this approach makes the full automatizationof the device energy consumption calibration and application monitorization impracticable, as we advocatein our paper.
Research work is also been done by conducting empirical studies aim at discover in which states doesan application spends more energy (for example, when an app is in idle mode) [34], or even focused onunderstanding if different API’s (used with the same purpose) can be more energy efficient than others [35].
We believe that the work that relates the most to our own is eCalc [36]. This approach also estimates theAndroid applications energy consumption through the execution of software artifacts with a series of testcases, alongside previously created power consumption models/CPU profiler. Unfortunately, these modelsonly define the cost functions at the instruction level, and the application itself is not publicly available.Additionally, while eCalc only predicts the energy value and returns that same value, we take this a stepfurther. We visually present our estimated values to the developer, showing which are the most criticalmethods in their code and classifying this information in an easy to understand format.
7. Conclusions and Future Work
This paper presented a methodology for monitoring, analyzing and classifying energy consumption forAndroid applications. To monitor energy consumption we have extended the power tutor energy model sothat it can be (re)used as an API. We have also developed the GreenDroid tool, which given the source codeof an Android application automatically instruments it with calls to the power tutor API. This instrumentedversion of the application is then executed with test cases to monitor its energy consumption.
19

We have also presented a methodology to classify (energy-wise) different executions of the instrumentedAndroid applications. Using the GreenDroid tools, we have instrumented and analyzed the energy con-sumption of a corpus of open source Android applications. Thus, we have defined energy thresholds toclassify program executions in four greenware categories. Moreover, we presented the results of analyzingand manually inspecting the source code of the applications’ methods associated with the more energy effi-cient/inefficient executions. Our first results show that methods consisting of few lines of loop-free code areassociated with green executions, while methods that manipulate collections or arrays and access databas-es/HTTP connections are associated to red executions.
These results show that our methodology using our (energy-wise) classification of android applicationsproduces good results, and thus, can be of great help in the development of greener software.
7.1. Future Work
As part of our future research on analyzing the energy consumption in the Android ecosystem, we planto:
1. First, we would like to perform a more elaborated analysis on which source code features are relatedto our green and red classification, for example to realize which API’s are mostly used in green/redexecutions.
2. Second, our current methodology is not able to detect that a simple method always called inside aheavy computing one is not causing anomalous consumption. We plan to extend our methodology toconsider the full method call tree so this information is taken into account.
3. Finally, we would like to collect a larger Android applications corpus that represents all applicationdomains in the Android ecosystem.
Acknowledgments
We would like to thank Robert Dick for giving us access to the training applications of the Power Tutorconsumption model and interesting discussions on this work. We thank also the anonymous reviewers whosecomments greatly improved our work. This work is integrated in the project GreenSSCM - Green Softwarefor Space Missions Control, a project financed by the Innovation Agency, SA, Northern Regional OperationalProgramme, Financial Incentive Grant Agreement under the Incentive Research and Development System,Project No. 38973. The last author is supported by CAPES through a Programa Professor Visitante doExterior (PVE) grant.
References
[1] N. D. Jones, An introduction to partial evaluation, ACM Computing Surveys 28 (3) (1996) 480–503.[2] U. A. Acar, G. E. Blelloch, R. Harper, Adaptive functional programming, ACM Transactions on Programming Languages
and Systems 28 (6) (2006) 990–1034.[3] A. Krall, Efficient javavm just-in-time compilation, in: International Conference on Parallel Architectures and Compilation
Techniques, 1998, pp. 205–212.[4] P. Wadler, Deforestation: transforming programs to eliminate trees, Theoretical Computer Science 73 (1990) 231–248.[5] J. Saraiva, D. Swierstra, Data Structure Free Compilation, in: Stefan Jahnichen (Ed.), 8th International Conference on
Compiler Construction, CC/ETAPS’99, Vol. 1575 of LNCS, Springer, 1999, pp. 1–16.[6] J. P. Fernandes, J. Saraiva, D. Seidel, J. Voigtlander, Strictification of circular programs, in: Proceedings of the 20th
ACM SIGPLAN Workshop on Partial Evaluation and Program Manipulation, PEPM ’11, ACM, 2011, pp. 131–140.[7] G. Pinto, F. Castor, Y. D. Liu, Mining questions about software energy consumption, in: Proceedings of the 11th Working
Conference on Mining Software Repositories, MSR 2014, ACM, 2014, pp. 22–31.[8] D. A. Padua, M. J. Wolfe, Advanced compiler optimizations for supercomputers, Communications of the ACM 29 (12)
(1986) 1184–1201.[9] J. Campos, A. Riboira, A. Perez, R. Abreu, Gzoltar: an eclipse plug-in for testing and debugging, in: M. Goedicke,
T. Menzies, M. Saeki (Eds.), IEEE/ACM International Conference on Automated Software Engineering, ASE’12, Essen,Germany, September 3-7, 2012, ACM, 2012, pp. 378–381.
[10] T. Ball, J. R. Larus, Optimally profiling and tracing programs, ACM Transactions on Programming Languages andSystems 16 (4) (1994) 1319–1360.
[11] C. Runciman, N. Rojemo, Heap Profiling for Space Efficiency, in: J. Launchbury, E. Meijer, T. Sheard (Eds.), SecondInternational School on Advanced Functional Programming, Vol. 1129 of LNCS, Springer, 1996, pp. 159–183.
20

[12] K. Claessen, J. Hughes, Quickcheck: a lightweight tool for random testing of haskell programs, in: Proceedings of the 5thACM SIGPLAN International Conference on Functional Programming, ACM, 2000, pp. 268–279.
[13] H. Wu, J. Gray, Automated generation of testing tools for domain-specific languages, in: Proceedings of the 20thIEEE/ACM International Conference on Automated Software Engineering, ASE ’05, ACM, 2005, pp. 436–439.
[14] P. Godefroid, N. Klarlund, K. Sen, Dart: Directed automated random testing, in: Proceedings of the 2005 ACM SIGPLANConference on Programming Language Design and Implementation, PLDI ’05, ACM, 2005, pp. 213–223.
[15] T. Mens, T. Tourwe, A survey of software refactoring, IEEE Transactions on Software Engineering 30 (2) (2004) 126–139.[16] S. M. Blackburn, R. Garner, C. Hoffmann, A. M. Khang, K. S. McKinley, R. Bentzur, A. Diwan, D. Feinberg, D. Frampton,
S. Z. Guyer, M. Hirzel, A. Hosking, M. Jump, H. Lee, J. E. B. Moss, A. Phansalkar, D. Stefanovic, T. VanDrunen, D. vonDincklage, B. Wiedermann, The dacapo benchmarks: Java benchmarking development and analysis, SIGPLAN Notices41 (10) (2006) 169–190.
[17] L. Zhang, B. Tiwana, Z. Qian, Z. Wang, R. P. Dick, Z. M. Mao, L. Yang, Accurate online power estimation and automaticbattery behavior based power model generation for smartphones, in: T. Givargis, A. Donlin (Eds.), Proceedings of the 8thInternational Conference on Hardware/Software Codesign and System Synthesis, CODES+ISSS 2010, part of ESWeek ’10Sixth Embedded Systems Week, Scottsdale, AZ, USA, October 24-28, 2010, ACM, 2010, pp. 105–114.
[18] M. Couto, T. Carcao, J. Cunha, J. Fernandes, J. Saraiva, Detecting anomalous energy consumption in android applica-tions, in: F. Quinto Pereira (Ed.), Programming Languages, Vol. 8771 of Lecture Notes in Computer Science, SpringerInternational Publishing, 2014, pp. 77–91.
[19] M. Dong, L. Zhong, Self-constructive high-rate system energy modeling for battery-powered mobile systems, in: A. K.Agrawala, M. D. Corner, D. Wetherall (Eds.), Proceedings of the 9th International Conference on Mobile Systems, Ap-plications, and Services (MobiSys 2011), Bethesda, MD, USA, June 28 - July 01, 2011, ACM, 2011, pp. 335–348.
[20] M. Kjrgaard, H. Blunck, Unsupervised power profiling for mobile devices, in: A. Puiatti, T. Gu (Eds.), Mobile andUbiquitous Systems: Computing, Networking, and Services, Vol. 104 of Lecture Notes of the Institute for ComputerSciences, Social Informatics and Telecommunications Engineering, Springer Berlin Heidelberg, 2012, pp. 138–149.
[21] C. Yoon, D. Kim, W. Jung, C. Kang, H. Cha, Appscope: Application energy metering framework for android smartphoneusing kernel activity monitoring. (2012) 387–400.
[22] W. Jung, C. Kang, C. Yoon, D. Kim, H. Cha, Devscope: a nonintrusive and online power analysis tool for smartphonehardware components, in: Jerraya et al. [37], pp. 353–362.
[23] D. Li, S. Hao, W. G. J. Halfond, R. Govindan, Calculating source line level energy information for android applications,in: Proceedings of the 2013 International Symposium on Software Testing and Analysis, ISSTA 2013, ACM, 2013, pp.78–89.
[24] S. Hao, D. Li, W. G. J. Halfond, R. Govindan, Estimating mobile application energy consumption using program analysis,in: Proceedings of the 2013 International Conference on Software Engineering, ICSE ’13, IEEE Press, 2013, pp. 92–101.
[25] T. L. Alves, C. Ypma, J. Visser, Deriving metric thresholds from benchmark data, in: Proceedings of the 2010 IEEEInternational Conference on Software Maintenance, ICSM ’10, IEEE Computer Society, 2010, pp. 1–10.
[26] F. Hermans, M. Pinzger, A. v. Deursen, Detecting and visualizing inter-worksheet smells in spreadsheets, in: Proceedingsof the 34th International Conference on Software Engineering, ICSE ’12, IEEE Press, 2012, pp. 441–451.
[27] W. Jung, K. Kim, H. Cha, Userscope: A fine-grained framework for collecting energy-related smartphone user contexts,in: IEEE 19th International Conference on Parallel and Distributed Systems, ICPADS 2013, Seoul, Korea, December15-18, 2013, IEEE, 2013, pp. 158–165.
[28] L. Zhang, M. S. Gordon, R. P. Dick, Z. M. Mao, P. A. Dinda, L. Yang, ADEL: an automatic detector of energy leaks forsmartphone applications, in: Jerraya et al. [37], pp. 363–372.
[29] D. Kim, W. Jung, H. Cha, Runtime power estimation of mobile AMOLED displays, in: E. Macii (Ed.), Design, Automationand Test in Europe, DATE 13, Grenoble, France, March 18-22, 2013, EDA, 2013, pp. 61–64.
[30] A. Carroll, G. Heiser, An analysis of power consumption in a smartphone, in: Proceedings of the 2010 USENIX Conferenceon USENIX Annual Technical Conference, USENIXATC’10, USENIX Association, 2010, pp. 21–21.
[31] F. Ding, F. Xia, W. Zhang, X. Zhao, C. Ma, Monitoring energy consumption of smartphones, CoRR abs/1201.0218.[32] L. Corral, A. B. Georgiev, A. Sillitti, G. Succi, Method reallocation to reduce energy consumption: an implementation in
android OS, in: Cho et al. [38], pp. 1213–1218.[33] A. Noureddine, R. Rouvoy, L. Seinturier, Unit testing of energy consumption of software libraries, in: Cho et al. [38], pp.
1200–1205.[34] D. Li, S. Hao, J. Gui, W. Halfond, An empirical study of the energy consumption of android applications, in: Software
Maintenance and Evolution (ICSME), 2014 IEEE International Conference on, 2014, pp. 121–130.[35] M. Linares-Vasquez, G. Bavota, C. Bernal-Cardenas, R. Oliveto, M. Di Penta, D. Poshyvanyk, Mining energy-greedy api
usage patterns in android apps: An empirical study, in: Proceedings of the 11th Working Conference on Mining SoftwareRepositories, MSR 2014, ACM, 2014, pp. 2–11.
[36] S. Hao, D. Li, W. G. J. Halfond, R. Govindan, Estimating android applications’ CPU energy usage via bytecode profiling,in: R. Kazman, P. Lago, N. Meyer, M. Morisio, H. A. Muller, F. Paulisch, G. Scanniello, O. Zimmermann (Eds.), FirstInternational Workshop on Green and Sustainable Software, GREENS 2012, Zurich, Switzerland, June 3, 2012, IEEE,2012, pp. 1–7.
[37] A. Jerraya, L. P. Carloni, N. Chang, F. Fummi (Eds.), Proceedings of the 10th International Conference on Hardware/-Software Codesign and System Synthesis, CODES+ISSS 2012, part of ESWeek ’12 Eighth Embedded Systems Week,Tampere, Finland, October 7-12, 2012, ACM, 2012.
[38] Y. Cho, S. Y. Shin, S. Kim, C. Hung, J. Hong (Eds.), Symposium on Applied Computing, SAC 2014, Gyeongju, Republicof Korea - March 24 - 28, 2014, ACM, 2014.
21