analyzing calls for service to the albuquerque police...
TRANSCRIPT

Analyzing Calls for Service to the Albuquerque Police Department
June 2009
Dan Cathey, MPA Paul Guerin, Ph.D.
with Alex Adams Ben Edwards Prepared for: City of Albuquerque Police Department
UNIVERSITY OF NEW MEXICO, INSTITUTE FOR SOCIAL RESEARCH

Analysis of Albuquerque Police Department Calls for Service
1
Introduction This is the last of four reports in a series by the University of New Mexico, Institute for Social Research (ISR) addressing issues related to calls by the public for police services in the City of Albuquerque. The City of Albuquerque contracted with the ISR to analyze calls for service (CFS) data from the Albuquerque Police Department (APD). As with the preceding reports, this paper includes several sections: a synopsis of our previous work, the results of our survey of nine select police communications departments, an analysis of fifteen months of calls for service data from APD including related reported crime data, and a conclusion.
Review of Preliminary Report In our review of literature related to the issue of calls for service, we discovered it is important for police departments to establish strategies that enable them to respond effectively and rapidly to emergency situations. In the last two decades it has become very easy for the public to access the emergency dispatch system via the 9-1-1 function. Ease of service has been a two-edged sword for the police and other emergency agencies. The 9-1-1 function has had a major impact on the number of police calls for service. The increasing number of calls handled by emergency dispatch systems has also increased the necessity for handling these calls efficiently while meeting the needs of the public.
In our preliminary analysis we examined a sample dataset containing one month of calls for service, i.e., January 2007. We spent time cleaning, identifying the values, and removing duplicate calls for service from the data. Our analysis would have benefited by having access to the CFS data structure document that would have likely outlined the table structure of the data, variable values, and user codes. Our review of the January 2007 data revealed similar trends to those in larger documented studies we found in the literature. An obvious finding from the frequency analysis of calls is the majority of calls are not necessarily made in response to a crime. We found traffic related calls were the most prevalent (34.1%) among all categories. Additionally, the suspicious person calls and a miscellaneous category (i.e., Other/unknown) contained approximately 27.4% of the calls in the January 2007 dataset. One possible explanation for this is emergency calls to burglar alarms amount to a large number of the calls for service. Alarms amounted to approximately 5% of the calls for service during January 2007.
After reviewing the January 2007 data we concluded that future data analyses should include a variety of tests focusing on the types of calls within categories. Which calls happen most frequently? Within category analysis, we suggested completing a trend analysis of specific types of calls. For example, we suggested addressing the question of whether or not the specific types of property calls have changed over a longer period of time. We felt an analysis of data by time, i.e., temporal variables, would give us descriptions of the amount of time it takes for APD officers to arrive on the scene and the length of time the incident lasted. From this analysis we would be able to determine which calls are being responded to more or less quickly and which calls are taking up longer amounts of time. We proposed using a priority system to determine which calls are not being responded to quickly enough and which calls are accounting for substantial blocks of officer time. This analysis could be completed both between and

Analysis of Albuquerque Police Department Calls for Service
2
within calls for service categories. In the ‘macro’ we proposed looking at the effect of seasonal variations on calls for service and the use of mapping coordinates and the relationships we could make between the CFS data and incident report data.
Review of the Police Dispatch Survey In this section we reviewed responses to a six-page survey from nine selected police communications departments. We created the survey based on findings we discovered in the literature and from topics the City of Albuquerque wished to know concerning CFS. We held discussions with APD administrative and communications staff. From prior experience surveying police departments, we proposed that APD communications staff contact the selected police departments and administer the survey. From October 2008 to April 2009, APD staff contacted the select police departments, including surveying their own Communications Division and the Bernalillo County Sheriff’s Office. APD handed off the survey to us, and our staff continued to contact the select departments from April 2009 through May 2009. In total APD and ISR staff were able to obtain responses from 7 of the 9 departments plus APD (see Table 1). Before administering the survey we decided we would probably be contacting police departments and their communications divisions. This proved to be the case, as some police departments relied on an affiliated agency to provide 911 and police dispatch services to their police officers on the street. Three cities (Ft. Worth, Oklahoma City, and Omaha) used 911 emergency communications departments to dispatch police, fire, and emergency medical units. The remaining four cities use police dispatchers affiliated with the police department. Denver maintains a police dispatch unit, supervised and staffed by civilians.
Table 1. Select Police Communication Departments Department Completed Survey Incomplete Survey
Albuquerque Police Dept √ Bernalillo County Sheriff’s Office √ Denver Police Dept √ Fort Worth Police Dept √ Oklahoma City Police Dept √ Omaha Police Dept √ Rio Rancho Police Dept √ Salt Lake City Police Dept √ Tulsa Police Dept √ Tucson Police Dept √
We asked the departments to provide a few definitions of typical terms used in the survey such as “call for service”, “priority calls”, “response time”, and “call processing time.” The term “call for service” was defined very specifically by Tucson as “an event occurring in or near the City of Tucson to which one or more Tucson Police employees must respond to evaluate or take action, or an event that comes to the attention of police or is initiated by police that requires formal documentation.” CFS was defined very broadly by Fort Worth as “an incoming emergency or non-emergency.” The unaffiliated agencies identified CFS at the point when an event is entered into their computer-aided-dispatch (CAD) system. Generally, the distinction between police dispatchers and non-police 911 emergency communication agencies continued throughout the survey. Non-police dispatchers view the
Analysis of Albuquerque Police Department Calls for Service
3
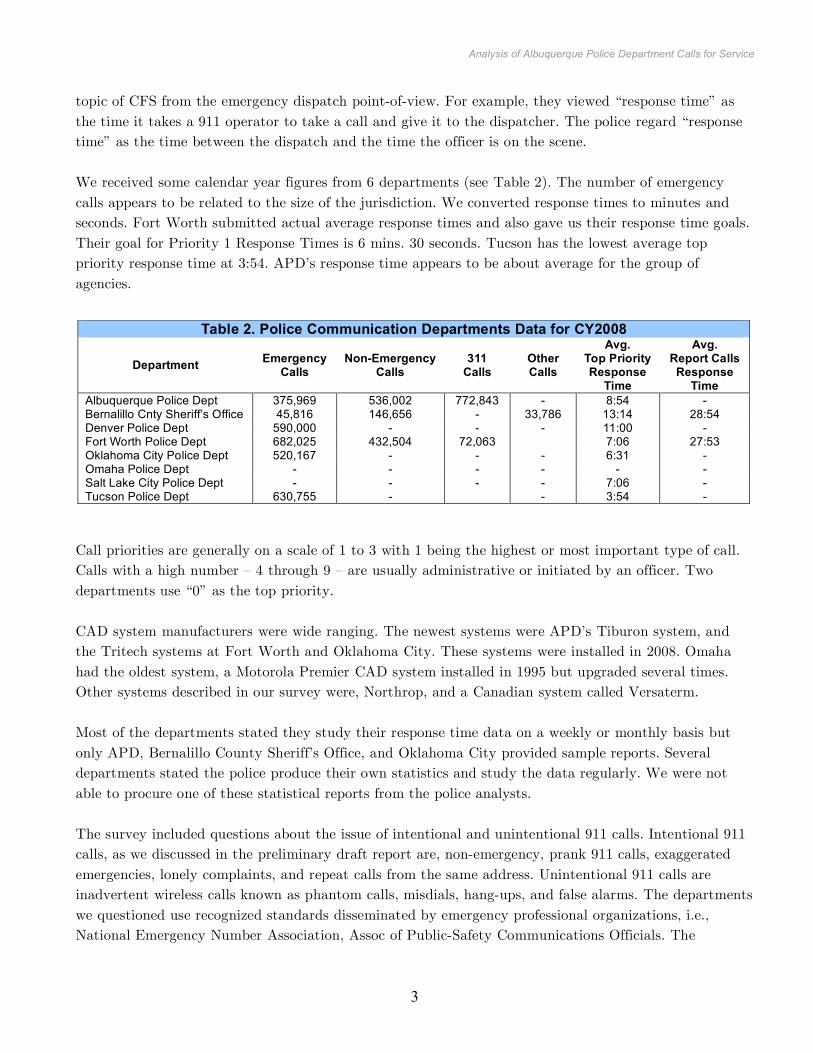
topic of CFS from the emergency dispatch point-of-view. For example, they viewed “response time” as the time it takes a 911 operator to take a call and give it to the dispatcher. The police regard “response time” as the time between the dispatch and the time the officer is on the scene. We received some calendar year figures from 6 departments (see Table 2). The number of emergency calls appears to be related to the size of the jurisdiction. We converted response times to minutes and seconds. Fort Worth submitted actual average response times and also gave us their response time goals. Their goal for Priority 1 Response Times is 6 mins. 30 seconds. Tucson has the lowest average top priority response time at 3:54. APD’s response time appears to be about average for the group of agencies.
Call priorities are generally on a scale of 1 to 3 with 1 being the highest or most important type of call. Calls with a high number — 4 through 9 — are usually administrative or initiated by an officer. Two departments use “0” as the top priority. CAD system manufacturers were wide ranging. The newest systems were APD’s Tiburon system, and the Tritech systems at Fort Worth and Oklahoma City. These systems were installed in 2008. Omaha had the oldest system, a Motorola Premier CAD system installed in 1995 but upgraded several times. Other systems described in our survey were, Northrop, and a Canadian system called Versaterm. Most of the departments stated they study their response time data on a weekly or monthly basis but only APD, Bernalillo County Sheriff’s Office, and Oklahoma City provided sample reports. Several departments stated the police produce their own statistics and study the data regularly. We were not able to procure one of these statistical reports from the police analysts. The survey included questions about the issue of intentional and unintentional 911 calls. Intentional 911 calls, as we discussed in the preliminary draft report are, non-emergency, prank 911 calls, exaggerated emergencies, lonely complaints, and repeat calls from the same address. Unintentional 911 calls are inadvertent wireless calls known as phantom calls, misdials, hang-ups, and false alarms. The departments we questioned use recognized standards disseminated by emergency professional organizations, i.e., National Emergency Number Association, Assoc of Public-Safety Communications Officials. The
Table 2. Police Communication Departments Data for CY2008
Department Emergency Calls
Non-Emergency Calls
311 Calls
Other Calls
Avg. Top Priority Response
Time
Avg. Report Calls Response
Time Albuquerque Police Dept 375,969 536,002 772,843 - 8:54 - Bernalillo Cnty Sheriff’s Office 45,816 146,656 - 33,786 13:14 28:54 Denver Police Dept 590,000 - - - 11:00 - Fort Worth Police Dept 682,025 432,504 72,063 7:06 27:53 Oklahoma City Police Dept 520,167 - - - 6:31 - Omaha Police Dept - - - - - - Salt Lake City Police Dept - - - - 7:06 - Tucson Police Dept 630,755 - - 3:54 -

Analysis of Albuquerque Police Department Calls for Service
4
Bernalillo County Sheriff’s Office policy for handling misdials is an example of the formality used in the policies. Bernalillo County Sheriff’s Office describes their policy for handling misdials as:
“A callback is made on all landline and wireless 911 hang up calls. Units are dispatched to residential and business landline calls until it is verified that everything is ok. Call tracing is utilized for wireless and landlines in an attempt to make contact on callbacks and when units are dispatched.”
Finally, the majority of police departments allow Alternative Reporting Methods (ARM), e.g., reporting a crime over the phone or via the Internet. All the departments have Non-Emergency contact numbers and accept filing a police report over the phone or in-person at a police substation. Bernalillo County, Oklahoma City, and Salt Lake City do not allow police reports to be filed on the Internet. Tucson, Denver, and Fort Worth allow the filing of reports by mail but the other departments do not allow this form of ARM. There seemed to be some confusion regarding whether departments allowed our last option for filing. We asked if the department allowed “delayed officer response.” Responses to this question were limited and may have had something to do with the way we phrased the question. It appears from the responses to our survey, police departments or their associated emergency dispatch centers have good equipment; they adopt policies that fit their needs and are circulated by national organizations in an effort to standardize, and use best practices. The dispatch centers have a need for certain statistical data and the police have a use for other elements of the statistics emerging from calls for service. APD may have better policies and may use its data better than the other departments we questioned, but a more in-depth interview process would have to be done to measure any real difference in the departments. Our survey is a good baseline measure for getting high level responses, but the survey suffered from not being completed one-on-one and not including more statistical data from the agencies.
Review of APD Data In this section we review the City of Albuquerque calls for service data and crime report data for the 15-month period from January 2008 to March 2009. Following a descriptive analysis of the data, we present a section describing potential research goals for future analysis.
The Data A substantial amount of our Preliminary Draft from June 2008 was devoted to describing the difficulties we experienced as we attempted to analyze the CFS data for one month. We had problems with comma delimiters, duplicate data, and identifying the meaning and values for several variables in the dataset. These problems resulted in large part to the way the raw data was “pulled” out of the APD computer and the absence of a codebook, which would have made the task of analyzing the data easier. Since our Preliminary Draft, APD has installed and is using a new data management system. The new Tiburon system has several features which make analysis easier.

Analysis of Albuquerque Police Department Calls for Service
5
There are several benefits to using data from the new Tiburon system. The data variables in the Tiburon system are more intuitive than the variables used in the older New World data management system. Even though we did not have a Tiburon codebook, we did not have much trouble deciphering the major variables in the Tiburon data. APD allowed an ISR staffer to attend a training session using the Tiburon Crime Analyst module. The training was beneficial when we began analyzing the Tiburon data. The tables and views in the Tiburon databases were very useful for our needs. It took a number of weeks for us to access the Tiburon data, but once we connected with the APD server we were able to copy the data tables we needed for our analysis. In addition to downloading the Tiburon CAD Activity Reporting System (CARS) data, we were able to copy data from the report management system (RMS) and link the two — CARS and RMS -- datasets using a foreign key or variable in the data. In this way we were able to follow a call for service from beginning to end. The Tiburon data has been live for approximately one year meaning we were limited to using approximately one year. We attempted to mitigate this problem by copying as much of the Tiburon data as existed at the time we pulled the data. We ended up copying 15 months worth of CARS data and approximately 13 months of RMS data from the Tiburon system. We pulled the data from the APD system in April 2009. At that time the CARS data contained 1,093,005 records. We determined approximately 35.9% were dispatched calls to secondary police units. We limited the data by including only the first call to the primary police unit responding to the call. This provided us with a dataset of 701,091 unduplicated calls for service. Each call represents a unique call for service. As with the previous APD management information system, the Tiburon data includes an event number, address information, x-y coordinate locations, type of call, source of call, time and date of call, primary responding officer, beat, command area, and time calculations between each dispatched event. It was not imperative, given the context of our contracted research goals, to use all the data associated with each variable. It was unlikely, for example, that we needed specific officer information for any analyses, making it unnecessary to obtain value labels for the secondary officers responding to the call. For other variables, it was useful to have the more detailed variables available in the Tiburon data, but again, it was not crucial. The x-coordinate and y-coordinate location variables proved useful in analyzing calls for service trends across the city. The address and coordinate data enabled us to produce spatial analyses (maps) on the calls for service and reported incidents.
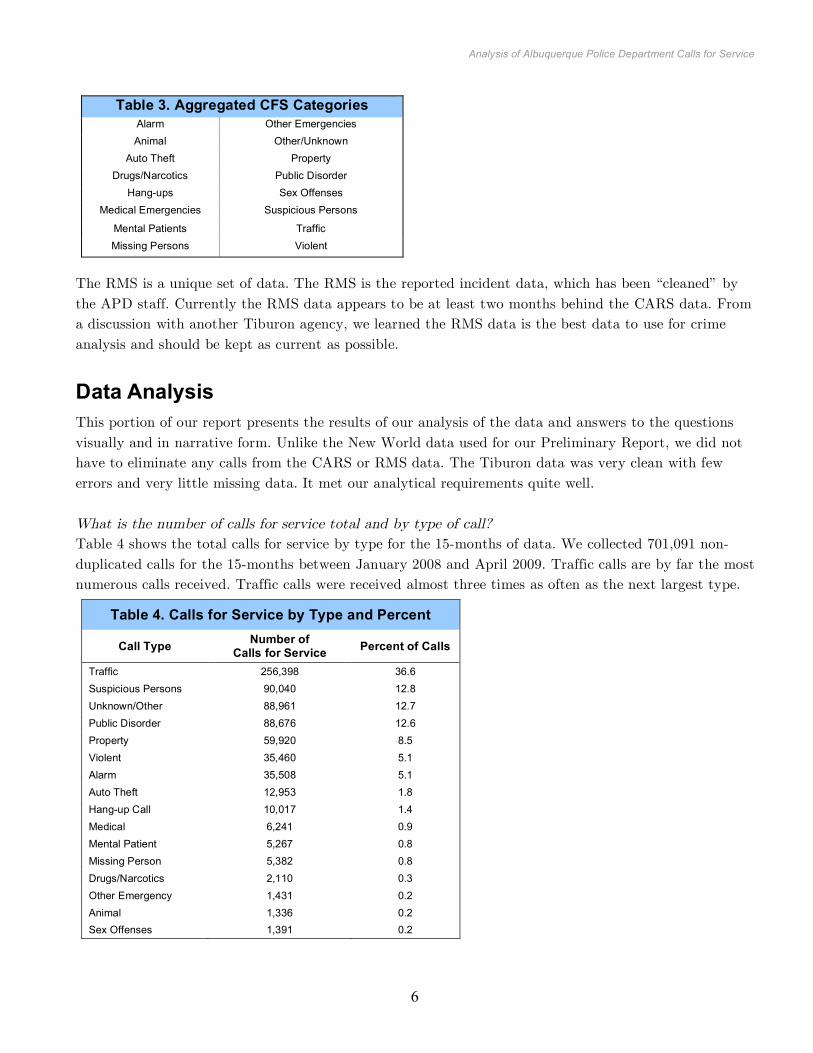
Just as in our Preliminary Report in June 2008, in order to make the data more manageable, we aggregated calls into 15 categories. In this study we also split out missing persons due to the timely interest in this category. Table 3 lists the call categories in our study.
Analysis of Albuquerque Police Department Calls for Service
6
Table 3. Aggregated CFS Categories Alarm Other Emergencies Animal Other/Unknown
Auto Theft Property Drugs/Narcotics Public Disorder
Hang-ups Sex Offenses Medical Emergencies Suspicious Persons
Mental Patients Traffic Missing Persons Violent
The RMS is a unique set of data. The RMS is the reported incident data, which has been “cleaned” by the APD staff. Currently the RMS data appears to be at least two months behind the CARS data. From a discussion with another Tiburon agency, we learned the RMS data is the best data to use for crime analysis and should be kept as current as possible.
Data Analysis This portion of our report presents the results of our analysis of the data and answers to the questions visually and in narrative form. Unlike the New World data used for our Preliminary Report, we did not have to eliminate any calls from the CARS or RMS data. The Tiburon data was very clean with few errors and very little missing data. It met our analytical requirements quite well. What is the number of calls for service total and by type of call? Table 4 shows the total calls for service by type for the 15-months of data. We collected 701,091 non-duplicated calls for the 15-months between January 2008 and April 2009. Traffic calls are by far the most numerous calls received. Traffic calls were received almost three times as often as the next largest type.
Table 4. Calls for Service by Type and Percent
Call Type Number of Calls for Service Percent of Calls
Traffic 256,398 36.6 Suspicious Persons 90,040 12.8 Unknown/Other 88,961 12.7 Public Disorder 88,676 12.6 Property 59,920 8.5 Violent 35,460 5.1 Alarm 35,508 5.1 Auto Theft 12,953 1.8 Hang-up Call 10,017 1.4 Medical 6,241 0.9 Mental Patient 5,267 0.8 Missing Person 5,382 0.8 Drugs/Narcotics 2,110 0.3 Other Emergency 1,431 0.2 Animal 1,336 0.2 Sex Offenses 1,391 0.2

Analysis of Albuquerque Police Department Calls for Service
7
Figure 1 shows the number of calls by month in the dataset. Early in the adoption of the Tiburon system the call volume remained low; however, this may be due to slow adoption of the system, as call volume remained relatively constant over the rest of the time period. We also reviewed calls for service resulting in a report in the RMS data. Calls for service are highest during the warmer months of May through August and lowest in the fall and winter months.
Figure 1. Number of Calls By Month
Figure 2 shows that the number of reports in the RMS module occurred at a similar rate as calls for service occurred in the Tiburon CARS module. The lull at the end of the time period maybe simply be a backlog of calls for which reports had not yet been written at the time of data collection.

Analysis of Albuquerque Police Department Calls for Service
8
Figure 2. Number of Reports by Month
Some areas of the City accounted for more calls for service than other areas. As seen in Table 5 below the east side area commands accounted for the highest percentage of calls and calls that resulted in reports, while the two west side area commands accounted for the least. The percentage of calls resulting in reports remained fairly consistent for all area commands, with the exception of the southwest, where an unusually low percentage (1.96%) resulted in reports.
Table 5. Calls and Reports by Area Command
Area Command All Calls for Service %
Percentage of Reports
% of Calls Resulting in a
Report Valley 18.6 14.8 2.68 Southeast 22.3 22.5 3.39 Northeast 19.7 21.6 3.69 Foothills 13.1 15.6 4.01
Southwest 2.4 1.4 1.96 Northwest 11.2 11.6 3.48
BCSO 9.8 11.7 4.02 Unknown 3.1 0.9 0.98
Investigation into the time of day for call volume was made (Table 6). We examined the number of calls per shift. The swing shift contained the highest percentage of calls followed by the day and grave shifts. However the highest number of reports occurred during the day shift.

Analysis of Albuquerque Police Department Calls for Service
9
Table 6. Calls and Reports by Shift
Shift Percent of Calls
Percent of Reports
Percent of calls resulting in reports
Grave 23:00-7:30 25.1 22.9 3.08 Day 7:30-15:30 34.6 42.8 4.16 Swing 15:30-23:00 40.4 34.3 2.86
Considering the types of calls during each shift we see the reason for the discrepancy between calls and reports. Table 7 shows that public disorder calls, which rarely resulted in a report, were most common during the grave and swing shifts, while property crimes, for which reports were very common, occurred predominately during the day shift.
Table 7. Percent of Calls by Type and Shift
Shift Call Type Grave Day Swing
Traffic 41.7 32.4 36.9 Suspicious Persons 15.2 11 13 Unknown/Other 10.4 15.8 11.4 Public Disorder 13.6 9.8 14.6
Property 4.5 12.7 7.5
Violent 4.6 4.6 5.8
Alarm 5.1 5.8 4.8 Auto Theft 1.7 2.6 1.3 Hang-up Call 0.9 1.7 1.5 Medical 0.5 1.1 1 Mental Patient 0.7 0.8 0.8 Missing Person 0.6 0.7 0.9 Drugs/Narcotics 0.1 0.4 0.3 Other Emergency 0.2 0.2 0.2 Animal 0.1 0.3 0.2 Sex Offenses 0.1 0.2 0.2

Analysis of Albuquerque Police Department Calls for Service
10
Table 8 shows the types of calls received during each shift by percent. Of 256,398 traffic call (36.6% of all calls) 40.8% were received during the swing shift. In the same way, we see that 46.4% of public disorder calls were also received during the swing shift. Fifty-one percent of property calls were received during the day shift.
Table 8. Percent of Total Calls by Case Type and by Shift
Shift Call Type Grave Day Swing
Traffic 28.6 30.6 40.8 Suspicious Persons 29.7 29.5 40.3 Unknown/Other 20.6 43.1 36.3 Public Disorder 26.9 26.7 46.4 Property 13.2 51.3 35.5
Violent 22.9 31.1 46
Alarm 25.1 39.3 35.6 Auto Theft 22.6 49.5 28 Hang-up Call 16.3 41 42.7 Medical 13.8 42.9 43.3 Mental Patient 22 35.8 42.2 Missing Person 19.4 32.9 47.7 Drugs/Narcotics 9.2 48.2 42.6 Other Emergency 29.1 30.8 40 Animal 11.8 47.7 40.6 Sex Offenses 9.8 41.5 48.7

Analysis of Albuquerque Police Department Calls for Service
11
What is the prioritization of calls for service by type of call? APD prioritizes calls on three main levels. A priority 1 call is a felony that is in progress or there is an immediate threat to life or property. A priority 2 call is where there is no immediate threat to life of property. Misdemeanor crimes in progress are priority 2 calls. A priority 3 is any call in which a crime has already occurred with no suspects at or near the scene. Also routine events, and calls where there is no threat to life or property are priority 3 calls. A breakdown of the prioritization of calls by call type is provided in Table 9 generally, higher priority calls accounted for a higher percentage of the reports made, as compared to the percentage of calls of a given type. There are a few exceptions though, with priority 1 traffic, property, narcotics, sex offense, and missing person calls accounting for a lower percentage of reports than calls. Here we can see that a high percentage of property crime calls resulted in a report, whereas low priority violent crime calls rarely resulted in reports when compared to other priorities. Traffic calls accounted for the majority of police work, in each of the three shifts, though most traffic calls did not result in reports being made, and most traffic calls and reports were low (2 or 3) priority.
Table 9. Priority of Calls Generating a Report by Call Type
Calls For Service % Priority Reports % Priority % of Calls Resulting in
Reports Call Type 1 2 3 1 2 3 1 2 3
Traffic 4.8 67.4 27.9 2.5 95.4 2 0.44 1.2 0.06 Unknown/Other 7.3 14.2 78.5 8.8 35.6 55.6 1.92 3.98 1.13 Suspicious Persons 13.3 77.6 9.1 20 59.5 20.6 2.57 1.31 3.87
Medical 12.8 25.7 61.5 37.9 34.5 27.6 1.11 0.5 0.17 Public Disorder 9.2 71.3 19.5 28.5 64.7 6.8 6.04 1.77 0.68
Violent 31.8 49.3 18.9 46.8 46 7.2 15.82 10.03 4.1 Alarm 16.8 5.8 77.4 50 3.2 46.8 1.57 0.29 0.32 Property 6.1 6.5 87.4 4.5 4.6 91 14.1 13.53 19.9 Auto Theft 6 4.9 89 7.6 3.9 88.5 7.81 4.91 6.13 Hang-up Call 2.1 97.9 0.1 26.5 73.5 0 3.03 0.18 0 Mental Patient 90.9 18.8 0.3 90.2 9.8 0 0.83 0.44 0 Other Emergency 98.3 1.4 0.3 100 0 0 1.71 0 0 Drugs/Narcotics 8.1 90.8 1 1.5 98.5 0 0.62 3.65 0 Animal 46.7 13.6 39.7 50 16.7 33.3 0 0 0 Sex Offenses 7.8 89 3.2 1.1 95.6 3.3 0.95 7.23 6.94 Missing Person 6.9 11.4 81.8 1.1 11.9 87 0.74 4.83 4.92

Analysis of Albuquerque Police Department Calls for Service
12
What is the length of time it takes to respond to calls for service by type and priority? The response times for various types of calls is shown in Table 10 both for calls received, and those calls resulting in reports. For the majority of call types, the response time is longer for calls resulting in a report than those that do not. Notable exceptions to this finding are medical calls, alarms, hang-up calls, mental patients, and other emergency call types. This may be due to the fact that for some call types, those that resulted in a report had a high percentage of priority 2 or 3 calls, increasing the response time.
Table 10. Response Times by Call Type
Call Type Calls for Service Mean Response Time (Minutes)
Reports Mean Response Time (Minutes)
Traffic 9.12 19.12 Unknown/Other 19.33 39.5 Suspicious Persons 13.93 18.6 Medical 37.6 25.76
Public Disorder 26.62 26.08 Violent 28.19 28.72
Alarm 18.08 16.45 Property 30.07 44.92 Auto Theft 22.13 40.85 Hang-up Call 24.73 18.33 Mental Patient 14.92 10.89 Other Emergency 10.08 7.03 Drugs/Narcotics 17.81 23.83 Animal 13.11 16.92 Sex Offenses 19.74 44.12 Missing Person 28.63 61.29 All Calls 16.38 37.54
Table 11 displays the response and resolution times for calls of various priorities, with officers arriving at priority 1 calls in the shortest amount of time (9.58 minutes), but these calls ultimately took the longest time to resolve. Again we see the trend that calls resulting in reports take longer to resolve than calls that do not result in reports, with higher priority calls having longer resolution times.
Table 11. Response and Resolution Times by Priority Calls for Service Reports
Priority Response Time (Minutes)
Resolve Time (Minutes)
Response Time (Minutes)
Resolve Time (Minutes)
1 9.58 73.31 10.63 151.61 2 13.79 44.71 39.26 136 3 23.08 54.35 47.62 86.59 All 16.57 51.17 37.54 111.26

Analysis of Albuquerque Police Department Calls for Service
13
It is instructive to examine the response time by priority and call type simultaneously as seen in Figures 3 and Figure 4. Most often the fastest response time is for priority 1 calls, except types such as alarm, suspicious persons, auto theft, and traffic calls resulting in reports where priority 3 calls are resolved more quickly than priority 2 calls. This may be due in part to the distribution of priority calls in these given types. This finding deserves further study.
Figure 3. Mean Response Time for Calls by Type and Priority

Analysis of Albuquerque Police Department Calls for Service
14
Figure 4. Mean Response Time for Calls Resulting in Reports by Type and Priority

Analysis of Albuquerque Police Department Calls for Service
15
How long does it take to dispose of calls for service by type and priority? Table 12 shows the time it took to bring a call for service to its conclusion, which is calculated from the time the officer arrived on the scene to the time the call was concluded by the officer and recorded in the CARS system. Calls that resulted in reports took more time to resolve than those that did not result in a report. Some call types took more than two hours to finish the report.
Table 12. Time to Resolve Call from On The Scene to Close
Call Type Calls for Service Mean Resolution Time (Minutes)
Reports Mean Resolution Time (Minutes)
Traffic 28.3 147.3 Unknown/Other 99.2 97.9 Suspicious Persons 44.7 124.3 Medical 77.5 168.1
Public Disorder 57.2 134.3 Violent 103.2 149.3
Alarm 33.2 121.5 Property 77.6 59.7 Auto Theft 65.1 86.1 Hang-up Call 41.9 161.8 Mental Patient 74.5 148.6 Other Emergency 50.0 74.6 Drugs/Narcotics 69.7 141.7 Animal 44.2 75.7 Sex Offenses 68.6 69.8 Missing Person 65.8 106.8 All Calls 53.5 111.3

Analysis of Albuquerque Police Department Calls for Service
16
Disposition of calls for service by type, i.e., which types of calls for service result in reported crimes? In Table 13, we display a disparity we observed between the number of calls received for a given type and the number of reports generated for that type of call. Violent, property, auto theft, and sex offenses made up a larger percentage of reports filed than the percentage of calls received.
Table 13. Calls for Service and the Number of Reports by Type
Call Type Calls for Service % (N=701,091)
Reports % (N=23,581)
Percent of Calls resulting in Reports
Traffic 36.6 (256,398) 9.2 (2,164) 0.85 Suspicious Persons 12.8 (90,040) 6.5 (1,522) 1.71 Unknown/Other 12.7 (88,961) 6 (1,417) 1.59 Public Disorder 12.6 (88,676) 7.3 (1,710) 1.94 Property 8.5 (59,920) 48.3 (11,388) 19.11 Violent 5.1 (35,460) 16.3 (3,834) 10.75 Alarm 5.1(35,508) 0.8 (190) 0.53 Auto Theft 1.8 (12,953) 3.3 (788) 6.17 Hang-up Call 1.4 (10,017) 0.1 (34) 0.24 Medical 0.9 (6,241) 0.1 (29) 0.37 Mental Patient 0.8 (5,267) 0.2 (51) 0.84 Missing Person 0.8 (5,382) 1.1 (261) 4.62 Drugs/Narcotics 0.3 (2,110) 0.3 (67) 3.36 Other Emergency 0.2 (1,431) 0.1 (29) 1.68 Animal 0.2 (1,336) 0 (6) 0 Sex Offenses 0.2 (1,391) 0.4 (91) 6.73

Analysis of Albuquerque Police Department Calls for Service
17
Table 14 shows the total hours spent by officers resolving each call type over the entire 15-month period. From our analysis we know how long it takes officers to respond on average to each call type and priority level (Tables 10 and 11). We also know on average how long it takes to resolve the call after the officer arrives on the scene (Table 12). These measures of time coupled with the number of calls for service by type, allow us to make an estimate of the total number of officer hours expended. Assuming officers work 2,080 hours a year (full-time), we can estimate the number of officers needed to resolve each call type, seen in the second column of Table 14. Traffic calls took the largest number of work hours to resolve for any call type. Unknown/Other calls took the second longest number of hours followed by public disorder calls. Traffic, unknown/other and public disorder calls are primarily low prioritization calls.
Table 14. Hours Spent Resolving Calls Call Type Resolve Hours Officers needed to resolve
Traffic 120,966 46.5 Suspicious Persons 66,996 25.8 Unknown/Other 146,918 56.5 Public Disorder 84,446 32.5 Property 77,479 29.8 Violent 60,968 23.5 Alarm 19,661 7.6 Auto Theft 14,036 5.0 Hang-up Call 6,996 2.7 Medical 8,053 3.0 Mental Patient 6,537 2.5 Missing Person 5,899 2.3 Drugs/Narcotics 2,449 0.9 Other Emergency 1,191 0.5 Animal 984 0.4 Sex Offenses 1,588 0.6
Two focused analyses questions remain which we were unable to address. We were not able to detail the reasons for the time between the dispatch of the call and the officer responding to the call. Nor could we detail the reasons for the time between the officer responding to a call and the officer clearing a call. Both of these tasks require additional time and resources to interview dispatchers and police officers and compare interview information with precise details in the Tiburon data. However, as a demonstration we were able to organize a concise analysis of two property crimes, auto theft and burglary.
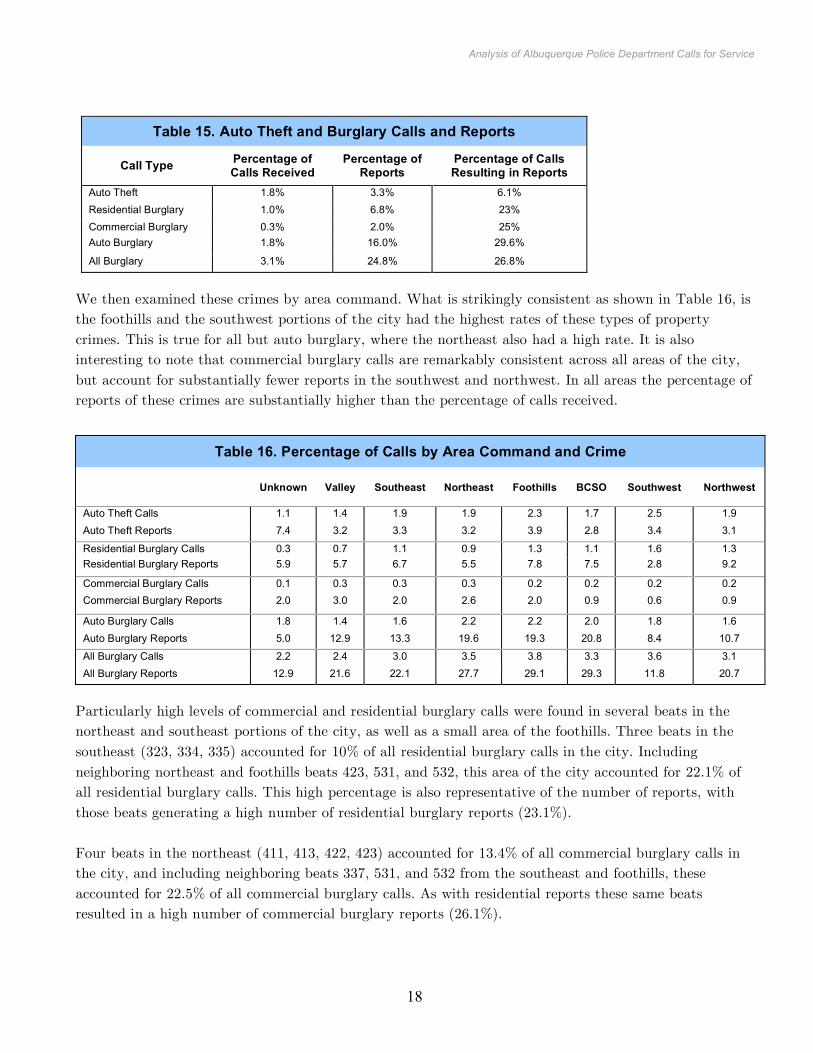
Auto Theft and Burglary We first examined what percentage of these crimes accounted for calls and reports, and how many of these calls resulted in reports. As can be seen in Table 15, while these crimes make up a small percentage of calls received, they account for nearly 10 times as many reports as calls. Moreover, with the exception of auto theft, 25% or more of the calls actually resulted in reports. This may be a result of the need for police reports for insurance purposes, and thus the complainant has motivation to follow through with a report.
Analysis of Albuquerque Police Department Calls for Service
18
Table 15. Auto Theft and Burglary Calls and Reports
Call Type Percentage of Calls Received
Percentage of Reports
Percentage of Calls Resulting in Reports
Auto Theft 1.8% 3.3% 6.1% Residential Burglary 1.0% 6.8% 23% Commercial Burglary 0.3% 2.0% 25% Auto Burglary 1.8% 16.0% 29.6%
All Burglary 3.1% 24.8% 26.8%
We then examined these crimes by area command. What is strikingly consistent as shown in Table 16, is the foothills and the southwest portions of the city had the highest rates of these types of property crimes. This is true for all but auto burglary, where the northeast also had a high rate. It is also interesting to note that commercial burglary calls are remarkably consistent across all areas of the city, but account for substantially fewer reports in the southwest and northwest. In all areas the percentage of reports of these crimes are substantially higher than the percentage of calls received.
Table 16. Percentage of Calls by Area Command and Crime
Unknown Valley Southeast Northeast Foothills BCSO Southwest Northwest
Auto Theft Calls 1.1 1.4 1.9 1.9 2.3 1.7 2.5 1.9 Auto Theft Reports 7.4 3.2 3.3 3.2 3.9 2.8 3.4 3.1
Residential Burglary Calls 0.3 0.7 1.1 0.9 1.3 1.1 1.6 1.3 Residential Burglary Reports 5.9 5.7 6.7 5.5 7.8 7.5 2.8 9.2
Commercial Burglary Calls 0.1 0.3 0.3 0.3 0.2 0.2 0.2 0.2 Commercial Burglary Reports 2.0 3.0 2.0 2.6 2.0 0.9 0.6 0.9
Auto Burglary Calls 1.8 1.4 1.6 2.2 2.2 2.0 1.8 1.6 Auto Burglary Reports 5.0 12.9 13.3 19.6 19.3 20.8 8.4 10.7
All Burglary Calls 2.2 2.4 3.0 3.5 3.8 3.3 3.6 3.1 All Burglary Reports 12.9 21.6 22.1 27.7 29.1 29.3 11.8 20.7
Particularly high levels of commercial and residential burglary calls were found in several beats in the northeast and southeast portions of the city, as well as a small area of the foothills. Three beats in the southeast (323, 334, 335) accounted for 10% of all residential burglary calls in the city. Including neighboring northeast and foothills beats 423, 531, and 532, this area of the city accounted for 22.1% of all residential burglary calls. This high percentage is also representative of the number of reports, with those beats generating a high number of residential burglary reports (23.1%). Four beats in the northeast (411, 413, 422, 423) accounted for 13.4% of all commercial burglary calls in the city, and including neighboring beats 337, 531, and 532 from the southeast and foothills, these accounted for 22.5% of all commercial burglary calls. As with residential reports these same beats resulted in a high number of commercial burglary reports (26.1%).

Analysis of Albuquerque Police Department Calls for Service
19
The Figure 5 map shows the geographic center of commercial burglary locations in the four beats with the most commercial burglary calls, from left to right are 411, 413, 422, and 423.
Figure 5. Location of the Geographic Centers of Commercial Burglaries in Beats 411, 413, 422, and 423.
Figure 6 is a similar map showing the geographic center for the beats with the most reported residential burglaries, from left to right are 323, 334, 335.
Figure 6. Location of the Geographic Centers of Residential Burglaries in Beats 323, 334, and 335.

Analysis of Albuquerque Police Department Calls for Service
20
If we look at residential and commercial burglaries during the month of August 2008, we see the beats come into stark relief. In Figure 7, residential burglaries are represented by blue dots, and commercial burglaries in red. High concentrations of residential burglaries can be seen in the University Heights/ South Nob Hill Area, east of the Fairgrounds, and south of Central Avenue east of San Mateo Boulevard. Commercial burglaries primarily occurred along the I-25 corridor north of I-40.
Figure 7. Calls for Residential and Commercial Burglaries, August 2008.
Figure 8 shows residential burglaries in blue and commercial burglaries in red. Several clusters of burglary reports exist in the southeast and southwest parts of Albuquerque but there is no clear pattern. We believe it would be useful to review calls for service and crime reports by crime type at other levels. For example, reviewing burglaries by smaller geographic areas (Figure 9) or by time of day and day of week may prove more useful and reveal “hot spots” or problem areas. Reviewing incident reports may also provide information that is useful for identifying offenders and crime patterns, e.g., burglaries of homes with open garages. Additionally, overlaying other types of information like home addresses of parolees and probationers may be useful. The comparison of Figure 7 with Figure 8 also suggests the use

Analysis of Albuquerque Police Department Calls for Service
21
of calls for service data for problem solving may be less useful. Because approximately 1 in 5 calls for service results in a reported crime, calls for service may over-estimate the existence of a problem.
Figure 8. Calls for Service Generating Reports of Residential and Commercial Burglaries, August 2008.

Analysis of Albuquerque Police Department Calls for Service
22
Below, in Figure 9 we see a close up of the areas east of the Fairgrounds and University Heights, showing an unusual concentration of residential burglary.
Figure 9. Calls for Service, Residential Burglaries (blue dots), August 2008.

Analysis of Albuquerque Police Department Calls for Service
23
Figure 10 shows a concentration of commercial burglaries along the I-25 Corridor north of I-40. This level of burglaries may be due to a higher concentration of businesses in the area than in other areas.
Figure 10. Calls for Service, Commercial Burglaries (red dots), August 2008.
If we examine the time period, which these burglaries occurred, several trends appear. Table 17 shows commercial burglary calls come primarily during the day shift, while residential burglaries are predominantly split between the day and swing shift.
Table 17. Times of Burglary Calls
Shift Commercial Burglary
Residential Burglary
Grave 23:00-7:30 22.8 9.7 Day 7:30-15:30 62.9 45.0 Swing 15:30-23:00 14.3 45.3
Findings and Potential Research During our study, we surveyed a select group of eight regional emergency police dispatch agencies. Our survey did not produce many surprising results but confirmed the practices we expected. We found

Analysis of Albuquerque Police Department Calls for Service
24
police departments perform the task of dispatching emergency calls or dispatch is performed by a larger multi-jurisdictional agency. Jurisdictions have decided that by entering into inter-local agreements and cooperating with each other they can create a more efficient form of 911 emergency communications, i.e., law enforcement, fire, and rescue. We found the number of emergency calls to each call center was related to the population of the jurisdiction. APD’s response was average for the group of agencies we surveyed. We also found agency policies for handling intentional and unintentional 911 calls are very similar among the eight agencies. Additionally, call priorities generally on a scale of 1 to 3 with 1 being the highest or most important type of call. Priority 1 calls are life-threatening calls and will be dispatched before all others. Priority 2 calls are not life-threatening or extremely dangerous calls. Priority 3 is a call for the police usually after a crime has been committed. Calls with a priority higher than 3, are usually administrative in nature. The majority of police departments offer the public a variety of methods for reporting crimes and are frequently improving current methods. For example, during our survey process the Omaha Police Department unveiled a re-designed website with an improved crime reporting feature. We also found that all eight departments we surveyed have Non-Emergency contact numbers and accept filing reports over the phone or in-person at a police substation. In our 2008 Preliminary Report, we proposed using 24-months worth of CFS data to answer questions, like: Which calls happen most frequently? Are different types of calls more likely during different seasons of the year? Using the 15-months of available data we found the most frequent calls were for traffic, unknown/other, suspicious persons, public disorder, and property offenses. Violent, property, auto theft, and sex offenses made up a larger percentage of reports filed than the percentage of calls received. These findings are very similar to our findings in the Preliminary Report. In that report traffic accounted for 34% of all calls and suspicious persons and other/unknown accounted for approximately 27% of all calls. Alarm calls in the 2008 Report made up 5% of all calls. These figures are similar to our findings in this study. The category other/unknown contained a wide variety of call types, e.g., “Contact”, “Juvenile Call”, “Tac plan”, which did not fit in our standard categories. Our other/unknown category also includes entries, which appear to be mistakes in the call type entry. We found instances where the call type of a call for service record was entered as a single digit, e.g., “3”, “4”, and “Q”. We also found occurrences where an informal abbreviation was entered as the call type, e.g., “Juvie BOLO”, and “unk/t.” Most other/unknown types did not occur very often but there are more than 40 call types in this category. APD may benefit by running an error report on their CMS data. An error report would identify obvious mistakes and misspellings in the data. Calls for Service and Crime Reports by Call Type Traffic calls for service to both the emergency and non-emergency number accounted for 36.6% of all calls and accounted for less than 1% of all crime reports. Traffic calls on average took 28.3 minutes to resolve, which was the least amount of time of all 16 call types, 25.2 minutes less than the average, and 4.9 minutes longer on average than alarm calls, which had the second lowest average resolution time. While they were the quickest call type to resolve and they resulted in very few reports, traffic calls took up the greatest amount of times in hours for officers responding to calls to resolve. Other types of public order calls including public disorder calls for service also took up lots of officer time to resolve. It would be useful to further explore call types and resolution times.

Analysis of Albuquerque Police Department Calls for Service
25
Importantly, more serious call types with higher prioritization had fewer calls for service and had a higher percentage of calls that resulted in reports. This includes property and violent calls for service, which were fifth and sixth out of 16 call types in the total number of calls for service. Violent calls for service took the longest time on average to resolve (103.2 minutes) and property crimes took the 3rd longest amount of time on average to resolve at 77.5 minutes. Together property and violent crimes accounted for 13.6% of all calls. Drug/narcotics and sex offenses calls for services accounted for very few calls (0.5%). Interestingly, other/unknown calls for service took the second longest amount of time to resolve at 99.2 minutes. Specific analyses should be conducted to review other/unknown calls. It may also be useful to use this type of analysis as a starting point for discussions regarding how best to respond to certain types of calls for service. For example, the largest volume of calls for service is traffic and the vast majority of traffic calls for service are a low priority and they seldom result in reports. It may be just as effective and more economical to have a larger number of police service aides available to respond to traffic calls that are of a low priority. Alarm calls may be another example of a call type that could have a different type of response. The majority of alarm calls are of a low priority and less than 0.5% of priority 2 or priority 3 alarm calls result in a report. This finding suggests that the large majority of alarm calls are false alarms. Calls for Service by Area Command and Shift The review of calls for service by area command and shift found the number of calls varied by both area command and shift. We did not review calls for service by police beat. The Southeast area command accounted for 22.3% of all calls for service. Citywide the swing shift accounted for 40.4% of all calls for service and the grave shift accounted for 25.1% of all calls for service. Additional analyses of calls for service by area command, beat, and shift along with other measures of police workload (crime reports and police initiated work) could be useful in measuring police workload by area command, beat, shift, and day of week to aid in the deployment of patrol officers. Prioritization of Call Types We found officers responded to priority 1 calls for service in approximately 9.5 minutes and it took about 2.5 hours to complete a report on a priority 1 call. Traffic calls accounted for the majority of all calls and most traffic calls were priority 2 or 3 (67.4% and 27.9% respectively). Rescue type calls (i.e., emergency other and mental patient) require priority 1 designation more than 90% of the time. Animal calls, violent, alarm, suspicious persons, and medical calls are dispatched as priority 1 calls more than 10% of the time. Calls where no immediate threat to life or property, e.g., narcotics and hang-up calls are dispatched as priority 2 calls more than 90% of the time. A more complete review of calls for service by priority and location (i.e. area command and police beat) should be completed. This review could be helpful in a discussion of the re-prioritization of some calls for service. Auto Theft and Burglary The review of auto theft and burglary calls for service data and reported crime was designed to provide a more in-depth review of several call types that included some limited crime mapping. While auto theft

Analysis of Albuquerque Police Department Calls for Service
26
and burglary made up 3.1% of all calls for service they accounted for 24.8% of all police reports. Overall 26.8% of all burglary calls result in police reports. The preliminary maps of auto theft and burglary using calls for service data show some evidence of clustering or potential hot spots. More detailed analyses are needed to more completely understand this issue. The comparison of Figure 7 with Figure 8 also suggests the use of calls for service data for problem solving may be less useful. Because approximately 1 in 5 calls for service results in a reported crime, calls for service may over-estimate the existence of a problem. To measure hot spots or problem areas it would be useful to use reported crime data to help point out problems and then more detailed and focused analyses to determine the exact nature of the problem and potential responses. We have learned about the Tiburon data from this analysis of calls for service. At this point we could complete a trend analysis of specific types of calls. For example, we could address the question of whether or not the specific types of property calls have changed over time. In the report we examined some temporal issues related to different types of calls. Using the time variables in the data, we calculated the amount of time it took for the officer to arrive on the scene and the length of time the incident lasted. We determined which calls were responded to more or less quickly (Tables 10 and 11 and Figures 3 and 8) and which calls are taking up large amounts of officer time (Tables 10 — 14). The calls for service data can be mapped, since the data contains x-y coordinates. We were not asked to map the calls for service data in this study, however we provided an abridged examination of auto theft, and residential and commercial burglary by area command and beat over the 15-month period (Tables 15, 16, 17, and Figures 5 - 10). Our examination of these particular property crimes begins to answer the question of which areas experience the most calls and reported crimes and are there geographic patterns to the calls, that is, are certain areas more likely to receive certain types of calls for service?