analyzing malicious behavior effectively with extrahop
TRANSCRIPT
In the past decade, the information security industry has learned a lot about what attackers do during campaigns against targets. While we don’t always understand the motivation behind attacks, most attacker goals focus on data access and exfiltration of sensitive data. Sophisticated attackers often use advanced malware-based espionage that can aggressively pursue and compromise specific targets. These attacks often start with social engineering tactics, such as spearphishing attempts. Once attackers have compromised the target, they attempt to maintain a persistent presence within the victim’s network, escalate privileges, and move laterally to extract sensitive information.
Enterprise security teams have struggled to keep pace with attacker tactics and techniques, and many of the security tools they’ve relied on have not kept up with new methods of ingress, data access, and exfiltration. Security teams are facing pressure to detect attacks and respond more rapidly, which is difficult when trying to find evidence of reconnaissance, lateral movement, privilege escalation, and other stealthy behavior. Compounding this challenge is a lack of critical skills in security operations, placing the burden on busy, short-staffed teams to do more.
In the SANS survey “Closing the Critical Skills Gap for Modern and Effective Security Operations Centers (SOCs),” the primary areas in which respondents indicated that they need assistance were overall security operational skills, followed by security event management, and then cloud-focused security operations.1 To enable junior analysts to more readily and effectively contribute, the primary security detection and response platforms that organizations use will need to be much more intuitive and capable of providing quick access to the right information for investigation.
©2020 SANS™ Institute
Sponsored by:
ExtraHop
Analyzing Malicious Behavior Effectively with ExtraHop Reveal(x)
Written by Dave Shackleford
December 2020
1 “Closing the Critical Skills Gap for Modern and Effective Security Operations Centers (SOCs),” July 2020, www.sans.org/reading-room/whitepapers/analyst/closing-critical-skills-gap-modern-effective-security-operations-centers-socs-39695, p.9. [Registration required.]
A SANS Product Overview
SANS had the opportunity to review ExtraHop’s Reveal(x) Network Detection and Response (NDR) product, a platform that can rapidly analyze huge quantities of network data for security analysts. This is actually the third time SANS has reviewed Reveal(x), and ExtraHop has added many enhancements and features that augment its behavior-focused model of detection and response, all of which can help intrusion analysis and investigation teams analyze malicious behavior in their environments faster and more effectively.
Reveal(x) Features and Overview
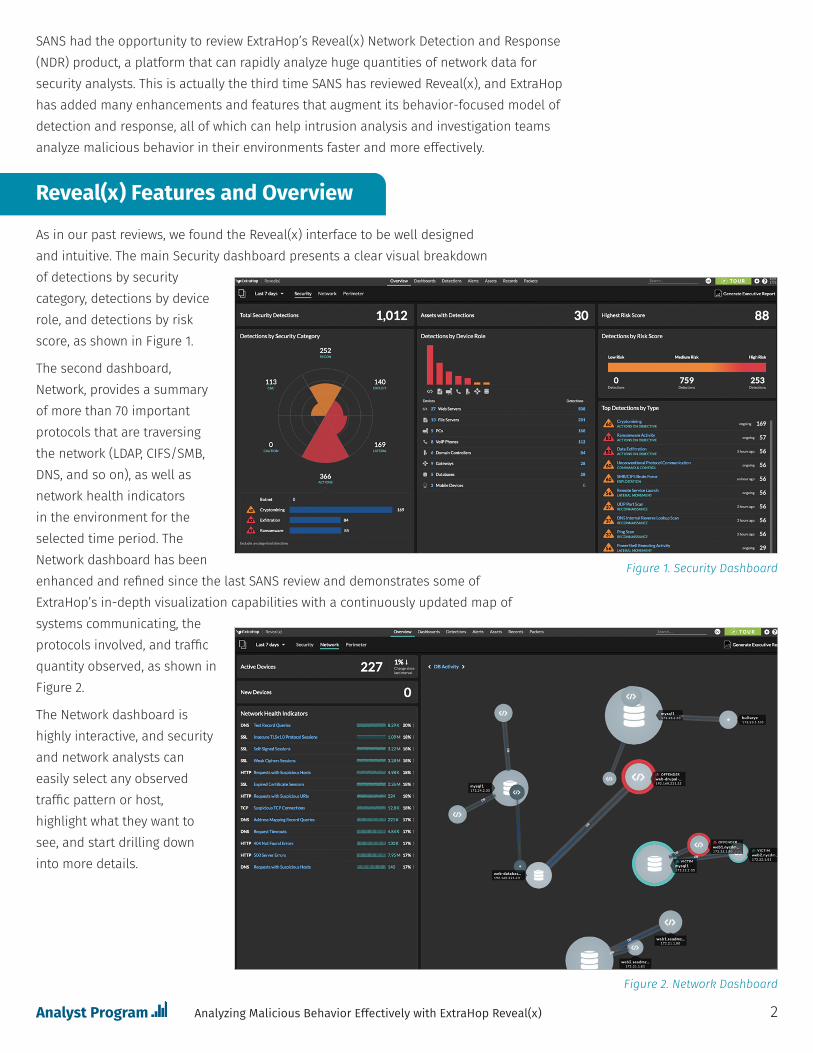
As in our past reviews, we found the Reveal(x) interface to be well designed and intuitive. The main Security dashboard presents a clear visual breakdown of detections by security category, detections by device role, and detections by risk score, as shown in Figure 1.
The second dashboard, Network, provides a summary of more than 70 important protocols that are traversing the network (LDAP, CIFS/SMB, DNS, and so on), as well as network health indicators in the environment for the selected time period. The Network dashboard has been enhanced and refined since the last SANS review and demonstrates some of ExtraHop’s in-depth visualization capabilities with a continuously updated map of systems communicating, the protocols involved, and traffic quantity observed, as shown in Figure 2.
The Network dashboard is highly interactive, and security and network analysts can easily select any observed traffic pattern or host, highlight what they want to see, and start drilling down into more details.
2Analyzing Malicious Behavior Effectively with ExtraHop Reveal(x)
Figure 1. Security Dashboard
Figure 2. Network Dashboard
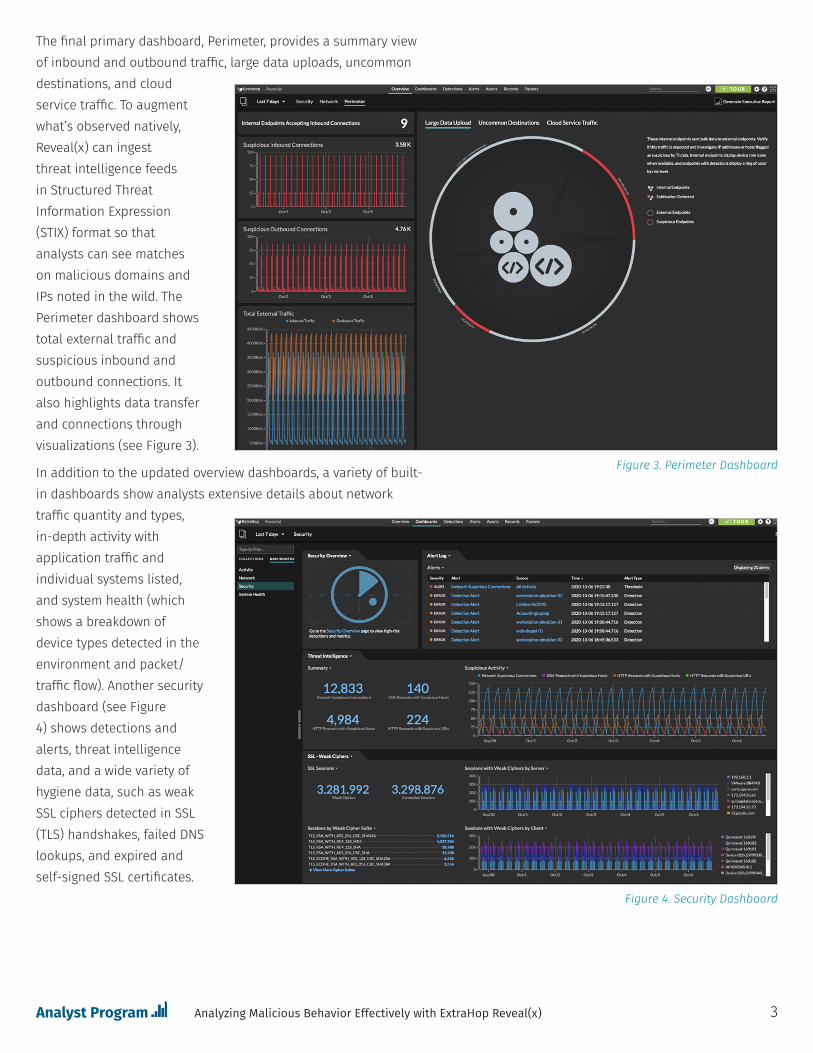
The final primary dashboard, Perimeter, provides a summary view of inbound and outbound traffic, large data uploads, uncommon destinations, and cloud service traffic. To augment what’s observed natively, Reveal(x) can ingest threat intelligence feeds in Structured Threat Information Expression (STIX) format so that analysts can see matches on malicious domains and IPs noted in the wild. The Perimeter dashboard shows total external traffic and suspicious inbound and outbound connections. It also highlights data transfer and connections through visualizations (see Figure 3).
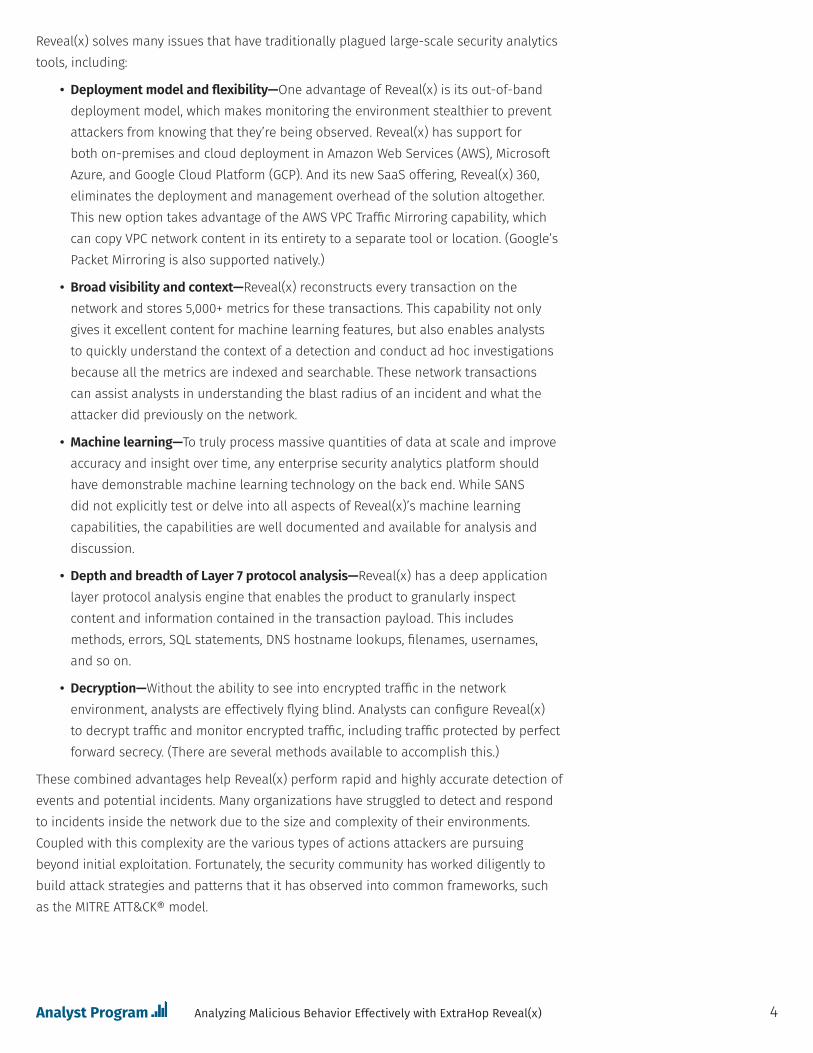
In addition to the updated overview dashboards, a variety of built-in dashboards show analysts extensive details about network traffic quantity and types, in-depth activity with application traffic and individual systems listed, and system health (which shows a breakdown of device types detected in the environment and packet/traffic flow). Another security dashboard (see Figure 4) shows detections and alerts, threat intelligence data, and a wide variety of hygiene data, such as weak SSL ciphers detected in SSL (TLS) handshakes, failed DNS lookups, and expired and self-signed SSL certificates.
3Analyzing Malicious Behavior Effectively with ExtraHop Reveal(x)
Figure 3. Perimeter Dashboard
Figure 4. Security Dashboard
4
Reveal(x) solves many issues that have traditionally plagued large-scale security analytics tools, including:
• Deployment model and flexibility—One advantage of Reveal(x) is its out-of-band deployment model, which makes monitoring the environment stealthier to prevent attackers from knowing that they’re being observed. Reveal(x) has support for both on-premises and cloud deployment in Amazon Web Services (AWS), Microsoft Azure, and Google Cloud Platform (GCP). And its new SaaS offering, Reveal(x) 360, eliminates the deployment and management overhead of the solution altogether. This new option takes advantage of the AWS VPC Traffic Mirroring capability, which can copy VPC network content in its entirety to a separate tool or location. (Google’s Packet Mirroring is also supported natively.)
• Broad visibility and context—Reveal(x) reconstructs every transaction on the network and stores 5,000+ metrics for these transactions. This capability not only gives it excellent content for machine learning features, but also enables analysts to quickly understand the context of a detection and conduct ad hoc investigations because all the metrics are indexed and searchable. These network transactions can assist analysts in understanding the blast radius of an incident and what the attacker did previously on the network.
• Machine learning—To truly process massive quantities of data at scale and improve accuracy and insight over time, any enterprise security analytics platform should have demonstrable machine learning technology on the back end. While SANS did not explicitly test or delve into all aspects of Reveal(x)’s machine learning capabilities, the capabilities are well documented and available for analysis and discussion.
• Depth and breadth of Layer 7 protocol analysis—Reveal(x) has a deep application layer protocol analysis engine that enables the product to granularly inspect content and information contained in the transaction payload. This includes methods, errors, SQL statements, DNS hostname lookups, filenames, usernames, and so on.
• Decryption—Without the ability to see into encrypted traffic in the network environment, analysts are effectively flying blind. Analysts can configure Reveal(x) to decrypt traffic and monitor encrypted traffic, including traffic protected by perfect forward secrecy. (There are several methods available to accomplish this.)
These combined advantages help Reveal(x) perform rapid and highly accurate detection of events and potential incidents. Many organizations have struggled to detect and respond to incidents inside the network due to the size and complexity of their environments. Coupled with this complexity are the various types of actions attackers are pursuing beyond initial exploitation. Fortunately, the security community has worked diligently to build attack strategies and patterns that it has observed into common frameworks, such as the MITRE ATT&CK® model.
Analyzing Malicious Behavior Effectively with ExtraHop Reveal(x)
5
Hybrid and Multicloud Environments As more organizations build and deploy cloud-based infrastructure, the need to provide a unified detection and response control and analysis plane accelerates quickly. Many security teams are finding that assets are being created in multiple public clouds, along with existing in on-premises systems and on remote sites and platforms, including IoT systems.
To help security operations teams simplify and unify their efforts, ExtraHop has built Reveal(x) 360, a cloud-native SaaS network detection and response service that incorporates more than 5,000 security metrics, more than 70 supported protocols, support for TLS 1.3 and numerous certificate and cipher suites, and scales to 100Gbps. By building a SaaS solution, ExtraHop significantly reduced the management requirements for NDR. In Reveal(x) 360, ExtraHop machine learning can process traffic and events at a massive scale, analyzing data from numerous environments and deployment scenarios in one place. In fact, unlike other NDR solutions, Reveal(x) has never run its machine learning processes entirely on the Reveal(x) appliance. The more compute-intensive models have always run in the cloud, and all data is carefully de-identified and tokenized to ensure GDPR compliance of the cloud detection service. This has the benefit of enabling Reveal(x) to run more than a hundred predictive models for each entity on the network, correlate detections across sensors for peer group analysis, and apply rapid updates.
New and Updated Detection and Response Features
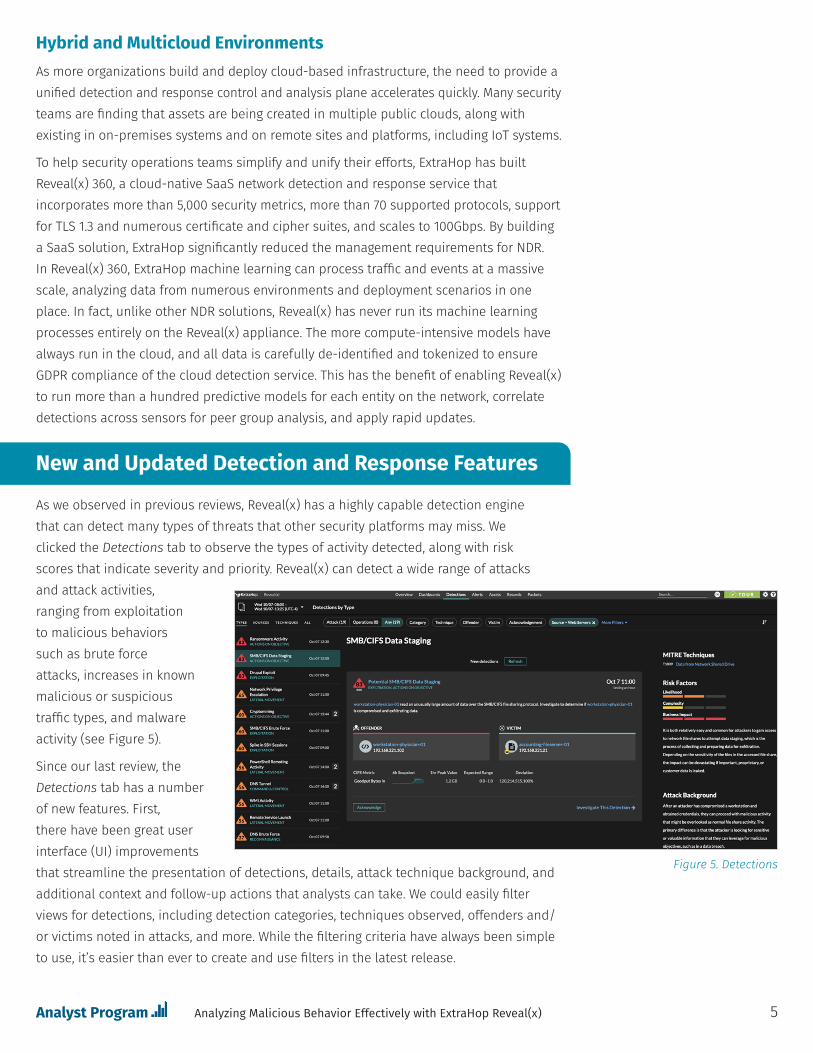
As we observed in previous reviews, Reveal(x) has a highly capable detection engine that can detect many types of threats that other security platforms may miss. We clicked the Detections tab to observe the types of activity detected, along with risk scores that indicate severity and priority. Reveal(x) can detect a wide range of attacks and attack activities, ranging from exploitation to malicious behaviors such as brute force attacks, increases in known malicious or suspicious traffic types, and malware activity (see Figure 5).
Since our last review, the Detections tab has a number of new features. First, there have been great user interface (UI) improvements that streamline the presentation of detections, details, attack technique background, and additional context and follow-up actions that analysts can take. We could easily filter views for detections, including detection categories, techniques observed, offenders and/or victims noted in attacks, and more. While the filtering criteria have always been simple to use, it’s easier than ever to create and use filters in the latest release.
Analyzing Malicious Behavior Effectively with ExtraHop Reveal(x)
Figure 5. Detections
6
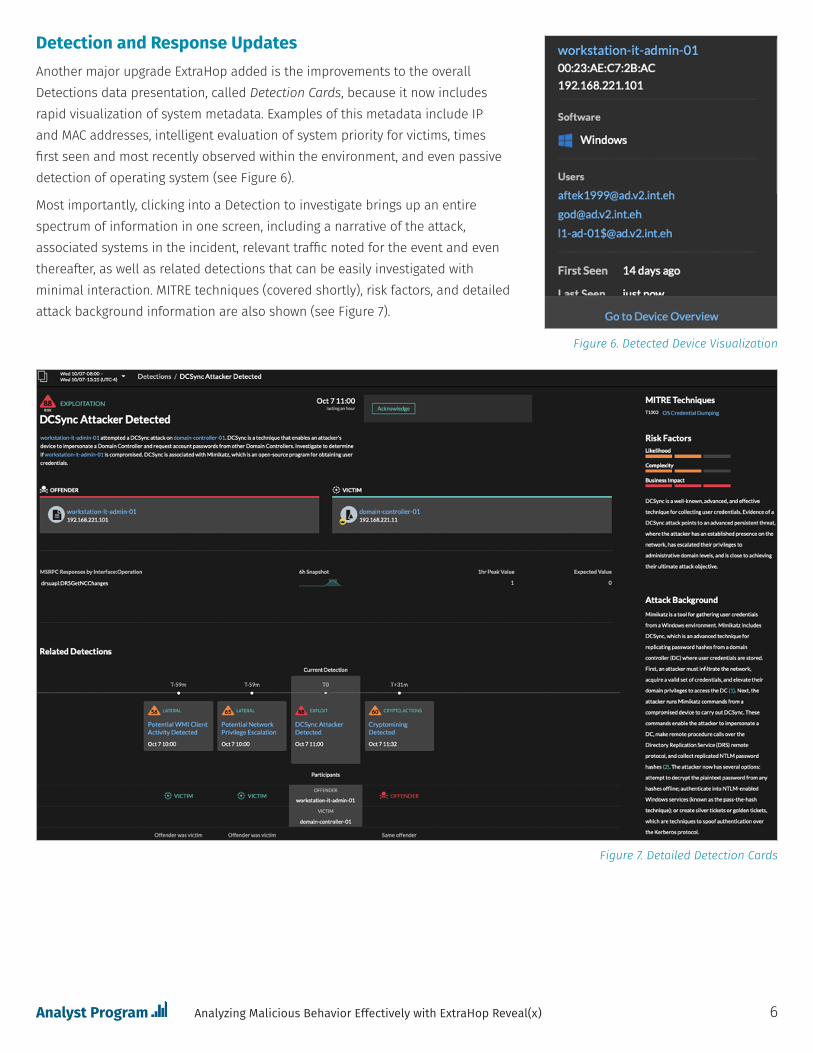
Detection and Response UpdatesAnother major upgrade ExtraHop added is the improvements to the overall Detections data presentation, called Detection Cards, because it now includes rapid visualization of system metadata. Examples of this metadata include IP and MAC addresses, intelligent evaluation of system priority for victims, times first seen and most recently observed within the environment, and even passive detection of operating system (see Figure 6).
Most importantly, clicking into a Detection to investigate brings up an entire spectrum of information in one screen, including a narrative of the attack, associated systems in the incident, relevant traffic noted for the event and even thereafter, as well as related detections that can be easily investigated with minimal interaction. MITRE techniques (covered shortly), risk factors, and detailed attack background information are also shown (see Figure 7).
Analyzing Malicious Behavior Effectively with ExtraHop Reveal(x)
Figure 6. Detected Device Visualization
Figure 7. Detailed Detection Cards
7Analyzing Malicious Behavior Effectively with ExtraHop Reveal(x)
While there are many industry models that describe attack phases, ATT&CK is widely considered the most mature attack life cycle. It consists of the following stages:
• Persistence—This stage involves setting up backdoors and methods to retain access over time on the system.
• Privilege Escalation— In this stage, attackers use DLL injection, using setuid and privileged account access (and more), with the intention of elevating privileges on the local system to gain more thorough control.
• Defense Evasion—Defense evasion attempts to avoid host defenses, such as intrusion detection, malware prevention, and logging. Examples include clearing shell history and logs, token manipulation, and obfuscating files.
• Credential Access—Classic account attacks that include brute force attacks against usernames and passwords, sniffing, private key compromise, and dumping credentials from memory can assist attackers in gaining access to new systems or furthering access in existing systems or applications.
• Discovery—In this stage, attackers look for other types of information to leverage. This may include user data, privileges, devices, applications, services, and data.
• Lateral Movement—In this phase, attackers look to migrate from one compromised host to others in the environment. They may use techniques such as pass the hash with credentials, remote admin and access tools, remote services, and logon scripts.
• Execution—Execution is the stage where attackers use various tools or methods to gain additional access in the environment, often leveraging tools such as PowerShell, scripts, and service-based vulnerabilities.
• Collection—Attackers invariably want to collect data from compromised systems, which may include clipboard info, input from the keyboard and other devices, and screen/video captures.
• Exfiltration—Attackers interested in compromise for profit, as well as those with specific goals, will almost always look to exfiltrate data from the environment, with the exception of ransomware situations where the valuable data is held hostage via encryption without being exfiltrated. This may involve encrypting the data, setting up different types of network channels and protocols for moving data out of the network, and scheduling data transfer.
• Command and Control—For longer-term attack campaigns, attackers will seek always-on control over compromised systems. Establishing a command and control mechanism on these hosts may involve custom protocols, encapsulated and tunneled content, and use of encryption.
8
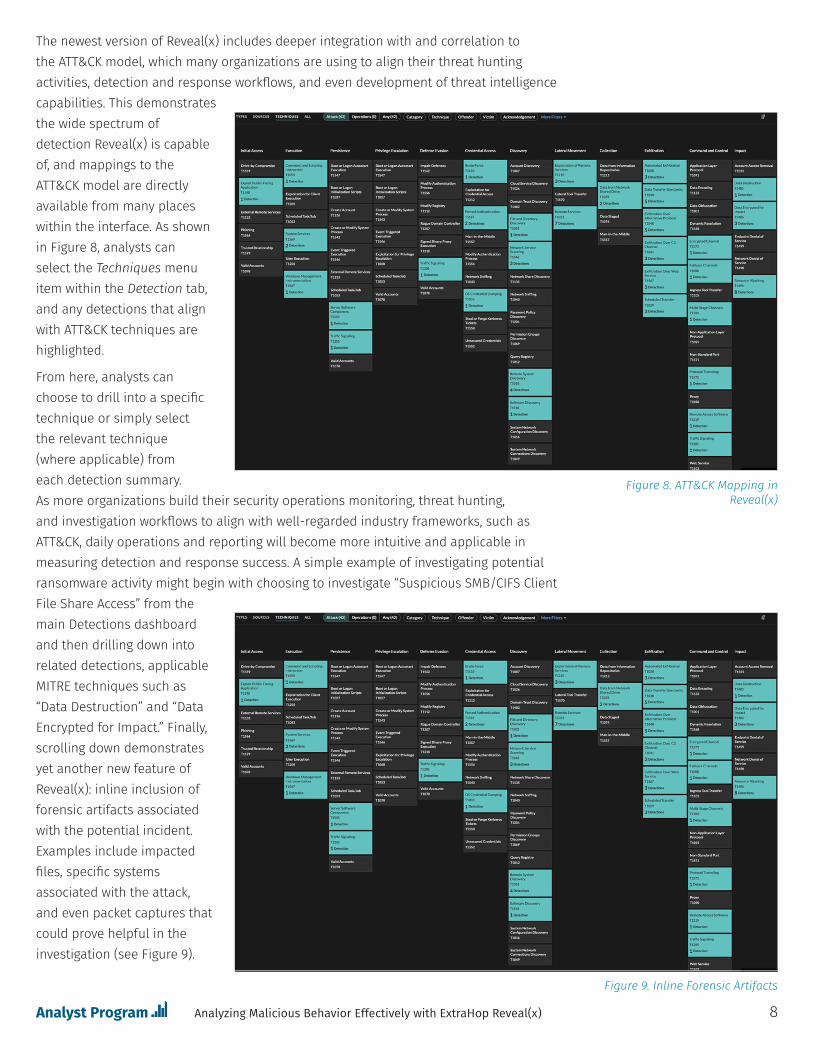
The newest version of Reveal(x) includes deeper integration with and correlation to the ATT&CK model, which many organizations are using to align their threat hunting activities, detection and response workflows, and even development of threat intelligence capabilities. This demonstrates the wide spectrum of detection Reveal(x) is capable of, and mappings to the ATT&CK model are directly available from many places within the interface. As shown in Figure 8, analysts can select the Techniques menu item within the Detection tab, and any detections that align with ATT&CK techniques are highlighted.
From here, analysts can choose to drill into a specific technique or simply select the relevant technique (where applicable) from each detection summary. As more organizations build their security operations monitoring, threat hunting, and investigation workflows to align with well-regarded industry frameworks, such as ATT&CK, daily operations and reporting will become more intuitive and applicable in measuring detection and response success. A simple example of investigating potential ransomware activity might begin with choosing to investigate “Suspicious SMB/CIFS Client File Share Access” from the main Detections dashboard and then drilling down into related detections, applicable MITRE techniques such as “Data Destruction” and “Data Encrypted for Impact.” Finally, scrolling down demonstrates yet another new feature of Reveal(x): inline inclusion of forensic artifacts associated with the potential incident. Examples include impacted files, specific systems associated with the attack, and even packet captures that could prove helpful in the investigation (see Figure 9).
Analyzing Malicious Behavior Effectively with ExtraHop Reveal(x)
Figure 9. Inline Forensic Artifacts
Figure 8. ATT&CK Mapping in Reveal(x)
9
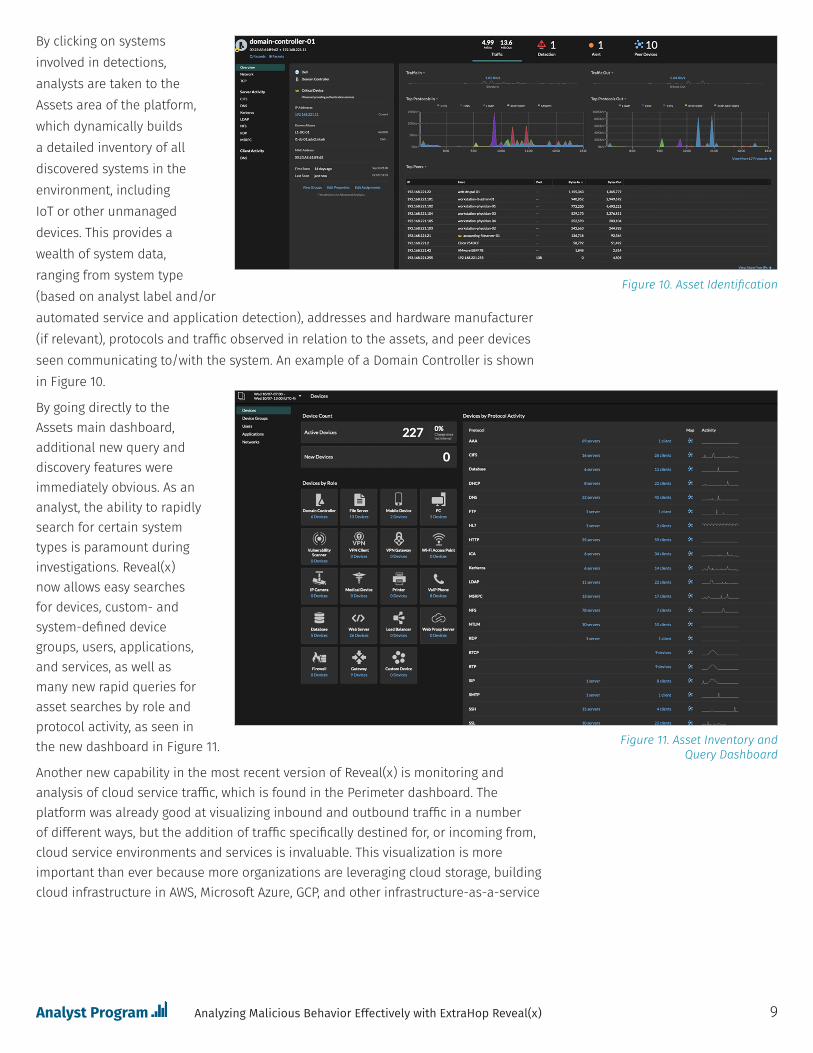
By clicking on systems involved in detections, analysts are taken to the Assets area of the platform, which dynamically builds a detailed inventory of all discovered systems in the environment, including IoT or other unmanaged devices. This provides a wealth of system data, ranging from system type (based on analyst label and/or automated service and application detection), addresses and hardware manufacturer (if relevant), protocols and traffic observed in relation to the assets, and peer devices seen communicating to/with the system. An example of a Domain Controller is shown in Figure 10.
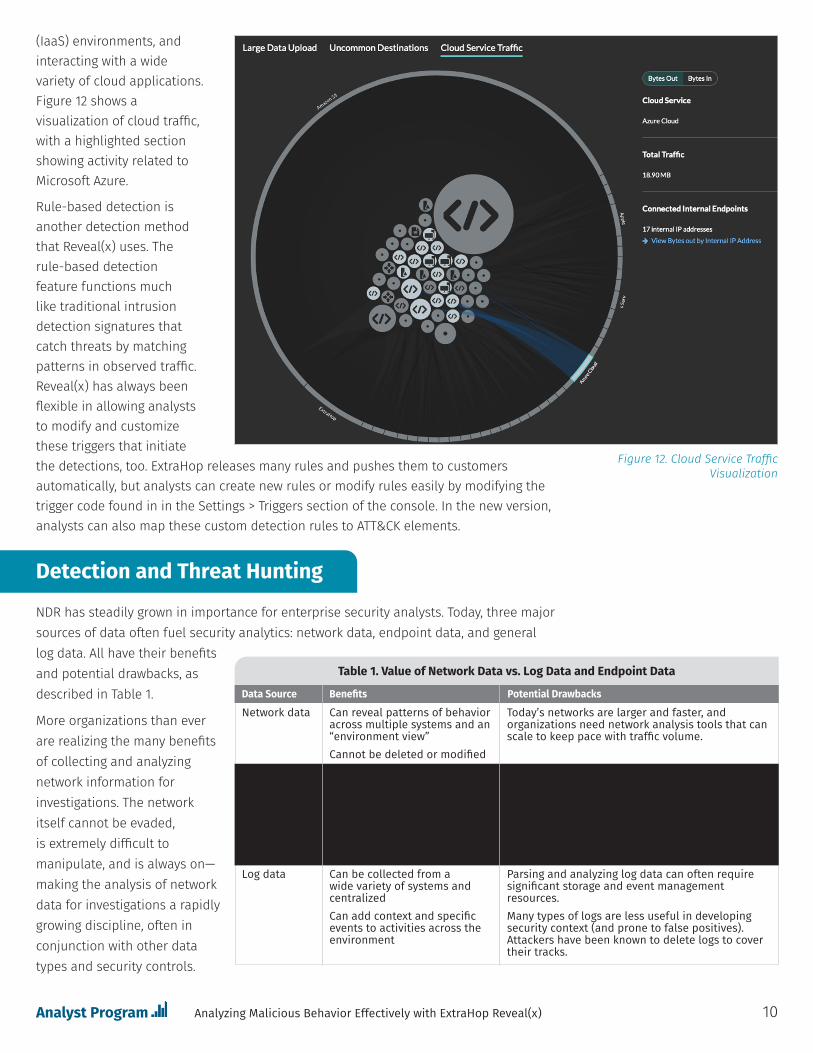
By going directly to the Assets main dashboard, additional new query and discovery features were immediately obvious. As an analyst, the ability to rapidly search for certain system types is paramount during investigations. Reveal(x) now allows easy searches for devices, custom- and system-defined device groups, users, applications, and services, as well as many new rapid queries for asset searches by role and protocol activity, as seen in the new dashboard in Figure 11.
Another new capability in the most recent version of Reveal(x) is monitoring and analysis of cloud service traffic, which is found in the Perimeter dashboard. The platform was already good at visualizing inbound and outbound traffic in a number of different ways, but the addition of traffic specifically destined for, or incoming from, cloud service environments and services is invaluable. This visualization is more important than ever because more organizations are leveraging cloud storage, building cloud infrastructure in AWS, Microsoft Azure, GCP, and other infrastructure-as-a-service
Analyzing Malicious Behavior Effectively with ExtraHop Reveal(x)
Figure 11. Asset Inventory and Query Dashboard
Figure 10. Asset Identification
10
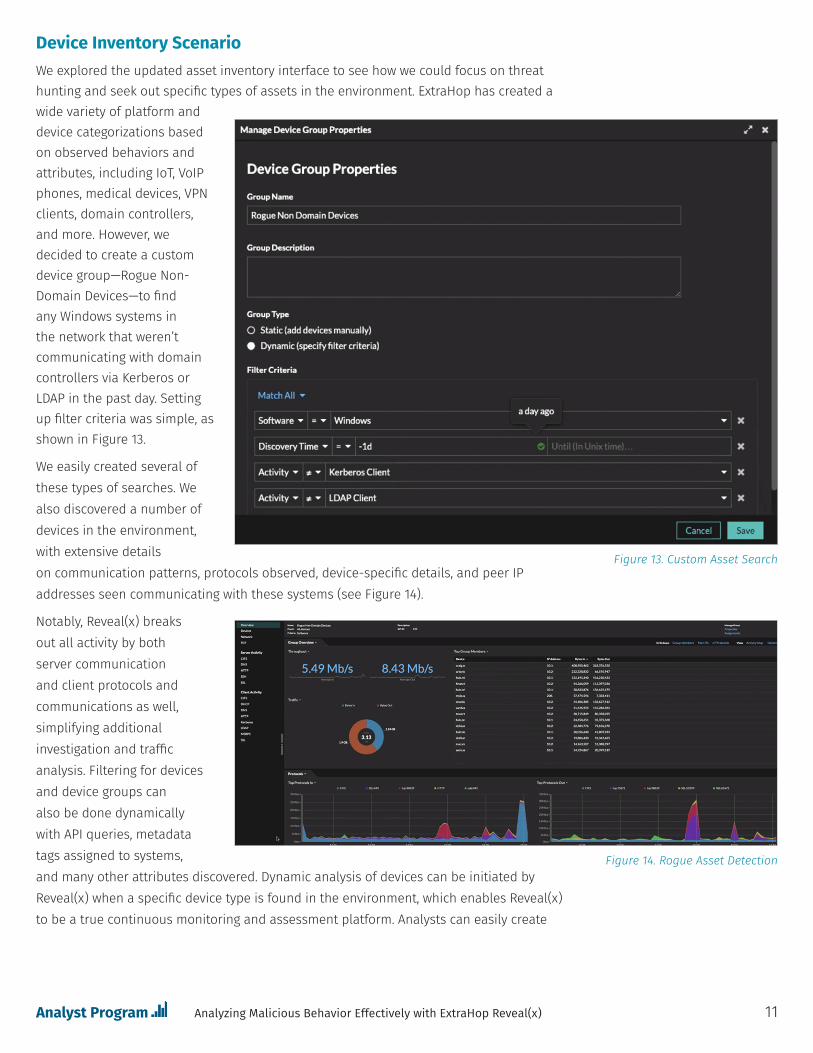
(IaaS) environments, and interacting with a wide variety of cloud applications. Figure 12 shows a visualization of cloud traffic, with a highlighted section showing activity related to Microsoft Azure.
Rule-based detection is another detection method that Reveal(x) uses. The rule-based detection feature functions much like traditional intrusion detection signatures that catch threats by matching patterns in observed traffic. Reveal(x) has always been flexible in allowing analysts to modify and customize these triggers that initiate the detections, too. ExtraHop releases many rules and pushes them to customers automatically, but analysts can create new rules or modify rules easily by modifying the trigger code found in in the Settings > Triggers section of the console. In the new version, analysts can also map these custom detection rules to ATT&CK elements.
Detection and Threat Hunting
NDR has steadily grown in importance for enterprise security analysts. Today, three major sources of data often fuel security analytics: network data, endpoint data, and general log data. All have their benefits and potential drawbacks, as described in Table 1.
More organizations than ever are realizing the many benefits of collecting and analyzing network information for investigations. The network itself cannot be evaded, is extremely difficult to manipulate, and is always on—making the analysis of network data for investigations a rapidly growing discipline, often in conjunction with other data types and security controls.
Analyzing Malicious Behavior Effectively with ExtraHop Reveal(x)
Table 1. Value of Network Data vs. Log Data and Endpoint Data
Data Source Benefits Potential Drawbacks
Network data
Endpoint data
Log data
Can reveal patterns of behavior across multiple systems and an “environment view”Cannot be deleted or modifiedLow-level attack indicators and behaviors that can help in forensics and attack analysisUnique malware and exploit code capture and analysis
Can be collected from a wide variety of systems and centralizedCan add context and specific events to activities across the environment
Today’s networks are larger and faster, and organizations need network analysis tools that can scale to keep pace with traffic volume.
Scaling endpoint detection events and correlating them can be challenging.Endpoints that are compromised as part of an attack can be modified, making the data potentially suspect.Note: It is also difficult to know if you have instrumented all of your endpoints.Parsing and analyzing log data can often require significant storage and event management resources.Many types of logs are less useful in developing security context (and prone to false positives). Attackers have been known to delete logs to cover their tracks.
Figure 12. Cloud Service Traffic Visualization
11
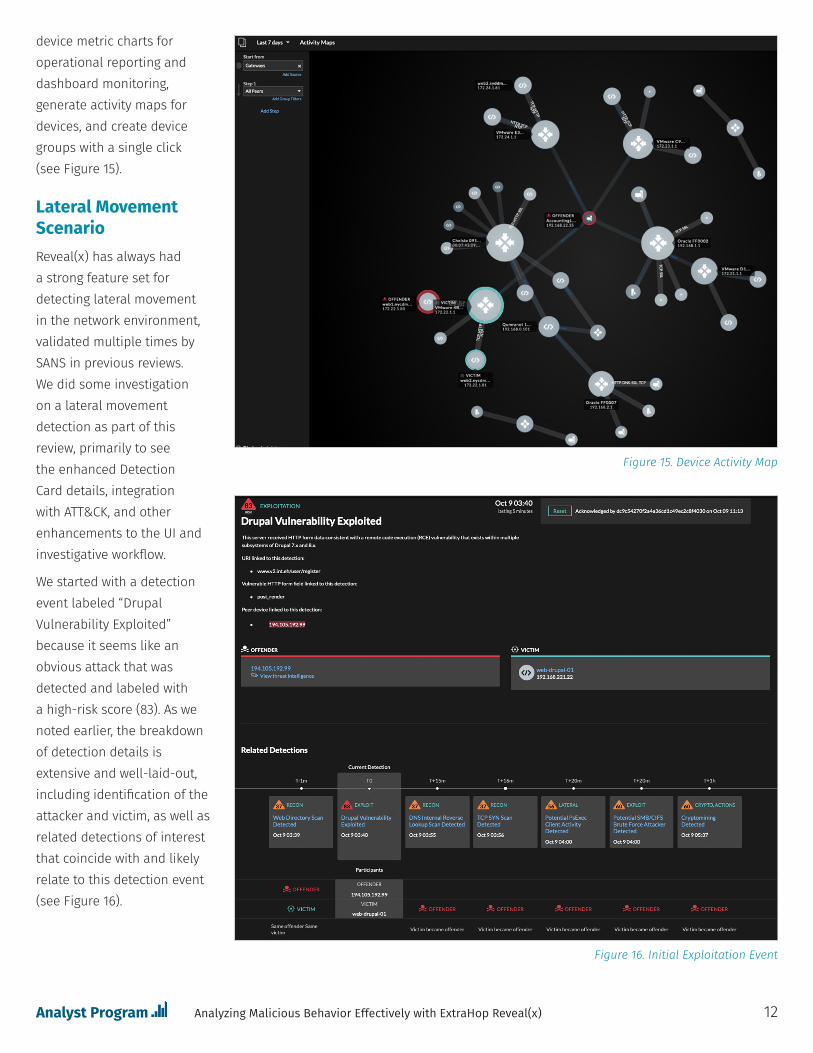
Device Inventory ScenarioWe explored the updated asset inventory interface to see how we could focus on threat hunting and seek out specific types of assets in the environment. ExtraHop has created a wide variety of platform and device categorizations based on observed behaviors and attributes, including IoT, VoIP phones, medical devices, VPN clients, domain controllers, and more. However, we decided to create a custom device group—Rogue Non-Domain Devices—to find any Windows systems in the network that weren’t communicating with domain controllers via Kerberos or LDAP in the past day. Setting up filter criteria was simple, as shown in Figure 13.
We easily created several of these types of searches. We also discovered a number of devices in the environment, with extensive details on communication patterns, protocols observed, device-specific details, and peer IP addresses seen communicating with these systems (see Figure 14).
Notably, Reveal(x) breaks out all activity by both server communication and client protocols and communications as well, simplifying additional investigation and traffic analysis. Filtering for devices and device groups can also be done dynamically with API queries, metadata tags assigned to systems, and many other attributes discovered. Dynamic analysis of devices can be initiated by Reveal(x) when a specific device type is found in the environment, which enables Reveal(x) to be a true continuous monitoring and assessment platform. Analysts can easily create
Analyzing Malicious Behavior Effectively with ExtraHop Reveal(x)
Figure 14. Rogue Asset Detection
Figure 13. Custom Asset Search
device metric charts for operational reporting and dashboard monitoring, generate activity maps for devices, and create device groups with a single click (see Figure 15).
Lateral Movement ScenarioReveal(x) has always had a strong feature set for detecting lateral movement in the network environment, validated multiple times by SANS in previous reviews. We did some investigation on a lateral movement detection as part of this review, primarily to see the enhanced Detection Card details, integration with ATT&CK, and other enhancements to the UI and investigative workflow.
We started with a detection event labeled “Drupal Vulnerability Exploited” because it seems like an obvious attack that was detected and labeled with a high-risk score (83). As we noted earlier, the breakdown of detection details is extensive and well-laid-out, including identification of the attacker and victim, as well as related detections of interest that coincide with and likely relate to this detection event (see Figure 16).
12Analyzing Malicious Behavior Effectively with ExtraHop Reveal(x)
Figure 16. Initial Exploitation Event
Figure 15. Device Activity Map
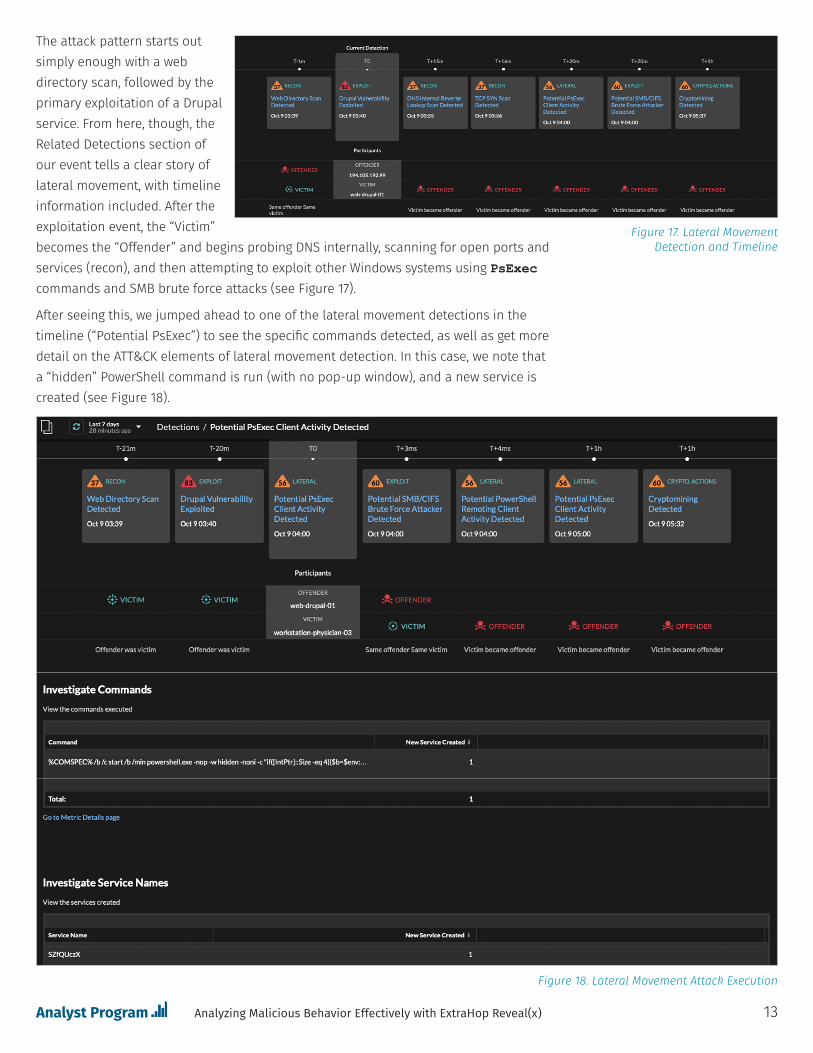
The attack pattern starts out simply enough with a web directory scan, followed by the primary exploitation of a Drupal service. From here, though, the Related Detections section of our event tells a clear story of lateral movement, with timeline information included. After the exploitation event, the “Victim” becomes the “Offender” and begins probing DNS internally, scanning for open ports and services (recon), and then attempting to exploit other Windows systems using PsExec commands and SMB brute force attacks (see Figure 17).
After seeing this, we jumped ahead to one of the lateral movement detections in the timeline (“Potential PsExec”) to see the specific commands detected, as well as get more detail on the ATT&CK elements of lateral movement detection. In this case, we note that a “hidden” PowerShell command is run (with no pop-up window), and a new service is created (see Figure 18).
13Analyzing Malicious Behavior Effectively with ExtraHop Reveal(x)
Figure 18. Lateral Movement Attack Execution
Figure 17. Lateral Movement Detection and Timeline
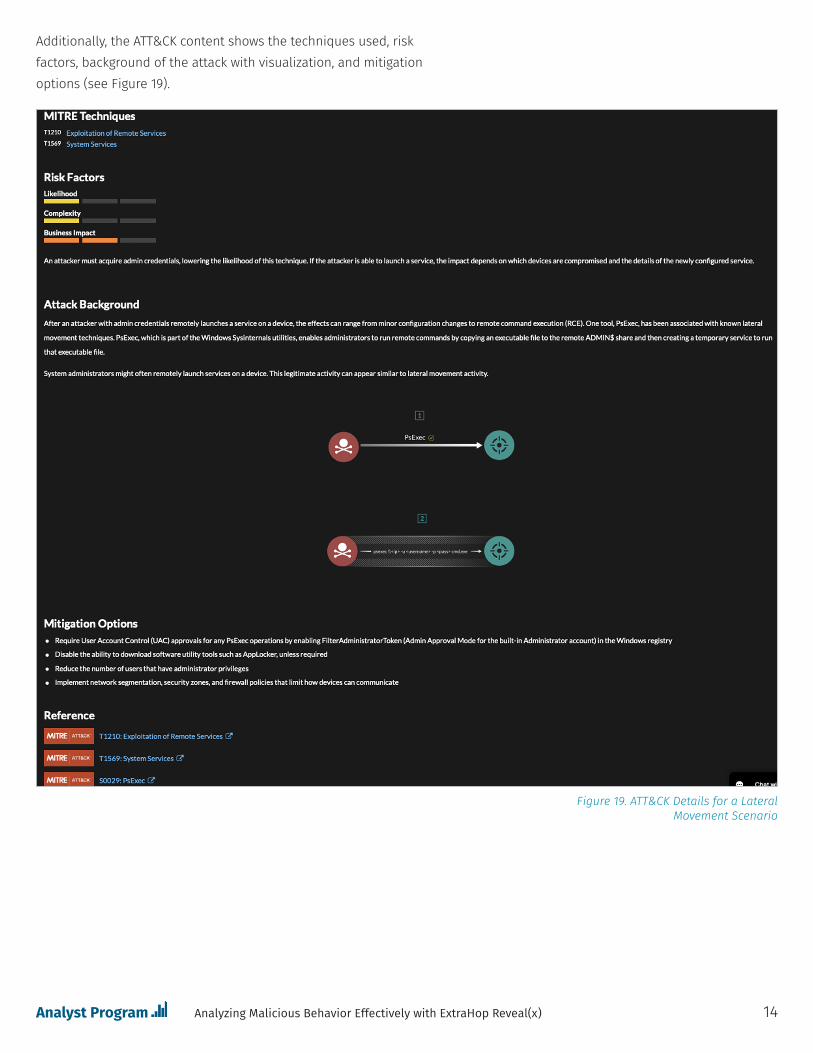
Additionally, the ATT&CK content shows the techniques used, risk factors, background of the attack with visualization, and mitigation options (see Figure 19).
14Analyzing Malicious Behavior Effectively with ExtraHop Reveal(x)
Figure 19. ATT&CK Details for a Lateral Movement Scenario
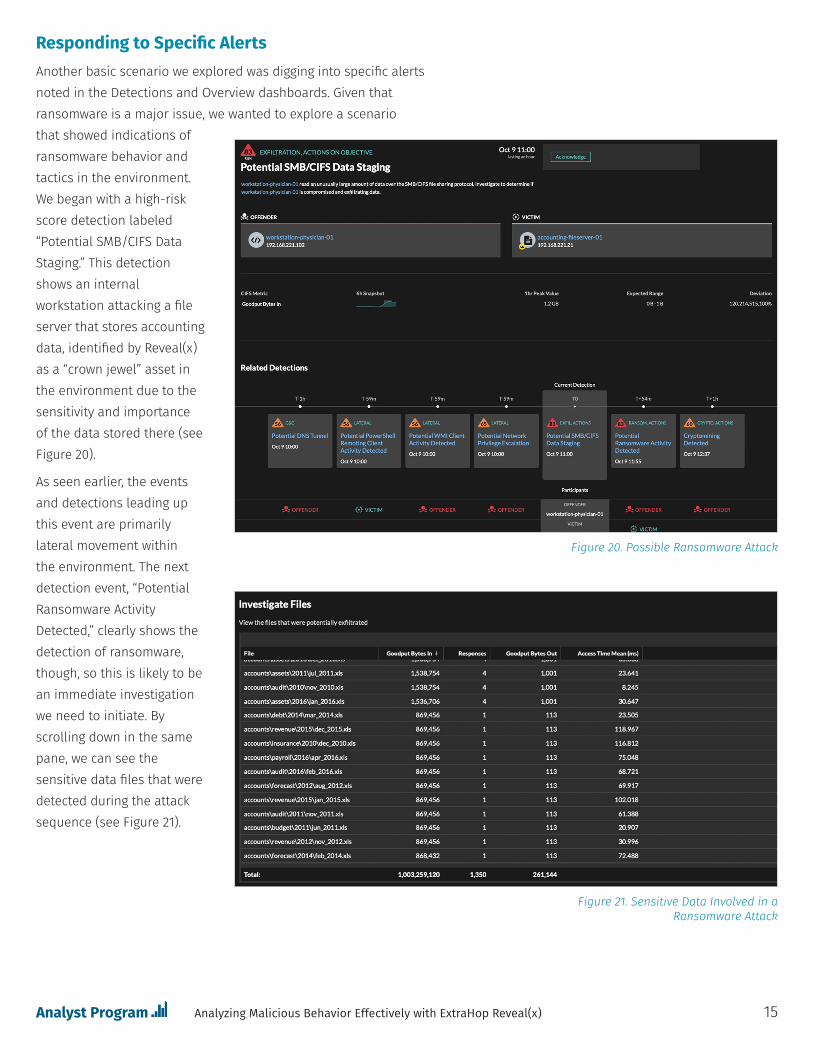
Responding to Specific AlertsAnother basic scenario we explored was digging into specific alerts noted in the Detections and Overview dashboards. Given that ransomware is a major issue, we wanted to explore a scenario that showed indications of ransomware behavior and tactics in the environment. We began with a high-risk score detection labeled “Potential SMB/CIFS Data Staging.” This detection shows an internal workstation attacking a file server that stores accounting data, identified by Reveal(x) as a “crown jewel” asset in the environment due to the sensitivity and importance of the data stored there (see Figure 20).
As seen earlier, the events and detections leading up this event are primarily lateral movement within the environment. The next detection event, “Potential Ransomware Activity Detected,” clearly shows the detection of ransomware, though, so this is likely to be an immediate investigation we need to initiate. By scrolling down in the same pane, we can see the sensitive data files that were detected during the attack sequence (see Figure 21).
15Analyzing Malicious Behavior Effectively with ExtraHop Reveal(x)
Figure 20. Possible Ransomware Attack
Figure 21. Sensitive Data Involved in a Ransomware Attack
Conclusion
We believe that the latest ExtraHop Reveal(x) features have significantly enhanced the product since our last review. The tool is fast and thorough, and provided an enormous range of options for searching and querying activity within the environment. As we stated before, the interface is highly intuitive and easy to learn (and even better than before, with enhanced Detection Cards, inline forensics, and additional visualizations such as cloud service traffic), improving on an already robust security analysis platform for Tier 1 analysts all the way to senior investigators. The addition of extensive mappings to the ATT&CK framework will likely enable security operations and investigations teams to better track and report on security capabilities and metrics over time, as well.
The challenges facing security operations analysts are well known today, and now our environments are spanning internal data centers and cloud environments, potentially making asset discovery and analysis an even greater challenging. Reveal(x) does a great job of detecting cloud traffic and assets along with creating an internal device inventory, and listing protocols and applications in use. As in past reviews, we didn’t cover Reveal(x) integration with existing security tools organizations may have, but ExtraHop has a very open integration ecosystem with partners in the endpoint detection and response (EDR), SIEM, next-generation firewall (NGFW), ticketing, and orchestration and automation categories, which can aid in automation and orchestration of detection and response. This can significantly enhance the continuity of the security operations practice and facilitate improved speed of detection to investigation.
It’s obvious that the team at ExtraHop is committed to innovation and product improvement, and we found Reveal(x) to be even more intuitive, detailed, and flexible than in the past. The product is well-suited for all experience levels of security operations analysts who need better visibility into network behavior and potential threats in their environment, with the added benefits of deep investigation and hunting tools.
16Analyzing Malicious Behavior Effectively with ExtraHop Reveal(x)

About the Author
Dave Shackleford, a SANS analyst, instructor, course author, GIAC technical director and member of the board of directors for the SANS Technology Institute, is the founder and principal consultant with Voodoo Security. He has consulted with hundreds of organizations in the areas of security, regulatory compliance, and network architecture and engineering. A VMware vExpert, Dave has extensive experience designing and configuring secure virtualized infrastructures. He previously worked as chief security officer for Configuresoft and CTO for the Center for Internet Security. Dave currently helps lead the Atlanta chapter of the Cloud Security Alliance.
Sponsor
SANS would like to thank this paper’s sponsor:
17Analyzing Malicious Behavior Effectively with ExtraHop Reveal(x)