analyzing racial disparities in the homelessness system
TRANSCRIPT

Analyzing Racial Disparities in the Homelessness System: What You Should Know
April 17, 2019
Moderators:
Chan L. Crawford, PhD, Policy and Program Analyst, National Alliance to End Homelessness, Washington, DC
Presenters:
Va Lecia Adams Kellum, PhD, President & CEO, St. Joseph Center, Venice, CA
Clifton J. Harris III, HMIS Director, VIA LINK, Inc., New Orleans, LA

The contents of this presentation do not represent the views of the US Department of Veterans Affairs or the United States Government.

Overview
This presentation will discuss:• Race and Homelessness within VA• Homelessness and Racial Disparities• Defining Explicit and Implicit Racial Bias• Promising Practices for Addressing Racial Disparities for
Services Providers• Using Data to Analyze Racial Disparities in the Homeless
System• Summary• Q&A
3

Learning Objectives
1. Identify implicit bias and its origins, including explicit bias
2. Demonstrate innovations in hiring practices and service provision that can improve program outcomes for groups most impacted by homelessness
3. Apply tools that can help communities analyze their data to identify any disparities in outreach, inflow, assessment, services, housing, or recidivism;
4. Describe emerging ways to address such disparities
4

Introduction
Dina Hooshyar, MD, MPHDirector, National Center on Homelessness among Veterans (NCHAV)

Introduction
• The Center’s Research Core recently initiated work to better understand racial disparities in homelessness and incarceration among Veterans
• Several data sources will be used including nationally representative data of Veterans and VA administrative data from medical records
• Plan to understand not only incarceration rates and homelessness, but examine disparities in service use and access to service
• We hope to look at many other relevant variable such as service era, compensation disability, mental health, substance use, and chronic medical conditions
• Center also supporting efforts of some local committees in planning in examining catchment areas
6

Unannounced Standardized Veteran Project (USV)
Eileen Devine, LCSWNational Program Director, HCHVVHA Homeless Program Office

8
Unannounced Standardized Veteran Project (USV)• In 2017 the Homeless Programs Office (HPO) initiated an unannounced
standardized Veteran (USV) project, commonly referred to as a “mystery shoppers program” at all CRRCs to identify and disseminate best practices to Veterans experiencing homelessness. A second round of visits took place in 2018.
Case 1: Male, Caucasian, OEF Veteran with PTSD
Case 2: Female, Caucasian, Desert Storm Veteran with High Blood Pressure
Case 3: Male, African American, Vietnam Veteran with Alcoholism

9
Systematic Unconscious Bias
The USV portraying an African American Vietnam Veteran with substance use issues experienced a statistically significant higher number of additional barriers to accessing care in comparison to the other USV actors.
Unable to access services without a DD-214
Case 1 11%
Case 2 8%
Case 3 57%

Veteran Homelessness and Race
Analyzing Racial Disparities in the Homelessness System: What You Should Know
Chan Crawford
Policy and Program Analyst

National Alliance to End Homelessness
• NAEH is a nonpartisan, nonprofit organization whose sole purpose is to end homelessness in the United States
• We use research and data to find solutions to homelessness
• We work with federal and local partners to create a solid base of policy and resources that support those solutions
• We help communities implement solutions
National Alliance to END HOMELESSESS ENDHOMELESSNESS.ORG

Race and Homelessness
• Most minority groups in the US represent a disproportionate share of the homeless population
• The most striking disproportionality can be found among African Americans
• African Americans make up 40% of homeless population, but only 13% of general population
Source: The 2018 Annual Homeless Assessment Report (AHAR) to Congress (HUD)
National Alliance to END HOMELESSNESS ENDHOMELESSNESS.ORG

Race and Homelessness (Cont.)
National Alliance to END HOMELESSNESS ENDHOMELESSNESS.ORG
Source: NAEH State of Homelessness Report 2019https://endhomelessness.org/homelessness-in-america/homelessness-statistics/state-of-homelessness-report/

Veterans, Race, and Homelessness
• We also see disproportionate numbers among Veterans experiencing homelessness• According to HUD’s 2018 Annual Homeless Assessment Report,
44% of all homeless Veterans are African American or Hispanic/Latin• African Americans make up one-third of Veterans experiencing
homelessness; 12% of Veterans overall• Hispanics account for 11% of Veterans experiencing
homelessness; 7% of Veterans overall
National Alliance to END HOMELESSNESS ENDHOMELESSNESS.ORG

Veterans, Race, and Homelessness Cont.
0
20
40
60
80
100
120
140
White Black
Race Data for VeteransGeneral Population & Homeless Population
Veteran Homeless
National Alliance to END HOMELESSNESS ENDHOMELESSNESS.ORGSource: The 2018 Annual Homeless Assessment Report (AHAR) to Congress (HUD)

What Can the Homelessness System Do?
• Disproportionality influenced by historical and structural racism; including feeder systems such as criminal justice• Homeless workers can and should contribute to these efforts to
address disproportionality
• Homeless systems have the responsibility to make sure they are not, themselves, having a disparate impact on people based on race or ethnicity
National Alliance to END HOMELESSNESS ENDHOMELESSNESS.ORG

THANK YOU
Contact Information:
Chan Crawford
1518 K Street, NW, 2nd Floor
Washington, DC 20005
(202) 942-8297
National Alliance to END HOMELESSNESS ENDHOMELESSNESS.ORG

Analyzing Racial Disparities in the Homelessness System: What You Should Know
April 17, 2019
Va Lecia Adams Kellum, Ph.D.President & CEO
St. Joseph Center

Racial Disparities within Homeless Populations

Racial Inequity Demographics Data
United StatesGeneral
Population Deep Poverty Homeless
White 73.8% 59.7% 48.6%
Black 12.4% 23.5% 42.6%
American Indian and Alaska Native 0.8% 1.6% 2.5%
Asian 5.2% 4.6% .8%
Native American and Other Pacific Islander .2% .2% 1.1%
Two or more races 3.0% 3.9% 4.6%
Hispanic/Latinx (of any race) 17.2% 24.3% 16.9%
Source: SPARC, 2018
RACIAL DISPARITIESRACIAL
BIASIMPACT ON SERVICES
PROMISING PRACTICES
AD HOC REPORT & RECOMMENDATIONS

2018 HOMELESS COUNT RESULTS
52,7654% Decrease
County of
Los Angeles
City of
Los Angeles
31,2856% Decrease
The LA CoC total number was 49,955, a 5% decrease from 2017. The LA CoC is Los Angeles County excluding Glendale, Pasadena, & Long Beach CoCs.
RACIAL DISPARITIESRACIAL
BIASIMPACT ON SERVICES
PROMISING PRACTICES
AD HOC REPORT & RECOMMENDATIONS
PEOPLE
EXPERIENCING
HOMELESSNESS
2018

2018 HOMELESS COUNT RESULTS
Veteran homelessness decreased19%
What’s Working:
✓ Established a Countywide Veterans
Benefit Advocacy Program
✓ Redesigned VA programs to target
chronically homeless Veterans
✓ Enhanced direct-service staff
collaboration
✓ Coordinated VA housing resources
through the Coordinated Entry System
LA’s Plan Moving Forward:
❑ Continuing to strengthen system
collaboration between VA and the
Coordinated Entry System
❑ Adding 800+ Veteran-specific
supportive housing units
❑ Allocating $20 million countywide to
house Veterans experiencing mental
health issues
❑ Creating countywide Veteran Peer
Support Network
Dedicated resources, continued hard work, local leadership
4,792
3,886
2017 2018
Veteran Homeless Persons Los Angeles County, 2017 & 2018
RACIAL DISPARITIESRACIAL
BIASIMPACT ON SERVICES
PROMISING PRACTICES
AD HOC REPORT & RECOMMENDATIONS

• 35% of LA County Homeless Population is African American
• Black people experiencing homelessness are young, more likely to be female, and more likely to be in families. They are also less likely to have disabilities.
• Black people experiencing homelessness are just as likely – and some cases more likely- to be enrolled in homeless services.
• Once receiving services, they are more likely to exit their program and become homeless again.
Racial Disparity in Los Angeles County
Source: California Policy Lab, 2018; LAHSA Homeless County, 2018
RACIAL DISPARITIESRACIAL
BIASIMPACT ON SERVICES
PROMISING PRACTICES
AD HOC REPORT & RECOMMENDATIONS

Defining Biases

Refers to the attitude and beliefs we have about a racial group on a
conscious level
discrimination, stereotyping, hate speech, violence, exclusionary practices,
lack of empathy, favoritism
Definition
Manifestations
RACIAL DISPARITIESRACIAL
BIASIMPACT ON SERVICES
PROMISING PRACTICES
AD HOC REPORT & RECOMMENDATIONS
Explicit Racial Bias

Refers to the attitude and beliefs we have about a racial group on a
unconscious level
discrimination, stereotyping, micro-aggressions, violence, exclusionary
practices, lack of empathy, favoritism
Definition
Manifestations
RACIAL DISPARITIESRACIAL
BIASIMPACT ON SERVICES
PROMISING PRACTICES
AD HOC REPORT & RECOMMENDATIONS
Implicit Racial Bias

Impact on Services

Implicit Bias in Service Delivery
Implicit bias can affect:• Which services are offered
• Where services are offered
• How services are offered
• Who is directly offering services
AND
• Who is managing direct service providers
RACIAL DISPARITIESRACIAL
BIASIMPACT ON SERVICES
PROMISING PRACTICES
AD HOC REPORT & RECOMMENDATIONS

Implicit Bias in Service Delivery
Service Providers wield power over who receives scarce resources – implicit racial bias in service provision
worsens racial disparities in homelessness.
Racial Bias + Power = Racism
RACIAL DISPARITIESRACIAL
BIASIMPACT ON SERVICES
PROMISING PRACTICES
AD HOC REPORT & RECOMMENDATIONS

Implicit bias and racial disparities aggravate one another
RACIAL DISPARITIESRACIAL
BIASIMPACT ON SERVICES
PROMISING PRACTICES
AD HOC REPORT & RECOMMENDATIONS

Implicit bias can affect:• Who gets hired• Who managers trust with
assignments• Who gets promoted
Does our outreach team reflect the diversity of those we serve?
Are hiring decisions affected by implicit bias?
St. Joseph Center 14
RACIAL DISPARITIESRACIAL
BIASIMPACT ON SERVICES
PROMISING PRACTICES
AD HOC REPORT & RECOMMENDATIONS
Source: SPARC, 2018

Promising Practices among Service Providers

Promising Practice: Intentional Recruitment
• Homelessness
• Mental illness
• Substance abuse
• Domestic violence
• Incarceration
Relationships with community partners enabled us to recruit candidates with lived experience:
RACIAL DISPARITIESRACIAL
BIASIMPACT ON SERVICES
PROMISING PRACTICES
AD HOC REPORT & RECOMMENDATIONS

Inclusive Job Descriptions
Education:
• Bachelor’s degree from an accredited college or university in social work, human services or a related field; a combination of education and experience may be substituted.
Promising Practice: Modified Employee Eligibility Requirements
RACIAL DISPARITIESRACIAL
BIASIMPACT ON SERVICES
PROMISING PRACTICES
AD HOC REPORT & RECOMMENDATIONS

Lowered educational barriers for the following positions:
• Peer Advocate
• Peer Specialist
• Representative Payee
• Housing Locator
• Housing Navigator
• Certain Case Manager positions
RACIAL DISPARITIESRACIAL
BIASIMPACT ON SERVICES
PROMISING PRACTICES
AD HOC REPORT & RECOMMENDATIONS
Promising Practice: Modified Employee Eligibility Requirements

60%47%
20%29%
10%6%
10%18%
Senior Managers 2013 Senior Managers 2018
Demographics of Senior Managers
White Black Latino Asian
RACIAL DISPARITIESRACIAL
BIASIMPACT ON SERVICES
PROMISING PRACTICES
AD HOC REPORT & RECOMMENDATIONS
St. Joseph Center 15
Promising Results: St. Joseph Center Staff Demographics

41%22%
20%39%
31% 35%
8% 3%1%
Non-management Staff 2013 Non-management Staff 2018
Demographics of Non-management Staff
White Black Latino Asian Others
38%
32%
4%
25%
1%
Staff Demographics May 2018
Black Latino Asian White Others
St. Joseph Center 15
RACIAL DISPARITIESRACIAL
BIASIMPACT ON SERVICES
PROMISING PRACTICES
AD HOC REPORT & RECOMMENDATIONS
St. Joseph Center Staff Demographics

Continuing challenges in addressing racial disparities:
• Raising awareness of implicit bias among all staff
• Encouraging cultural humility
• Specialized training for those re-entering the workplace with experiences of homelessness and/or incarceration
• Training managers in trauma-informed methods
• Furthering agency-wide standards of trauma-informed care
THE GOAL IS PROGRESS
RACIAL DISPARITIESRACIAL
BIASIMPACT ON SERVICES
PROMISING PRACTICES
AD HOC REPORT &RECOMMENDATIONS
On-Going Challenges

How Los Angeles is Addressing Racial Disparities Among People who are Homeless

The Los Angeles Homeless Services Authority (LAHSA) Commissionapproved Committee membership in December 2017; Committeelaunched in April 2018. The Committee was formed in response to:
1) The persistent overrepresentation of Black peopleexperiencing homelessness, and
2) The impact of the Ad Hoc Committee on Women &Homelessness
Source: Ad Hoc Committee on Black People Experiencing Homelessness, 2019
RACIAL DISPARITIESRACIAL
BIASIMPACT ON SERVICES
PROMISING PRACTICES
AD HOC REPORT &RECOMMENDATIONS
Ad Hoc Committee on Black People Experiencing Homelessness

1) Examine the factors contributing to the overrepresentation of Blackpeople among the population experiencing homelessness
2) Identify opportunities to increase racial equity within the homeless service delivery system
3) Develop recommendations to more effectively meet the needs ofBlack people experiencing or at risk of homelessness
RACIAL DISPARITIESRACIAL
BIASIMPACT ON SERVICES
PROMISING PRACTICES
AD HOC REPORT &RECOMMENDATIONS
Source: Ad Hoc Committee on Black People Experiencing Homelessness, 2019
Committee Purpose

67 Recommendations aim to address the burdens theCommittee identified, in areas of:
✓ Cross-System Coordination
✓ Data & Research
✓ Funding
✓ Hiring & Training
✓ Programs & Services
✓ Policy & Advocacy
RACIAL DISPARITIESRACIAL
BIASIMPACT ON SERVICES
PROMISING PRACTICES
AD HOC REPORT &RECOMMENDATIONS
Source: Ad Hoc Committee on Black People Experiencing Homelessness, 2019
Committee Recommendations


Is Your Homelessness System Creating Disparate Outcomes?
Clifton J. Harris III
HMIS Director, VIA LINK

Could we determine racial disparities in our system?
Does HMIS data reflect the current housing and income factors in our community?
If the homeless data was significantly different than the other community data, would we be able to determine the cause of that?
If the data is comparable, is that sufficient evidence that there is no disparity?
46

Does HMIS data reflect the current housing and income factors in our Community?
HMIS DATA

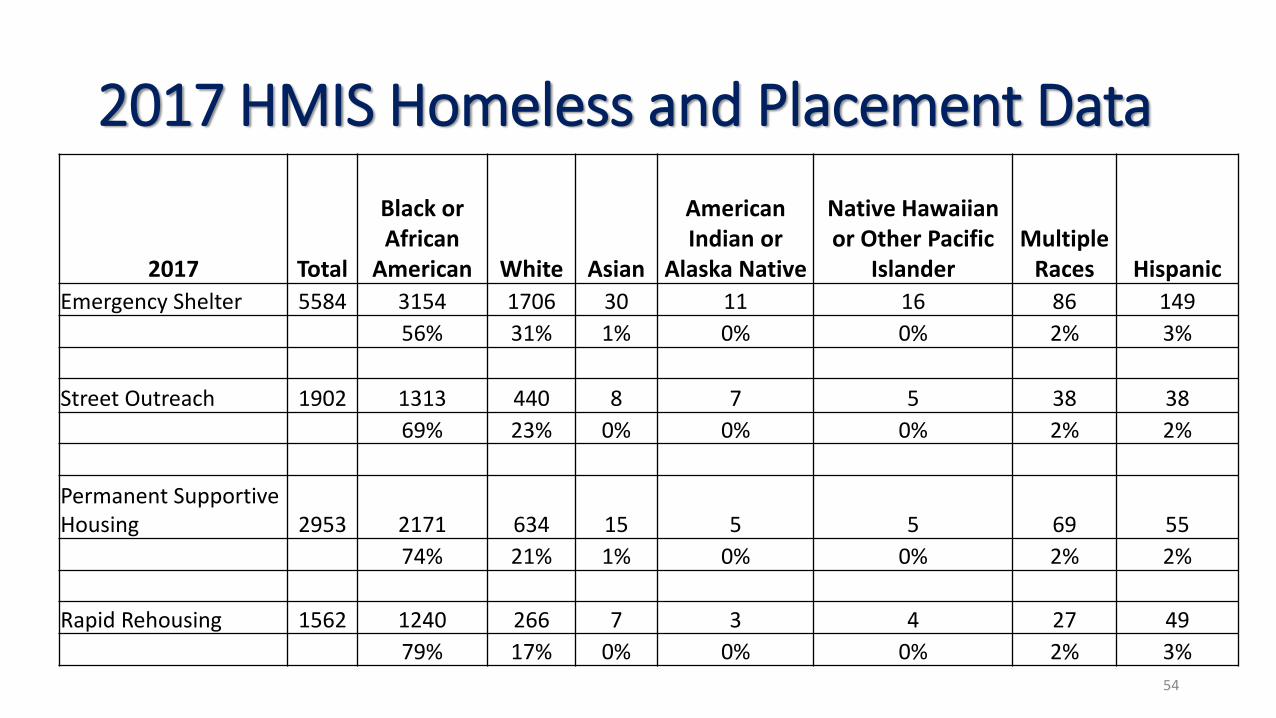
2017 HMIS Homeless and Placement Data
48
2017 Total Black or African
American White AsianAmerican Indian or Alaska Native
Native Hawaiian or Other Pacific
IslanderMultiple
Races Hispanic
Emergency Shelter 5584 3154 1706 30 11 16 86 149
56% 31% 1% 0% 0% 2% 3%
Street Outreach 1902 1313 440 8 7 5 38 38
69% 23% 0% 0% 0% 2% 2%
Permanent Supportive Housing 2953 2171 634 15 5 5 69 55
74% 21% 1% 0% 0% 2% 2%
Rapid Rehousing 1562 1240 266 7 3 4 27 49
79% 17% 0% 0% 0% 2% 3%

Active Chronic Clients on By Name List
49
American Indian or Alaska Native 1%
Asian 1%
Black or African American 71%
Native Hawaiian or Other Pacific Islander 0%
White 27%

Point in Time
50
Sheltered Unsheltered Total
Emergency Transitional Safe Haven
White 101 78 4 245 428 36%Black or African-
American283 107 12 333 735
62%
Asian 2 1 0 3 6 1%American Indian or
Alaska Native4 1 1 7 13
1%
Native Hawaiian or Other Pacific Islander
0 0 0 5 5
0%
Multiple Races 0 0 0 1 1 0%

New Orleans Data
51
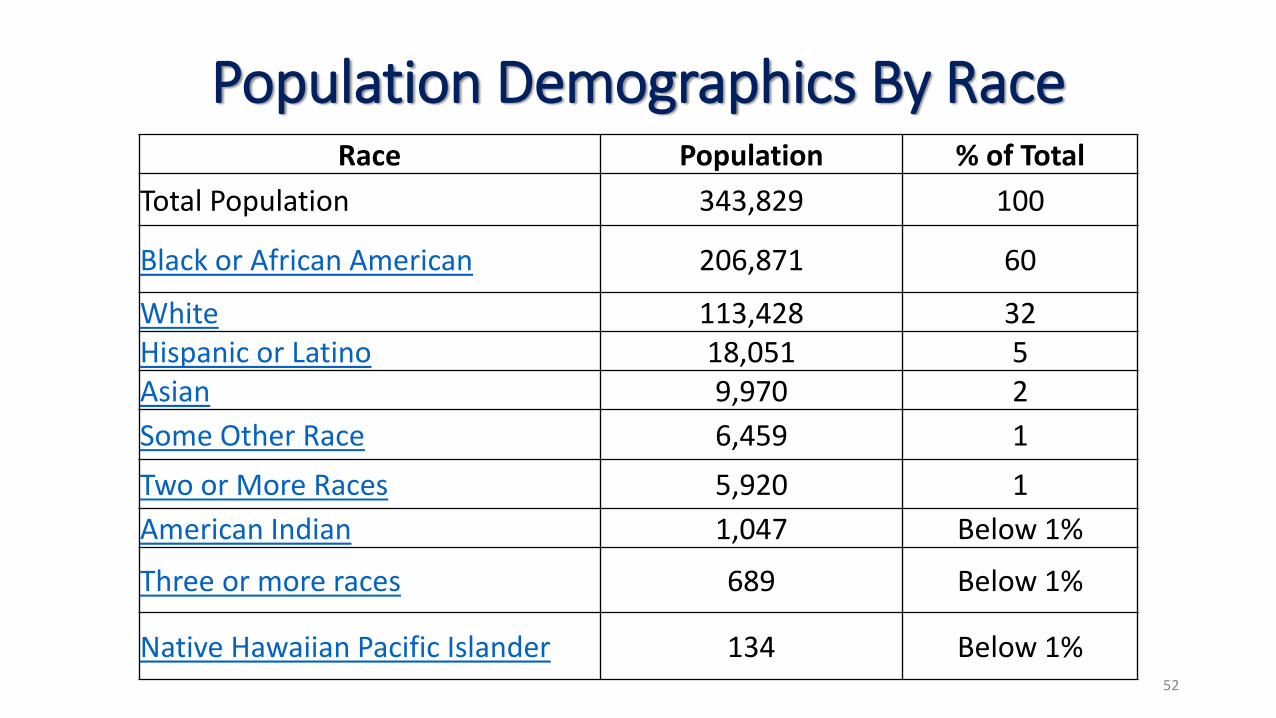
Population Demographics By Race
52
Race Population % of Total
Total Population 343,829 100
Black or African American 206,871 60
White 113,428 32Hispanic or Latino 18,051 5Asian 9,970 2
Some Other Race 6,459 1
Two or More Races 5,920 1
American Indian 1,047 Below 1%
Three or more races 689 Below 1%
Native Hawaiian Pacific Islander 134 Below 1%

HOW IS NEW ORLEANS DOING?• Nearly half of all black families (47 percent) earn less than $25,237 a year. The
same was true for only 14 percent of white households.
• Compared with white households, black households in New Orleans earned 63 percent less on the median. Hispanic households earned 47 percent less.
• Nearly half of all African-American children live in poverty. That is true for only 9 percent of white children.
• 41 percent of black households in New Orleans own their homes, compared with 54 percent of white households.
• More than half of all renters in New Orleans spent 35 percent of their income or more on housing in 2016. Nearly 60 percent of black residents in New Orleans rent.
Source: Plyer, Allison, and Lamar Gardere. The New Orleans Prosperity Index: Tricentennial Edition, Data Center, 11 Apr. 2018, WWW.datacenterresearch.org/reports_analysis/prosperity-index/.
53
2017 HMIS Homeless and Placement Data
54
2017 Total
Black or African
American White Asian
American Indian or
Alaska Native
Native Hawaiian or Other Pacific
IslanderMultiple
Races Hispanic
Emergency Shelter 5584 3154 1706 30 11 16 86 149
56% 31% 1% 0% 0% 2% 3%
Street Outreach 1902 1313 440 8 7 5 38 38
69% 23% 0% 0% 0% 2% 2%
Permanent Supportive Housing 2953 2171 634 15 5 5 69 55
74% 21% 1% 0% 0% 2% 2%
Rapid Rehousing 1562 1240 266 7 3 4 27 49
79% 17% 0% 0% 0% 2% 3%

Racial and Ethnicity Disparity Task Force Goals and Action Plan
• Expand outreach efforts in geographic areas with higher concentrations of underrepresented groups in to underserved communities.
• To develop educational material on creating greater racial and ethnic diversity for homelessness in the CoC.
• To establish opportunities for regular communication and understanding of underserved populations in the Greater New Orleans area.
• Conducting additional research to understand the scope and needs of different races or ethnicities experiencing homelessness.
55

Racial and Ethnicity Disparity Task ForceGoals and Action Plan
• Conducting additional research to understand the scope and needs of different races or ethnicities experiencing homelessness.
• Develop performance standards and evaluations tools for case managers.
• Examine emergency shelters and how race disparities play in access.
• Implement professional development opportunities to identify and invest in emerging leaders of different races and ethnicities in the homeless sector.
• Review coordinated entry processes to understand their impact on people of different races and ethnicities experiencing homelessness.
56

Potential CoC Strategies
1) The CoC’s board and decision making bodies are representative of the population served in the CoC.
2) The CoC has identified steps it will take to help the CoC board and decision making bodies better reflect the
population served in the CoC.
3) The CoC is expanding outreach in geographic areas with higher concentrations of underrepresented groups.
4) The CoC has communication, such as flyers, websites, or other materials, inclusive of underrepresented groups
5) The CoC is training staff working in the homeless services sector to better understand racism and the
intersection of racism and homelessness
6) The CoC is establishing professional development opportunities to identify and invest in emerging leaders of
different races and ethnicities in the homelessness sector.
7) The CoC has staff, committees or other resources charged with analyzing and addressing racial disparities
related to homelessness.

Potential CoC Strategies (Cont.)
8) The CoC is educating organizations, stakeholders, boards of directors for local and national non-profit
organizations working on homelessness on the topic of creating greater racial and ethnic diversity.
9) The CoC reviewed coordinated entry processes to understand their impact on people of different races and
ethnicities experiencing homelessness.
10) The CoC is collecting data to better understand the pattern of program use for people of different races and
ethnicities in its homeless services system.
11) The CoC is conducting additional research to understand the scope and needs of different races or
ethnicities experiencing homelessness.

THANK YOU
Contact Information:
Clifton J. Harris III
P.O. Box 19127
New Orleans, LA (504) 895-5550

Summary
This presentation discussed:• Race and Homelessness within VA• Homelessness and Racial Disparities• Defining Explicit and Implicit Racial Bias• Promising Practices for Addressing Racial Disparities for
Services Providers• Using Data to Analyze Racial Disparities in the Homeless
System
60

61