analyzing the effect of lockdown on weather parameters
TRANSCRIPT
_____________________________________________________________________________________________________ *Corresponding author: E-mail: [email protected];
International Journal of Environment and Climate Change 10(9): 133-153, 2020; Article no.IJECC.60205 ISSN: 2581-8627 (Past name: British Journal of Environment & Climate Change, Past ISSN: 2231–4784)
Analyzing the Effect of Lockdown on Weather Parameters Amid COVID-19 Pandemic of Mid Hill
Region of Rajouri District of Jammu & Kashmir, Union Territory, India
Rohit Sharma1, Vishaw Vikas2*, Mahender Singh2, Manish Kr. Sharma3,
Narinder Panotra4, Charu Sharma2 and Deepak Kumar1
1AMFU, RARS, Rajouri, SKUAST, Jammu, India.
2Agrometeorology Section, Division of Agronomy, SKUAST, Jammu, India. 3Division of Statistics and Computer Sciences, SKUAST, Jammu, India.
4Organic Farming Research Centre, SKUAST, Jammu, India.
Authors’ contributions
This work was carried out in collaboration among all authors. Author RS managed and edited the analysis. Author VV designed the study, performed the statistical analysis, wrote the protocol and
wrote the first draft of the manuscript. Authors MS and MKS made the necessary corrections in manuscript. Authors NP, CS and DK managed the literature searches. All authors read and approved
the final manuscript.
Article Information
DOI: 10.9734/IJECC/2020/v10i930236 Editor(s):
(1) Dr. Wen-Cheng Liu, National United University, Taiwan. (2) Dr. Anthony R. Lupo, University of Missouri, United States of America.
Reviewers: (1) Abel Adebayo, Modibbo Adama University of Technology, Nigeria.
(2) Never Mujere, University of Zimbabwe (UZ), Zimbabwe. (3) Tarek M. El-Geziry, National Institute of Oceanography and Fisheries (NIOF), Egypt.
Complete Peer review History: http://www.sdiarticle4.com/review-history/60205
Received 30 July 2020 Accepted 18 August 2020 Published 20 August 2020
ABSTRACT
A study was conducted in mid hill region of Rajouri district, J&K, India to analyze the impact lockdown amid covid-19 pandemic on weather parameters. Day and night temperature readings were recorded fortnightly from 1st March to 30th June 2020 from maximum and minimum thermometer, rainfall values from ordinary rain gauge, and soil temperature at different depth from soil thermometers and values were compared with data from 2017-2019 and normal. After
Original Research Article
Sharma et al.; IJECC, 10(9): 133-153, 2020; Article no.IJECC.60205
134
analyzing the data statistically using “Descriptive statistics” in MS-Excel 2010, it was observed that within the period of lockdown, the change in day temperature was -6.66% from normal mean value, however night temperature was least affected as it changes 10.33% and rainfall pattern was 19.27% more from normal mean value. The average change in soil temperature in morning at 5 cm, 10 cm and 20 cm depth in lockdown was -4.65%, 3.74% and 2.65% as compared to year 2019 (1
st March to 30
th June) mean value and the change in soil temperature in evening at same depths
was -5.14%, -11.30% and 0.3% from year 2019 (1st March to 30
th June) depicting a slow change in
values. With the significant sustainable pattern observed in day and soil temperature parameters and rainfall it can be concluded that lockdown might be an effective tool in reducing speed of climate change in future.
Keywords: Day and night temperature; rainfall; soil temperature; lockdown; COVID-19.
1. INTRODUCTION
Despite continuous efforts to curb the emission worldwide, humans have still failed to reduce the greenhouse gases number even to near normal. Industrialization and Urbanization has synergized the greenhouse effect in atmosphere resulting in capturing the heat and then releasing it slowly; significantly increasing the global temperature. This sudden increase in temperature due to anthropogenic activities has a dynamic impact on the environmental health; affecting weather parameters and agricultural productivity [1, 2, 3]. It is already predicted that by 2030, due to rising temperature; India is expected to have 6 to 10 percent decrease in yield and can face changing weather pattern causing 1.5 percent loss towards GDP (Gross Domestic Product) [4]. In another aspect of study related to demand and supply, the population density in India over last two decades has increased with a growth rate of 37.60%, thereby having a direct impact on demand supply ratio, e.g. it has been noticed that sales of vehicle since 2008 has been increased with at least 15% per annum and in relation to this, the transport demand is expected to rise by 200% between 2015-2030 [5,6] significantly increasing emissions worldwide. Therefore, the absolute consequence of rising emissions, growing population and increasing supply demand ratio will be on the healthy ecosystem survival, long term productivity and sustainability.
COVID-19 disease was first identified in Wuhan, China in December 2019 and is highly contagious in nature. The disease has spread to almost every part of the world and has been declared a global pandemic in March 2020 by World Health Organization [7]. The ongoing pandemic of COVID-19 has forced several countries of the world to observe complete lockdown forcing people to stay in their homes. India also faced the phase of total
lockdown for 21 days (in 1st phase) and
subsequent lockdown and unlock down phases to avoid the spread of coronavirus to the maximum possible extent. By this reaction, almost every industrial sector and public transportation movement was prohibited and this ultimately had a dramatic impact on weather and pollution parameters of Shivaliks, PirPanjal and mid hill region of J&K. Therefore, lockdown can be assumed to be an effective alternative measure control the pace of climate change and the present work is intended to explore the degree of change in weather parameters from lockdown to current situation with respect to weather parameters from March to June month of Year 2017, 2018, 2019, 2020 and normal data of Rajouri district.
The impact of lockdown has been observed as very much effective in reducing the emissions and improvising the quality of air and soil. Nationwide lockdown amid COVID-19 pandemic has not only reduced the intensity of spread of this viral disease but has emerged as a new scientific tool to curb the pace of changing climate and weather parameters. The present study has provided an opportunity to study the change in weather context and has enforced to work more in this direction to evaluate the efficacy of lockdown in managing the weather parameter towards normal with high focus on sustainability. The objectives of the study:
(i) To compare the weather parameters change in Rajouri during the lockdown periods on forth night basis with normal weather data and
(ii) To quantify the magnitude of variation in temperature and moisture of mid hills of Rajouri due to the implementation of lockdown regulation during Lockdown period
Sharma et al.; IJECC, 10(9): 133-153, 2020; Article no.IJECC.60205
135
Focusing on the Rajouri district, the study is expected to be a valuable addition to the scientific community and policy makers not only to assess the impacts of lockdown on weather parameters, but also its efficiency as a tool for upgrading the changing climatic pattern within the region with public involvement in upcoming years.
2. MATERIALS AND METHODS Rajouri district occupies an area of about 2630 Sq. Km with peculiar physical features and lies in between 33.3716° N latitude and 74.3152° E longitude at an elevation of 915 meters above the mean sea level. The District is situated in the west of Jammu Province of Jammu Kashmir Union Territory, India and is surrounded by the Poonch, Reasi and Jammu Districts. In order to analyze the change in the entire experimental area, weather parameters were statistically analyzed fortnightly i.e. 1
st March up to 30
th June
for year 2017-2020 and Normal but graphically compared between lockdown and Normal. Day, Night Temperature and Rainfall were the parameters observed, analyzed during lockdown and data was then compared with normal data compiled from weather data of 35 years. Calculation of deviation percentage and graphical comparison was done between lockdown and normal data. However, the soil temperature at different depths (5, 10, 20 cm) in Morning and Evening was statistically compared with year 2017, 2018 and 2019 data but the calculation of deviation percentage and graphical comparison was done between 2019 and lockdown data. Year 2020 data is considered as lockdown data. Day and Night temperature readings were recorded from Maximum and Minimum thermometer, Rainfall values from ordinary rain gauge and Soil Temperature at different depth from Soil Thermometers. All the instruments have been installed at Agrometeorological Field Unit (AMFU), Regional Agriculture Research Station (RARS) Rajouri, J&K. In order to have a representation of entire population, Descriptive statistics method was opted to find the Highest, Lowest, Mean, Standard Error, Standard Deviation, Coefficient of Variation, Kurtosis and Skewness values and was run in MS-Excel 2010 along with Pearson Correlation in SPSS 16.0 to find out the significant values and impact of one parameter over another.
3. RESULTS AND DISCUSSION
3.1 Effect on Temperature
3.1.1 Day and night temperature As the lockdown began, the day temperature started decreasing and sustainable pattern was observed (Fig. 1) from 1
st fortnight of March up to
2nd fortnight of June as compared to 2017-2020 and normal (Table 1). During 1
st fortnight of
March 2017-2020 and normal, lowest values observed were 12.0, 18.0, 13.6, 11.5 and 21.0; highest values observed were 24.0, 27.4, 22.6, 23.4 and 24.0. So, in 2020, the significant impact of lockdown was observed in 1
st fortnight of
March as day temperature was -15.78% than normal mean value. The standard deviation calculated was 3.84 in lockdown and 0.87 in normal. During 2nd fortnight of March 2017-2020 and normal, lowest values observed were 19.0, 19.6, 16.6, 16.4 and 23.4 lowest and highest values noted were 32.4, 33.0, 29.2, 24.8 and 27.4 hereby significantly expressing -13.16% change from normal. The standard deviation calculated was 2.04 in lockdown and 1.28 in normal. Again, in 1st fortnight of April 2017-2020 and normal, the lowest and highest values noted were 15.4, 23.4, 28.0, 23.6 and 25.7 whereas highest values observed were 34.0, 32.0, 31.6, 29.6 and 29.4 significantly depicting -1.48% variation from normal mean temperature value. The standard deviation calculated was 1.67 in lockdown and 1.16 in normal. Following data collection in 2
ndfortnight of April 2017-2020 and
normal, lowest values were 20.0, 22.0, 16.2, 23.0 and 27.7 and highest values were 35.0, 36.2, 33.8 30.8 and 31.1 illustrating -8.88% significant change from normal mean value. The standard deviation calculated was 2.58 in lockdown and 1.10 in normal. During 1
st fortnight of May 2017-
2020 and normal, lowest values observed were 24.8, 20.2, 26.2, 30.7 and highest values observed were 36.4, 34.8, 34.6, 32.6 and 33.0 representing -4.98% deviation from normal mean value. The standard deviation calculated was 2.60 in lockdown and 0.66 in normal. During 2nd fortnight of May 2017-2020 and normal, lowest values observed were 27.0, 32.4, 26.0, 26.0 and 32.9 highest values observed were 37.4, 38.0, 37.6, 36.5 and 34.7 representing -1.81% deviation from normal mean value. The standard deviation calculated was 2.68 in lockdown and 0.49 in normal. During 1st fortnight of June 2017-2020 and normal, lowest values observed were 29.8, 32.0, 21.0, 24.8 and 34.4 highest values observed were 40.4, 39.2, 38.2, 34.6 and 35.4

Sharma et al.; IJECC, 10(9): 133-153, 2020; Article no.IJECC.60205
136
illustrating -14.09% deviation from normal mean value. The standard deviation calculated was 2.94 in lockdown and 0.36 in normal. During 2
nd
fortnight of June 2017-2020 and normal, lowest values observed were 22.4, 24.0, 29.8, 30.6 and
31.3 highest values observed were 35.8, 36.8, 37.6, 37.0 and 34.6 representing 1.17% deviation from normal mean value. The standard deviation calculated was 1.85 in lockdown and 0.92 in normal.
Table 1. Descriptive coefficients of day temperature (°C) from March –June for the year 2017-
2020 and normal
Timeline Year Lowest Highest Mean S.E S.D CV (%) Kurtosis Skewness March (1st Fortnight)
2017 12.00 24.00 18.19 1.12 4.34 0.24 -1.47 -0.47 2018 18.00 27.40 23.65 0.76 2.95 0.12 -0.35 -0.61 2019 13.60 22.60 17.75 0.83 3.20 0.18 -1.61 0.18 2020 11.50 23.40 19.04 0.99 3.84 0.20 -0.33 -0.94 Normal 21.02 24.01 22.09 0.23 0.87 0.04 -0.02 0.59
March (2nd Fortnight)
2017 19.00 32.40 26.88 0.94 3.76 0.14 -0.23 -0.49 2018 19.60 33.00 27.40 0.90 3.61 0.13 -0.26 -0.33 2019 16.60 29.20 24.10 0.87 3.48 0.14 0.31 -0.42 2020 16.40 24.80 22.41 0.51 2.04 0.09 4.40 -1.76 Normal 23.38 27.37 25.35 0.32 1.28 0.05 -1.15 0.32
April (1st Fortnight)
2017 15.40 34.00 26.95 1.44 5.58 0.21 -0.58 -0.54 2018 23.40 32.00 28.40 0.61 2.37 0.08 0.05 -0.43 2019 28.00 31.60 29.92 0.31 1.20 0.04 -1.42 -0.02 2020 23.60 29.60 26.93 0.43 1.67 0.06 -0.18 0.14 Normal 25.66 29.38 27.31 0.30 1.16 0.04 -0.84 0.59
April (2nd Fortnight)
2017 20.00 35.00 30.47 1.13 4.38 0.14 0.66 -0.90 2018 22.00 36.20 30.21 1.14 4.42 0.15 -1.07 -0.35 2019 16.20 33.80 28.27 1.28 4.97 0.18 0.81 -1.02 2020 23.00 30.80 27.01 0.66 2.58 0.10 -1.27 -0.31 Normal 27.72 31.06 29.48 0.28 1.10 0.04 -1.39 -0.07
May (1st fortnight)
2017 24.80 36.40 32.50 0.83 3.22 0.10 0.99 -1.21 2018 20.20 34.80 29.65 0.91 3.51 0.12 2.92 -1.17 2019 26.20 34.60 31.13 0.64 2.50 0.08 -0.34 -0.65 2020 24.40 32.60 30.13 0.67 2.60 0.09 0.06 -1.09 Normal 30.72 32.98 31.69 0.17 0.66 0.02 -0.38 0.29
May (2nd fortnight)
2017 27.00 37.40 32.38 0.81 3.22 0.10 -1.01 -0.18 2018 32.40 38.00 35.48 0.46 1.85 0.05 -1.14 -0.32 2019 26.00 37.60 32.01 0.88 3.53 0.11 -0.79 -0.16 2020 26.00 36.50 33.10 0.67 2.68 0.08 2.29 -1.43 Normal 32.93 34.67 33.78 0.12 0.49 0.01 -0.52 0.05
June (1st fortnight)
2017 29.80 40.40 33.51 0.96 3.73 0.11 -0.92 0.80 2018 32.00 39.20 35.65 0.55 2.14 0.06 -0.35 -0.06 2019 21.00 38.20 34.41 1.09 4.21 0.12 7.83 -2.50 2020 24.80 34.60 30.59 0.76 2.94 0.10 -0.12 -0.83 Normal 34.38 35.42 34.81 0.09 0.36 0.01 -0.99 0.67
June (2nd fortnight)
2017 22.40 35.80 30.93 1.05 4.06 0.13 -0.51 -0.68 2018 24.00 36.80 32.29 0.87 3.37 0.10 1.28 -1.00 2019 29.80 37.60 34.18 0.59 2.30 0.07 -0.74 -0.31 2020 30.60 37.00 33.94 0.48 1.85 0.05 -0.71 -0.05 Normal 31.32 34.56 33.53 0.24 0.92 0.03 1.90 -1.53
Cumulative 2017 12.00 40.40 28.98 0.56 6.14 0.21 0.43 -0.87 2018 18.00 39.20 30.36 0.44 4.89 0.16 -0.60 -0.35 2019 13.60 38.20 28.96 0.56 6.20 0.21 -0.12 -0.80 2020 11.50 37.00 27.89 0.50 5.47 0.20 -0.01 -0.59 Normal 21.02 35.42 29.75 0.39 4.35 0.15 -1.03 -0.50
Sharma et al.; IJECC, 10(9): 133-153, 2020; Article no.IJECC.60205
137
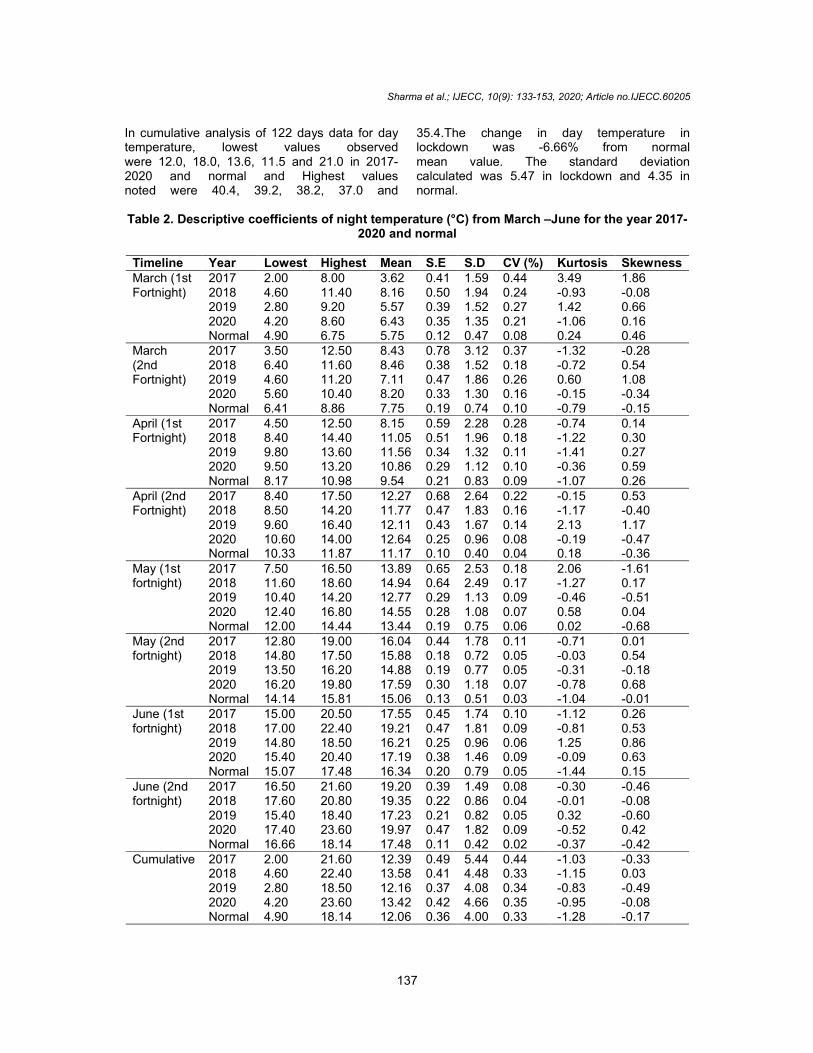
In cumulative analysis of 122 days data for day temperature, lowest values observed were 12.0, 18.0, 13.6, 11.5 and 21.0 in 2017-2020 and normal and Highest values noted were 40.4, 39.2, 38.2, 37.0 and
35.4.The change in day temperature in lockdown was -6.66% from normal mean value. The standard deviation calculated was 5.47 in lockdown and 4.35 in normal.
Table 2. Descriptive coefficients of night temperature (°C) from March –June for the year 2017-
2020 and normal
Timeline Year Lowest Highest Mean S.E S.D CV (%) Kurtosis Skewness March (1st Fortnight)
2017 2.00 8.00 3.62 0.41 1.59 0.44 3.49 1.86 2018 4.60 11.40 8.16 0.50 1.94 0.24 -0.93 -0.08 2019 2.80 9.20 5.57 0.39 1.52 0.27 1.42 0.66 2020 4.20 8.60 6.43 0.35 1.35 0.21 -1.06 0.16 Normal 4.90 6.75 5.75 0.12 0.47 0.08 0.24 0.46
March (2nd Fortnight)
2017 3.50 12.50 8.43 0.78 3.12 0.37 -1.32 -0.28 2018 6.40 11.60 8.46 0.38 1.52 0.18 -0.72 0.54 2019 4.60 11.20 7.11 0.47 1.86 0.26 0.60 1.08 2020 5.60 10.40 8.20 0.33 1.30 0.16 -0.15 -0.34 Normal 6.41 8.86 7.75 0.19 0.74 0.10 -0.79 -0.15
April (1st Fortnight)
2017 4.50 12.50 8.15 0.59 2.28 0.28 -0.74 0.14 2018 8.40 14.40 11.05 0.51 1.96 0.18 -1.22 0.30 2019 9.80 13.60 11.56 0.34 1.32 0.11 -1.41 0.27 2020 9.50 13.20 10.86 0.29 1.12 0.10 -0.36 0.59 Normal 8.17 10.98 9.54 0.21 0.83 0.09 -1.07 0.26
April (2nd Fortnight)
2017 8.40 17.50 12.27 0.68 2.64 0.22 -0.15 0.53 2018 8.50 14.20 11.77 0.47 1.83 0.16 -1.17 -0.40 2019 9.60 16.40 12.11 0.43 1.67 0.14 2.13 1.17 2020 10.60 14.00 12.64 0.25 0.96 0.08 -0.19 -0.47 Normal 10.33 11.87 11.17 0.10 0.40 0.04 0.18 -0.36
May (1st fortnight)
2017 7.50 16.50 13.89 0.65 2.53 0.18 2.06 -1.61 2018 11.60 18.60 14.94 0.64 2.49 0.17 -1.27 0.17 2019 10.40 14.20 12.77 0.29 1.13 0.09 -0.46 -0.51 2020 12.40 16.80 14.55 0.28 1.08 0.07 0.58 0.04 Normal 12.00 14.44 13.44 0.19 0.75 0.06 0.02 -0.68
May (2nd fortnight)
2017 12.80 19.00 16.04 0.44 1.78 0.11 -0.71 0.01 2018 14.80 17.50 15.88 0.18 0.72 0.05 -0.03 0.54 2019 13.50 16.20 14.88 0.19 0.77 0.05 -0.31 -0.18 2020 16.20 19.80 17.59 0.30 1.18 0.07 -0.78 0.68 Normal 14.14 15.81 15.06 0.13 0.51 0.03 -1.04 -0.01
June (1st fortnight)
2017 15.00 20.50 17.55 0.45 1.74 0.10 -1.12 0.26 2018 17.00 22.40 19.21 0.47 1.81 0.09 -0.81 0.53 2019 14.80 18.50 16.21 0.25 0.96 0.06 1.25 0.86 2020 15.40 20.40 17.19 0.38 1.46 0.09 -0.09 0.63 Normal 15.07 17.48 16.34 0.20 0.79 0.05 -1.44 0.15
June (2nd fortnight)
2017 16.50 21.60 19.20 0.39 1.49 0.08 -0.30 -0.46 2018 17.60 20.80 19.35 0.22 0.86 0.04 -0.01 -0.08 2019 15.40 18.40 17.23 0.21 0.82 0.05 0.32 -0.60 2020 17.40 23.60 19.97 0.47 1.82 0.09 -0.52 0.42 Normal 16.66 18.14 17.48 0.11 0.42 0.02 -0.37 -0.42
Cumulative 2017 2.00 21.60 12.39 0.49 5.44 0.44 -1.03 -0.33 2018 4.60 22.40 13.58 0.41 4.48 0.33 -1.15 0.03 2019 2.80 18.50 12.16 0.37 4.08 0.34 -0.83 -0.49 2020 4.20 23.60 13.42 0.42 4.66 0.35 -0.95 -0.08 Normal 4.90 18.14 12.06 0.36 4.00 0.33 -1.28 -0.17
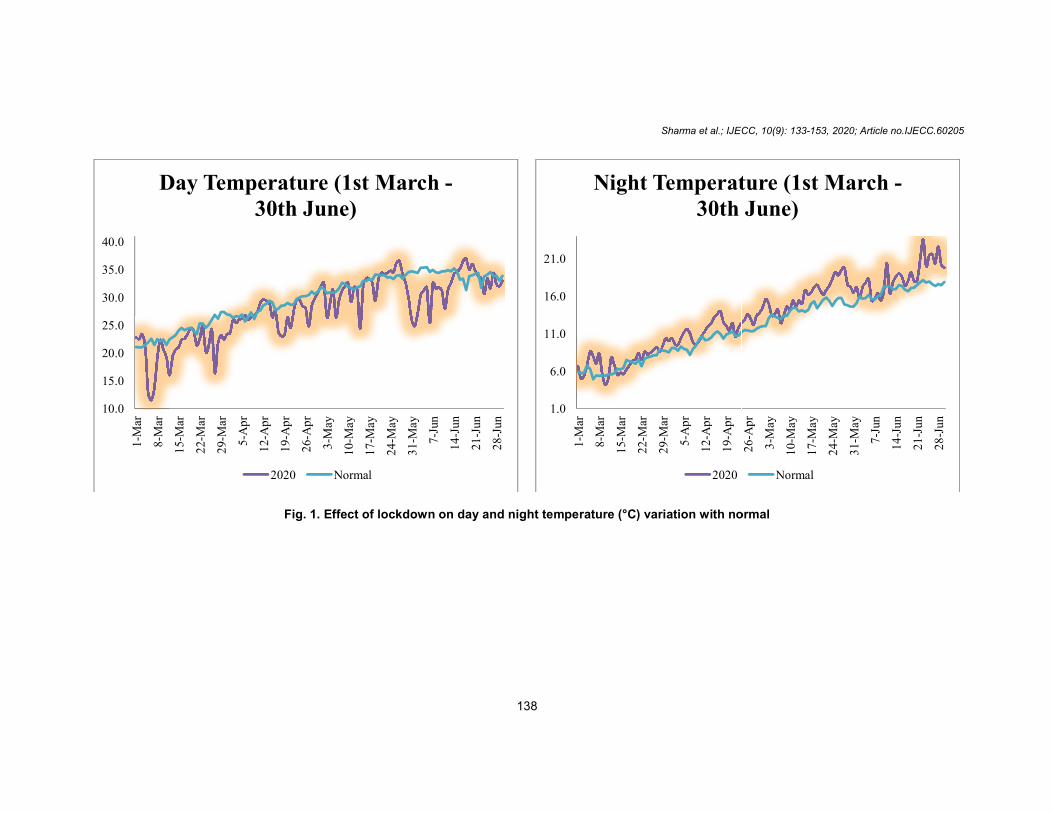
Fig. 1. Effect of lockdown on day and night temperature (°C) variation with normal
10.0
15.0
20.0
25.0
30.0
35.0
40.0
1-Mar
8-Mar
15-Mar
22-Mar
29-Mar
5-Apr
12-Apr
19-Apr
26-Apr
3-May
10-May
17-May
Day Temperature (1st March 30th June)
2020 Normal
Sharma et al.; IJECC
138
Effect of lockdown on day and night temperature (°C) variation with normal
17-May
24-May
31-May
7-Jun
14-Jun
21-Jun
28-Jun
Day Temperature (1st March -
Normal
1.0
6.0
11.0
16.0
21.0
1-Mar
8-Mar
15-Mar
22-Mar
29-Mar
5-Apr
12-Apr
19-Apr
26-Apr
Night Temperature (1st March 30th June)
2020
IJECC, 10(9): 133-153, 2020; Article no.IJECC.60205
Effect of lockdown on day and night temperature (°C) variation with normal
26-Apr
3-May
10-May
17-May
24-May
31-May
7-Jun
14-Jun
21-Jun
28-Jun
Night Temperature (1st March -30th June)
Normal

Sharma et al.; IJECC, 10(9): 133-153, 2020; Article no.IJECC.60205
139
The night temperature started easing down and sustainable pattern was observed (Fig. 1) from 1
st fortnight of March up to 2
nd fortnight of June
as compared to 2017-2020 and normal (Table 2) as the lockdown began. During 1st fortnight of March 2017-2020 and normal, lowest values observed were 2.0, 4.6, 2.8, 4.2 and 4.9, highest values observed were 8.0, 11.4, 9.2, 8.6 and 6.7. So, in 2020, the significant impact of lockdown was observed in 1st fortnight of March as night temperature 10.57% than normal mean value. The standard deviation calculated was 1.35 in lockdown and 0.47 in normal. During 2
nd fortnight
of March 2017-2020 and normal, lowest values observed were 3.5, 6.4, 4.6, 5.6 and 6.4 lowest and highest values noted were 12.5, 11.6, 11.2, 10.4 and 8.9 thereby significantly expressing 5.48% change from normal. The standard deviation calculated was 1.30 in lockdown and 0.74 in normal. Again, in 1
stfortnight of April
2017-2020 and normal, the lowest and highest values noted were 4.5, 8.4, 9.8, 9.5 and 8.2 whereas highest values observed were 12.5, 14.4, 13.6, 13.2 and 11.0 significantly depicting 12.15% variation from normal mean temperature value. The standard deviation calculated was 1.12 in lockdown and 0.83 in normal. Following data collection in 2
ndfortnight of April 2017-2020
and normal, lowest values were 8.4, 8.5, 9.6, 10.6 and 10.3 and highest values were17.5, 14.2, 16.4, 14.0 and 11.9 illustrating -11.62% significant change from normal mean value. The standard deviation calculated was 0.96 in lockdown and 0.40 in normal. During 1st fortnight of May 2017-2020 and normal, lowest values observed were 7.5, 11.6, 10.4, 12.4 and 12.0 highest values observed were 16.5, 18.6, 14.2, 16.8 and 14.4 representing 7.62% deviation from normal mean value. The standard deviation calculated was 1.08 in lockdown and 0.75 in normal. During 2nd fortnight of May 2017-2020 and normal, lowest values observed were 12.8, 14.8, 13.5, 16.2 and 14.1 highest values observed were 19.0, 17.5, 16.2, 19.8 and 15.8 representing 14.38% deviation from normal mean value. The standard deviation calculated was 1.18 in lockdown and 0.51 in normal. During 1
st fortnight of June 2017-2020 and normal,
lowest values observed were 15.0, 17.0, 14.8, 15.4 and 15., highest values observed were 20.5, 22.4, 18.5, 20.4 and 17.5 illustrating 4.94% deviation from normal mean value. The standard deviation calculated was 1.46 in lockdown and 0.79 in normal. During 2nd fortnight of June 2017-2020 and normal, lowest values observed were 16.5, 17.6, 15.4, 17.4 and 16.7 highest values observed were 21.6, 20.8, 18.4, 23.6 and 18.1
representing 12.46% deviation from normal mean value. The standard deviation calculated was 1.82 in lockdown and 0.42 in normal.
In cumulative analysis of 122 days data for night temperature, lowest values observed were 2.0, 4.6, 2.8, 4.2 and 4.9 in 2017-2020 and normal and highest values noted were 21.6, 22.4, 18.5, 23.6 and 18.1 (Table 2). The change in night temperature in lockdown was 10.13% from normal mean value as no significant change was observed. The standard deviation calculated was 4.66 in lockdown and 4.00 in normal. In the study, it was found that the significant impact of lockdown was found to be more on day temperature than on night temperature and can be correlated to the CO2 content in air. This essentially proves that the reduction in level of CO2 might have reduced the warming capacity leading to reduced temperature during day time in lockdown period [1]. Also, the fluctuation in CO2 pattern due to lack of anthropogenic activities amid lockdown could have reduced the gases content in atmosphere [7]. Also, due to the lockdown, emissions have reduced, thereby significantly reducing soot and sulphate particles which absorbs sunlight and causes more warming [1].
3.1.2 Effect on soil temperature (Morning and evening) at 5, 10 and 20 cm depth
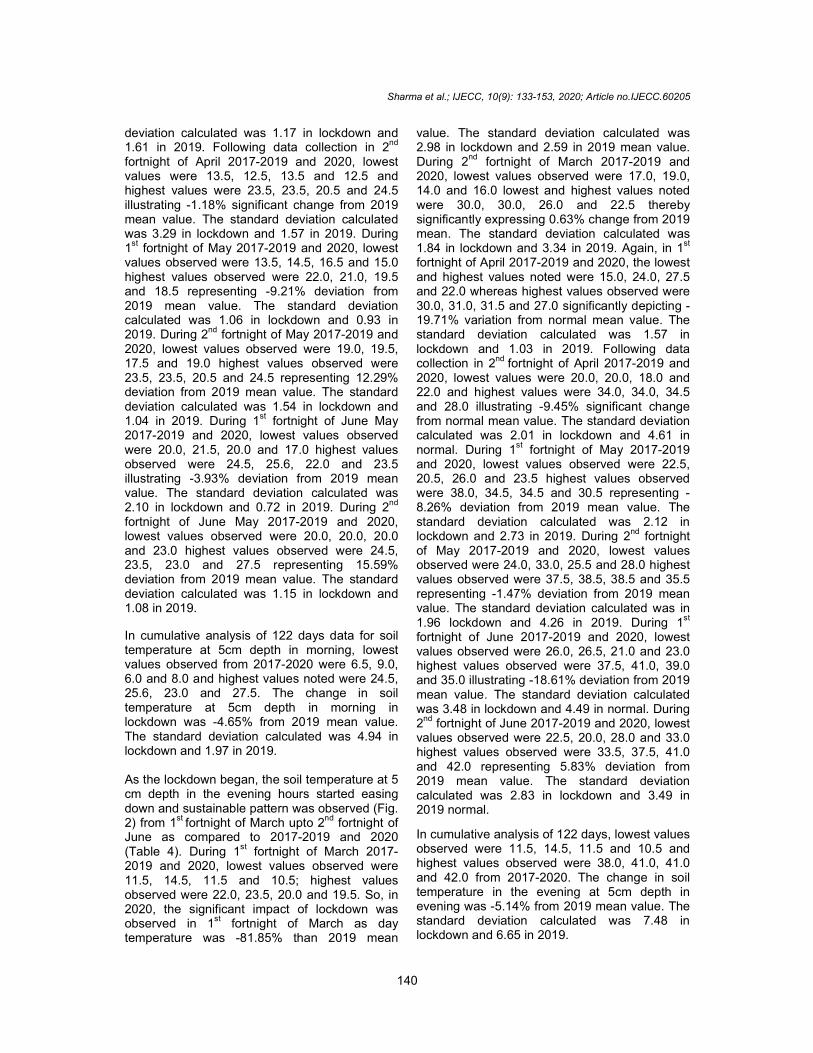
As the lockdown began, the soil temperature at 5 cm depth in the morning started easing down and sustainable pattern was observed (Fig. 2) from 1st fortnight of March up to 2nd fortnight of June as compared to 2017-2019 and 2020 (Table 3). During 1
st fortnight of March 2017-
2019 and 2020, lowest values observed were 6.5, 9.0, 6.0 and 8.0, highest values observed were 10.0, 13.5, 9.5 and 12.0. So, in 2020, the significant impact of lockdown was observed in 1
st fortnight of March as soil temperature at 5cm
depth was 24.47% than 2019 mean value. The standard deviation calculated was 1.29 in lockdown and 0.94 in 2019. During 2nd fortnight of March 2017-2019 and 2020, lowest values observed were 8.0, 12.0, 8.0 and 9.5 lowest and highest values noted were 23.5, 23.5, 20.5 and 24.5 thereby significantly expressing 0.57% change from 2019 mean value. The standard deviation calculated was 3.74 in lockdown and 3.62 in 2019. Again, in 1st fortnight of April 2017-2019 and 2020, the lowest and highest values noted were 10.0, 15.0, 11.5 and 11.5 whereas highest values observed were 15.5, 16.5, 16.5 and 15.5 significantly depicting -5.68% variation from 2019 normal mean value. The standard
Sharma et al.; IJECC, 10(9): 133-153, 2020; Article no.IJECC.60205
140
deviation calculated was 1.17 in lockdown and 1.61 in 2019. Following data collection in 2nd
fortnight of April 2017-2019 and 2020, lowest values were 13.5, 12.5, 13.5 and 12.5 and highest values were 23.5, 23.5, 20.5 and 24.5 illustrating -1.18% significant change from 2019 mean value. The standard deviation calculated was 3.29 in lockdown and 1.57 in 2019. During 1
st fortnight of May 2017-2019 and 2020, lowest
values observed were 13.5, 14.5, 16.5 and 15.0 highest values observed were 22.0, 21.0, 19.5 and 18.5 representing -9.21% deviation from 2019 mean value. The standard deviation calculated was 1.06 in lockdown and 0.93 in 2019. During 2nd fortnight of May 2017-2019 and 2020, lowest values observed were 19.0, 19.5, 17.5 and 19.0 highest values observed were 23.5, 23.5, 20.5 and 24.5 representing 12.29% deviation from 2019 mean value. The standard deviation calculated was 1.54 in lockdown and 1.04 in 2019. During 1
st fortnight of June May
2017-2019 and 2020, lowest values observed were 20.0, 21.5, 20.0 and 17.0 highest values observed were 24.5, 25.6, 22.0 and 23.5 illustrating -3.93% deviation from 2019 mean value. The standard deviation calculated was 2.10 in lockdown and 0.72 in 2019. During 2nd fortnight of June May 2017-2019 and 2020, lowest values observed were 20.0, 20.0, 20.0 and 23.0 highest values observed were 24.5, 23.5, 23.0 and 27.5 representing 15.59% deviation from 2019 mean value. The standard deviation calculated was 1.15 in lockdown and 1.08 in 2019.
In cumulative analysis of 122 days data for soil temperature at 5cm depth in morning, lowest values observed from 2017-2020 were 6.5, 9.0, 6.0 and 8.0 and highest values noted were 24.5, 25.6, 23.0 and 27.5. The change in soil temperature at 5cm depth in morning in lockdown was -4.65% from 2019 mean value. The standard deviation calculated was 4.94 in lockdown and 1.97 in 2019. As the lockdown began, the soil temperature at 5 cm depth in the evening hours started easing down and sustainable pattern was observed (Fig. 2) from 1
st fortnight of March upto 2
nd fortnight of
June as compared to 2017-2019 and 2020 (Table 4). During 1
st fortnight of March 2017-
2019 and 2020, lowest values observed were 11.5, 14.5, 11.5 and 10.5; highest values observed were 22.0, 23.5, 20.0 and 19.5. So, in 2020, the significant impact of lockdown was observed in 1
st fortnight of March as day
temperature was -81.85% than 2019 mean
value. The standard deviation calculated was 2.98 in lockdown and 2.59 in 2019 mean value. During 2
nd fortnight of March 2017-2019 and
2020, lowest values observed were 17.0, 19.0, 14.0 and 16.0 lowest and highest values noted were 30.0, 30.0, 26.0 and 22.5 thereby significantly expressing 0.63% change from 2019 mean. The standard deviation calculated was 1.84 in lockdown and 3.34 in 2019. Again, in 1
st
fortnight of April 2017-2019 and 2020, the lowest and highest values noted were 15.0, 24.0, 27.5 and 22.0 whereas highest values observed were 30.0, 31.0, 31.5 and 27.0 significantly depicting -19.71% variation from normal mean value. The standard deviation calculated was 1.57 in lockdown and 1.03 in 2019. Following data collection in 2nd fortnight of April 2017-2019 and 2020, lowest values were 20.0, 20.0, 18.0 and 22.0 and highest values were 34.0, 34.0, 34.5 and 28.0 illustrating -9.45% significant change from normal mean value. The standard deviation calculated was 2.01 in lockdown and 4.61 in normal. During 1
st fortnight of May 2017-2019
and 2020, lowest values observed were 22.5, 20.5, 26.0 and 23.5 highest values observed were 38.0, 34.5, 34.5 and 30.5 representing -8.26% deviation from 2019 mean value. The standard deviation calculated was 2.12 in lockdown and 2.73 in 2019. During 2nd fortnight of May 2017-2019 and 2020, lowest values observed were 24.0, 33.0, 25.5 and 28.0 highest values observed were 37.5, 38.5, 38.5 and 35.5 representing -1.47% deviation from 2019 mean value. The standard deviation calculated was in 1.96 lockdown and 4.26 in 2019. During 1
st
fortnight of June 2017-2019 and 2020, lowest values observed were 26.0, 26.5, 21.0 and 23.0 highest values observed were 37.5, 41.0, 39.0 and 35.0 illustrating -18.61% deviation from 2019 mean value. The standard deviation calculated was 3.48 in lockdown and 4.49 in normal. During 2
nd fortnight of June 2017-2019 and 2020, lowest
values observed were 22.5, 20.0, 28.0 and 33.0 highest values observed were 33.5, 37.5, 41.0 and 42.0 representing 5.83% deviation from 2019 mean value. The standard deviation calculated was 2.83 in lockdown and 3.49 in 2019 normal.
In cumulative analysis of 122 days, lowest values observed were 11.5, 14.5, 11.5 and 10.5 and highest values observed were 38.0, 41.0, 41.0 and 42.0 from 2017-2020. The change in soil temperature in the evening at 5cm depth in evening was -5.14% from 2019 mean value. The standard deviation calculated was 7.48 in lockdown and 6.65 in 2019.

Fig. 2. Effect of lockdown on soil temperature
5.0
10.0
15.0
20.0
25.0
1-Mar
8-Mar
15-Mar
22-Mar
29-Mar
5-Apr
12-Apr
19-Apr
26-Apr
3-May
10-May
17-May
Soil Temperature at 5 cm depth in Morning (1st March
June)
2019 2020
Sharma et al.; IJECC
141
soil temperature (°C) at 5 cm depth in morning and evening variation with year 2019
17-May
24-May
31-May
7-Jun
14-Jun
21-Jun
28-Jun
Soil Temperature at 5 cm depth in Morning (1st March - 30th
0.010.020.030.040.050.0
1-Mar
8-Mar
15-Mar
22-Mar
29-Mar
5-Apr
12-Apr
19-Apr
26-Apr
Soil Temperature at 5 cm depth in Evening (1st March
June)
2019
IJECC, 10(9): 133-153, 2020; Article no.IJECC.60205
(°C) at 5 cm depth in morning and evening variation with year 2019
26-Apr
3-May
10-May
17-May
24-May
31-May
7-Jun
14-Jun
21-Jun
28-Jun
Soil Temperature at 5 cm depth in Evening (1st March - 30th
June)
2020
Sharma et al.; IJECC, 10(9): 133-153, 2020; Article no.IJECC.60205
142
Table 3. Descriptive coefficients of soil temperature (°C) at 5 cm depth in morning from March – June for the year 2017-2020 and normal
Timeline Year Lowest Highest Mean S.E S.D CV (%) Kurtosis Skewness March (1st Fortnight)
2017 6.50 10.00 8.10 0.25 0.99 0.12 -0.50 0.33 2018 9.00 13.50 11.10 0.31 1.20 0.11 -0.16 0.09 2019 6.00 9.50 7.50 0.24 0.94 0.13 -0.13 0.37 2020 8.00 12.00 9.93 0.33 1.29 0.13 -0.89 -0.34
March (2nd Fortnight)
2017 8.00 23.50 16.60 0.48 4.20 0.25 -0.95 -0.30 2018 12.00 23.50 17.03 0.37 3.27 0.19 -0.84 0.44 2019 8.00 20.50 15.45 0.41 3.62 0.23 -0.79 -0.65 2020 9.50 24.50 15.54 0.43 3.74 0.24 -0.38 0.72
April (1st Fortnight)
2017 10.00 15.50 13.07 0.43 1.68 0.13 -0.81 -0.55 2018 15.00 16.50 15.73 0.15 0.56 0.04 -1.33 -0.08 2019 11.50 16.50 14.13 0.42 1.61 0.11 -1.18 -0.23 2020 11.50 15.50 13.37 0.30 1.17 0.09 -0.89 0.29
April (2nd Fortnight)
2017 13.50 23.50 19.38 0.37 2.50 0.13 -0.25 -0.63 2018 12.50 23.50 18.76 0.44 2.99 0.16 -1.01 -0.10 2019 13.50 20.50 17.87 0.23 1.57 0.09 0.98 -0.72 2020 12.50 24.50 17.66 0.49 3.29 0.19 -0.88 0.48
May (1st fortnight)
2017 13.50 22.00 19.40 0.62 2.41 0.12 1.11 -1.15 2018 14.50 21.00 17.97 0.48 1.88 0.10 -0.49 -0.26 2019 16.50 19.50 18.13 0.24 0.93 0.05 -0.48 -0.30 2020 15.00 18.50 16.60 0.27 1.06 0.06 -0.68 0.07
May (2nd fortnight)
2017 19.00 23.50 21.13 0.35 1.40 0.07 -1.39 0.17 2018 19.50 23.50 22.00 0.30 1.18 0.05 -0.13 -0.93 2019 17.50 20.50 18.97 0.26 1.04 0.05 -1.12 0.50 2020 19.00 24.50 21.63 0.39 1.54 0.07 -0.13 0.54
June (1st fortnight)
2017 20.00 24.50 22.10 0.32 1.24 0.06 0.02 -0.01 2018 21.50 25.60 23.17 0.28 1.08 0.05 0.84 0.89 2019 20.00 22.00 21.13 0.19 0.72 0.03 -0.93 -0.54 2020 17.00 23.50 20.33 0.54 2.10 0.10 -1.19 -0.05
June (2nd fortnight)
2017 20.00 24.50 22.13 0.34 1.32 0.06 -0.67 0.10 2018 20.00 23.50 21.90 0.24 0.95 0.04 -0.14 -0.47 2019 20.00 23.00 21.27 0.28 1.08 0.05 -1.56 -0.03 2020 23.00 27.50 25.20 0.30 1.15 0.05 0.34 -0.36
Cumulative 2017 6.50 24.50 16.91 0.48 5.29 0.31 -1.11 -0.49 2018 9.00 25.60 17.65 0.39 4.33 0.25 -1.25 -0.09 2019 6.00 23.00 15.89 0.45 4.94 0.31 -1.02 -0.55 2020 8.00 27.50 16.63 0.47 5.17 0.31 -1.04 0.34
As the lockdown began, the soil temperature at 10cm depth in the morning started easing down and sustainable pattern was observed (Fig. 3) from 1stfortnight of March upto 2nd fortnight of June as compared to 2017-2019 and 2020 (Table 5). During 1
st fortnight of March 2017-
2019 and 2020, lowest values observed were 7.5, 10.0, 7.5 and 10.0; highest values observed were 11.0, 14.0, 11.0 and 12.5. So, in 2020, the significant impact of lockdown was observed in 1
st fortnight of March as day temperature was
23.15% than 2019 normal mean value. The standard deviation calculated was 0.80 in lockdown and 0.92 in normal. During 2nd fortnight of March 2017-2019 and 2020, lowest values
observed were 8.5, 12.5, 9.0 and 11.0 lowest and highest values noted were 17.0, 16.0, 13.0 and 13.5 thereby significantly expressing 16.49% change from 2019 normal. The standard deviation calculated was 0.78 in lockdown and 1.15 in 2019. Again, in 1
st fortnight of April 2017-
2019 and 2020, the lowest and highest values noted were 11.5, 16.0, 12.5 and 13.5 whereas highest values observed were 16.5, 18.0, 18.0 and 17.0 significantly depicting -2.87% variation from 2019 normal mean value. The standard deviation calculated was 1.06 in lockdown and 1.83 in 2019. Following data collection in 2
nd
fortnight of April 2017-2019 and 2020, lowest values were 15.0, 13.5, 15.0 and 14.0 and

Sharma et al.; IJECC, 10(9): 133-153, 2020; Article no.IJECC.60205
143
highest values were 23.0, 20.0, 20.0 and 17.5 illustrating -12.78% significant change from 2019 normal mean value. The standard deviation calculated was 1.06 in lockdown and 1.39 in 2019. During 1st fortnight of May 2017-2019 and 2020, lowest values observed were 16.5, 15.0, 18.0 and 16.5 highest values observed were 24.5, 21.5, 21.5 and 19.5 representing -10.50% deviation from 2019 normal mean value. The standard deviation calculated was 0.88 in lockdown and 0.98 in 2019. During 2
nd fortnight
of May 2017-2019 and 2020, lowest values observed were 20.0, 21.0, 19.0 and 20.5 highest values observed were 25.0, 25.5, 26.5 and 26.5 representing 11.02% deviation from 2019 normal
mean value. The standard deviation calculated was 1.52 in lockdown and 0.99 in 2019. During 1
st fortnight of June 2017-2019 and 2020, lowest
values observed were 21.5, 23.0, 22.0 and 20.5 highest values observed were 26.5, 26.0, 24.0 and 24.5 illustrating -3.13% deviation from 2019 normal mean value. The standard deviation calculated was 1.42 in lockdown and 0.67 in 2019. During 2
nd fortnight of June 2017-2019 and
2020, lowest values observed were 21.5, 20.0, 21.5 and 24.5 highest values observed were 25.5, 25.0, 24.5 and 29.5 representing 11.24% deviation from normal mean value. The standard deviation calculated was 1.23 in lockdown and 1.04 in 2019.
Table 4. Descriptive coefficients of soil temperature (°C) at 5 cm depth in evening from
March – June for the year 2017-2020
Timeline Year Lowest Highest Mean S.E S.D CV (%) Kurtosis Skewness March (1st Fortnight)
2017 11.50 22.00 17.23 0.92 3.58 0.21 -1.16 -0.38 2018 14.50 23.50 20.13 0.72 2.79 0.14 -0.52 -0.84 2019 11.50 20.00 15.03 0.67 2.59 0.17 -1.08 0.31 2020 10.50 19.50 16.37 0.77 2.98 0.18 -0.08 -1.09
March (2nd Fortnight)
2017 17.00 30.00 24.47 0.90 3.58 0.15 -0.42 -0.41 2018 19.00 30.00 25.34 0.78 3.14 0.12 -0.56 -0.10 2019 14.00 26.00 20.50 0.84 3.34 0.16 -0.32 -0.04 2020 16.00 22.50 20.63 0.46 1.84 0.09 1.12 -1.09
April (1st Fortnight)
2017 15.00 30.00 25.33 1.24 4.82 0.19 0.19 -1.10 2018 24.00 31.00 27.20 0.56 2.16 0.08 -0.92 0.30 2019 27.50 31.50 29.33 0.27 1.03 0.04 0.85 0.01 2020 22.00 27.00 24.50 0.41 1.57 0.06 -0.52 0.19
April (2nd Fortnight)
2017 20.00 34.00 30.83 1.10 4.28 0.14 2.18 -1.71 2018 20.00 34.00 28.10 1.20 4.64 0.17 -1.13 -0.36 2019 18.00 34.50 27.77 1.19 4.61 0.17 -0.37 -0.46 2020 22.00 28.00 25.37 0.52 2.01 0.08 -1.27 -0.51
May (1st fortnight)
2017 22.50 38.00 33.53 1.05 4.06 0.12 3.51 -1.87 2018 20.50 34.50 27.37 0.97 3.75 0.14 -0.27 0.34 2019 26.00 34.50 30.53 0.70 2.73 0.09 -0.92 -0.33 2020 23.50 30.50 28.20 0.55 2.12 0.08 -0.13 -0.82
May (2nd fortnight)
2017 24.00 37.50 31.75 1.11 4.43 0.14 -1.16 -0.40 2018 33.00 38.50 36.56 0.50 2.01 0.05 -1.01 -0.82 2019 25.50 38.50 32.41 1.06 4.26 0.13 -0.98 -0.26 2020 28.00 35.50 31.94 0.49 1.96 0.06 0.45 -0.39
June (1st fortnight)
2017 26.00 37.50 31.23 0.97 3.77 0.12 -1.20 0.40 2018 26.50 41.00 36.37 0.94 3.64 0.10 2.85 -1.40 2019 21.00 39.00 34.67 1.16 4.49 0.13 5.98 -2.17 2020 23.00 35.00 29.23 0.90 3.48 0.12 -0.52 -0.38
June (2nd fortnight)
2017 22.50 33.50 29.17 0.87 3.36 0.12 -0.64 -0.47 2018 20.00 37.50 31.87 1.23 4.78 0.15 1.47 -1.22 2019 28.00 41.00 35.53 0.90 3.49 0.10 0.14 -0.25 2020 33.00 42.00 37.73 0.73 2.83 0.08 -0.95 -0.14
Cumulative 2017 11.50 38.00 27.95 0.57 6.34 0.23 -0.27 -0.62 2018 14.50 41.00 29.15 0.57 6.25 0.21 -0.91 -0.06 2019 11.50 41.00 28.19 0.68 7.48 0.27 -0.59 -0.56 2020 10.50 42.00 26.74 0.60 6.65 0.25 -0.23 0.05

Sharma et al.; IJECC, 10(9): 133-153, 2020; Article no.IJECC.60205
144
Table 5. Descriptive coefficients of soil temperature (°C) at 10 cm depth in morning from March – June for the year 2017-2020
Timeline Year Lowest Highest Mean S.E S.D CV (%) Kurtosis Skewness March (1st Fortnight)
2017 7.50 11.00 9.10 0.27 1.06 0.12 -0.40 0.43 2018 10.00 14.00 11.87 0.31 1.20 0.10 -0.90 0.11 2019 7.50 11.00 8.63 0.24 0.92 0.11 1.94 1.16 2020 10.00 12.50 11.23 0.21 0.80 0.07 -1.17 0.19
March (2nd Fortnight)
2017 8.50 17.00 12.97 0.73 2.91 0.22 -1.22 -0.24 2018 12.50 16.00 14.09 0.26 1.02 0.07 -0.70 0.36 2019 9.00 13.00 10.78 0.29 1.15 0.11 -0.38 0.21 2020 11.00 13.50 12.91 0.19 0.78 0.06 1.34 -1.46
April (1st Fortnight)
2017 11.50 16.50 14.57 0.44 1.70 0.12 -1.02 -0.70 2018 16.00 18.00 17.00 0.15 0.60 0.04 -0.75 -0.29 2019 12.50 18.00 15.40 0.47 1.83 0.12 -1.07 -0.40 2020 13.50 17.00 14.97 0.27 1.06 0.07 -0.87 0.52
April (2nd Fortnight)
2017 15.00 23.00 18.88 0.56 2.22 0.12 -0.66 0.14 2018 13.50 20.00 17.25 0.51 2.02 0.12 -0.91 -0.39 2019 15.00 20.00 18.08 0.35 1.39 0.08 0.05 -0.72 2020 14.00 17.50 16.03 0.26 1.06 0.07 -0.73 -0.43
May (1st fortnight)
2017 16.50 24.50 21.20 0.58 2.25 0.11 -0.12 -0.43 2018 15.00 21.50 18.93 0.52 2.03 0.11 -0.73 -0.43 2019 18.00 21.50 19.67 0.25 0.98 0.05 -0.10 -0.28 2020 16.50 19.50 17.80 0.23 0.88 0.05 -0.56 0.26
May (2nd fortnight)
2017 20.00 25.00 22.53 0.34 1.35 0.06 -0.32 0.04 2018 21.00 25.50 23.69 0.33 1.31 0.06 -0.43 -0.69 2019 19.00 22.50 20.91 0.25 0.99 0.05 -0.86 -0.12 2020 20.50 26.50 23.50 0.38 1.52 0.06 0.54 0.21
June (1st fortnight)
2017 21.50 26.50 23.73 0.39 1.52 0.06 -0.65 0.27 2018 23.00 26.00 24.30 0.23 0.88 0.04 -0.64 0.53 2019 22.00 24.00 23.03 0.17 0.67 0.03 -1.23 -0.14 2020 20.50 24.50 22.33 0.37 1.42 0.06 -1.13 0.39
June (2nd fortnight)
2017 21.50 25.50 23.53 0.30 1.17 0.05 -0.95 -0.09 2018 20.00 25.00 23.30 0.34 1.31 0.06 1.70 -1.18 2019 21.50 24.50 23.37 0.27 1.04 0.04 -0.75 -0.57 2020 24.50 29.50 26.33 0.32 1.23 0.05 1.89 1.03
Cumulative 2017 7.50 26.50 18.33 0.49 5.46 0.30 -1.03 -0.52 2018 10.00 26.00 18.80 0.41 4.57 0.24 -1.28 -0.11 2019 7.50 24.50 17.46 0.48 5.27 0.30 -1.09 -0.52 2020 10.00 29.50 18.14 0.47 5.18 0.29 -1.17 0.29
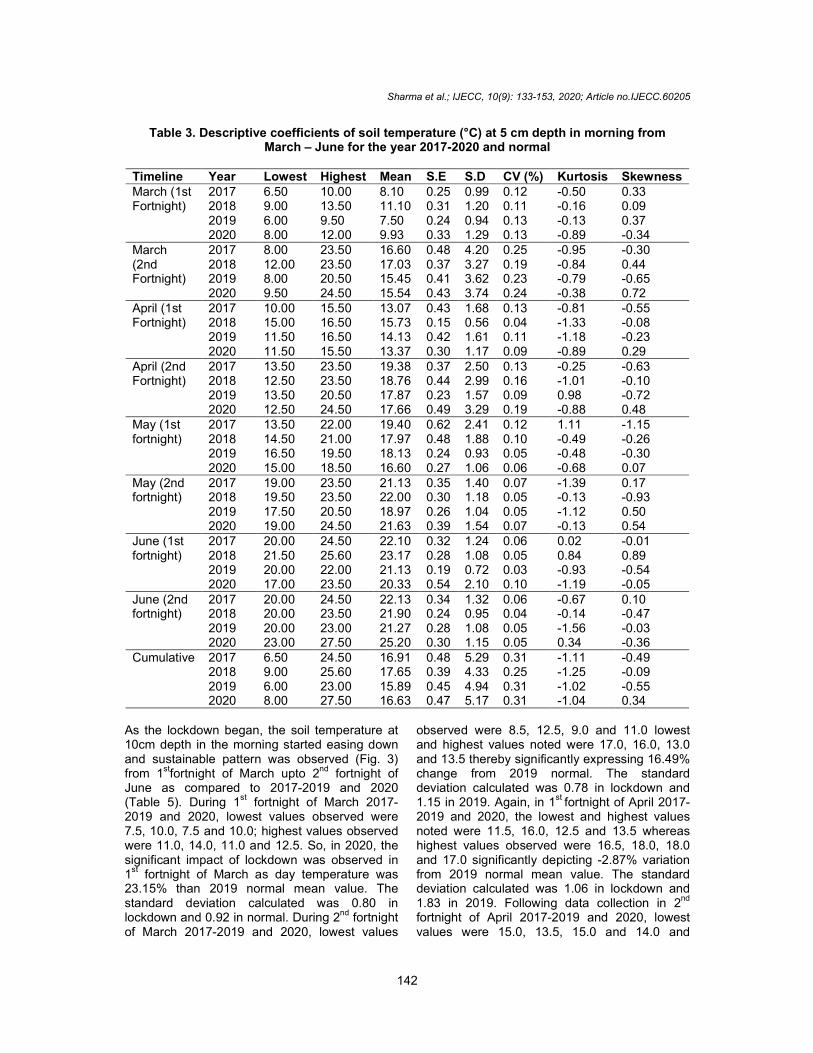
In cumulative analysis of 122 days, lowest values observed were 7.5, 10.0, 7.5 and 10.0; highest values observed were 26.5, 26.0, 24.5 and 29.5 from 2017-2020. The change in soil temperature in the evening at 10cm depth in morning in lockdown was 3.74% from 2019 mean value. The standard deviation calculated was 7.48 in lockdown and 6.65 in 2019. As the lockdown began, the soil temperature at 10cm depth in the evening started easing down and sustainable pattern was observed (Fig. 3) from 1
st fortnight of March upto 2
nd fortnight of
June as compared to 2017-2019 and 2020 (Table 6). During 1
st fortnight of March 2017-
2019 and 2020, lowest values observed were 12.0, 13.0, 10.0 and 11.5; highest values observed were 18.5, 22.0, 17.5 and 17.0. So, in 2020, the significant impact of lockdown was observed in 1st fortnight of March as soil temperature (10cm) was 8.80% than 2019 normal mean value. The standard deviation calculated 1.81 was in lockdown and 2.06 in 2019. During 2nd fortnight of March 2017-2019 and 2020, lowest values observed were 15.0, 18.5, 13.5 and 14.5 lowest and highest values noted were 26.0, 27.5, 24.5 and 22.0 thereby significantly expressing -6.17% change from 2019 normal mean value. The standard deviation calculated was 1.67 in lockdown and 3.22 in

Sharma et al.; IJECC, 10(9): 133-153, 2020; Article no.IJECC.60205
145
2019. Again, in 1st
fortnight of April 2017-2019 and 2020, the lowest and highest values noted were 15.5, 22.5, 26.5 and 19.0 whereas highest values observed were 28.0, 29.0, 30.0 and 24.5 significantly depicting -25.87% variation from 2019 normal mean value. The standard deviation calculated was 1.60 in lockdown and 0.92 in 2019. Following data collection in 2
nd fortnight of
April 2017-2019 and 2020, lowest values were 21.0, 17.5, 19.0 and 20.5 and highest values were 30.0, 33.0, 32.5 and 25.0 illustrating -15.49% significant change from 2019 normal mean value. The standard deviation calculated was 1.62 in lockdown and 3.77 in 2019. During 1st fortnight of May 2017-2019 and 2020, lowest values observed were 23.0, 20.0, 26.0 and 21.0 highest values observed were 36.0, 32.0, 32.5 and 26.5 representing -17.25% deviation from 2019 normal mean value. The standard deviation calculated was 1.63 in lockdown and 2.10 in 2019. During 2
nd fortnight of May 2017-2019 and
2020, lowest values observed were 25.0, 31.5, 24.5 and 25.5; highest values observed were 35.0, 36.5, 36.0 and 30.0 representing -11.61% deviation from 2019 normal mean value. The standard deviation calculated was 1.26 in lockdown and 3.90 in 2019. During 1st fortnight of June 2017-2019 and 2020, lowest values observed were 24.5, 29.5, 22.5 and 23.5 highest values observed were 31.0, 37.5, 37.0 and 31.5 illustrating -22.91% deviation from 2019 normal mean value. The standard deviation calculated was 2.48 in lockdown and 3.95 in 2019. During 2nd fortnight of June 2017-2019 and 2020, lowest values observed were 23.0, 21.00, 27.0 and 31.0 highest values observed were 29.0, 36.0, 38.0 and 38.5 representing 2.99 deviation from 2019 normal mean value. The standard deviation calculated was 2.46 in lockdown and 3.15 in 2019. In cumulative analysis of 122 days, lowest values observed were 12.0, 13.0, 10.0 and 11.5; highest values observed were 36.0, 37.5, 38.0 and 38.5 from 2017-2020. The change in soil temperature in the evening at 10cm depth in evening in lockdown was -11.30% from 2019 mean value. The standard deviation calculated was 6.04 in lockdown and 7.29 in 2019. As the lockdown began, the soil temperature at 20cm depth in the morning started easing down and sustainable pattern was observed (Fig. 4) from 1
stfortnight of March upto 2
nd fortnight of
June as compared to 2017-2019 and 2020
(Table 7). During 1st fortnight of March 2017-
2019 and 2020, lowest values observed were 9.5, 11.5, 9.5 and 11.5; highest values observed were 12.5, 15.5, 11.5 and 13.5. So, in 2020, the significant impact of lockdown was observed in 1
st fortnight of March as soil temperature at 20cm
depth was 18.29% than 2019 normal mean value. The standard deviation calculated was 0.50 in lockdown and 0.56 in 2019. During 2
nd
fortnight of March 2017-2019 and 2020, lowest values observed were 11.0, 14.0, 10.5 and 12.5 lowest and highest values noted were 18.5, 18.0, 14.0 and 15.5 thereby significantly expressing 15.41% change from 2019 normal mean value. The standard deviation calculated was 0.98 in lockdown and 1.09 in 2019. Again, in 1
st fortnight
of April 2017-2019 and 2020, the lowest and highest values noted were 14.0, 17.5, 13.5 and 15.5 whereas highest values observed were 20.0, 19.5, 19.0 and 18.0 significantly depicting -0.24% variation from 2019 normal mean value. The standard deviation calculated was 0.81 in lockdown and 1.87 in 2019. Following data collection in 2nd fortnight of April 2017-2019 and 2020, lowest values were 18.0, 15.5, 17.5 and 17.6 and highest values were 22.0, 22.0, 21.5 and 18.5 illustrating -10.46% significant change from 2019 normal mean value. The standard deviation calculated was 0.46 in lockdown and 1.30 in 2019. During 1
st fortnight of May 2017-
2019 and 2020, lowest values observed were 20.0, 16.5, 20.5 and 17.5 highest values observed were 25.5, 22.5, 22.5 and 2.5 representing -13.68% deviation from 2019 normal mean value. The standard deviation calculated was 0.89 in lockdown and 0.51 in 2019. During 2
nd fortnight of May 2017-2019 and
2020, lowest values observed were 21.5, 22.0, 21.0 and 21.0 highest values observed were 25.5, 26.0, 24.0 and 27.0 representing 10.42% deviation from 2019 normal mean value. The standard deviation calculated was 1.68 in lockdown and 0.75 in 2019. During 1
st fortnight of
June 2017-2019 and 2020, lowest values observed were 24.0, 24.0, 24.0 and 22.5, highest values observed were 27.5, 26.0, 26.0 and 26.0 illustrating -2.77% deviation from 2019 normal mean value. The standard deviation calculated was 0.92 in lockdown and 0.73 in 2019. During 2
nd fortnight of June 2017-2019 and 2020, lowest
values observed were 22.5, 22.0, 24.0 and 26.0 highest values observed were 26.0, 26.0, 26.5 and 30.5 representing 7.06% deviation from 2019 normal mean value. The standard deviation calculated was 1.10 in lockdown and 0.81 in 2019 normal.
Sharma et al.; IJECC, 10(9): 133-153, 2020; Article no.IJECC.60205
146
Table 6. Descriptive coefficients of soil temperature (°C) at 10 cm depth in evening from March – June for the year 2017-2020
Timeline Year Lowest Highest Mean S.E S.D CV (%) Kurtosis Skewness March (1st Fortnight)
2017 12.00 18.50 15.57 0.56 2.18 0.14 -1.29 -0.21 2018 13.00 22.00 18.53 0.73 2.84 0.15 -0.73 -0.79 2019 10.00 17.50 13.47 0.53 2.06 0.15 -0.56 0.22 2020 11.50 17.00 14.77 0.47 1.81 0.12 -0.67 -0.80
March (2nd Fortnight)
2017 15.00 26.00 21.94 0.89 3.55 0.16 -1.10 -0.36 2018 18.50 27.50 23.50 0.71 2.85 0.12 -1.14 0.09 2019 13.50 24.50 18.91 0.81 3.22 0.17 -0.57 0.31 2020 14.50 22.00 17.81 0.42 1.67 0.09 2.10 0.55
April (1st Fortnight)
2017 15.50 28.00 22.70 1.00 3.88 0.17 -0.54 -0.46 2018 22.50 29.00 25.60 0.52 2.01 0.08 -0.96 0.22 2019 26.50 30.00 28.07 0.24 0.92 0.03 0.28 0.56 2020 19.00 24.50 22.30 0.41 1.60 0.07 0.14 -0.83
April (2nd Fortnight)
2017 21.00 30.00 27.63 0.76 2.92 0.11 1.49 -1.63 2018 17.50 33.00 26.63 1.24 4.79 0.18 -0.96 -0.37 2019 19.00 32.50 26.83 0.97 3.77 0.14 -0.44 -0.28 2020 20.50 25.00 23.23 0.42 1.62 0.07 -1.33 -0.51
May (1st fortnight)
2017 23.00 36.00 30.85 0.83 3.23 0.10 1.76 -1.15 2018 20.00 32.00 26.13 0.85 3.29 0.13 -0.17 0.31 2019 26.00 32.50 29.43 0.54 2.10 0.07 -0.90 -0.30 2020 21.00 26.50 25.10 0.42 1.63 0.06 1.41 -1.31
May (2nd fortnight)
2017 25.00 35.00 30.63 0.86 3.44 0.11 -1.28 -0.33 2018 31.50 36.50 34.41 0.44 1.74 0.05 -1.29 -0.59 2019 24.50 36.00 30.94 0.97 3.90 0.13 -1.20 -0.43 2020 25.50 30.00 27.72 0.32 1.26 0.05 -0.61 0.25
June (1st fortnight)
2017 24.50 31.00 27.27 0.49 1.88 0.07 -0.18 0.27 2018 29.50 37.50 34.37 0.64 2.50 0.07 -0.31 -0.78 2019 22.50 37.00 33.10 1.02 3.95 0.12 2.50 -1.45 2020 23.50 31.50 26.93 0.64 2.48 0.09 -0.76 -0.03
June (2nd fortnight)
2017 23.00 29.00 26.50 0.44 1.70 0.06 -0.50 -0.28 2018 21.00 36.00 30.33 0.99 3.83 0.13 1.48 -0.90 2019 27.00 38.00 33.63 0.81 3.15 0.09 -0.14 -0.58 2020 31.00 38.50 34.67 0.64 2.46 0.07 -1.35 0.05
Cumulative 2017 12.00 36.00 25.40 0.51 5.59 0.22 -0.37 -0.48 2018 13.00 37.50 27.46 0.54 5.93 0.22 -0.83 -0.15 2019 10.00 38.00 26.77 0.66 7.29 0.27 -0.55 -0.82 2020 11.50 38.50 24.05 0.55 6.04 0.25 -0.24 -0.15
In cumulative analysis of 122 days, lowest values observed were 9.5, 11.5, 9.5 and 11.5; highest values observed were 27.5, 27.5, 26.5 and 30.5 from 2017-2020. The change in soil temperature in the evening at 20cm depth in morning in lockdown was 2.65% from 2019 mean value. The standard deviation calculated was 5.08 in lockdown and 5.38 in 2019. As the lockdown began, the soil temperature at 20cm depth in the evening started going down and sustainable pattern was observed (Fig. 4) from 1
stfortnight of March up to 2
nd fortnight of
June as compared to 2017-2019 and 2020 (Table 8). During 1
st fortnight of March 2017-
2019 and 2020, lowest values observed were 11.5, 12.0, 10.0 and 12.5; highest values observed were 14.0, 16.0, 15.0 and 15.5. So, in 2020, the significant impact of lockdown was observed in 1st fortnight of March as soil temperature was 15.28% than 2019 normal mean value. The standard deviation calculated was 0.90 in lockdown and 1.29 in 2019. During 2nd fortnight of March 2017-2019 and 2020, lowest values observed were 11.5, 16.0, 13.0 and 15.0 lowest and highest values noted were 22.5, 21.0, 20.0 and 18.5 thereby significantly expressing 7.48% change from 2019. The standard deviation calculated was 1.06 in lockdown and 2.17 in 2019. Again, in 1
st fortnight

Sharma et al.; IJECC, 10(9): 133-153, 2020; Article no.IJECC.60205
147
of April 2017-2019 and 2020, the lowest and highest values noted were 16.5, 20.0, 20.5 and 17.5 whereas highest values observed were 20.5, 22.5, 25.5 and 23.0 significantly depicting -11.57% variation from normal mean value. The standard deviation calculated 1.55 was in lockdown and 1.50 in 2019. Following data collection in 2
nd fortnight of April 2017-2019 and
2020, lowest values were 21.0, 17.5, 19.0 and 19.0 and highest values were 25.0, 26.0, 27.0 and 23.5 illustrating -7.38% significant change from 2019 normal mean value. The standard deviation calculated was 1.55 in lockdown and 2.25 in 2019. During 1st fortnight of May 2017-
2019 and 2020, lowest values observed were 21.0, 20.0, 22.5 and 20.5 highest values observed were 28.5, 24.5, 27.5 and 25.0 representing -5.92% deviation from 2019 normal mean value. The standard deviation calculated was 1.20 in lockdown and 1.65 in 2019. During 2nd fortnight of May 2017-2019 and 2020, lowest values observed were 23.5, 23.5, 22.0 and 24.0 highest values observed were 28.0, 29.0, 27.5 and 28.5 representing 3.84% deviation from 2019 normal mean value. The standard deviation calculated was 1.28 in lockdown and 1.50 in 2019. During 1
st fortnight of June 2017-2019 and
2020, lowest values observed were 24.5, 23.0,
Table 7. Descriptive coefficients of soil temperature (°C) at 20 cm depth in morning from March – June for the year 2017-2020
Timeline Year Lowest Highest Mean S.E S.D CV (%) Kurtosis Skewness March (1st Fortnight)
2017 9.50 12.50 11.10 0.25 0.99 0.09 -1.18 0.13 2018 11.50 15.50 12.90 0.34 1.30 0.10 -0.51 0.87 2019 9.50 11.50 10.27 0.15 0.56 0.05 0.26 0.42 2020 11.50 13.50 12.57 0.13 0.50 0.04 0.62 -0.30
March (2nd Fortnight)
2017 11.00 18.50 14.63 0.61 2.44 0.17 -1.18 -0.09 2018 14.00 18.00 15.56 0.25 0.98 0.06 1.51 0.89 2019 10.50 14.00 12.13 0.27 1.09 0.09 -0.91 0.21 2020 12.50 15.50 14.34 0.24 0.98 0.07 -0.19 -0.78
April (1st Fortnight)
2017 14.00 20.00 16.97 0.37 1.43 0.08 1.15 -0.11 2018 17.50 19.50 18.30 0.12 0.46 0.02 2.74 0.97 2019 13.50 19.00 16.67 0.48 1.87 0.11 -1.04 -0.54 2020 15.50 18.00 16.63 0.21 0.81 0.05 -1.05 0.54
April (2nd Fortnight)
2017 18.00 22.00 20.80 0.30 1.15 0.06 0.92 -0.83 2018 15.50 22.00 18.90 0.51 1.97 0.10 -0.90 -0.05 2019 17.50 21.50 19.63 0.34 1.30 0.07 -0.96 -0.39 2020 17.00 18.50 17.77 0.12 0.46 0.03 -0.48 -0.11
May (1st fortnight)
2017 20.00 25.50 22.80 0.53 2.05 0.09 -1.44 -0.03 2018 16.50 22.50 20.00 0.50 1.92 0.10 -1.00 -0.61 2019 20.50 22.50 21.60 0.13 0.51 0.02 0.40 -0.46 2020 17.50 20.50 19.00 0.23 0.89 0.05 -1.01 0.09
May (2nd fortnight)
2017 21.50 25.50 23.69 0.32 1.26 0.05 -0.92 -0.40 2018 22.00 26.00 24.44 0.35 1.40 0.06 -1.04 -0.54 2019 21.00 24.00 22.25 0.19 0.75 0.03 0.56 0.60 2020 21.00 27.00 24.84 0.42 1.68 0.07 0.31 -0.74
June (1st fortnight)
2017 24.00 27.50 25.27 0.32 1.22 0.05 -0.42 0.90 2018 24.00 27.50 25.63 0.22 0.85 0.03 0.60 0.31 2019 24.00 26.00 24.80 0.19 0.73 0.03 -1.19 0.50 2020 22.50 26.00 24.13 0.24 0.92 0.04 -0.12 0.19
June (2nd fortnight)
2017 22.50 26.00 24.77 0.28 1.08 0.04 -0.55 -0.61 2018 22.00 26.00 24.87 0.26 1.01 0.04 3.87 -1.81 2019 24.00 26.50 25.40 0.21 0.81 0.03 -0.84 -0.69 2020 26.00 30.50 27.33 0.28 1.10 0.04 4.57 1.71
Cumulative 2017 9.50 27.50 19.99 0.46 5.11 -0.94 -0.58 -0.48 2018 11.50 27.50 20.07 0.41 4.53 -1.20 -0.16 -0.15 2019 9.50 26.50 19.06 0.49 5.38 -1.17 -0.47 -0.82 2020 11.50 30.50 19.58 0.46 5.09 -1.24 0.23 -0.15

Fig. 3. Effect of lockdown on soil temperature
Fig. 4. Effect of lockdown on soil temperature (°C) at 20 cm
6.0
26.0
1-Mar 1-Apr 1-May
Soil Temperature at 10 cm depth in Morning (1st
March - 30th June)
2019
9.0
29.0
1-Mar 1-Apr 1-May
Soil Temperature at 20 cm depth in Morning (1st
March - 30th June)
2019
Sharma et al.; IJECC
148
soil temperature (°C) at 10 cm depth in morning and evening variation with year 2019
Fig. 4. Effect of lockdown on soil temperature (°C) at 20 cm depth in morning and evening variation with year 2019
May 1-Jun
Soil Temperature at 10 cm depth in Morning (1st
30th June)
2020
9.0
29.0
1-Mar 1-Apr 1-May
Soil Temperature at 10 cm depth in Evening (1st March - 30th June)
2019 2020
May 1-Jun
Soil Temperature at 20 cm depth in Morning (1st
30th June)
2020
9.0
29.0
1-Mar 1-Apr 1-May
Soil Temperature at 20 cm depth in Evening (1st
March - 30th June)
2019 2020
IJECC, 10(9): 133-153, 2020; Article no.IJECC.60205
(°C) at 10 cm depth in morning and evening variation with year 2019
depth in morning and evening variation with year 2019
1-Jun
Soil Temperature at 10 cm depth in Evening (1st
30th June)
2020
1-Jun
Soil Temperature at 20 cm depth in Evening (1st
30th June)
2020

Sharma et al.; IJECC, 10(9): 133-153, 2020; Article no.IJECC.60205
149
24.0 and 24.0; highest values observed were 31.0, 30.5, 29.0 and 27.5 illustrating -3.88% deviation from 2019 normal mean value. The standard deviation calculated was 0.96 in lockdown and 1.37 in 2019. During 2nd fortnight of June 2017-2019 and 2020, lowest values observed were 23.0, 21.5, 25.0 and 28.5 highest values observed were 29.0, 32.5, 31.5 and 31.5 representing 7.93% deviation from 2019 normal mean value. The standard deviation calculated was 0.74 in lockdown and 2.11 in 2019.
In cumulative analysis of 122 days, lowest values observed were 11.5, 12.0, 10.0 and 12.5; highest
values observed were 31.0, 32.5, 31.5 and 31.5 from 2017-2020. The change in soil temperature in the evening at 20cm depth in evening in lockdown was 0.3% from 2019 mean value. The standard deviation calculated was 5.60 in lockdown and 5.11 in 2019. Soil temperature is a major parameter affecting crop germination and soil biota and is directly correlated with the air temperature. In study it has been analyzed that lockdown has consistently dropped the day temperature values thereby sustainably moving soil temperature values at varying depths [8] [9].
Table 8. Descriptive coefficients of soil temperature (°C) at 20 cm depth in evening from
March – June for the year 2017-2020
Timeline Year Lowest Highest Mean S.E S.D CV (%) Kurtosis Skewness March (1st Fortnight)
2017 11.5 14 13.02 0.17 0.67 0.05 0.05 -0.69 2018 12 16 14.7 0.31 1.19 0.08 0.54 -1.06 2019 10 15 11.97 0.33 1.29 0.11 1 0.58 2020 12.5 15.5 14.13 0.23 0.9 0.06 -1.01 -0.38
March (2nd Fortnight)
2017 11.5 22.5 17.12 0.71 2.85 0.17 0.14 -0.02 2018 16 21 18.44 0.39 1.57 0.09 -1.59 0.16 2019 13 20 15.44 0.54 2.17 0.14 -0.52 0.65 2020 15 18.5 16.69 0.27 1.06 0.06 -1.12 0.25
April (1st Fortnight)
2017 16.5 20.5 18.36 0.35 1.35 0.07 -1.25 -0.02 2018 20 22.5 21 0.2 0.76 0.04 -0.57 0.29 2019 20.5 25.5 23.43 0.39 1.5 0.06 -0.35 -0.7 2020 17.5 23 21 0.4 1.55 0.07 1.21 -1.32
April (2nd Fortnight)
2017 21 25 22.67 0.27 1.05 0.05 0.41 0.57 2018 17.5 26 21.53 0.68 2.63 0.12 -1.03 0.25 2019 19 27 23.4 0.58 2.25 0.1 -0.05 -0.62 2020 19 23.5 21.79 0.4 1.55 0.07 -1.24 -0.67
May (1st fortnight)
2017 21 28.5 25.5 0.67 2.59 0.1 -1.06 -0.7 2018 20 24.5 22.43 0.31 1.21 0.05 -0.12 -0.24 2019 22.5 27.5 25.03 0.43 1.65 0.07 -1.42 -0.01 2020 20.5 25 23.63 0.31 1.2 0.05 1.98 -1.25
May (2nd fortnight)
2017 23.5 28 25.66 0.38 1.52 0.06 -0.93 0.13 2018 23.5 29 27.44 0.42 1.66 0.06 0.49 -1.11 2019 22 27.5 25.03 0.37 1.5 0.06 -0.21 -0.24 2020 24 28.5 26.03 0.32 1.28 0.05 -0.6 0.38
June (1st fortnight)
2017 24.5 31 27.27 0.49 1.88 0.07 -0.18 0.27 2018 23 30.5 27.63 0.56 2.15 0.08 0.09 -0.76 2019 24 29 26.73 0.35 1.37 0.05 -0.08 -0.54 2020 24 27.5 25.73 0.25 0.96 0.04 0.32 0.34
June (2nd fortnight)
2017 23 29 26.5 0.44 1.7 0.06 -0.5 -0.28 2018 21.5 32.5 27.37 0.6 2.34 0.09 3.39 -0.53 2019 25 31.5 28.2 0.55 2.11 0.07 -1.38 0.08 2020 28.5 31.5 30.63 0.19 0.74 0.02 4.25 -1.73
Cumulative 2017 11.5 31 22 0.47 5.22 0.24 -0.97 -0.48 2018 12 32.5 22.57 0.43 4.75 0.21 -0.9 -0.15 2019 10 31.5 22.37 0.51 5.6 0.25 -0.51 -0.82 2020 12.5 31.5 22.44 0.46 5.11 0.23 -0.83 -0.15

Sharma et al.; IJECC, 10(9): 133-153, 2020; Article no.IJECC.60205
150
3.2 Effect on Moisture 3.2.1 Rainfall As the lockdown began, sustainable pattern was observed (Fig. 5) from 1
st fortnight of March upto
2nd fortnight of June as compared to 2017-2020 and normal (Table 9). During 1st fortnight of March 2017-2020 and normal, lowest values observed were 0.0, 0.0, 0.0, 0.0 and 0.7; highest values observed were 13.8, 6.8, 22.6, 32.8 and 5.3. So, in 2020, the significant impact of lockdown was observed in 1
st fortnight of March
as rainfall was 65.68% than normal mean value. The standard deviation calculated was 11.4 in lockdown and 1.72 in normal. During 2
nd fortnight
of March 2017-2020 and normal, lowest values observed were 0.0, 0.0, 0.0, 0.0 and 0.0, highest values noted were 0.0, 1.4, 26.4, 40.8 and 9.2 thereby significantly expressing 44.87% change in rainfall from normal. The standard deviation calculated was 11.38 in lockdown and 2.20 in normal. Again, in 1
st fortnight of April 2017-2020
and normal, the lowest and highest values noted were 0.0, 0.0, 0.0, 0.0 and 0.4 whereas highest values observed were 55.6, 15.8, 3.4, 4.2 and 6.9 significantly depicting -242.37% variation from normal mean rainfall value. The standard deviation calculated was 1.28 in lockdown and 1.67 in normal. Following data collection in 2nd
fortnight of April 2017-2020 and normal, lowest values were 0.0, 0.0, 0.0, 0.0 and 0.0 and highest values were 15.2, 15.4, 17.2, 10.2 and 3.4 illustrating -10.21% significant change from normal mean value. The standard deviation calculated was 3.10 in lockdown and 1.18 in normal. During 1st fortnight of May 2017-2020 and normal, lowest values observed were 0.0, 0.0, 0.0, 0.0 and 0.1 highest values observed were 8.0, 12.4, 16.8, 5.2 and 4.0 representing 3.41% deviation from normal mean value. The
standard deviation calculated was 1.71 in lockdown and 1.01 in normal. During 2nd fortnight of May 2017-2020 and normal, lowest values observed were 0.0, 0.0, 0.0, 0.0 and 0.1 highest values observed were 8.0, 0.0, 8.4, 7.4 and 3.9 representing -91.80% deviation from normal mean value. The standard deviation calculated was 1.91 in lockdown and 1.01 in normal. During 1
st fortnight of June 2017-2020 and normal,
lowest values observed were 0.0, 0.0, 0.0, 0.0 and 0.5 highest values observed were 20.0, 38.8, 25.2, 16.8 and 4.2 illustrating -123.24% deviation from normal mean value. The standard deviation calculated was 4.46 in lockdown and 1.17 in normal. During 2nd fortnight of June 2017-2020 and normal, lowest values observed were 0.0, 0.0, 0.0, 0.0 and 1.7 highest values observed were 39.8, 44.6, 4.2, 32.8 and 8.1 representing -35.73% deviation from normal mean value. The standard deviation calculated was 8.48 in lockdown and 2.06 in normal. In cumulative analysis of 122 days data for rainfall, lowest values observed in all years was 0.0 in 2017-2020 and normal and highest values noted were 55.6, 44.6, 26.4, 44.8 and 9.25. The change in rainfall in lockdown was 19.27% from normal mean value as significant change was observed. The standard deviation calculated was 7.09 in lockdown and 1.81 in normal. The reasons for increase in rainfall can be explained by sulphate aerosols accumulation which might help in cloud formation by acting as cloud condensation nuclei (CCN) which could lead to the formation of enormous cumulonimbus clouds and effectively cause heavy thunderstorm events [1]. Also, it has been studied already that the drop in pollution levels can have a direct positive impact on rainfall pattern [10,11].
Fig. 5. Effect of lockdown on rainfall (mm) variation with normal
0.0
50.0
1-Mar 1-Apr 1-May 1-Jun
Rainfall (1st March - 30 June)
2020 Normal

Sharma et al.; IJECC, 10(9): 133-153, 2020; Article no.IJECC.60205
151
Table 9. Descriptive coefficients of rainfall (mm) from March – June for the year 2017-2020 and normal
Timeline Year Lowest Highest Mean S.E S.D CV (%) Kurtosis Skewness
March (1st Fortnight)
2017 0.00 13.80 2.19 1.03 3.97 1.82 4.76 2.15
2018 0.00 6.80 0.61 0.47 1.82 2.97 11.03 3.28
2019 0.00 22.60 4.39 2.07 8.00 1.82 1.83 1.75
2020 0.00 32.80 8.48 2.95 11.41 1.35 0.31 1.19
Normal 0.73 5.26 2.91 0.44 1.72 0.59 -1.64 0.19
March (2nd Fortnight)
2017 0.00 0.00 0.00 0.00 0.00 0.00 0.00 0.00
2018 0.00 1.40 0.09 0.09 0.35 4.00 16.00 4.00
2019 0.00 26.40 2.00 1.66 6.65 3.33 14.32 3.74
2020 0.00 40.80 4.88 2.84 11.38 2.33 6.79 2.62
Normal 0.00 9.25 2.69 0.55 2.20 0.82 4.68 1.83
April (1st Fortnight)
2017 0.00 55.60 4.80 3.70 14.34 2.99 13.54 3.63
2018 0.00 15.80 1.87 1.16 4.48 2.40 7.03 2.65
2019 0.00 3.40 0.35 0.25 0.96 2.78 7.91 2.86
2020 0.00 4.20 0.59 0.33 1.28 2.19 3.89 2.14
Normal 0.39 6.89 2.02 0.43 1.67 0.83 4.64 1.87
April (2nd Fortnight)
2017 0.00 15.20 1.37 1.03 3.97 2.89 12.43 3.46
2018 0.00 15.40 1.51 1.05 4.05 2.69 11.48 3.30
2019 0.00 17.00 2.17 1.31 5.06 2.33 5.58 2.50
2020 0.00 10.20 1.37 0.80 3.10 2.26 4.51 2.28
Normal 0.00 3.45 1.51 0.30 1.18 0.78 -0.72 0.65
May (1st fortnight)
2017 0.00 8.00 0.67 0.54 2.09 3.14 12.82 3.53
2018 0.00 12.40 1.39 0.88 3.42 2.47 8.29 2.84
2019 0.00 16.80 1.48 1.15 4.46 3.01 11.61 3.36
2020 0.00 5.20 1.17 0.44 1.71 1.46 0.62 1.28
Normal 0.11 3.99 1.13 0.30 1.15 1.02 1.88 1.56
May (2nd fortnight)
2017 0.00 8.00 1.55 0.64 2.55 1.64 1.91 1.67
2018 0.00 0.00 0.00 0.00 0.00 0.00 0.00 0.00
2019 0.00 8.40 1.14 0.64 2.57 2.26 3.83 2.17
2020 0.00 7.40 0.61 0.48 1.91 3.11 12.39 3.47
Normal 0.07 3.89 1.17 0.25 1.01 0.86 2.48 1.45
June (1st fortnight)
2017 0.00 20.00 3.51 1.67 6.47 1.84 1.90 1.70
2018 0.00 38.80 2.95 2.59 10.02 3.40 14.29 3.75
2019 0.00 25.20 3.13 1.81 7.00 2.23 7.33 2.65
2020 0.00 16.80 1.85 1.15 4.46 2.41 10.20 3.12
Normal 0.53 4.17 2.28 0.30 1.17 0.51 -1.09 0.16
June (2nd fortnight)
2017 0.00 39.80 5.07 2.83 10.97 2.16 7.60 2.69
2018 0.00 44.60 6.08 3.05 11.83 1.94 8.79 2.85
2019 0.00 4.20 0.44 0.29 1.12 2.56 10.07 3.09
2020 0.00 32.80 3.05 2.19 8.48 2.78 12.87 3.52
Normal 1.72 8.13 4.14 0.53 2.06 0.50 -0.55 0.65
Cumulative 2017 0.00 55.60 2.37 0.64 7.12 3.01 31.61 2.15
2018 0.00 44.60 1.78 0.55 6.10 3.42 30.84 3.28
2019 0.00 26.40 1.88 0.47 5.15 2.74 10.88 1.75
2020 0.00 40.80 2.75 0.64 7.09 2.58 12.71 1.19
Normal 0.00 9.25 2.22 0.16 1.81 0.81 2.06 0.19
Sharma et al.; IJECC, 10(9): 133-153, 2020; Article no.IJECC.60205
152
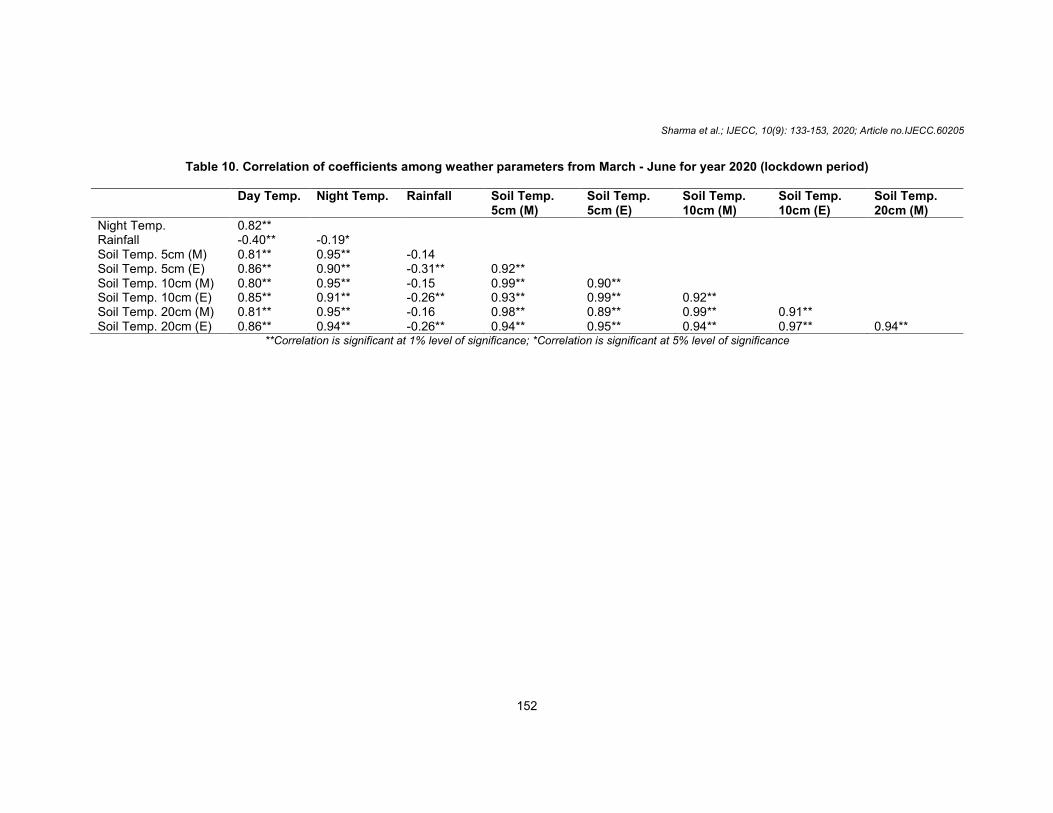
Table 10. Correlation of coefficients among weather parameters from March - June for year 2020 (lockdown period)
Day Temp. Night Temp. Rainfall Soil Temp. 5cm (M)
Soil Temp. 5cm (E)
Soil Temp. 10cm (M)
Soil Temp. 10cm (E)
Soil Temp. 20cm (M)
Night Temp. 0.82** Rainfall -0.40** -0.19* Soil Temp. 5cm (M) 0.81** 0.95** -0.14 Soil Temp. 5cm (E) 0.86** 0.90** -0.31** 0.92** Soil Temp. 10cm (M) 0.80** 0.95** -0.15 0.99** 0.90** Soil Temp. 10cm (E) 0.85** 0.91** -0.26** 0.93** 0.99** 0.92** Soil Temp. 20cm (M) 0.81** 0.95** -0.16 0.98** 0.89** 0.99** 0.91** Soil Temp. 20cm (E) 0.86** 0.94** -0.26** 0.94** 0.95** 0.94** 0.97** 0.94**
**Correlation is significant at 1% level of significance; *Correlation is significant at 5% level of significance

Sharma et al.; IJECC, 10(9): 133-153, 2020; Article no.IJECC.60205
153
Along with descriptive statistics, Pearson’s correlation coefficient was analyzed during lockdown period (March – June, 2020) in order to find impact of one weather parameter over another in fortnightly interval (Table 10).
4. CONCLUSION Increase in anthropogenic activities has led to greater emissions and dynamic trend towards increase in CO2 and GHG (Greenhouse Gases). Although several worldwide appeals have been made to reduce emissions and protocols which have been framed to limit pollution, humans have failed to curb the major problem of climate change. In hilly regions, where ecosystem degradation is on rise, lockdown may emerge as a solution to reduce the pace of disastrous change. In the initial phase of strict lockdown, very significant observations has been noted leading to positive change in day temperature pattern, sustainability in night temperature, increase in rainfall illustrating a promising effect of lockdown amid COVID-19 pandemic. Therefore, implementing lockdown in phases can be a solution to reduce or curb the pace of climate change.
COMPETING INTERESTS Authors have declared that no competing interests exist.
REFERENCES
1. Balasubramanian S. As Emissions Reduce Due to Lockdown, What’s in Store for Weather Patterns Across India; 2020. Available:www.weather.com/en-IN
2. Kallos G, Kassomensos P, Pielke RA. Synoptic and mesoscale weather conditions during air pollution episodes in Athens. Greece. 1993;62:163.
3. Yen MC, Peng CM, Chen TC, Chen CS, Lin NH, Tzeng RY, Lee YA, Lin CC.
Climate and weather characteristics in association with the active fires in northern Southeast Asia and spring air pollution in Taiwan during 2010 7-SEAS/Dongsha experiment. Atmos. Environ. 2013;78:35–50. DOI: 10.1016/j.atmosenv.2012.11.015
4. Goswami S. Climate change impact on agriculture leads to 1.5 per cent loss in India’s GDP; 2017.
Available:www.downtoearth.org.in
5. SIAM, Vehicle Sales and Projections. Society of Indian Automobile Manufacturing, Government of India, New Delhi, India; 2013.
6. Amann M, Purohit P, Bhanarkar AD, Bertok I, Borken-Kleefeld J, Cofala J, Heyes C, Kiesewetter G, Klimont Z, Liu J, Majumdar D. Managing future air quality in megacities: A case study for Delhi. Atmos. Environ. 2017;161:99–111.
7. WHO, Coronavirus disease 2019 (COVID-19) Situation Report–63; 2020.
Available:https://www.who.int/docs/default-source/coronaviruse/situation-reports/20200323-sitrep-63-covid-19.pdf?sfvrsn=b617302d_4
8. Bhatt RP. Climate change assessment, impacts of global warming, projections and mitigation of GHG emissions endorsing green energy. 2018;4(1):33-48.
9. Gobel L, Heinz C, Dietrich H, Sandra W, Christoph L. The role of low soil temperature for photosynthesis and stomatal conductance of three graminoids from different elevations. Frontiers in Plant Science. 2019;10:330.
10. Rosenfeld D. Suppression of rain and snow by urban and industrial air pollution. Science. 2000;287:1793.
11. Gavati A, Rosenfeld D. Quantifying precipitation suppression due to air pollution. Journal of Applied Meteorology. 2004;43:1038-1056.
© 2020 Sharma et al.; This is an Open Access article distributed under the terms of the Creative Commons Attribution License (http://creativecommons.org/licenses/by/4.0), which permits unrestricted use, distribution, and reproduction in any medium, provided the original work is properly cited.
Peer-review history: The peer review history for this paper can be accessed here:
http://www.sdiarticle4.com/review-history/60205