anantrajinds angel 090211
TRANSCRIPT

8/6/2019 AnantRajInds Angel 090211
http://slidepdf.com/reader/full/anantrajinds-angel-090211 1/11
Please refer to important disclosures at the end of this report 1
Y/E March (` cr) 3QFY11 2QFY11 % (qoq) 3QFY10 % (yoy)
Net sales 124 133 (6.4) 83 50.5
EBITDA 77 63 23.1 76 1.1
OPM (%) 62.1 47.2 1,485bp 92.4 (3,037)bp
PAT 50 48 4.6 67 (25.1)
Source: Company, Angel Research
Anant Raj’s (ARIL) 3QFY2011 results were broadly in line with our expectations.
The top line was driven by mid-income residential projects. PAT stood at ` 50cr
(up 4.6% qoq). ARIL continues to focus on mid-income residential projects and
intends to launch another 3mn sq. ft. in 4QFY2011. However, we have lowered
our FY2012 estimates by 37% to factor in the delay in the launch of its super
premium residential Hauz Khas project. The promoters have not converted
warrants (20mn) citing that it would have led to dilution of >5%, thereby
triggering an open offer. ARIL’s net debt-equity stands at 0.2x, which is the lowest
amongst peers. We maintain Buy on the stock.
Revenue driven by new residential launches: ARIL had launched two residential
projects in the NCR in 1HFY2011–Kapashera (0.28mn sq. ft.) and Manesar (1mn
sq. ft.) at ` 5,000/sq. ft. and ` 3,300/sq. ft., respectively. During the quarter, ARIL
booked combined revenue of ` 102cr from Kapashera ( ` 6.4cr) and Manesar
( ` 94.5cr). Historically, ARIL’s revenue has been driven by land/FSI sale and rental
income, where it booked revenue on net sales basis (which excludes land cost).Consequently, OPM has been at 85–95%, as it includes only employee and
administrative expenses. In 1QFY2011, ARIL had changed its accounting method
from net sales to gross sales, where expenses include land and construction cost.
Thus, OPM came in at 62.1% (down 3,037bp yoy and up 1,485bp qoq). We
expect OPM to remain at these levels with increasing share of residential projects.
Outlook and valuation: ARIL’s near-term revenue visibility is set to be driven by
mid-income residential projects; and with the commercial segment gaining
traction, rental income is set to improve. The launch of the Hauz Khas project will
be a key catalyst for the stock’s performance, which has got delayed by over a
year. We maintain our Buy rating on the stock with a revised Target Price of ` 145
( ` 178), which is at 25% discount to our one-year forward NAV.
Key financials (Consolidated)
Y/E March (` cr) FY2009 FY2010 FY2011E FY2012E
Net sales 251 286 500 697
% chg (58.5) 14.2 74.8 39.4
Net profit 207 238 196 250
% chg (52.5) 14.9 (17.6) 27.2
EBITDA (%) 88.0 90.3 55.4 65.6
EPS (`) 7.0 8.1 6.7 8.5
P/E (x) 14.3 12.5 15.1 11.9
P/BV (x) 0.9 0.8 0.8 0.7
RoE (%) 6.7 6.9 5.3 6.4RoCE (%) 6.5 6.7 6.1 8.5
EV/Sales (x) 10.2 9.1 5.8 5.3
EV/EBITDA (x) 11.6 10.1 10.5 8.1
Source: Company, Angel Research
BUY CMP ` 101
Target Price ` 145
Investment Period 12 Months
Stock Info
Sector
Bloomberg Code
Shareholding Pattern (%)
Promoters 61.4
MF / Banks / Indian Fls 8.7
FII / NRIs / OCBs 25.6
Indian Public / Others 4.3
Abs. (%) 3m 1yr 3yr
Sensex (13.5) 13.2 3.3
ARIL (25.7) (23.4) (71.3)
2
17,776
5,313
ANRA.BO
ARCP@IN
2,967
1.0
160/94
204,997
Real Estate
Avg. Daily Volume
Market Cap ( ` cr)
Beta
52 Week High / Low
Face Value ( ` )
BSE Sensex
Nifty
Reuters Code
Param Desai
022 – 3935 7800 Ext: 6823
Mihir Salot
022 – 3935 7800 Ext: 6843
Anant Raj Industries
Performance Highlights
3QFY2011 Result Update | Real Estate
February 8, 2011
8/6/2019 AnantRajInds Angel 090211
http://slidepdf.com/reader/full/anantrajinds-angel-090211 2/11
Anant Raj Industries |3QFY2011 Result Update
February 8, 2011 2
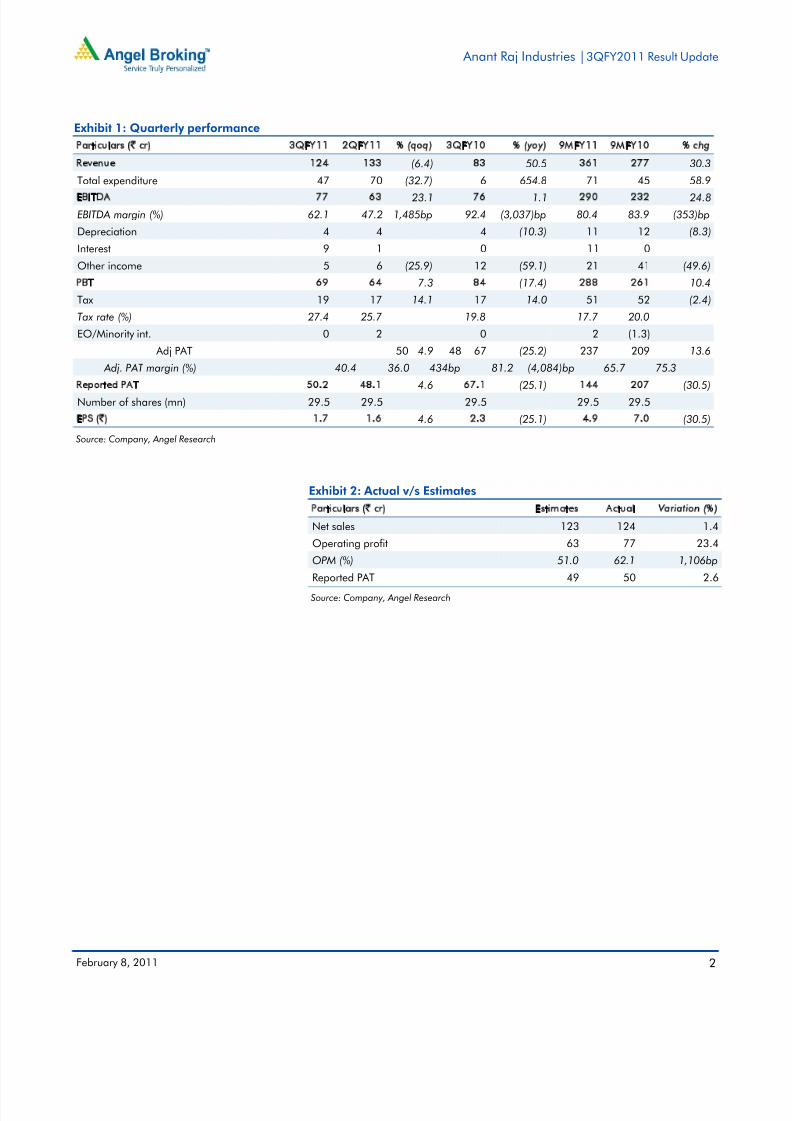
Exhibit 1: Quarterly performance
Particulars (` cr) 3QFY11 2QFY11 % (qoq) 3QFY10 % (yoy) 9MFY11 9MFY10 % chg
Revenue 124 133 (6.4) 83 50.5 361 277 30.3
Total expenditure 47 70 (32.7) 6 654.8 71 45 58.9
EBITDA 77 63 23.1 76 1.1 290 232 24.8
EBITDA margin (%) 62.1 47.2 1,485bp 92.4 (3,037)bp 80.4 83.9 (353)bp
Depreciation 4 4 4 (10.3) 11 12 (8.3)
Interest 9 1 0 11 0
Other income 5 6 (25.9) 12 (59.1) 21 41 (49.6)
PBT 69 64 7.3 84 (17.4) 288 261 10.4
Tax 19 17 14.1 17 14.0 51 52 (2.4)
Tax rate (%) 27.4 25.7 19.8 17.7 20.0
EO/Minority int. 0 2 0 2 (1.3)
Adj PAT 50 48 4.9 67 (25.2) 237 209 13.6 Adj. PAT margin (%) 40.4 36.0 434bp 81.2 (4,084)bp 65.7 75.3
Reported PAT 50.2 48.1 4.6 67.1 (25.1) 144 207 (30.5)
Number of shares (mn) 29.5 29.5 29.5 29.5 29.5
EPS (`) 1.7 1.6 4.6 2.3 (25.1) 4.9 7.0 (30.5)
Source: Company, Angel Research
Exhibit 2: Actual v/s Estimates
Particulars (` cr) Estimates Actual Variation (%)
Net sales 123 124 1.4Operating profit 63 77 23.4
OPM (%) 51.0 62.1 1,106bp
Reported PAT 49 50 2.6
Source: Company, Angel Research
8/6/2019 AnantRajInds Angel 090211
http://slidepdf.com/reader/full/anantrajinds-angel-090211 3/11
Anant Raj Industries |3QFY2011 Result Update
February 8, 2011 3
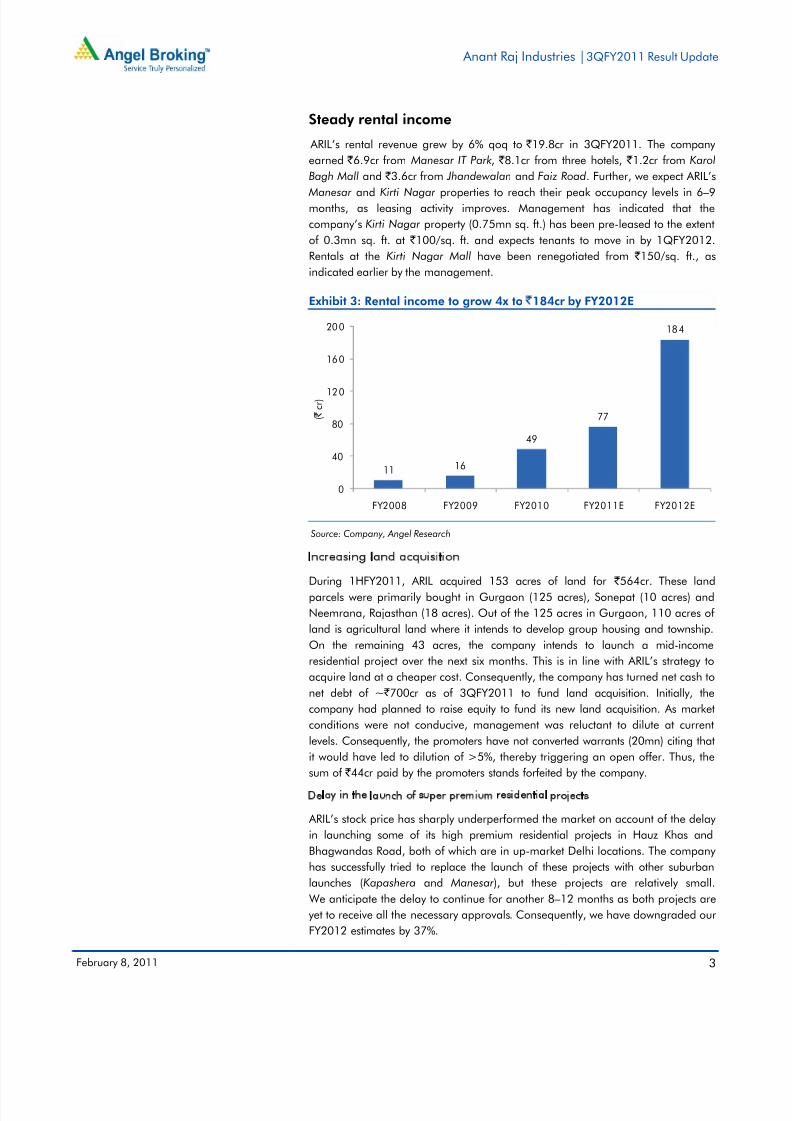
Steady rental income
ARIL’s rental revenue grew by 6% qoq to ` 19.8cr in 3QFY2011. The company
earned ` 6.9cr from Manesar IT Park , ` 8.1cr from three hotels, ` 1.2cr from Karol
Bagh Mall and ` 3.6cr from Jhandewalan and Faiz Road. Further, we expect ARIL’s Manesar and Kirti Nagar properties to reach their peak occupancy levels in 6–9
months, as leasing activity improves. Management has indicated that the
company’s Kirti Nagar property (0.75mn sq. ft.) has been pre-leased to the extent
of 0.3mn sq. ft. at ` 100/sq. ft. and expects tenants to move in by 1QFY2012.
Rentals at the Kirti Nagar Mall have been renegotiated from ` 150/sq. ft., as
indicated earlier by the management.
Exhibit 3: Rental income to grow 4x to `184cr by FY2012E
Source: Company, Angel Research
Increasing land acquisition
During 1HFY2011, ARIL acquired 153 acres of land for ` 564cr. These land
parcels were primarily bought in Gurgaon (125 acres), Sonepat (10 acres) and
Neemrana, Rajasthan (18 acres). Out of the 125 acres in Gurgaon, 110 acres of
land is agricultural land where it intends to develop group housing and township.
On the remaining 43 acres, the company intends to launch a mid-income
residential project over the next six months. This is in line with ARIL’s strategy to
acquire land at a cheaper cost. Consequently, the company has turned net cash to
net debt of ~ ` 700cr as of 3QFY2011 to fund land acquisition. Initially, the
company had planned to raise equity to fund its new land acquisition. As market
conditions were not conducive, management was reluctant to dilute at current
levels. Consequently, the promoters have not converted warrants (20mn) citing that
it would have led to dilution of >5%, thereby triggering an open offer. Thus, the
sum of ` 44cr paid by the promoters stands forfeited by the company.
Delay in the launch of super premium residential projects
ARIL’s stock price has sharply underperformed the market on account of the delay
in launching some of its high premium residential projects in Hauz Khas and
Bhagwandas Road, both of which are in up-market Delhi locations. The company
has successfully tried to replace the launch of these projects with other suburban
launches (Kapashera and Manesar), but these projects are relatively small.
We anticipate the delay to continue for another 8–12 months as both projects are
yet to receive all the necessary approvals. Consequently, we have downgraded our
FY2012 estimates by 37%.
11 16
49
77
184
0
40
80
120
160
200
FY2008 FY2009 FY2010 FY2011E FY2012E
( `
c r )

8/6/2019 AnantRajInds Angel 090211
http://slidepdf.com/reader/full/anantrajinds-angel-090211 4/11
Anant Raj Industries |3QFY2011 Result Update
February 8, 2011 4
Exhibit 4: Quarterly revenue trend
Source: Company, Angel Research
Exhibit 5: Quarterly EBITDA trend
Source: Company, Angel Research
Exhibit 6: Quarterly profitability trend
Source: Company, Angel Research
Exhibit 7: Peer valuation
Company Reco. Mcap CMP TP Upside P/E (x) P/B (x) NAV Prem/(Disc) EV/EBITDA (x) RoE (%) CAGR #
(` cr) (`) (`) (%) FY11E FY12E FY11E FY12E to NAV FY11E FY12E FY11E FY12E Sales PAT
Anant Raj Buy 2,967 101 145 43.6 15.1 11.9 0.8 0.7 193 (47.7) 10.5 8.1 5.3 6.4 71.8 2.4
DLF Neutral 40,618 239 - - 22.1 17.1 1.3 1.2 261 (8.4) 13.8 11.2 5.9 7.2 31.6 19.2
HDIL Buy 5,717 138 243 76.4 6.3 4.4 0.6 0.5 347 (60.3) 7.9 5.1 11 12.9 52 63.6 Source: Company, Angel Research; Note: # CAGR over FY2010-12E
17.0
159.2
(1.5)
48.9 50.5
(20)
0
20
40
60
80
100
120
140
160
180
0
20
40
60
80
100
120
140
3QFY10 4QFY10 1QFY11 2QFY11 3QFY11
( % )
( `
c r )
Revenue (LHS) yoy change (RHS)
92.4
76.9
55.0
47.2
62.1
0
10
20
30
40
50
60
70
80
90
100
0
10
20
30
40
50
60
70
80
90
3QFY10 4QFY10 1QFY11 2QFY11 3QFY11
( % )
( `
c r )
EBITDA (LHS) EBITDA Margin (RHS)
1.4
415.3
(33.5) (32.6) (25.1)
(100)
(50)
0
50
100
150
200
250
300
350
400
450
0
10
20
30
40
50
60
70
80
3QFY10 4QFY10 1QFY11 2QFY11 3QFY11
( % )
( `
c r )
PAT (LHS) yoy change (RHS)
8/6/2019 AnantRajInds Angel 090211
http://slidepdf.com/reader/full/anantrajinds-angel-090211 5/11
Anant Raj Industries |3QFY2011 Result Update
February 8, 2011 5
Investment arguments
Land acquisition at discounted price
Almost all of ARIL's land bank (1,000 acres) is exclusively located in the NCR,within 50km of Delhi, with approximately 525 acres in Delhi. This land bank has
been acquired at an historical average cost of ` 300/sq. ft., with recent transactions
by ARIL executed at ` 370/sq. ft., ` 450/sq. ft. and ` 130/sq. ft. in high-growth
areas such as Gurgaon, Manesar and Sonepat, respectively. ARIL's successful land
acquisition strategy is attributed to its acquisition through the allocation route from
DDA at significantly low prices compared to the prevailing rates and its focus on
being an NCR player, which helps in identifying areas with high economic
potential in Delhi.
Residential projects to drive near-term visibility
ARIL recently launched two residential projects in NCR–Kapashera (0.28mn sq. ft.)
and Manesar (1mn sq. ft.) for ` 5,000/sq. ft. and ` 3,300/sq. ft., respectively.
Management has indicated that the entire property of Kapashera and ~50% of
Manesar property have been sold out so far. The Manesar property was acquired
at ` 450/sq. ft. in 2009. Management has guided for ` 500cr of revenue in FY2011
from the residential segment. Further, we expect ARIL’s Manesar and Kirti Nagar
properties to reach peak occupancy levels in 6–9 months as leasing activity
improves. The company will also have five hotels operational by the end of
FY2011, with transfer of occupancy risk to third party in return of fixed rentals.
Consequently, we expect ARIL to report rental income of ` 184cr in FY2012 as
compared to ` 49cr reported in FY2010.
Well-capitalised balance sheet
Post the recent land acquisitions ( ` 1,000cr), ARIL has a net debt balance of ` 700cr
(0.2x) from having net cash balance of ` 190cr in 1QFY2011, which is the lowest
amongst peers. This augurs well for the company even in a downturn and gives
headroom to leverage at reasonable costs for the timely execution of projects.
8/6/2019 AnantRajInds Angel 090211
http://slidepdf.com/reader/full/anantrajinds-angel-090211 6/11
Anant Raj Industries |3QFY2011 Result Update
February 8, 2011 6
Outlook and valuation
ARIL’s near-term revenue visibility is set to be driven by mid-income residential
projects; and with the commercial segment gaining traction, rental income is set to
improve. The launch of the Hauz Khas project will be a key catalyst for the stock’s
performance, which has got delayed by over a year. We maintain our Buy rating
on the stock with a revised Target Price of ` 145 ( ` 178), which is at 25% discount to
our one-year forward NAV.
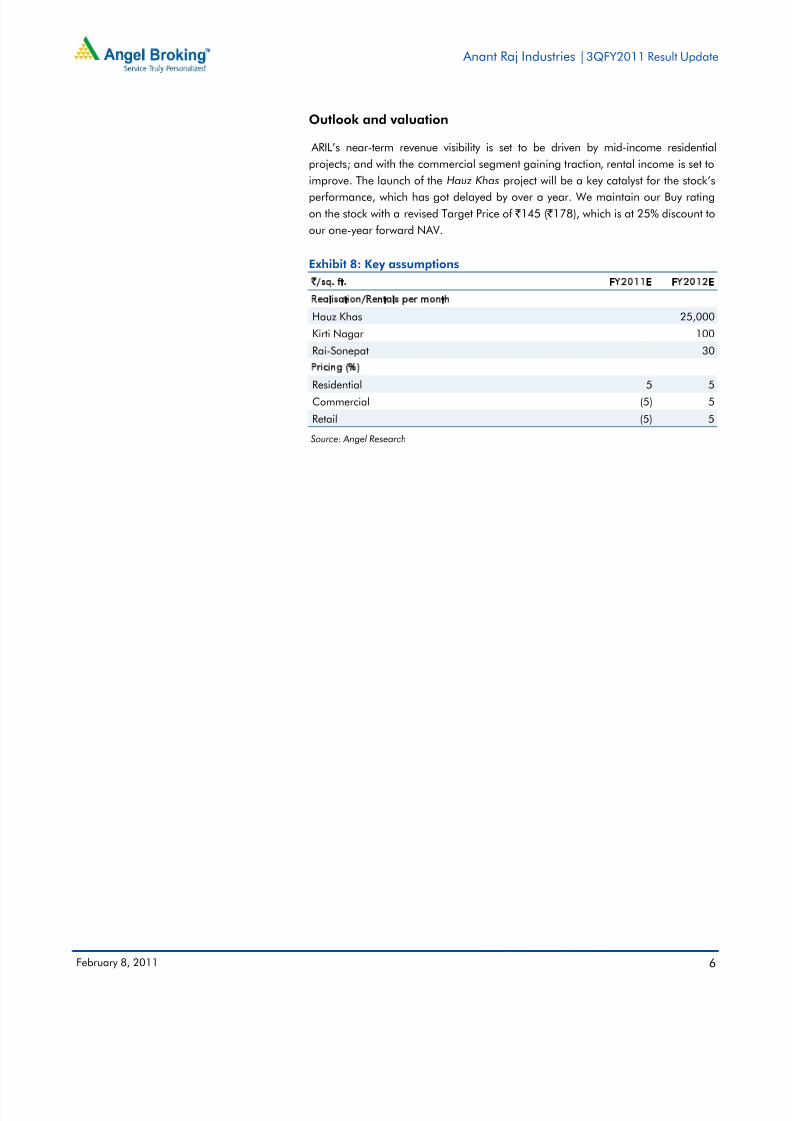
Exhibit 8: Key assumptions
`/sq. ft. FY2011E FY2012E
Realisation/Rentals per month
Hauz Khas 25,000
Kirti Nagar 100
Rai-Sonepat 30Pricing (%)
Residential 5 5
Commercial (5) 5
Retail (5) 5
Source: Angel Research
8/6/2019 AnantRajInds Angel 090211
http://slidepdf.com/reader/full/anantrajinds-angel-090211 7/11
Anant Raj Industries |3QFY2011 Result Update
February 8, 2011 7
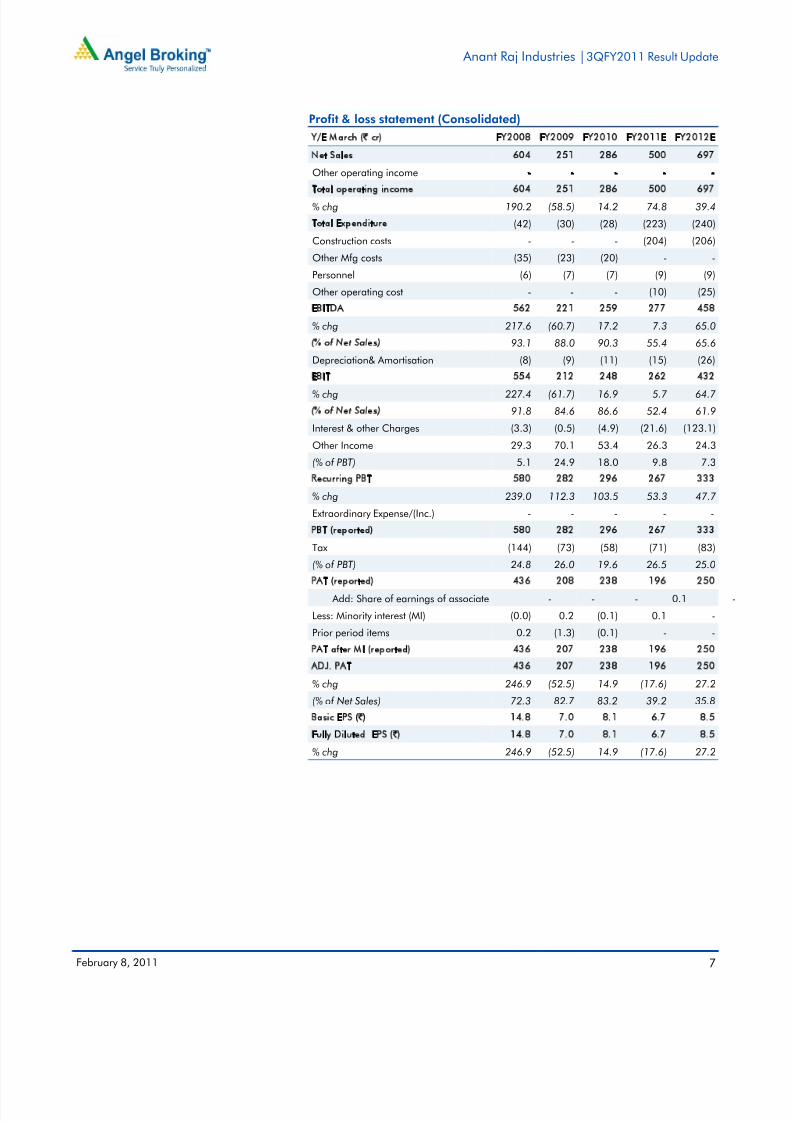
Profit & loss statement (Consolidated)
Y/E March (` cr) FY2008 FY2009 FY2010 FY2011E FY2012E
Net Sales 604 251 286 500 697
Other operating income - - - - -Total operating income 604 251 286 500 697
% chg 190.2 (58.5) 14.2 74.8 39.4
Total Expenditure (42) (30) (28) (223) (240)
Construction costs - - - (204) (206)
Other Mfg costs (35) (23) (20) - -
Personnel (6) (7) (7) (9) (9)
Other operating cost - - - (10) (25)
EBITDA 562 221 259 277 458
% chg 217.6 (60.7) 17.2 7.3 65.0
(% of Net Sales) 93.1 88.0 90.3 55.4 65.6
Depreciation& Amortisation (8) (9) (11) (15) (26)
EBIT 554 212 248 262 432
% chg 227.4 (61.7) 16.9 5.7 64.7
(% of Net Sales) 91.8 84.6 86.6 52.4 61.9
Interest & other Charges (3.3) (0.5) (4.9) (21.6) (123.1)
Other Income 29.3 70.1 53.4 26.3 24.3
(% of PBT) 5.1 24.9 18.0 9.8 7.3
Recurring PBT 580 282 296 267 333
% chg 239.0 112.3 103.5 53.3 47.7
Extraordinary Expense/(Inc.) - - - - -
PBT (reported) 580 282 296 267 333
Tax (144) (73) (58) (71) (83)
(% of PBT) 24.8 26.0 19.6 26.5 25.0
PAT (reported) 436 208 238 196 250
Add: Share of earnings of associate - - - 0.1 -
Less: Minority interest (MI) (0.0) 0.2 (0.1) 0.1 -
Prior period items 0.2 (1.3) (0.1) - -
PAT after MI (reported) 436 207 238 196 250
ADJ. PAT 436 207 238 196 250
% chg 246.9 (52.5) 14.9 (17.6) 27.2
(% of Net Sales) 72.3 82.7 83.2 39.2 35.8Basic EPS (`) 14.8 7.0 8.1 6.7 8.5
Fully Diluted EPS (̀ ) 14.8 7.0 8.1 6.7 8.5
% chg 246.9 (52.5) 14.9 (17.6) 27.2
8/6/2019 AnantRajInds Angel 090211
http://slidepdf.com/reader/full/anantrajinds-angel-090211 8/11
Anant Raj Industries |3QFY2011 Result Update
February 8, 2011 8
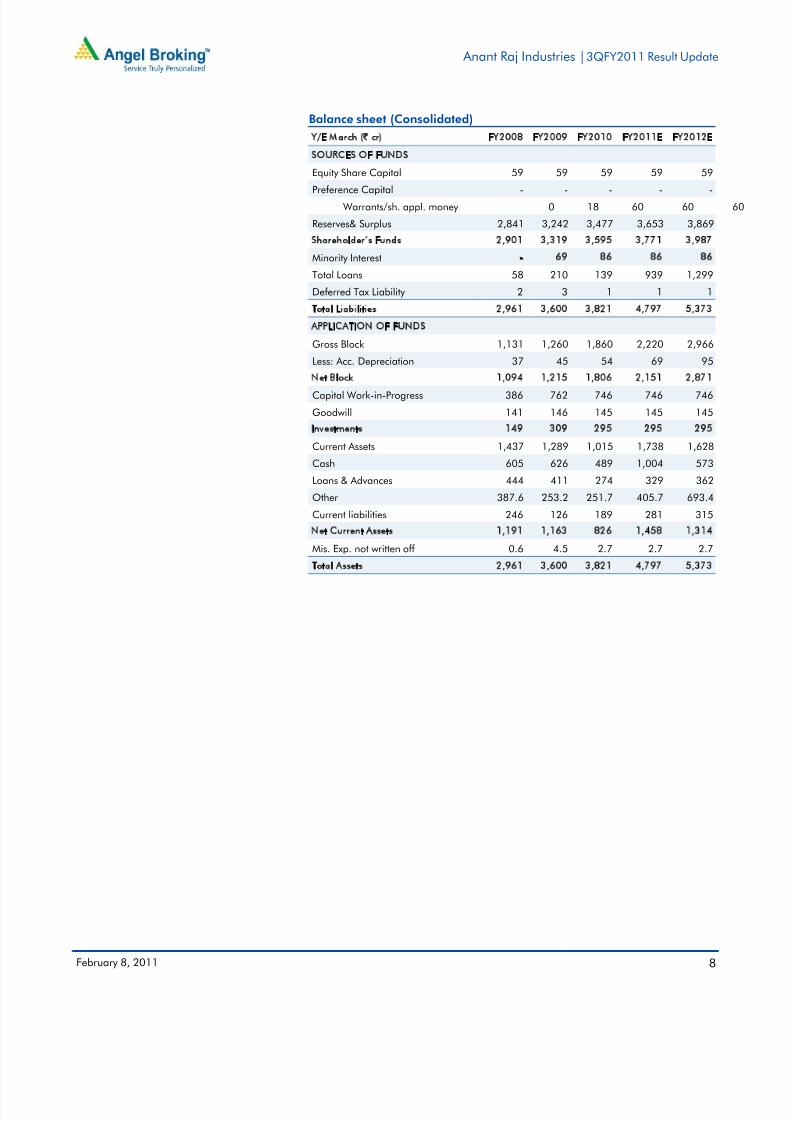
Balance sheet (Consolidated)
Y/E March (` cr) FY2008 FY2009 FY2010 FY2011E FY2012E
SOURCES OF FUNDS
Equity Share Capital 59 59 59 59 59Preference Capital - - - - -
Warrants/sh. appl. money 0 18 60 60 60
Reserves& Surplus 2,841 3,242 3,477 3,653 3,869
Shareholder’s Funds 2,901 3,319 3,595 3,771 3,987
Minority Interest - 69 86 86 86
Total Loans 58 210 139 939 1,299
Deferred Tax Liability 2 3 1 1 1
Total Liabilities 2,961 3,600 3,821 4,797 5,373
APPLICATION OF FUNDS
Gross Block 1,131 1,260 1,860 2,220 2,966
Less: Acc. Depreciation 37 45 54 69 95
Net Block 1,094 1,215 1,806 2,151 2,871
Capital Work-in-Progress 386 762 746 746 746
Goodwill 141 146 145 145 145
Investments 149 309 295 295 295
Current Assets 1,437 1,289 1,015 1,738 1,628
Cash 605 626 489 1,004 573
Loans & Advances 444 411 274 329 362
Other 387.6 253.2 251.7 405.7 693.4
Current liabilities 246 126 189 281 315
Net Current Assets 1,191 1,163 826 1,458 1,314
Mis. Exp. not written off 0.6 4.5 2.7 2.7 2.7
Total Assets 2,961 3,600 3,821 4,797 5,373
8/6/2019 AnantRajInds Angel 090211
http://slidepdf.com/reader/full/anantrajinds-angel-090211 9/11
Anant Raj Industries |3QFY2011 Result Update
February 8, 2011 9
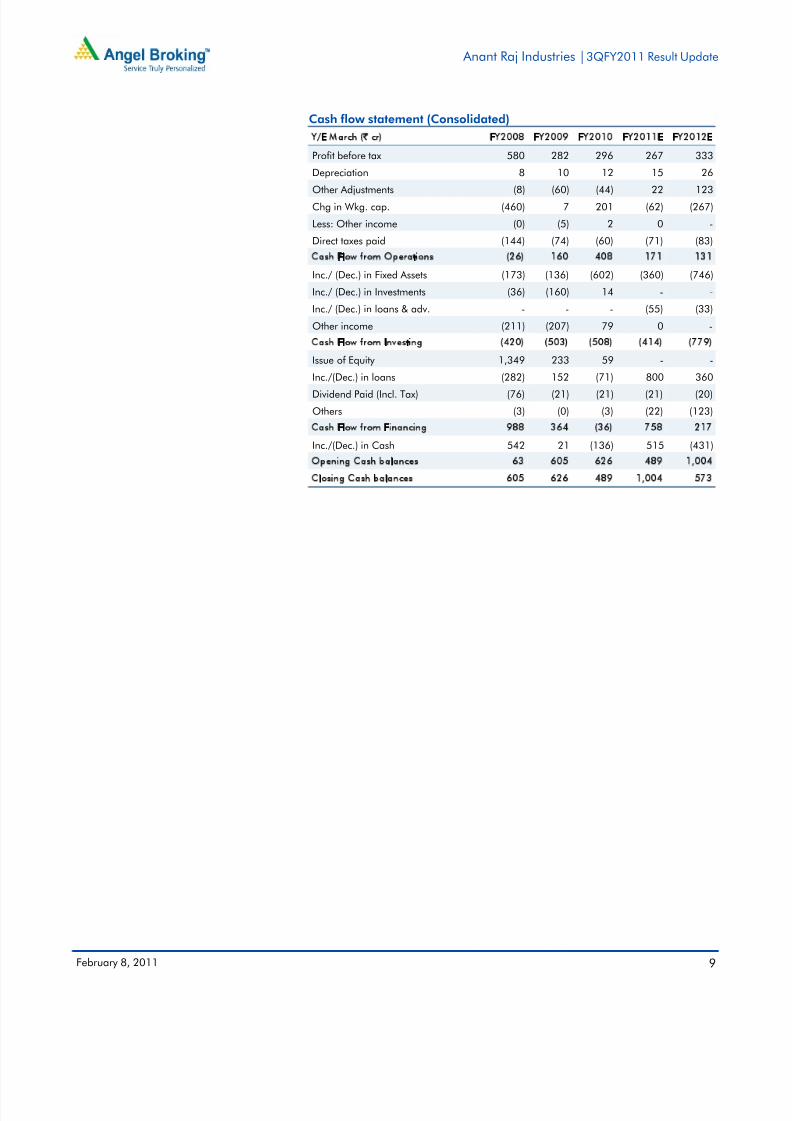
Cash flow statement (Consolidated)
Y/E March (` cr) FY2008 FY2009 FY2010 FY2011E FY2012E
Profit before tax 580 282 296 267 333
Depreciation 8 10 12 15 26Other Adjustments (8) (60) (44) 22 123
Chg in Wkg. cap. (460) 7 201 (62) (267)
Less: Other income (0) (5) 2 0 -
Direct taxes paid (144) (74) (60) (71) (83)
Cash Flow from Operations (26) 160 408 171 131
Inc./ (Dec.) in Fixed Assets (173) (136) (602) (360) (746)
Inc./ (Dec.) in Investments (36) (160) 14 - -
Inc./ (Dec.) in loans & adv. - - - (55) (33)
Other income (211) (207) 79 0 -
Cash Flow from Investing (420) (503) (508) (414) (779)
Issue of Equity 1,349 233 59 - -
Inc./(Dec.) in loans (282) 152 (71) 800 360
Dividend Paid (Incl. Tax) (76) (21) (21) (21) (20)
Others (3) (0) (3) (22) (123)
Cash Flow from Financing 988 364 (36) 758 217
Inc./(Dec.) in Cash 542 21 (136) 515 (431)
Opening Cash balances 63 605 626 489 1,004
Closing Cash balances 605 626 489 1,004 573
8/6/2019 AnantRajInds Angel 090211
http://slidepdf.com/reader/full/anantrajinds-angel-090211 10/11
Anant Raj Industries |3QFY2011 Result Update
February 8, 2011 10
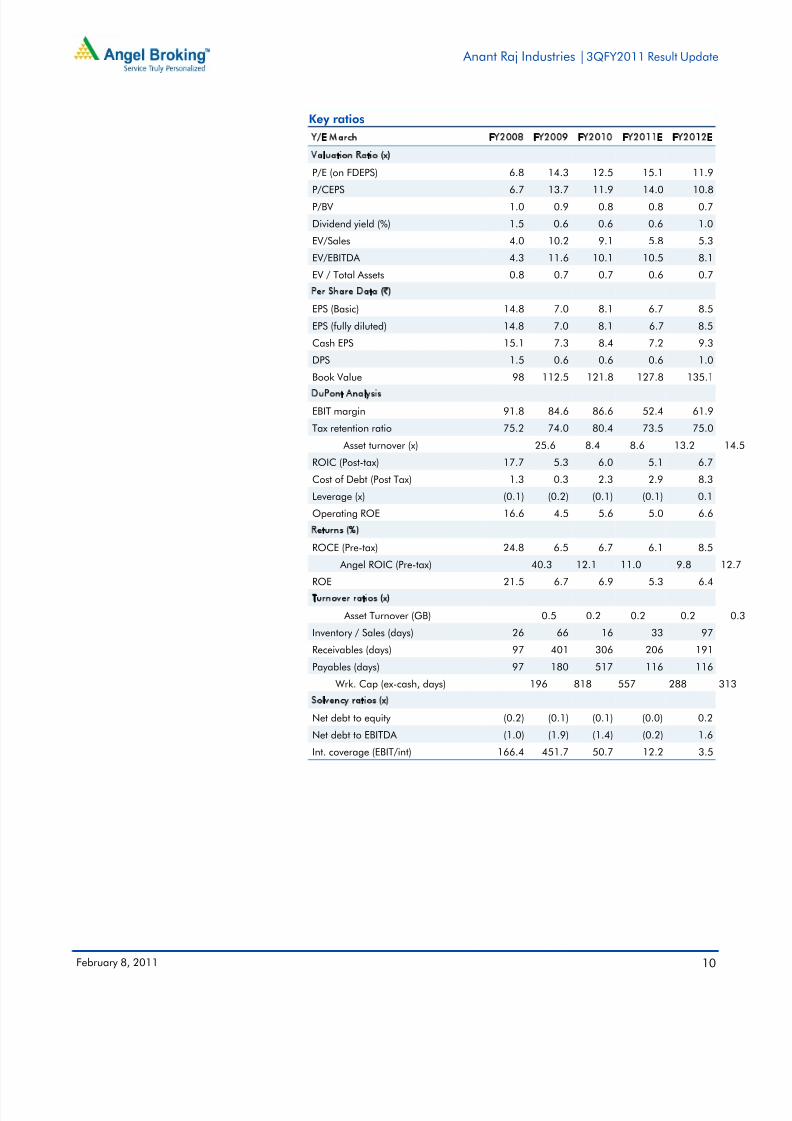
Key ratios
Y/E March FY2008 FY2009 FY2010 FY2011E FY2012E
Valuation Ratio (x)
P/E (on FDEPS) 6.8 14.3 12.5 15.1 11.9P/CEPS 6.7 13.7 11.9 14.0 10.8
P/BV 1.0 0.9 0.8 0.8 0.7
Dividend yield (%) 1.5 0.6 0.6 0.6 1.0
EV/Sales 4.0 10.2 9.1 5.8 5.3
EV/EBITDA 4.3 11.6 10.1 10.5 8.1
EV / Total Assets 0.8 0.7 0.7 0.6 0.7
Per Share Data (`)EPS (Basic) 14.8 7.0 8.1 6.7 8.5
EPS (fully diluted) 14.8 7.0 8.1 6.7 8.5
Cash EPS 15.1 7.3 8.4 7.2 9.3
DPS 1.5 0.6 0.6 0.6 1.0
Book Value 98 112.5 121.8 127.8 135.1
DuPont Analysis
EBIT margin 91.8 84.6 86.6 52.4 61.9
Tax retention ratio 75.2 74.0 80.4 73.5 75.0
Asset turnover (x) 25.6 8.4 8.6 13.2 14.5
ROIC (Post-tax) 17.7 5.3 6.0 5.1 6.7
Cost of Debt (Post Tax) 1.3 0.3 2.3 2.9 8.3
Leverage (x) (0.1) (0.2) (0.1) (0.1) 0.1
Operating ROE 16.6 4.5 5.6 5.0 6.6
Returns (%)
ROCE (Pre-tax) 24.8 6.5 6.7 6.1 8.5
Angel ROIC (Pre-tax) 40.3 12.1 11.0 9.8 12.7
ROE 21.5 6.7 6.9 5.3 6.4
Turnover ratios (x)
Asset Turnover (GB) 0.5 0.2 0.2 0.2 0.3
Inventory / Sales (days) 26 66 16 33 97
Receivables (days) 97 401 306 206 191
Payables (days) 97 180 517 116 116
Wrk. Cap (ex-cash, days) 196 818 557 288 313
Solvency ratios (x)Net debt to equity (0.2) (0.1) (0.1) (0.0) 0.2
Net debt to EBITDA (1.0) (1.9) (1.4) (0.2) 1.6
Int. coverage (EBIT/int) 166.4 451.7 50.7 12.2 3.5
8/6/2019 AnantRajInds Angel 090211
http://slidepdf.com/reader/full/anantrajinds-angel-090211 11/11
Anant Raj Industries |3QFY2011 Result Update
February 8, 2011 11
Research Team Tel: 022 - 3935 7800 E-mail: [email protected] Website: www.angelbroking.com
DISCLAIMER
This document is solely for the personal information of the recipient, and must not be singularly used as the basis of any investment
decision. Nothing in this document should be construed as investment or financial advice. Each recipient of this document should make
such investigations as they deem necessary to arrive at an independent evaluation of an investment in the securities of the companies
referred to in this document (including the merits and risks involved), and should consult their own advisors to determine the merits and
risks of such an investment.
Angel Broking Limited, its affiliates, directors, its proprietary trading and investment businesses may, from time to time, make
investment decisions that are inconsistent with or contradictory to the recommendations expressed herein. The views contained in this
document are those of the analyst, and the company may or may not subscribe to all the views expressed within.
Reports based on technical and derivative analysis center on studying charts of a stock's price movement, outstanding positions and
trading volume, as opposed to focusing on a company's fundamentals and, as such, may not match with a report on a company's
fundamentals.
The information in this document has been printed on the basis of publicly available information, internal data and other reliablesources believed to be true, but we do not represent that it is accurate or complete and it should not be relied on as such, as thisdocument is for general guidance only. Angel Broking Limited or any of its affiliates/ group companies shall not be in any way responsible for any loss or damage that may arise to any person from any inadvertent error in the information contained in this report .
Angel Broking Limited has not independently verified all the information contained within this document. Accordingly, we cannot testify,nor make any representation or warranty, express or implied, to the accuracy, contents or data contained within this document. While Angel Broking Limited endeavours to update on a reasonable basis the information discussed in this material, there may be regulatory,compliance, or other reasons that prevent us from doing so.
This document is being supplied to you solely for your information, and its contents, information or data may not be reproduced,
redistributed or passed on, directly or indirectly.
Angel Broking Limited and its affiliates may seek to provide or have engaged in providing corporate finance, investment banking orother advisory services in a merger or specific transaction to the companies referred to in this report, as on the date of this report or in
the past.
Neither Angel Broking Limited, nor its directors, employees or affiliates shall be liable for any loss or damage that may arise from or in
connection with the use of this information.
Note: Please refer to the important `Stock Holding Disclosure' report on the Angel website (Research Section). Also, pleaserefer to the latest update on respective stocks for the disclosure status in respect of those stocks. Angel Broking Limited andits affiliates may have investment positions in the stocks recommended in this report.
Disclosure of Interest Statement (Company name) Anant Raj Industries
1. Analyst ownership of the stock No
2. Angel and its Group companies ownership of the stock No
3. Angel and its Group companies' Directors ownership of the stock No
4. Broking relationship with company covered No
Note: We have not considered any Exposure below ` 1 lakh for Angel, its Group companies and Directors.
Ratings (Returns) : Buy (> 15%) Accumulate (5% to 15%) Neutral (-5 to 5%)Reduce (-5% to 15%) Sell (< -15%)