anassessmentof renewable electric generating technologies
TRANSCRIPT

An Assessment ofRenewableElectricGeneratingTechnologiesfor Florida
P R E P A R E D B Y T H E
Florida Public Service Commission and theDepartment of Environmental Protection
J A N U A R Y 2 0 0 3

Table of Contents
Executive Summary and Key Results
CHAPTER I Introduction and BackgroundProcessBackgroundCatalysts for RenewablesCost ConsiderationsEnvironmental Considerations
CHAPTER II Technology DescriptionsBiomass FuelsEnvironmental Impacts of Biomass DisposalMunicipal Solid WasteLandfill Methane GasDigester GasSolar TechnologiesHydroelectric Generation Technologies for FloridaPhosphate Plants and Exothermic ReactionsWind GenerationGeothermalOcean Thermal GenerationElectricity from Hydrogen
CHAPTER III Costs and Other Economic ConsiderationsCost Calculation and Pricing IssuesCost for Traditional TechnologiesBiomassMunicipal Solid WasteLandfill GasGeothermal EnergySolar EnergyWind EnergyHydroelectric PowerOcean EnergyWaste HeatHydrogen
1
5679
1010
13131620262930333435363738
40414142464749495151515252

CHAPTER IV Policies and Mechanisms to Promote RenewablesEducation EffortsMarket Driven ProgramsFinancial Incentive ProgramsState Policy Support MechanismsRenewable Portfolio Standards (RPS)/Set AsidesPolicy DevelopmentMetrics, Evaluation, and Economic Impacts
CHAPTER V Florida Activities with Respect to RenewablesSolar InitiativesFinancial IncentivesEducation InitiativesUtility InitiativesFlorida Power & Light CompanyProgress EnergyGulf Power CompanyTampa Electric CompanyGainesville Regional UtilitiesJacksonville Electric AuthorityCity of LakelandCity of TallahasseeUtilities Commission of New Smyrna Beach
Appendix A Listing of Florida Renewable GenerationAppendix B State Renewables Portfolio Standards and Purchase MandatesAppendix C State Financial Incentives for Revewable Energy 2002
5354545758606162
6565666668686969707070717273
747677
Table of Contents

Executive Summary and Key ResultsThe 2002 Florida Legislature directed the Florida Public Service Commission, in consulta-tion with the Florida Department of Environmental Protection, to do an assessment of re-newable energy in Florida and its potential for electric generation. The statutory languagedefined renewable energy as electricity generated from any method or process that usesone or more of the following sources of energy, but not limited to: biomass; municipal solidwaste; geothermal energy; solar energy; wind energy; wood waste; ocean thermal gradientpower; hydroelectric power; landfill gas; and agricultural products and by-products. Usingonly the specific enumerated categories of renewables, Florida has approximately 680megawatts of renewable capacity.1 However, under the “not limited to” rubric, Florida hasan additional 340 megawatts of generation capacity from phosphate manufacturers whouse waste heat to produce electricity. This results in a total net summer generating capac-ity of 1028 MWs. Discussions with the phosphate industry indicate an additional 90 MWsof capacity are off-line or being redeveloped. The vast majority of this waste heat is used toserve internal electric loads for this industry. The combined capacity of these resources(exclusive of capacity used to serve internal loads) provides about 2.4 percent of the 2002summer generating capacity of the State.
There is no nationally accepted definition of renewable resources. While almost all statestreat solar and wind as renewables, some states exclude municipal solid waste facilitiesand some types of hydroelectric. It is the purview of each state legislature to determinewhat resources constitute “renewables” within that state.
For the year 2000, the renewable resources as defined in the statute provided approximately3 percent of Florida’s net electric generation, with a minimal contribution from hydro-electricsources. By comparison, on a national level, the vast majority of renewable energy is providedby hydro-electric sources. Excluding hydro-electric energy, approximately 2 percent ofnational energy production is attributed to the remaining types of renewable generationresources.2 Florida’s renewable electric production is largely derived from municipal solidwaste (MSW), biomass materials such as agricultural waste products and wood residueswhich are used as fuel in boilers, and waste heat recovered from industrial manufacturingprocesses. Florida has some 50 MWs of hydro-electric generation in the Panhandle of thestate. There are a number of photovoltaic installations but their total generating capacity isinsignificant since most of these are only a few kilowatts in size.
1 A megawatt (MW = 1000 kilowatts) is a measure of real power at any instant in time or, in other words, ameasure of demand on the grid at any moment in time. Megawatt hours (MWhs) are a measure of the MWsdemanded aggregated over some time interval and thus represents the amount of electric energy consumed.A typical Florida house will consume about one MWh per month, but the house demand for electricity atany given moment would average about .0014 MW (1.4 kW).
2 US DOE/EIA Renewable Energy Annual 2001. Table C13, p.58. By 2001, Florida’s renewable contributionhad declined to approximately 2% of net generation.
1

Potential Incremental Capacity (MW)
Feasibility of Renewable Technologies
Renewables vary in cost and technical readiness. Florida has a number of feasible renew-able resources where feasible is defined as technologies that are deployable in the nearfuture (through 2008) and commercially mature technologies. These include, in no par-ticular order, biomass derived fuels, MSW, landfill and digester gas, hydro-electric, solarphotovoltaic, and certain industrial plants that involve the use of waste heat to cogenerateelectricity. Phosphate production is the notable example of the latter.
The following table provides a summary of some of the estimates of potential andcommercially feasible, near term, and new renewable capacity that could be developed inFlorida. These estimates were derived from information provided by stakeholders andindustry representatives, preliminary discussions by developers with permitting agencies,and some technical assessments. With respect to wood/bark fuel, it is assumed that up to4 percent co-firing of biomass with traditional fossil fuels is possible. In total, these resourcesamount to an additional 651 MW of generating capacity, bringing Florida’s renewable totalto approximately 1679 MWs.
E X E C U T I V E S U M M A R Y A N D K E Y R E S U L T SE X E C U T I V E S U M M A R Y A N D K E Y R E S U L T SE X E C U T I V E S U M M A R Y A N D K E Y R E S U L T SE X E C U T I V E S U M M A R Y A N D K E Y R E S U L T SE X E C U T I V E S U M M A R Y A N D K E Y R E S U L T S
Type of Renewable Energy
Municipal Solid Waste/Refuse Derived Fuel 60*Wood/Bark 225**Landfill Gas 32Bagasse 150Hydro-electric 43Solar Photovoltaic 1 (assumed)Waste Heat 140 to 440***
* Information provided by the Integrated Waste Services Association indicates that within a ten year period some250-300 MWs of new capacity is potentially available from expanded facilities.
** Information provided by Gus Cepero of Florida Crystals suggested that an additional 75 MWs of urban woodwaste facilities are possible and a 15,000 acre dedicated eucalyptus crop could support a 50 MW facility.
*** This estimate was provided by the Florida Industrial Cogeneration Association. The 140 MW potential existsfrom retrofitting existing plants with the latest heat recovery technology. An additional 300 MWs of potential existsfrom replacement plants as the industry migrates from current locations to other areas of phosphate rock deposits.
2
Table 1 indicates that municipal solid waste and biomass derived fuels offer the most fea-sible near term options for expanding the deployment of renewables in Florida.
With respect to future technologies, in the long term opportunities may exist for oceanconversion systems using current flows and tidal flow, gasification of certain hydrogen richfeedstocks, and perhaps some meteorologically unique off-shore wind locations. Estimatesof potential capacity and costs are not available for these less developed technologies.Florida does not have geothermal resources or identified wind resources.
T A B L E 1

Plant Type
3
E X E C U T I V E S U M M A R Y A N D K E Y R E S U L T SE X E C U T I V E S U M M A R Y A N D K E Y R E S U L T SE X E C U T I V E S U M M A R Y A N D K E Y R E S U L T SE X E C U T I V E S U M M A R Y A N D K E Y R E S U L T SE X E C U T I V E S U M M A R Y A N D K E Y R E S U L T S
T A BL E 1
Levelized Costs(cents/kilowatt hour)
T A B L E 2
Electricity produced from renewable technologies is usually more expensive than tradi-tional technologies on a production cost basis. The following table portrays a relativeranking of the levelized production cost for various technologies using the costs per kilo-watt hour as the benchmark metric. Except for the traditional generating technologies,these numbers largely reflect national averages and do not account for individual siting andconstruction parameters that may be unique to Florida. Detailed engineering analyses,siting issues, transmission impact analyses, interconnection costs, and a host of othervariables would ultimately be needed to accurately assess the site specific cost of anygiven technology.
Municipal Solid Waste 3.5 -15.3¢*Biomass (direct combustion) 6.3 - 11.0¢Landfill Gas 2.4 - 6.3¢Hydro-electric No DataSolar Photovoltaic 19.4 - 47¢Waste heat facilities using exothermic processes Zero fuel cost**Natural Gas Combined Cycle 3.9 - 4.4¢500 Megawatt Pulverized Coal 5.2 - 5.5¢
* This assumes a $25 per ton tipping fee. Information presented by Integrated Waste Services Associationindicates that for Florida plants, a $50 per ton fee is more typical and thus production costs could be closer to 2¢.
** Zero fuel costs when part of a manufacturing process. Capital cost for retrofit of existing plants (up to 140 MW)estimated at $2,300 per kW. Capital cost for replacement plant incremental generating capacity not available butsubstantially less than above.
Almost all of the existing fleet of renewable based generators were constructed during the1980’s and early 1990’s as a result of the 1978 Public Utilities Regulatory Policy Act whichrequired utilities to purchase energy from certain qualified facilities at a price equivalent toa utility’s cost of building and operating its own generation (i.e. the avoided cost standard).Current utility construction and operating costs for new combined cycle technologies aredeclining due to improved operational efficiencies. Therefore, it is unlikely that very manynew renewable facilities will be constructed based on the current avoided cost paymentlevels.
All energy production systems have environmental impacts. It is extremely difficult toquantitatively rank order the magnitude of such impacts since there is no single metricwhich can be agreed upon. A qualitative assessment is also difficult to perform sincedifferent stakeholders will assign different weights to the impacts. For example, renewablematerials used as fuel inputs into combustion processes may have similar air emissionprofiles as traditional generation, but such facilities may have offsetting positive impacts
such as reduction in waste volumes to be landfilled. In addition, if electric generatingequipment is added at existing manufacturing facilities, waste heat cogeneration has minimalincremental impacts beyond the primary industry process itself.
Many states in the U.S. have adopted strategies to encourage greater deployment ofrenewable resources. Generally, three broad strategies have been employed. Stateshave employed what this report characterizes as market driven programs. These includeutility-sponsored green pricing which allows customers to voluntarily purchase certain definedrenewable resources. Other market driven state initiatives include establishing licensingand contractor standards, incorporating certain renewable technologies into building codes,and establishing trading and labeling procedures to allow purchasers and sellers to haverenewables certified to enhance commercial transactions. Other strategies that have beenadopted include non-by-passable surcharges imposed on utility bills or the allocation ofspecific tax revenue. These assignable charges are generally referred to as system benefitcharges (SBC) and have been used to fund activities such as energy efficiency, low incomeassistance, research and development, in addition to the funding of renewable activities.Finally, some states have mandated programs like renewable portfolio standards (RPS),which dictate that a percentage of a state’s electric production must be derived from definedrenewable resources.
Generally, market driven programs have the least impact on utility rates and have the leastadverse income distribution consequences between classes of utility customers. Systembenefit charges or other fee systems ensure a more reliable funding source, but have theundesirable effect of increasing electric rates, even minimally. They also cause someinter-class equity issues between different utility customer classes. Finally, mandatedrenewable goals potentially have the most powerful impact on deploying renewables.However, RPS standards also can have the most dramatic economic impacts with respectto electric costs. Such strategies must carefully weigh the cost of renewables and theircommercial and technical feasibility against the cost of traditional utility generation and findthe appropriate balance that achieves the policy goals that a state wants to achieve. Forexample, if the state policy goal was to increase jobs in Florida, a RPS standard thatdirected certain levels of biomass energy be obtained would tend to increase employmentwithin the state since collecting, preparing and delivering biomass fuels is a labor intensiveprocess.
Thirteen states have some type of RPS standards. The recent development of RPSstandards seems to be a result of the movement toward deregulating electric markets byallowing retail choice for end use electric customers. Some 41 percent of states with activeretail choice restructuring have implemented RPS programs, while only eleven percent ofstates without retail choice restructuring have found these initiatives necessary. Likewise,sixty-four percent of the states with active retail choice restructuring have implementedSBC programs, while only fifteen percent of the states with no retail choice restructuringhave found these initiatives necessary to maintain public benefit programs.
E X E C U T I V E S U M M A R Y A N D K E Y R E S U L T SE X E C U T I V E S U M M A R Y A N D K E Y R E S U L T SE X E C U T I V E S U M M A R Y A N D K E Y R E S U L T SE X E C U T I V E S U M M A R Y A N D K E Y R E S U L T SE X E C U T I V E S U M M A R Y A N D K E Y R E S U L T S
4

.INTRODUCTION and BACKGROUND
The 2002 Florida legislature passed HB 1601 (SB 1142) which was signed by the Governor onMay 23, 2002. This Act modified 366.8255, F.S., to allow certain costs resulting from agreementsentered into between regulated electric utilities and the Florida Department of Environmental Pro-tection (FDEP) or the U.S. Environmental Protection Agency to be subject to recovery under theEnvironmental Cost Recovery Clause. As part of this revision to Chapter 366, F.S., the legislatureadded the following language:
Section 2. (1) The Florida Public Service Commission in consultation with the FloridaDepartment of Environmental Protection is directed to perform a study for the purposeof defining public policy with respect to the use of renewable resources in Florida. At aminimum, the study shall assess cost, feasibility, deployment schedules, and impactson the environment of increased use of renewables. In addition, the study shall describeoptions and mechanisms to encourage the increased deployment of renewables withinour state. The results of this study shall be submitted to the President of the Senateand the Speaker of the House by February 1, 2003.
(2) As used in this section, the term: (a) “Biomass” means a power source that iscomprised of, but not limited to, combustible residues or gasses from forest productsmanufacturing, agricultural and orchard crops, waste products from livestock and poultryoperations and food processing, urban wood waste, municipal solid waste, municipalliquid waste treatment operations, and landfill gas. (b) “Green energy” means renewableenergy. (c) “Renewable energy” means electricity generated from any method or processthat uses one or more of the following sources of energy, but not limited to: biomass;municipal solid waste; geothermal energy; solar energy; wind energy; wood waste;ocean thermal gradient power; hydroelectric power; landfill gas; and agricultural productsand by-products.
Thus, the Florida Public Service Commission (FPSC) in consultation with the FDEP was chargedto perform a study for the purpose of defining public policy with respect to the use of renewableresources to generate electricity. This report is the work product of that charge. The reportdiscusses current policies and the limitations of such policies to the development of new renew-able resources, contains descriptions of specific renewable technologies, provides estimated costs,describes likely environmental attributes of these technologies, and offers summaries of variousoptions and mechanisms that other states have adopted to encourage renewables.
Having said what the report does, it is also important to identify what this report does not do.There are no specific recommendations for what policy options, if any, should be adopted inFlorida. The report provides technical descriptions of the types of initiatives that Florida couldadopt. Such initiatives are largely taken from the experiences of other states. At this time how-ever, renewables are typically more costly than traditional fossil and nuclear based technologies
C H A P T E R I
5

and therefore any public policy initiatives will likely impose additional costs on some or all ofFlorida’s citizens, or electric ratepayers. This report is meant to provide information to assist theFlorida legislature’s deliberations in case the legislature is interested in exploring possible newinitiatives to promote renewable technologies.
The report does not attempt to forecast technological changes that could affect the ultimate timingand commercial status of various technologies. Research and development, both private sectorand publicly funded, continues to be devoted to renewable energy. The United States Departmentof Energy (DOE) has for decades funded high end R&D for a variety of technologies but withspecial interest in solar applications. More recently, substantial private sector funding has beendevoted to the development of fuel cells for both stationary and mobile applications. While fuelcells in themselves are not renewable, some efforts are being made to fuel them with hydrogenfuel derived from potential renewable resources. Most of the large automakers now have activefuel cell development teams in hopes of developing cleaner burning engines. In addition, thereare exciting new concepts being investigated with respect to utilizing ocean currents to produceelectricity. At this time, it is nearly impossible to predict the ultimate installed cost and widelyaccepted commercialization dates for these kinds of cutting edge technologies.
Finally, the report recognizes that no single point cost estimate is possible for many renewabletechnologies. For the most part, the cost estimates will always be embedded in a range ofestimates. This is necessary due to the lack of standardization of technologies, limited experi-ence siting and constructing certain technologies within Florida, and the difficulty of estimatingfuture, in-service costs for less mature technologies.
ProcessThe FPSC and FDEP conducted three public workshops to solicit input from various stakeholders,utilities, and citizens on the content of this report. Prior to the first workshop, a questionnaire wassent to all known stakeholders who operate or have information about potential renewable facilitiesin Florida. The questionnaire mined for information about specific performance characteristics ofrenewable facilities, operating ranges, size ranges, and non-proprietary operating cost information.Much of this data was used to develop the cost estimates presented in Chapter III. Staff of theFPSC/FDEP conducted the first workshop in Tallahassee on July 2, 2002; over 70 people attendedthe July 2 workshop. Some 27 people made presentations to the staff. A second workshop washeld in Jacksonville on August 28 which was attended by all five FPSC Commissioners. Hereagain, about 50 people attended and some 25 speakers offered information and technical data onthe characteristics of various technologies and various policy options to encourage additionaldeployment. Finally, after making a draft of this report available on November 1, 2002, staffconducted a third and final workshop on November 14, 2002, in Tallahassee, and received directinput and written comments on this draft from interested parties.
6

7
Background InformationUsing the enumerated list of renewables in the statute, Florida has approximately 1028 MWs ofnet summer generating capacity. For the purposes of this report, included in this number are 340MWs of waste heat cogeneration which was considered a renewable resource since these facili-ties are listed as operating plants in the current 2002 Regional Load and Resource Plan preparedby the Florida Reliability Coordinating Council. Discussions with the phosphate industry indicatean additional 90 MWs of waste heat is currently off-line or being redeveloped. The vast majorityof the waste heat generation is used within the industry to serve internal process loads whichresults in a reduced demand on the utilities. This 1028 MWs represents about 2.4 percent of the2002 summer installed capability. Of this 1028 MWs of capacity, some 512 MWs are eitherowned or delivered to utilities under firm contracts for distribution to end use customers. Theother 516 MWs have the capability to generate energy to the grid based on individual operationalconstraints at the facilities and the hourly, spot market cost of energy. (See Appendix A for alisting of larger, interconnected, renewable generators).
Florida’s Renewable Capacity
F I G U R E 1 Fuel inputs to these generatorslargely come from MSW, includingrefuse derived fuel (RDF), biomassmaterials, waste heat from manufac-turing, and a very small amount ofhydroelectric capacity. Figure 1shows the relative contribution ofeach of these renewable capacityresources.
As might be imagined, thesenumbers pale in comparison to thecapacity of fossil and nuclear fueledelectric generators. Florida currentlyhas some 43,000 megawatts ofinstalled summer capacity and some45,500 megawatts of winter capacity.During the last 10 years, Florida has
added an average of approximately 900 megawatts of new generating capacity per year. Basedon the latest planning documents, Florida is expected to add some 1,500 megawatts per year forthe next ten years. This capacity is meant to replace long term purchase contracts and to servenew load growth.3
Figure 2 shows the relative contribution of renewables in the overall generation output producedby Florida’s electric generators. As evidenced by this pie chart, Florida has a diversified mix offuel inputs. Some 53 percent of the year 2000 net generation was derived from coal and nuclear.4
3 Florida Reliability Coordinating Council, 2002 Regional Load & Resource Plan, July 2002, p. S-10.4 Data for Figure 2 and 3 was taken from the Energy Information Administration’s Electric Power Annual2000. EIA reports that this data is based upon all reported kilowatt-hours generated by utility and non-utility generators.
MSW 393 MWs (38%)
Biomass 245 MWs (24%)
Waste heat 340 MWs (33%)
Hydro 50 MWs (5%)
g p y

Natural gas provided 23 percent, but that figure is expected to increase to almost 50 percent by2011. It is worthwhile to note that some 19 percent of the electric industry’s fuel input in Floridawas petroleum, or approximately 56 million barrels of oil in 1999. By 2011, total electric industryoil use is projected to decline to about 25 million barrels of oil. However, the use of natural gas isprojected to triple during that period.
Figure 3 shows similar data for the United States. Notice that while Florida gets an insignificantamount of its electric energy from hydroelectric, for the United States in year 2000 approximately7 percent of net generation is hydro production. Notice also that Florida uses significantly morepetroleum than the national average.
Focusing specifically on reported renewable generation, and excluding hydro, the various types ofrenewables that comprise these percentages are of interest. At the national level some 2 percentof electric production is derived from renewables. Of this amount, biomass accounts for 77 per-cent, geothermal some 15 percent, wind about 6 percent, and solar is less than 1 percent. Florida,on the other hand, gets about 3 percent of its net generation from renewables. While it is difficultto get exact data on production on some in-state renewable generators since much of the outputis used to serve internal loads at the plant site, the most recent DOE report indicates that some 53percent comes from MSW plants and some 46 percent comes from biomass fueled facilities.5
Finally, mention must be given to the transmission system in Florida. Florida has limited intertieswith the southeastern states. Currently, the bulk transmission system will allow, under normaloperating conditions, some 3600 MWs of import into the state, or about 8 percent of our installedgenerating capacity. Of this amount, some 2600 MWs are committed purchases from facilities inGeorgia or under firm contract. Thus, opportunities to import substantial amounts of renewables– if they existed – from other southeastern states is somewhat limited.
YR 2000 Florida Net Generation
F I G U R E 2
YR 2000 US Net Generation
F I G U R E 3
8
5 DOE/EIA Renewable Energy Annual 2001 with Preliminary Data for 2001, November, 2002. Table C.6
Nuclear 17%
Coal 37%
Oil 19% Natural Gas 23%
Renewable 4%
Nuclear 20%Coal 52%
Oil 3% Natural Gas 16%
Renewable 2%
Hydro 7%3

Catalysts for RenewablesAlmost the entire fleet of renewable generators were developed as a result of the federally man-dated Public Utility Regulatory Policy Act of 1978 (PURPA). The PURPA was one of the mostsignificant actions in fostering the development of facilities to generate electricity from renewableenergy sources. This Act required utilities to buy electricity from qualifying facilities (QF’s). Un-der PURPA, QF’s are defined as non-utility facilities that produce electric power using cogenera-tion technology, or power plants with no greater than 80 megawatts of capacity that use renewableenergy sources. PURPA empowered the Federal Energy Regulatory Commission (FERC) toestablish rules requiring that electric utilities purchase power from QF’s at an “avoided cost” pricebased on energy and capacity costs that the utility would otherwise incur by generating the poweritself or purchasing it elsewhere.
Generators that avail themselves of PURPA can sell their electric output to the utility under avariety of options. If the generator can meet certain deliverability or capacity factor requirements,then they can be paid both a capacity and energy component for the output of their facilities underfirm contract. The majority of these contracts in Florida were entered into over ten years ago.
Many facilities have seasonal or operational constraints such that they cannot commit to meetingcertain deliverability requirements. In this situation, generators can sell the energy they produceon an “as-available” basis to the utility. The as-available energy price is defined as the nextincrement of power cost that the utility would have incurred if it either produced or purchased thepower. In most cases, the price paid for as-available energy is less than the payment under a fullavoided cost contract.
At this time, Florida has a number of generators that produce waste heat through exothermicreactions in the production of phosphate fertilizers. The net capability of these facilities is over430 MWs. Much of the power produced is used to self-serve the electrical needs at the phos-phate plant site, thereby significantly reducing demand on the electric utility system. In addition,some 29 MWs are committed under PURPA contracts with Florida utilities as firm capacity. SeeChapter II for a further discussion of the specific exothermic production technologies.
Another catalyst for renewables is the public interest in investing in solar energy. As one scalesdown from megawatt sized mechanical generators, there are about 300,000 installations of solarthermal devices in Florida. Solar thermal is a well-established technology that can provide bothhot and ultra-high heated water for residential and commercial applications. Most of the applica-tions in Florida are for domestic hot water and pool heating. While solar thermal technology doesnot directly produce electricity, its use allows customers to avoid the direct purchase of electricity,natural gas, or other fossil fuel that would have been used to heat water. On average, there areabout 18,000 new solar pool heating systems, 5,000 solar water heating systems and 30 newgrid-connected solar photovoltaic (PV) systems installed each year. The grid-connected PV mar-ket is, however, highly dependent on subsidy programs, and may result in just a handful of sys-tems without rebates or other incentives.6
6 Information provided by the Florida Solar Energy Center. November 15, 2002.
9

7 “Cape Cod: Twisting in the Wind,” Public Utilities Fortnightly, May 15, 2002, Vol. 140, No. 10.
Cost Considerations of Renewable ResourcesRenewable fueled generating technologies ultimately must compete with traditional generatingtechnologies to sustain themselves as a viable alternative resource. Presently, renewable tech-nologies are, for the most part, more expensive than the incremental generating unit that would bebuilt to serve electric customers. Due to advances in jet engine technologies, the electric industry’spreferred generating technology to serve peak load is a natural gas fired combustion turbinegenerator operating in a simple cycle mode. When a more base loaded type generator is neededthe simple cycle can be connected to a heat recovery unit to capture the high temperature exhaustgases from the turbine, which in turn produces steam that is also used to produce electricity.While natural gas is the preferred fuel for these kinds of machines, oil and coal that have beenconverted into a gas can also be used as fuels.
Proponents of renewable technologies point out that renewables have certain desirable charac-teristics which may not always be appropriately captured by bottom line production costs. Theycite the modular nature of many technologies, the fact that renewables do not use coal, oil, naturalgas, or nuclear fuels, and that fuel input costs are either negligible or have less volatility than fossilbased fuels. On the other hand, some renewables have characteristics which may diminish theireconomic value. Intermittent resources like solar and wind are sometimes harder to incorporateinto reserve requirements. Some renewables that are remote from load centers may requiretransmission upgrades to get the energy to customers and there may be line losses associatedwith moving the power. Finally, while distributed resources can be helpful for certain aspects ofdistribution stability, power quality must be maintained.
Chapter III provides a discussion of the various life cycle cost estimates for renewable resources.
Environmental Considerations ofRenewable Resources
Many people assume that by definition renewable resources are “cleaner” or have less environ-mental impacts than non-renewable resources. Such assertions should be carefully examined.All energy infrastructure has some kind of impacts. The challenge is to evaluate the relativeseriousness of various impacts and how to best mitigate them. For example, windmills have noair emissions associated with combustion processes, but where they are sited has generatedcontroversy on the aesthetic issues associated with their construction.7 Likewise, MSW facilities,while deemed renewable by definition in this statute, often are opposed because of the combus-tion process involved in producing electricity. The air emission profile for a MSW facility wouldlook more similar to a conventional fossil fueled unit depending on the vintage of the unit. Hereagain, this report discusses the environmental characteristics of various renewable technologies,but does not attempt to assign a single, unidimensional ranking in terms of their qualitative im-pacts on the environment.
An emission profile of regulated air emissions was established for Florida’s current “fleet” ofrenewable resource electrical generators, and is presented in Figure 4. It should be noted thatthis chart reflects actual data reported during the year 2001, for existing Florida generating units
10

which were designed to provideelectricity to the grid. It is alsonoteworthy that only three units areincluded within the profile fueledwith bagasse and landfill gas,versus five units fueled with wood,and over 30 MSW/RDF fueledunits (based upon actual 2001 fuelcombustion). More landfill gasunits exist within Florida, yet thoseunits were excluded due to minimallandfill gas consumption during2001. Digester gas combustionwas reported in such low quantitiesthat an emissions profile could notbe developed. The 2001 actualheat inputs were utilized as asurrogate for capacity factor inestimating MWh production.
11
2001 Emissions ProfileFlorida Renewable Energy Generators
F I G U R E 4
It should be noted that Figure 4 does not appropriately capture the emission profiles for facilitiesthat use waste heat cogeneration. Since a substantial portion of the input fuel stock is used forproduction output and not dedicated to electric output, this table overstates the emission profileassociated with such facilities.
For comparison purposes, anemissions profile for coal, oiland natural gas units isprovided in Figure 5. Thisprofile was provided by theFDEP and based upon asample of approximately 3000MW of operating capacityfrom each type of commercialgenerating unit. The basicunit profiles within Florida’sfossil fleet are conventionalcoal, conventional oil, andnatural gas combined cycle.Three unique facilities wereincluded for the developmentof each of the profiles below,so as to ensure that the profileincluded a sample of the
2001 Emissions ProfileFlorida Fossil Generators
F I G U R E 5
differing unit vintages comprising the existing units in Florida. Some pollutants were emitted insuch small quantities that they were excluded from this chart.
Landfill Gas Bagasse Wood/Bark MSW/RDF0
10
20
30
40
50
Non-Methane Organic CompoundsHazardous Air Pollutants TotalSulfuric Acid MistVolatile Organic CompoundsSulfer DioxideParticulate MatterLeadNitrogen OxidesCarbon Monoxide
Coal Oil CC-Gas0
5
10
15
20
Volatile Organic CompoundsSulphur DioxideParticulate MatterLeadNitrogen OxidesCarbon Monoxide
Pou
nds
per
MW
h
Pou
nds
per
MW
h

One conclusion which can be reached, is that most of Florida’s current fleet of electrical generat-ing units constructed primarily for the purpose of combusting renewable fuels are at least asclean, with respect to regulated emissions, as Florida’s existing coal- and oil-fired units (whichincludes grandfathered units). However, combined cycle natural gas-fired units clearly emit thelowest amount of air pollutants per MWh generated of all existing carbon-based fuels. Modernnatural gas-fired combined cycle power plants emit nearly no sulfur dioxide and about 3 parts permillion of nitrogen oxides.
Concerning thermal emissions, each of the above types of generating units (whether fossil orrenewable fuel-fired) is responsible for heat being emitted to the air and, in some cases, waterbodies. Additionally, modern units of each type are typically designed as zero discharge facilities,implying that no wastewater streams exist. Older units, however, represent a source of wastewa-ter discharges.
The waste streams to land associated with each technology can also vary. As a general rule,waste streams are higher for solid fuels than liquid fuels, with gaseous fuels having nearly no ash.For example, the quantities of ash generated from the combustion of MSW and RDF are typicallydouble that of coal combustion. Ash generated from the combustion of coal is roughly equivalentto that of bagasse, wood or bark, per MWh of electricity produced. Comparably speaking, fuelssuch as petcoke and oil generate very low quantities of ash (perhaps five percent that of coal),while the generation of ash from the combustion of natural gas and landfill gas is essentially zero.8
Figures 4 and 5 do not include carbon dioxide emissions because carbon dioxide is currently nota regulated pollutant in the U.S. Nevertheless, many scientists, and perhaps a majority of scientists,believe that carbon dioxide emissions are the principal anthropogenic contributor to global warming.There are active discussions nationally and internationally regarding whether or not carbon dioxideemissions should be regulated. Indeed, the U.S. has agreed to voluntarily monitor and report theannual inventory of carbon dioxide emissions. To this end, the U.S. Environmental ProtectionAgency publishes an annual report entitled Inventory of U.S. Greenhouse Gas Emissions andSinks.
8 For additional information regarding waste streams see the U.S. Environmental Protection Agency’sReport to Congress dated March, 1999 entitled Wastes from the Combustion of Fossil Fuels Volume 2 –Methods, Findings, and Recommendations.
12

13
9 Much of the material for this chapter was provided by the National Renewable Energy Laboratory, Golden,Colorado.
C H A P T E R I I
TECHNOLOGY DESCRIPTIONS
This chapter provides a description of each of the major renewable technologies and assesses itspotential deployability and environmental impacts. Where possible Florida specific data is pro-vided and supplemented with national data. A number of technologies such as geothermal andwind are not applicable to Florida, but for completeness these technologies are included in theinventory.
Biomass FuelsAccording to information from the National Renewable Energy Lab (NREL) and the U.S. Departmentof Energy (DOE), biomass represents the largest opportunity for renewable energy production inthe U.S. in the short-term (five-year horizon). Biomass derived fuel has two major applications. Itcan be used as a direct fuel stock into power plants either through direct combustion or by conversioninto a gas or liquid that can then be combusted. In addition, unlike other renewable energy sources,biomass can be converted directly into liquid fuels for transportation needs. The two most commontypes of biofuels are ethanol and biodiesel. The following descriptions of sources of biomassfuels will focus on their availability and suitability as input fuels to power generation.
Wood Product ResiduesWood processing residues constitute the most important biomass fuel source used in the UnitedStates, consistently accounting for more than 50 percent of the country’s total biomass fuel supply.9
Wood processing residues come in a variety of forms. Almost half the biomass content of atypical saw log becomes residue at a primary sawmill. A variety of secondary forest productapplications have been developed to use a portion of this material. Active markets for woodprocessing residues in many regions include pulp chips, wood fiber for fiberboard and composites,animal bedding, and garden products such as decorative bark. Sawmills segregate residues forsale in the highest-value markets available. However, a substantial amount of the residues,typically 15 to 20 percent of the biomass content of the saw logs brought to a sawmill, have nouseful application and must somehow be disposed. Biomass power plants have become thedisposal option of choice for much of this material.
The traditional method used to dispose of wood processing residues at sawmills was historicallyincineration in “teepee burners,” a technology that produces copious amounts of smoke and otherair pollutants. Beginning in the early 1970s, air pollution control efforts applied increasing pressureon sawmills to close down their teepee burners, leading them to search for new disposal alternatives.This was an important factor that led to the development of the biomass power industry in theUnited States during the 1980s. In states as diverse as California, Maine, and North Carolina,virtually all the readily available wood processing residues that have no higher-valued applicationsare used as power-plant fuel. Wood processing residues are one of the cheapest forms of biomassfuel to produce and deliver. The only readily available option for disposing of these materials, iffuel use were not a possibility, is landfilling. However, landfilling of waste wood is an undesirable

option for a variety of reasons. Waste wood has a slower decay rate than other biomass forms,and is thus slow to stabilize in the landfill environment. Waste wood can take up 15 to 20 percentof the available space in a typical county landfill, and its decay leads to emissions of methane, amore potent greenhouse gas than carbon dioxide.
In-Forest ResiduesIn-forest residues constitute a major source of biomass fuels in the United States. Timber har-vesting operations produce forest residues in the forms of slash (tops, limbs, bark, broken pieces)and cull trees. If left in place these residues can impede forest regeneration, and increase the riskof forest fire. Increasingly, harvesting plans on public and private lands require some form ofresidue management, which usually means either piling and burning on-site, or removal and useas fuel. Logging slash is an important source of biomass fuel in several regions. In addition tologging residues, forest treatment residues, or thins, comprise an important source of fuel for thebiomass energy industry. Because of past forestry practices and aggressive fire-fighting effortsduring the past 80 to 100 years, vast areas of U.S. forests are likely overstocked with biomassmaterial, representing an increased risk of destructive wildfires and a general degradation of theforest ecosystems. These forests can benefit from mechanical thinning operations. The amountof in-forest biomass residues that could be converted to energy is reportedly far greater than thetotal amount of biomass fuel demand in most regions of the country. However, this fuel source isgenerally more expensive to produce than other biomass fuels, so the quantity used is less.
As the market for biomass fuels has retracted in the United States, the amount of logging resi-dues converted to fuel use has remained relatively constant, because of its link to the lumbermarket. The major adjustment has been in the quantities of thins being collected and convertedto fuel. Most logging residues used for energy production would be pile burned if energy applica-tions were not available. On the other hand, forests would simply not be thinned, so material ofthis origin would accumulate as excess biomass.
Urban Wood ResiduesAs much as 15 to 20 percent of the solid waste traditionally disposed of in U.S. landfills is cleanwood waste that can be segregated and converted into power plant fuel. This material comesfrom a variety of sources, including: 1) construction and demolition wood waste; 2) wood andbrush from land clearing; 3) wood and brush from public and private tree trimmers and landscap-ers; 4) wood waste from the manufacturing of cabinets, furniture, and other wood products; and,5) discarded pallets.
Agricultural ResiduesAgricultural operations produce large quantities of residues, which come in a wide variety of formsand consistencies. Agricultural residues suitable for use as power plant fuels include: 1) foodprocessing residues such as pits, shells, and hulls; 2) orchard and vineyard removals and prunings;and, 3) field straws and stalks. Most of these residues require some form of treatment as a partof normal agricultural practice. In most cases the lowest-cost treatment option is open burning, amajor source of smoke and air pollution. Avoiding agricultural burning is a principal reason bio-mass energy facilities have been developed.
14

Bagasse is an important agricultural residue used in power generation and is of particular signifi-cance for Florida. Bagasse is the matted cellulose fiber residue from sugar cane that has beenprocessed in a sugar mill. Bagasse is a fuel of varying composition, consistency, and heatingvalue. These characteristics depend on the climate, type of soil upon which the cane is grown,variety of cane, harvesting method, amount of cane washing, and the efficiency of the millingplant. In general, bagasse has a heating value between 3,000 and 4,000 British thermal units perpound (Btu/lb) on a wet, as-fired basis. Most bagasse has moisture content between 45 and 55percent by weight. The U.S. sugar cane industry is located in the tropical and subtropical regionsof Florida, Texas, Louisiana, Hawaii, and Puerto Rico. Except for Hawaii, where sugar caneproduction takes place year round, sugar mills, including those in Florida, operate seasonally from2 to 6 months per year.
Currently, Okeelanta is the only operating electrical generating facility in Florida for input to thegrid, which combusts bagasse. Cogeneration facilities such as Okeelanta take sugar cane ba-gasse, or clean wood waste, convert it into process fuel, and then use the fuel to operate thesugar processing facility on-site as well as generate electricity. During 2001, Okeelanta reportedcombusting over 700,000 tons of bagasse. The control and reduction of carbon monoxide emis-sions remains one of the largest challenges for new units.
Dedicated Biomass CropsEnergy crops are plantings developed and grown specifically for fuel. These crops are carefullyselected to be fast growing, drought and pest resistant, and readily harvested to minimize costs.Energy crops include fast-growing trees, shrubs, and grasses. Examples under development inthe U.S. include hybrid poplar, willow, switchgrass, and eucalyptus.
Energy crops can be grown on agricultural lands not needed for food, feed, or fiber. In the U.S., itis estimated that about 77 million hectares (190 million acres) of land could be used to produceenergy crops. This includes lands taken out of service for price control reasons and other agriculturallands that are considered marginal for food production. Compared to traditional agricultural crops,energy crops are lower maintenance and require less fertilizer and pesticide treatment. Theperiod between harvests for woody energy crops varies from 3 to 10 years, depending on the treespecies, and the period between plantings can be longer than 20 years. In addition to their fuelvalue, energy crops can also be planted for erosion control, soil remediation, and as filters thatprevent nutrient run-off from land into waterways. As is the case with other biomass fuels, energycrops are classified as a carbon dioxide neutral resource, because the carbon dioxide consumedduring plant growth is believed to offset the carbon dioxide produced during burning. However,care must be taken to use such crops in an environmentally responsible way. One way is throughclosed-loop technology in which the carbon dioxide released during burning is equal to, or less,than carbon dioxide consumed during growing. The goal is no net increase in carbon dioxideemissions.
In addition to environmental benefits, energy crops can provide income benefits for farmers. Thetypical modern farm produces one or two major commercial products such as corn, soybeans,milk or beef. The net income of the entire operation is often vulnerable to fluctuations in marketdemand, unexpected production costs, and the weather, among other factors. Since biomassfueled power plants require a fairly steady supply of fuel throughout the year, raising energy cropscan provide income stabilization for farmers who choose to diversify their production.
15

Information provided to the FPSC suggested that given a production level of 20 dry tons per yearper acre, a 15,000 acre dedicated crop area could reasonably support 50 MW of generation,resulting in 350,000 MWh per year of electric energy.10
Environmental Impacts of Biomass DisposalAll alternatives for the disposal of biomass wastes and residues, including leaving forest residuesin place, entail environmental impacts. Energy production from biomass residues produces airpollutants and solid waste (ash), and consumes water resources. These impacts must be bal-anced against those impacts that would occur if the energy alternative were not employed, includ-ing the impacts of alternate disposal of the material used as fuel, the impacts on industries thatwant to use that material for alternative non-electric products, and the impacts of alternative pro-duction of the electricity that must be supplied to the market.
Environmental Impacts of Open BurningSetting aside the recognized benefits of prescribed burning, open burning of forestry and agriculturalbiomass residues is a source of air pollution. Open burning can produce massive amounts ofvisible smoke and particulates, and significant quantities of emissions of nitrogen oxides, carbonmonoxide, and hydrocarbons that contribute to the formation of atmospheric ozone. Quantifyingthe emissions resulting from open burning is difficult because residues, burning practices, andenvironmental conditions are extremely variable. Nevertheless, use of these residues as powerplant fuel vastly reduces the smoke and particulate emissions associated with their disposal, andsignificantly reduces the amounts of carbon monoxide, nitrogen oxide, and hydrocarbons releasedto the atmosphere. California’s air quality regulatory agencies recognized that the biomass powerindustry could help eliminate open burning of agricultural residues. To give the biomass powerproducers credit for the air quality benefits they provide, regulators in California developed a set ofagricultural offset protocols, through which facilities that burn agricultural residues that wouldotherwise be open burned earn an offset for their emissions of pollutants at the power plant.Because emission offsets are required only for pollutants for which the receiving basin is non-attainment, most agricultural offsets have been for emissions of nitrogen oxide and particulates.For most facilities that were permitted on the basis of the agricultural offset protocols, the permitsrequire that one-half to two-thirds of their fuel be obtained from agricultural residue sources.
Environmental Impacts of BurialRecoverable wood waste represents approximately 15 percent by weight, and as much as 20percent by volume, of the material that typically enters sanitary landfills. One study by the Univer-sity of Florida concluded that 23 percent of the waste stream headed to landfills could be attrib-uted to demolition/renovation waste from the construction industry in Florida. Typically, thesematerials enter the landfill gate separate from mixed household garbage. In the absence of afuel-use option, they may be buried along with other wastes entering the landfill. It is noteworthythat the combustion of pressure-treated lumber causes unique emission problems and, at thistime, this material is best placed in a lined landfill.
16
10 Post workshop comments provided to the FPSC by Gus Cepero dated November 22, 2002.

Landfill burial of the wood residues that can be recovered and converted into power plant fuelentails the same kinds of environmental impacts associated with the disposal of all kinds of organicwastes in landfills. Compared to other types of organic wastes, woody materials are slow todegrade, which means that landfill stabilization is delayed. Like all organic material in the landfill,waste wood can be a source of water-polluting leachates, and as the material degrades, it producesemissions of methane and carbon dioxide in roughly equal quantities. Methane and carbon dioxideare both greenhouse gases, but methane is much more reactive, by a factor of some 25 times perunit of carbon. Large landfills are now required by EPA regulations to control their fugitive emissionsby collecting a portion of the landfill gas and flaring it. In general, gas collection systems captureabout 80 percent of the methane released by the landfill, which means that final emissions of thewaste carbon to the atmosphere are approximately 90 percent carbon dioxide and ten percentmethane (compared with approximately 50/50 for an uncontrolled landfill). The only effectivemeans of eliminating methane emissions from the disposal of wood residues that would otherwisebe buried in a landfill is to use the material as fuel. Table 3 shows emissions factors for burial ofwaste wood in landfills, emissions estimates for open burning of biomass residues under variousconditions, as well as emissions factors for other activities described in the following sections.Table 3 also shows emissions factors for fossil fuel-fired electricity production, based on and othersources. These data include only the emissions at the power plant, not those associated withproducing and processing the fuels.
open burninglandfillcomposting - immediatecomposting - delayedspreadingforest accumulation
biomass energy*coal (unit/mmkWh)gas/st (unit/mmkWh)gas/cc (unit/mmkWh)
ENERGY PRODUCTION ACTIVITY
150,000
280,000
7,500960910860
15,000
21,000
45014080
330
8,000430,00033,00065,000
130,0007,000
2501525
130
DISPOSAL ACTIVITY
17
Emissions Factors forBiomass Disposal Activities and Energy Production Activities
sulfurdioxides(lb/th.bdt)
T A B L E 3
nitrogenoxides
(lb/th.bdt)particulate
(lb/th.bdt)
carbonmonoxide(lb/th.bdt)
methane(lb/th.bdt)
non-methanehydro
carbons(lb/th.bdt)
carbondioxide
(ton/th.bdt)landfill
(m3/th.bdt)thinned
(acres/th.bdt)
* Note that for biomass energy production, unit/th.bdt is approximately the same as unit/mmkWh.
150
150
1503,500
65
7,000
7,000
2,5003,100
27085
24,000
23,000
252906060
1,6901,200
850800
1,6001,690
1,7801,100
600450
2,400
24.243.9
40
gas/st = natural gas steam unitcc = natural gas combined cycle unit
lb/th.bdt = pounds per thousand bone dry tonsmmkWh = 1,000 MWhs

T A B L E 4
The immediate result of diverting landfill-bound waste wood to a power plant is that virtually all thecarbon content is added to the atmospheric stock of carbon dioxide, rather than being storedunderground as buried waste. This means that the atmospheric greenhouse gas burden associatedwith the biomass residue used as fuel is greater in the immediate aftermath of its combustion thanif the material were landfilled. Over time, however, the landfill out-gases a mixture of methaneand carbon dioxide, and the much greater radiative effectiveness of methane rapidly leads to agreater greenhouse gas burden, which eventually becomes a major liability for the landfill option,even with the use of gas control systems on landfills.
Environmental Impacts of Energy Generation from BiomassCombustion of biomass fuels in modern power plants leads to many of the same kinds of emissionsas the combustion of fossil fuels, including criteria air pollutants and solid wastes (ash). Fuelprocessing, which in most cases involves some type of grinding operation, produces emissions ofdust and particulates. Air emissions and water consumption are usually the principal sources ofenvironmental concern related to biomass combustion facilities. Biomass power plants are requiredto achieve stringent emissions control levels for the criteria, or regulated, pollutants. These includeparticulates, nitrogen oxides, oxides of sulfur, hydrocarbons, and carbon monoxide. Nitrogenoxides, hydrocarbons, and carbon monoxide are usually controlled by using advanced combustiontechnologies, often including fluidized-bed combustors, staged-combustion, and flue-gasrecirculation. Newer biomass power facilities are required to use ammonia injection to furthercontrol nitrogen oxide emissions. Sulfur oxide emissions generally are not a concern with biomasscombustion because biomass, especially woody forms of biomass, has a very low sulfur content.Some facilities that have fluidized-bed combustors inject limestone to capture sulfur, but biomassfacilities are generally not required to have flue-gas scrubbers to control sulfur oxide emissions.Particulates are controlled using a variety of technologies. Virtually all biomass power plants usecyclones to remove most large particulates from the flue gas. Most biomass combustion facilitiesare equipped with electrostatic precipitators for final particulate removal; some facilities usebaghouses. Most modern biomass power plants are required to achieve near zero visible emissionsto meet environmental permit conditions. Emissions of particulates are also regulated and controlledto stringent levels, usually comparable to the emissions levels achieved by the large fossil fuelelectric generators.
Table 4 shows average emissions levels of the criteria pollutants for biomass power generation.The data is useful for differentiating biomass emissions by combustor type. The fluidized-bed
18
combustors achieve loweremissions levels of allcriteria pollutants ofconcern for biomasspower plants, comparedto the grate-burners. Themost dramatic differenceis in carbon monoxideemissions, for which thefluidized-bed combustorsare more than an order ofmagnitude better than the
Emissions from Biomass Power Plants (lb.bdt)
Data averaged for 34 California biomass facilities, 23 grates, 11 fluidized-bed burners.
nitrogen oxidessulfur oxidescarbon monoxidehydrocarbonsparticulates
2.61.2
11.51.70.8
3.10.9
16.31.81.0
1.51.72.01.60.6
2.00.1
10.30.50.5
2.5NA
14.70.70.6
1.00.10.20.10.3
All Grates FBsPERMIT LEVELS MEASURED EMISSIONS
All Grates FBs

grate-burners. The fluidized-bed combustors achieve emissions factors of half or less than thegrate-burners for all pollutants for which data are available.
The production of electricity in biomass power plants can help reduce air pollution by displacingthe production of power using older, more conventional sources. The full net emissions reductionscan be calculated as the difference between the net emissions associated with the biomass powercycle alone, and those that would have been produced by the displaced fossil fuel-based generation.
Finally, mention must be made of the concerns of exotic plants being dedicated to biomassproduction. While certain non-indigenous plants have very rapid growth rates and thus makesuperior candidates for dedicated biomass crops, the impact of the introduction of such plantsinto Florida must be carefully evaluated. Due to our climate conditions, a number of invasiveplants have created problems and without proper evaluation, dedicated biomass plants couldhave similar consequences. In fact, plants considered invasive by one state or section of thecountry may be deemed beneficial by other regions. The recent interest of the JEA in purchasingArundo donax is one such example.11
Co-Firing Biomass as an AlternativeDuring 2001, three Florida facilities reported combusting over 700,000 tons of bark/wood as aprimary fuel (Okeelanta, Ridge and Jefferson Power) for the generation of electricity to the grid.Additionally, some facilities have been permitted to combust agricultural fuels by co-firing withcoal. Co-firing refers to the use of biomass derived fuels blended with non-biomass fuels whereboth are simultaneously fed into combustion boilers. Such firing can be accomplished with solidbiomass fuels or biomass that has been gasified. The City of Lakeland and Tampa Electric Com-pany (TECO) have received permits for co-firing at specific generating units. Dr. Alex Green fromthe University of Florida stated at the July 2, 2002 FPSC workshop that co-firing was a feasible,near term option to increase the use of renewable energy in Florida.12
Generally speaking, emissions of air-borne pollutants of high concern (such as sulfur dioxide andnitrogen oxide) are reduced when agricultural products are co-fired with coal, even though somepollutants (such as carbon monoxide) may actually increase. Technical problems can exist withthe direct application of specific coal-fired clean-up and handling equipment due to differences inthe physical properties of coal and biomass, but these can be mitigated by appropriately limitingthe biomass fuel percentage used for co-firing. During 2001, one coal-fired unit (at TECO’sGannon station) reported combusting over 500 tons of wood via co-firing, although this facility iscurrently being repowered as a natural gas combined cycle facility. However, Florida has tenother coal-burning facilities which are possible candidates for such an operation.
19
11 “Arunda Has 2 Lives: A Pest in California But to Florida a Boon.” Wall Street Journal, October 16, 2002,p. A1.12 Presentation by Dr. Alex Green of the Interdisciplinary Center for Aeronomy and Atmospheric Sciences(ICAAS). FPSC Workshop, July 2, 2002, Tallahassee, Florida.

Municipal Solid WasteAs defined by the Florida legislation for purposes of this study, biomass means a power sourcethat is comprised of, but not limited to, combustible residues or gasses from forest productsmanufacturing, agricultural and orchard crops, waste products from livestock and poultry opera-tions and food processing, urban wood waste, municipal solid waste, municipal liquid waste treat-ment operations, and landfill gas. Within this group of defined biomass, municipal solid wasterepresents the largest existing source of renewable energy in Florida. Waste-to-Energy (WTE)facilities play an important role in Florida’s use of biomass. Based upon a presentation by theIntegrated Waste Services Association, WTE is an essential component of Florida’s municipalsolid waste management strategy. Over 50 percent of Florida’s population is served by solidwaste management systems that include WTE and over one-third of Florida’s waste is disposedof through WTE facilities.
Municipal Solid Waste Industry ProfileThe municipal solid waste (MSW) industry has four components: recycling, composting, land-filling, and combustion. The U.S. Environmental Protection Agency defines MSW to include durablegoods, containers and packaging, food wastes, yard wastes, and miscellaneous inorganic wastesfrom residential, commercial, institutional, and industrial sources. It excludes industrial waste,agricultural waste, sewage sludge, and all categories of hazardous wastes, including batteriesand medical wastes.
More than 209 million tons of MSW
was generated in the U.S. in 1994.
Paper and paperboard accounted
for 81.3 million tons (38.9 percent)
of the total waste stream, yard wastes
30.6 million tons (14.6 percent),
plastics 19.8 million tons (9.5 percent),
metals 15.8 million tons (7.6 percent),
food 14.1 million tons (6.7 percent),
glass 13.3 million tons (6.3 percent),
and “other” 34.2 million tons (16.4
percent).
Total U.S. Waste GenerationBefore Recycling - 1994
F I G U R E 6
Source: U.S. Environmental Protection Agency, MunicipalSolid Waste Factbook, database version 3.0 (Washington,D.C., March 1996).
Trends in Municipal Solid Waste GenerationNationally, the production of MSW has increased from 88 million tons in 1960 to 209 million tonsin 1994. During that time, per capita production of MSW increased from 2.7 pounds per personper day to 4.4 pounds per person per day. Per capita MSW production was expected to remainconstant through 2000, when total MSW generation was expected to reach 223 million tons.Florida is expected to produce over 38 million tons of MSW by year 2018, as compared to 15million tons in 1998.
Paper 39%
Other 16%
Glass 6%
Food Waste 7%
Metals 8% Plastics 9%
Yard Waste 15%
20

As illustrated in Table 5, in 1960, approximately 30 percent, or 27 million tons, of MSW producedin the U.S. was incinerated, most without energy recovery or air pollution controls. During the nexttwo decades, combustion declined steadily to 13.7 millions tons by 1980, as old incinerators wereclosed. Less than 10 percent of the total MSW generated in 1980 was combusted. With theenactment of the Public Utility Regulatory Policies Act of 1978 (PURPA) which created a guaran-teed energy market, combustion of MSW increased to 31.9 million tons or 16 percent by 1990. Atpresent, all of the major new WTE facilities are designed with air pollution controls and haveenergy recovery capability. During the 1990s, the absolute amount of MSW combusted andconverted into energy remained fairly constant, although the share declined slightly. By the year2000, the entire amount of MSW combusted in the country was expected to reach 34 million tons.During 2001, Florida combusted over 4 million tons of MSW as well as over 1 million tons ofrefuse derived fuel.
* Includes combustion of MSW in mass burn or refuse-derived form, incineration without energy recovery, andcombustion with energy recovery of source-separated materials in MSW.
Note: Totals may not equal sum of components due to independent rounding.
Sources: 1960, 1970, 1980, 1990, 1994, and 2000: U.S. Environmental Protection Agency, Municipal Solid WasteFactbook, database version 3.0 (Washington, DC, March 1996). This source has revised some of the historicaldata. 1991, 1992, and 1993: U.S. Environmental Protection Agency, Characterization of Municipal Solid Waste inthe United States: 1995 Update, EPA/530-S-96-001 (Washington, DC, March 1996).
FDEP records indicate that as of 1998, 57 percent of the waste stream in Florida was landfilled,13 percent combusted, and the remainder recovered.
Waste-to-Energy (WTE) FacilitiesAs of the fall of 1996, there were 102 WTE facilities marketing energy in the United States. Thenumber of facilities had declined by more than 10 percent during the years prior to 1996. Most ofthe WTE facilities in the United States are located in the East, where landfill space is the scarcest.WTE capacity had declined by approximately 2 percent during the prior year or so, from almost101,000 tons per day to approximately 99,000 tons per day.
Generally, WTE facilities can be divided into two process types: mass burn and refuse-derivedfuel (RDF). Mass burn facilities process raw waste; it is not shredded, sized, or separated beforecombustion. Very large items such as refrigerators or stoves and hazardous waste materials
Combustion*Recovery for Recyclingand CompostingDiscards to LandfillTotal Production
27.05.6
55.387.8
25.18.6
89.5121.6
13.714.4
124.3152.4
31.932.9
132.3197.1
33.337.3
126.2196.8
32.741.5
128.8206.9
32.549.3
127.3209.1
34.066.9
122.0222.9
32.945.0
129.0203.9
T A B L E 5
Historical and EstimatedU.S. Production of Municipal Solid Waste (MSW)
Years 1960-2000 (Million Tons)
DISPOSITION 1960 1970 1980 1990 1991 1992 1993 1994 2000
21

such as batteries are removed before combustion. Non-combustible materials such as metalscan be removed before or after combustion, but they are usually separated from the ash withmagnetic separators. The waste is usually deposited in a large pit and moved to furnaces withoverhead cranes. Combusting waste usually reduces its volume by approximately 90 percent.The remaining ash is buried in landfills. The ash is divided into two categories: bottom ash and flyash. Bottom ash is deposited at the bottom of the grate or furnace. Fly ash is composed of smallparticles that rise during combustion and are removed from the flue gases with fabric filters andscrubbers.
Waste is preprocessed prior to combustion at RDF facilities. Non-combustible materials areremoved, increasing the energy value of the fuel. The extent to which non-combustible materialsare removed varies. Most systems remove metals with magnetic separators; glass, grit, andsand may be removed through screening. Some systems utilize air classifiers, trammel screens,or rotary drums to further refine the waste. Mass burn waterwall facilities are usually custom-designed and constructed at the site. Waterwall furnaces contain closely spaced steel tubes thatcirculate water through the sides of the combustion chamber. The energy from the burning wasteheats the water and produces steam. Some waterwall facilities also use rotary combustors torotate the waste, resulting in more complete combustion.
22
Number of Facilities Performing Waste-to-Energy Operationsby Process Type - 1996 (United States)
F I G U R E 7
2
2
2
3
7
11
22
52
0 10 20 30 40 50 60
Note: One reporting facility did not list type of process.Source: Derived from Governmental Advisory Associates, Inc., Municipal Waste Combustion in the UnitedStates: 1996-97 Yearbook, Directory, and Guide (Westport, CT, 1997).
Mass Burning, Waterwall
Mass Burning, Modular
Refuse-Derived Fuel, Shredded
Mass Burning, Rotary Combuster
Mass Burning, Refractory
Refuse-Derived Fuel and Coal
Mass Burning, Co-disposal with Sludge
Refuse - Derived Fuel,Fluidized-Bed Combustion
NUMBER OF FACILITIES

23
The overall majority of WTE facilities in the United States employ mass burn processes. Of the101 facilities reporting the type of process employed in 1996, 86 were mass burn facilities and 15were RDF facilities. Two of the mass burn facilities co-disposed their waste with sludge. WithinFlorida, 11 of the 13 facilities are of the mass burn, waterwall type. Only 3 of Florida’s electricalgenerating facilities reported combusting RDF during the year 2001, one of which was a coal-facility that had co-fired the fuel. Two Florida facilities are designed to fire primarily RDF.
The average capacity to burn waste at U.S. WTE facilities was reported as almost 1,000 tons perday in 1996. RDF facilities, on average, have more than twice the capacity to burn waste as massburn facilities (almost 1,900 tons per day versus 850 tons per day). For reference, the two RDFfacilities in Florida are capable of handling over 1,800 and 2,600 tons per day, respectively.
Solid Waste Management in the State of FloridaAs of 1998, Florida had established the largest capacity to burn MSW/RDF of any state in theU.S., with actual combustion in calendar year 2001 at nearly 5.5 million tons, or approximately15,000 tons per day and with a capacity of 19,000 tons per day. As noted, the operating WTEs inFlorida have the capacity to generate nearly 600 MWs of electricity (at a heat rate of about 16,000btu/kWh) and have become an essential component of Florida’s MSW management strategy.
The FDEP, in the annual report entitled Solid Waste Management in Florida, estimates that yardtrash represents about 14 percent and construction and demolition (C&D) debris represents an-other 23 percent of the total waste generated in Florida. A significant component of the C&Ddebris is clean wood material which is suitable boiler fuel. In summary, it is reasonable to assumethat well over 20 percent of the total waste generated in Florida is clean biomass material whichcould be used as fuel in biomass power plants.
Florida currently collects about 28 million tons of solid waste per year. By 2018, FDEP projectsthat solid waste collection will increase to 38 million tons per year. It should be noted that there isadditional solid waste material which is generated but disposed of outside the solid waste man-agement system. For example, land clearing debris is often open burned on-site rather thantransported to a landfill. Based on the above figures, it can be inferred that there are as much as5.6 million tons per year of available biomass material in Florida which could be used as fuel. By2018, the figure could increase to 7.6 million tons per year. If it is conservatively assumed thatonly 50 percent of this material can be practically recovered and processed into fuel, this volumeof biomass could supply over 300 MW of new renewable generating capacity per year at an 80percent capacity factor.
A primary factor favoring the development of WTE in Florida is the adverse environmental andland use consequences of landfilling and the failure of competing disposal technologies otherthan landfilling. By the early 1980s, increasing ground water contamination from unlined landfillsbegan to become apparent, and many landfills ended up on the National Priority List as Superfundsites. Even when lined, because of Florida’s generally high ground water conditions, landfillsbegin at ground level and go up, in a “high rise” configuration. While protective of ground water,these landfills can rise to as high as two hundred feet above ground level and are prominentfeatures of the landscape in many Florida counties. In fact, the landfill is commonly the highestelevation in Florida coastal counties. In addition, as population density increases, particularly in

the coastal counties, finding a suitable site for a landfill, where typically 1,000 to 4,000 acres ofland are needed, at a reasonable cost is becoming nearly impossible. A related issue is the lackof success of competing technologies for disposal other than landfilling. Mixed waste compostingwas touted in the early 1980s as a cost-effective rival of WTE, but several mixed waste compostingprojects have failed in Florida. At this time, only one small mixed waste facility is in operation inCentral Florida.
A second factor spurring WTE development was the energy crisis of the mid-1970s, which led toincreased interest in alternative energy technologies. Indeed, alternative energy resource devel-opment planning of that era included WTE as a central element, although in retrospect it appearsthat the amount of energy available from this source may have been overestimated.
Thirdly, WTE was given a major boost in Florida in the late 1970s with the passage of several keypieces of State Legislation that created favorable legal and tax conditions for the construction ofWTE facilities. The Florida Resource Recovery Act created the Resource Recovery Council toevaluate and promote resource recovery, which includes WTE. The Act further directed the 19most populous Florida counties to draft resource recovery and management plans to determine ifWTE was a feasible option. As a consequence, through the remainder of the 1970s, comprehen-sive evaluations of WTE were conducted in all of Florida’s most populous areas.
Moreover, in response to concerns from the financial community about the fiscal viability of re-source recovery facilities without a guaranteed waste stream, the State Legislature enacted a flowcontrol statute. This provision authorized counties which were undertaking resource recovery, todirect the flow of MSW generated in the county to a designated solid waste disposal facility. WTEand other resource recovery facilities were given a further advantage when the legislature ex-empted resource recovery equipment owned by, or operated on behalf of, local governments fromthe state sales tax.
In the comprehensive Solid Waste Management Act of 1988, WTE received an additional finan-cial incentive. The Act directed that, when the utility industry purchased electricity from WTEfacilities, the WTE facilities were to be assumed to have a 100 percent capacity factor. Other co-generation facilities selling to utilities have a lower capacity factor, for example, 80 percent. Thisincreased the revenues to the MSW plants from energy production. However, at the time of the1993 revisions to the Solid Waste Management Act, much of the early enthusiasm for WTE hadcooled because of perceived conflicts with recycling and concerns about emissions.
Regarding recycling, concerns began to be raised that WTE was in conflict with the State’s recy-cling program. It was feared that if there were excess WTE capacity, materials that would haveotherwise been recycled would be burned. To ensure that no excess WTE capacity developed,the 1993 Amendments subjected WTE facilities to a series of new siting and need criteria consid-ered during the siting of new facilities and expansion of existing facilities. Key among thesecriteria are the requirements that WTE facilities cannot be built unless the county in which thefacility was to be located had met the State’s required 30 percent waste reduction goal, and thecounty can show that the facility is an integral component of the county’s solid waste managementprogram.
24

Another issue affecting development of mass burn WTE facilities is the fact that such facilitieswere identified as significant sources of mercury. The primary sources of mercury in MSW in-clude: batteries, mercury containing devices such as thermostats, thermometers and switches,and lighting. In a study conducted for the then Florida Department of Environmental Regulation(now the FDEP) in 1992, WTE plants were determined to be one of the major sources of anthro-pogenic mercury emissions. Other major sources include biomedical waste incinerators andfossil fuel power plants. In the 1993 Amendments, measures were enacted to reduce mercury inthe waste stream. These included provisions to control the amounts of mercury in packaging andbatteries, and the required recycling of mercury containing batteries, devices and bulbs. The1993 legislation further called for a demonstration project to collect and recycle fluorescent tubes.In October 1993, Florida’s Environmental Regulation Commission (ERC) adopted the strictestmercury emission limit in the nation for WTE facilities. Additionally, all new and existing WTEunits with capacity to incinerate 250 tons per day or more are required to meet the EPA’s Maxi-mum Achievable Control Technology (MACT) standards.
Finally, Chapter 403.706(4)(a) Florida Statutes, outlines Florida’s recycling requirements with re-spect to municipal waste. A county’s solid waste management and recycling programs shall bedesigned to reduce total waste volume by 30 percent prior to final landfilling or incineration. Bio-mass yard trash is only allowed a certain percentage toward this goal if a composting or mulchingprogram is in place. Thus, fuel that could be directed into renewable generators is incented to bemulched. If the legislature decides to promote additional renewable fuel generation, it may wish toconsider revising this statute to ensure that the policy objectives and incentives are aligned.
Typical Air Pollution Control EquipmentTable 6 illustrates the various types and designs of air pollution control equipment which are usedby most WTE facilities. Dry scrubbers and baghouse filters used in combination are more effi-cient than most electrostatic precipitators in removing acid gases and particulates from stack
25
Dry ScrubbersBaghouse/Fabric FiltersElectrostatic PrecipitatorsWet ScrubbersAmmonia De NOX SystemDry Sorbent InjectionAfter-Burn SystemOther Technologies
22.722.763.613.6
4.50.0
22.713.6
80.060.046.7
6.720.0
6.70.0
20.0
68.753.139.1
1.621.925.0
0.03.1
T A B L E 6
Air Pollution Control Equipment at Waste-toEnergy Facilities by Type of Process, 1996 (%)
TYPE OF EQUIPMENTMASS
BURNINGMODULAR
UNITSALL RDF
PROCESSES
RDF = refuse-derived fuel.Note: One facility did not list process type.Source: Derived from Governmental Advisory Associated, Inc., Municipal WasteCombustion in the United States: 1996-97 Yearbook, Directory, and Guide(Westport, CT, 1997).
gases. Nitrogen oxideand mercury emis-sions must also becontrolled. Modularfacilities that haveexclusively used after-burn or two-chambercombustion systemscan no longer rely onthose systems foradequate pollutionprevention in manyparts of the UnitedStates. As a result,some have been retro-fitted, whereas othershave permanentlyclosed down.

A major element in both the size and cost of WTE technology has been the steadily increasingrequirements for air pollution control equipment. The earliest plants built were required to haveelectrostatic precipitators (ESP) for particulate control. By the late 1980s, dry scrubbers for acidgas controls were required as well as filter fabric baghouses (FF) for particulates. The latest plantbuilt, in 1994, was required to have dry scrubbers and FF, as well as nitrogen oxide controls andcontinuous emission monitors (CEM). Now, the Lee, Lake and Pasco plants have also installedan activated carbon injection system (CI) for mercury and dioxin control. Recent technologicaladvances and reduced costs have allowed nitrogen oxide control technologies such as SelectiveCatalytic Reduction (SCR) to become a viable add-on control for newer units. As a result of theClean Air Act Amendments of 1990, all WTE facilities in Florida without dry scrubbers or FF havesince been retrofitted.
An alternative means of convertingwaste to energy was developed byBrightstar Environmental, anAustralian company. Brightstarutilizes a process which is unlike thetypical mass burn combustionpredominant in Florida. Their statedgoal is “100% utilization of MSWthrough recycling, conversion toenergy and utilization of residuals inuseful products.” The key steps ofthis process are: 1) the waste isautoclaved; 2) recyclable materialsare recovered; 3) organics arepyrolytically converted to syngas; and,4) syngas is used as fuel to producepower.
Brightstar currently employs this process at a facility (the SWERF plant) in Wollongong, NSW,Australia. Based upon FDEP reviews of gasification projects, the reliability of gasification equip-ment will continue to be a challenge for the foreseeable future. However, given that SWERF iscapable of diverting up to 90 percent of waste from a landfill, while generating electricity withemissions touted as being comparable to natural gas fired generators, the process appears prom-ising. The FDEP understands that at least two entities are considering its application within Florida.
Landfill Methane GasLandfills across the United States represent a source of potential energy. For every 1 million tonsof MSW placed in a landfill, sufficient landfill gas (LFG) is produced to generate approximately8500 MWhs of electricity. Landfill gas is created when waste in a landfill decomposes. This gasis about 50 percent methane, commonly referred to as natural gas, and 45 percent carbondioxide. Instead of allowing landfill gas to escape into the air or flaring it, the gas can be captured,converted, and used as an energy source. Using the gas helps to reduce odors and other haz-ards associated with landfill gas emissions, and helps prevent methane from migrating into theatmosphere.
MSW Processing (steps 1&2)
MSW IN PROCESSING
RECYCLABLES
ORGANICPULP
SYNGAS
SYNGASPower Generation
(steps 4)
Gasification (steps 3)
POWERGENERATION
STEAMREFORMING
INERTS TOREUSE ORLANDFILL
ELECTRICITYTO GRID
PYROLYSIS
CHAR
INERT ASH
26

27
Landfill methane projects can involve a variety of power generation technologies in a wide rangeof sizes. The size and type of generation technology depends upon the amount of methane cap-tured. Landfills with low capture rates use internal combustion engines with a capacity of 250 kWand above, while those with medium capture rates can use gas turbines with a capacity of 3 MWand above. Landfills with high capture rates can use Rankine Cycle steam turbines with a capac-ity of 8 MW and above, or combined cycle engines with capacity of 20 MW or greater.
Landfill methane generation has attracted considerable attention due to its relative ease ofinstallation and its clear environmental benefits. On an electricity production basis, when burningmethane that would otherwise be released from a landfill into the atmosphere, a landfill gas fueledelectric generator typically avoids the equivalent of 10,000 to 15,000 pounds of carbon dioxide perMWh. In effect, such a landfill gas fueled electric generator may be offsetting more carbon dioxideemissions per MWh of electric generation than is emitted from coal plants or other common formsof electric generation.
Landfill methane project economics are promising, with electricity costs from different landfillmethane options falling within the general range of costs for new combined cycle natural gasplants. In addition to the 200 landfill methane recovery projects in the United States, the EPAestimates that up to 500 landfills in the United States could install economically viable landfillenergy projects.
Extraction of Landfill GasThe technology for converting landfill gas to a useful source of energy has been improving con-tinuously. With careful maintenance programs in place, a landfill gas collection system can beoptimized, transforming a potential liability into an asset. What follows is a brief description of thegeneral process for extracting landfill gas.
1. An active landfill. Organic (biodegradable) waste is placed inan engineered repository and compacted to a specified density.The layers generally become stratified and, once microbial activitytakes over, gas production begins.
2. The site is at the beginning of the methane-producing phase.To ensure a successful power generation scheme, it is essential toprove the gas resource before construction of the power stationstarts. This is a two-staged process; the first is a theoretical study,whereby a series of gas production curves are generated. This isthen backed up with an on-site pumping trial.
3. Installation of a full gas extraction system. This involves drill-ing into the landfill, installing a series of gas extraction wells andconnecting pipe. It is essential at this stage to ensure that all pipe-work is laid properly, as the process of methane production withina landfill produces saturated landfill gas.
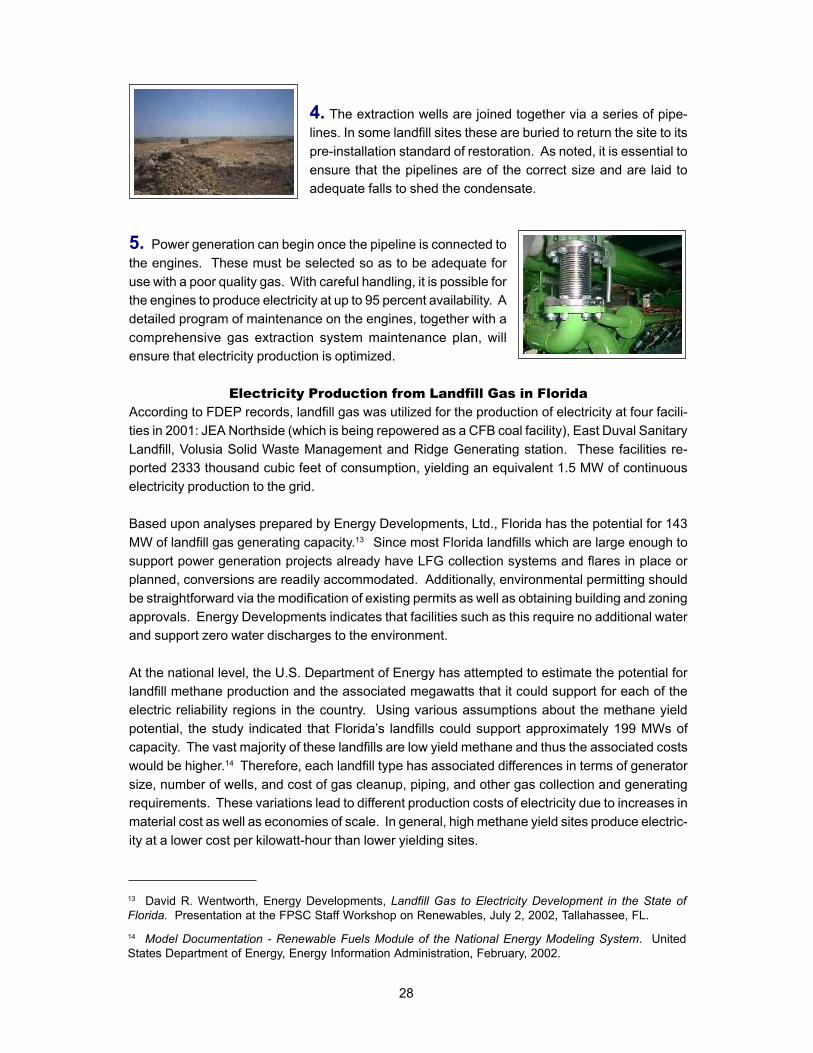
4. The extraction wells are joined together via a series of pipe-lines. In some landfill sites these are buried to return the site to itspre-installation standard of restoration. As noted, it is essential toensure that the pipelines are of the correct size and are laid toadequate falls to shed the condensate.
5. Power generation can begin once the pipeline is connected tothe engines. These must be selected so as to be adequate foruse with a poor quality gas. With careful handling, it is possible forthe engines to produce electricity at up to 95 percent availability. Adetailed program of maintenance on the engines, together with acomprehensive gas extraction system maintenance plan, willensure that electricity production is optimized.
Electricity Production from Landfill Gas in FloridaAccording to FDEP records, landfill gas was utilized for the production of electricity at four facili-ties in 2001: JEA Northside (which is being repowered as a CFB coal facility), East Duval SanitaryLandfill, Volusia Solid Waste Management and Ridge Generating station. These facilities re-ported 2333 thousand cubic feet of consumption, yielding an equivalent 1.5 MW of continuouselectricity production to the grid.
Based upon analyses prepared by Energy Developments, Ltd., Florida has the potential for 143MW of landfill gas generating capacity.13 Since most Florida landfills which are large enough tosupport power generation projects already have LFG collection systems and flares in place orplanned, conversions are readily accommodated. Additionally, environmental permitting shouldbe straightforward via the modification of existing permits as well as obtaining building and zoningapprovals. Energy Developments indicates that facilities such as this require no additional waterand support zero water discharges to the environment.
At the national level, the U.S. Department of Energy has attempted to estimate the potential forlandfill methane production and the associated megawatts that it could support for each of theelectric reliability regions in the country. Using various assumptions about the methane yieldpotential, the study indicated that Florida’s landfills could support approximately 199 MWs ofcapacity. The vast majority of these landfills are low yield methane and thus the associated costswould be higher.14 Therefore, each landfill type has associated differences in terms of generatorsize, number of wells, and cost of gas cleanup, piping, and other gas collection and generatingrequirements. These variations lead to different production costs of electricity due to increases inmaterial cost as well as economies of scale. In general, high methane yield sites produce electric-ity at a lower cost per kilowatt-hour than lower yielding sites.
13 David R. Wentworth, Energy Developments, Landfill Gas to Electricity Development in the State ofFlorida. Presentation at the FPSC Staff Workshop on Renewables, July 2, 2002, Tallahassee, FL.14 Model Documentation - Renewable Fuels Module of the National Energy Modeling System. UnitedStates Department of Energy, Energy Information Administration, February, 2002.
28

The U.S. Environmental Protection Agency has a “Landfill Methane Outreach” program to en-courage the use of landfill gas as an energy resource.
Digester GasIn recent years increasing awareness that anaerobic digesters can help control waste odor anddisposal has stimulated renewed interest in the technology. The application of anaerobic digest-ers in the treatment of human wastes at modern wastewater treatment plants has become com-monplace. Dairy farmers faced with increasing federal and state regulation of the waste theiranimals produce are looking for ways to comply. New digesters are currently being built becausethey effectively eliminate the environmental hazards of dairy farms and other animal feedlots.
Anaerobic digester systems can reduce fecal coliform bacteria by more than 99 percent, virtuallyeliminating a major source of water pollution. Separation of the solids during the digester processremoves about 25 percent of the nutrients, and the solids can be culled out of the drainage basinwhere nutrient loading may be a problem. In addition, the digester’s ability to produce and capturemethane reduces the amount of methane that otherwise would enter the atmosphere and pro-vides an opportunity for power generation.
Types of Anaerobic DigestersThere are three basic digester designs. Each can trap methane and reduce fecal coliform bacte-ria, but they differ in cost, climate suitability, and the concentration of solids they can digest.
A covered lagoon digester, as the name suggests, consists of a solids storage lagoon with animpermeable cover. The cover traps gas produced during decomposition of the solids. Coveredlagoon digesters are used for liquid manure with less than 2 percent solids, and require largelagoon volumes and a warm climate. This type of digester is the least expensive of the three, butis typically used for small applications.
A complete mix digester is suitable for wastes that are 2 percent to 10 percent solids. Completemix digesters process solids in a heated tank above or below ground. A mechanical or gas mixerkeeps the solids in suspension. However, complete mix digesters are expensive to construct andcost more than a plug-flow digester to operate and maintain.
Plug-flow digesters are suitable for wastes having a solids concentration of 11 percent to 13percent. In a plug-flow digester, raw sewage slurry enters one end of a rectangular tank anddecomposes as it moves through the tank. New material added to the tank pushes older materialto the opposite end. Coarse solids form a viscous material as they are digested, limiting solidsseparation in the digester tank. As a result, the material flows through the tank in a “plug.” Anaerobicdigestion of the slurry releases gas as the material flows through the digester. A flexible, imper-meable cover on the digester traps the gas. The plug-flow digester design offers a high-tempera-ture variation. High temperature speeds the digestion process and reduces the required volumeof the tank by 25 percent to 40 percent. High-temperature digesters also are more prone toimbalance because of temperature fluctuations, and their successful operation requires closemonitoring and diligent maintenance.
29

erators to produce electricity. The engines can usually run on digester or natural gas and supplyelectrical power to essential pieces of treatment plant equipment as well as the potential to feedthe grid.
Florida’s existing generating capacity from digesters is just under 8 MW and made up of manysmall engines. JEA is adding an additional 800 kW, which should be operational during 2002.
Solar TechnologiesThe basic principles behind the development and practical use of solar energy are fairly simple.The sun’s energy is radiated through space, filtered by our atmosphere and strikes the surface ofthe earth in a predictable and quantifiable manner. Thermal design applications are based uponthe amount of heat energy or work to be done, and then engineered to arrive at the amount andtype of collection equipment necessary. Direct thermal transfer such as solar pool or home waterheating use the basic principles of radiation, conduction and convection to design a system thatwill provide the proper results. In the case of photovoltaics, electrons are activated using thesun’s energy and the net result is a flow of electrical charge that can be used without conversion
Waste-Water TreatmentFacilities (WWTF) also incor-porate anaerobic digesters.The process uses bacteria,which do not need atmo-spheric oxygen to survive, sotherefore, no air is bubbledinto the tanks. In fact, airmixed with the gasses maybe explosive. The anaerobicdigesters produce a stablesludge, which is readily de-watered. The process is alsoa source of methane gas,which fuels the engine gen-
30
Solids collected from the various clarifier tanks areultimately pumped to the anaerobic digesters.
In the anaerobic (absence of oxygen) digesters, differentgroups of bacteria further decompose the organic solids.A major by-product of this process is methane gas. Themethane gas is used as a fuel for heating the digestersand several buildings and to fuel an electric generator.About 40,000 cubic feet of methane gas is produced perday. The lid of the anaerobic digester (shown in black)moves up and down and is supported by the pressure ofthe methane gas generated in the process.
Example of Anaerobic Digester
WASTEWATER
ODOR TREATMENT
ODOR
EFFLUENT
LIQUIDSTREAM
DEWATEREDSLUDGE
SLUDGEMETHANEGAS
DISINFECTION
BIO-SOLIDSDIGESTEDSLUDGE
COGENERATION SOLIDSDEWATERING
SOLIDSDIGESTION

(direct current, or DC) or converted to alternating current (AC) for a broader range of uses. Thereare three basic applications for converting solar energy to useful energy in Florida: pool heating,water heating and photovoltaics (PV).
31
Pool HeatingIn these systems, pool water circulates through a large heat exchange surface, usually located onthe roof, and absorbs the sun’s energy. The principle is similar to the way a car radiator works;except these solar heat exchangers collect heat instead of radiating it. Most solar “collectors” areflat black panels manufactured from high technology plastics, which have been designed to resistweather and ultraviolet radiation.
The major advantage of these systems is that they have little or no operating cost (nor emissions).The major disadvantage is that solar does not provide heat on demand, and is dependent uponthe amount of solar energy on any given day. Used in conjunction with a cover, solar can morethan double the comfortable swimming season, up to nine or ten months per year.
Water HeatingAlthough there are different types of systems (e.g. active versus passive), solar water heatingsystems consist of a single or multiple set of collectors on the roof, providing the heat energy thatis stored in an insulated tank. In areas where freezing temperatures can occur with some regular-ity, such as North Florida, a heat exchange system using anti-freeze such as a non-toxic glycolsolution may be used to prevent damage to the collection system on the roof. However, in most ofFlorida a direct exchange method using the water that actually comes out of the tap is used tocarry the sun’s energy from the roof into the storage tank. The tank then holds the heated waterfor when needed.
The efficiency of anysolar technology is
directly proportional to theavailability of solar
radiation. While solarradiation is universally
available, its diffusenature requires that it be
collected and concen-trated before it is available
as an energy resource.This table shows therelative intensities of
available solar radiationin the United States.
Solar resource for a flat-plate collector

PhotovoltaicsThe ability to produce electricity directly from the sun’s energy is a revolutionary development.The technology involved in the production of these silicon cells is complicated and the efficienciesare still not close to those of thermal solar applications, but these unique energy devices are nowseen in places as common as landscapes (solar powered lights), highways (solar powered trafficlights and sign lights), and calculators.
Photovoltaics (PV) is the direct conversion of light into electricity. Some materials exhibit a prop-erty known as the photoelectric effect, which causes them to absorb photons of light and releaseelectrons. When these free electrons are captured, an electric current results that can be used aselectricity.
This diagram illustrates the operationof a basic photovoltaic cell, alsocalled a solar cell. When light energystrikes the solar cell, electrons areknocked loose from the atoms in thesemiconductor material. If electricalconductors are attached to thepositive and negative sides, formingan electrical circuit, the electrons canbe captured in the form of an electriccurrent — that is, electricity. Thiselectricity can then be used to powera load, such as a light bulb or a waterpump. A typical four-inch siliconsolar cell produces about 1.5 wattsof electricity in bright noon sunshine.Remote locations such as billboards,road signs and other areas where itis cost-effective to install solarelectric systems with battery backupare becoming more and morecommon.
Solar Applications in FloridaThe amount of solar power that is currently part of the electricity mix in the U.S. is quite small.According to the U.S. Department of Energy’s Annual Energy Review of 1999, 0.076 quadrillionBTU’s of energy were produced by solar power. This is about 0.1 percent of the overall 72.523quadrillion BTU’s produced in the U.S. This percentage is dwarfed by the 57.673 quadrillionBTU’s, or 80 percent, of the total produced using fossil fuels. Coal alone fueled 52 percent of theelectricity produced in the U.S. in 1999.
Since the application of solar energy in Florida has not caused air emissions to occur, FDEP’sdatabases do not record information related to solar electrical generation. However, data ob-tained from the NREL indicates that approximately 70 installations of photovoltaics exist in Florida,
32
Electrical load
Sun
Photovoltaic cellCC current flow
(-)
(+)

comprising approximately 500 kilowatts (kW) of capacity as of 2001. These systems are typicallysized at 4 kW or less, with the largest (EPCOT), listed as 73 kW of capacity. Though solar-powered water heaters and pool heaters are common, only about 100 homes in Florida havesolar-energy systems producing electricity for the actual home, according to the Florida SolarEnergy Center (FSEC). New Smyrna Beach has nine of them, with three more planned for Fall2002.
Solar PotentialA recent study performed by the FSECstated that if the potential market forsolar water heaters in the U.S. werefully realized, 41 million kWh would begenerated per year. However, morepromising is the potential to utilizephotovoltaics for peak shaving. Inorder to better understand this, somedefinitions are in order. Effective load-carrying capacity (ELCC) is the abilityof a power generator — whether PVor conventional — to effectivelycontribute to a utility’s capacity, orsystem output, to meet its load.Therefore, ELCC for a photovoltaicsystem represents PV’s ability toprovide power to the utility when it isneeded. A typical example of high ELCC for PV occurs when the utility system load reflectscommercial customers’ demand for midday air-conditioning; this load is a good match to PV’spower output. A graphic example of this is depicted in the chart above.
Florida’s summer loads are largely driven by air-conditioning demand. Of course, air-conditioningdemand is highest on clear sunny summer days, correlating to the maximum periods of PV gen-eration. Accordingly, the application of PV in Florida, for the specific application of reducing sum-mer peak loads appears to be a reasonable fit. However, depending on the extent and duration ofwinter cold fronts, utilities in Florida can also experience a winter demand peak. In such cases,solar makes little if any contribution to avoidance of installed capacity to serve winter demand.
Hydroelectric Generation Technologies for FloridaThere are three primary types of hydropower facilities. Storage projects impound water behind adam, forming a reservoir. Water is then released through turbine-generators to produce electric-ity. The water storage and release cycles are variable. In contrast, run of the river projectstypically use relatively low dams where the amount of water running through the turbines is deter-mined by the water flowing in the river. Electricity generation from these plants will vary withchanges in the amount of water flowing in the river. Finally, pumped storage projects use off-peakelectricity to pump water from a lower reservoir to an upper reservoir. During periods of highelectrical demand, the water is released back to the lower reservoir to generate electricity.
33
Utility load and PV output versus time of day.
LOAD
TIME OF DAY 6 12 18 24
PHOTOVOLTAICGENERATION
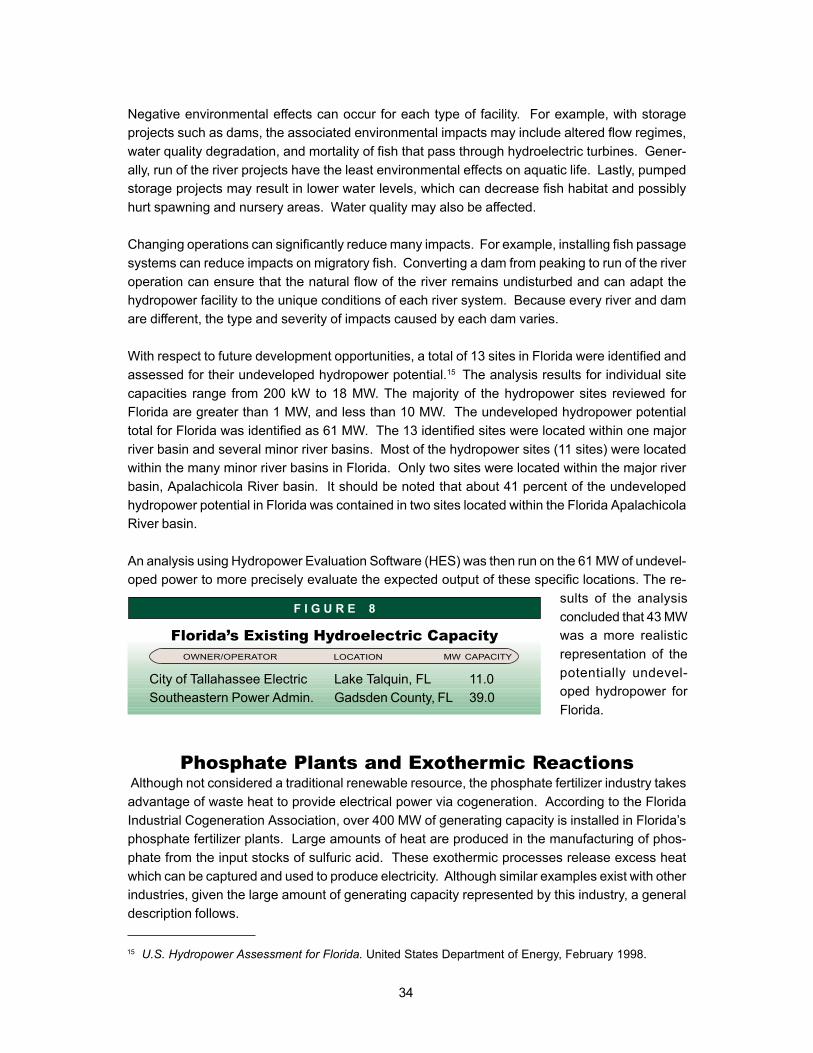
Negative environmental effects can occur for each type of facility. For example, with storageprojects such as dams, the associated environmental impacts may include altered flow regimes,water quality degradation, and mortality of fish that pass through hydroelectric turbines. Gener-ally, run of the river projects have the least environmental effects on aquatic life. Lastly, pumpedstorage projects may result in lower water levels, which can decrease fish habitat and possiblyhurt spawning and nursery areas. Water quality may also be affected.
Changing operations can significantly reduce many impacts. For example, installing fish passagesystems can reduce impacts on migratory fish. Converting a dam from peaking to run of the riveroperation can ensure that the natural flow of the river remains undisturbed and can adapt thehydropower facility to the unique conditions of each river system. Because every river and damare different, the type and severity of impacts caused by each dam varies.
With respect to future development opportunities, a total of 13 sites in Florida were identified andassessed for their undeveloped hydropower potential.15 The analysis results for individual sitecapacities range from 200 kW to 18 MW. The majority of the hydropower sites reviewed forFlorida are greater than 1 MW, and less than 10 MW. The undeveloped hydropower potentialtotal for Florida was identified as 61 MW. The 13 identified sites were located within one majorriver basin and several minor river basins. Most of the hydropower sites (11 sites) were locatedwithin the many minor river basins in Florida. Only two sites were located within the major riverbasin, Apalachicola River basin. It should be noted that about 41 percent of the undevelopedhydropower potential in Florida was contained in two sites located within the Florida ApalachicolaRiver basin.
An analysis using Hydropower Evaluation Software (HES) was then run on the 61 MW of undevel-oped power to more precisely evaluate the expected output of these specific locations. The re-
F I G U R E 8
Florida’s Existing Hydroelectric Capacity
City of Tallahassee ElectricSoutheastern Power Admin.
OWNER/OPERATOR LOCATION MW CAPACITY
Lake Talquin, FLGadsden County, FL
11.039.0
sults of the analysisconcluded that 43 MWwas a more realisticrepresentation of thepotentially undevel-oped hydropower forFlorida.
Phosphate Plants and Exothermic Reactions Although not considered a traditional renewable resource, the phosphate fertilizer industry takesadvantage of waste heat to provide electrical power via cogeneration. According to the FloridaIndustrial Cogeneration Association, over 400 MW of generating capacity is installed in Florida’sphosphate fertilizer plants. Large amounts of heat are produced in the manufacturing of phos-phate from the input stocks of sulfuric acid. These exothermic processes release excess heatwhich can be captured and used to produce electricity. Although similar examples exist with otherindustries, given the large amount of generating capacity represented by this industry, a generaldescription follows.
34
15 U.S. Hydropower Assessment for Florida. United States Department of Energy, February 1998.

There are several methods for the production of phosphate fertilizer. What is shown below isreferred to as the Dihydrate Process, which is common in Florida. As indicated in the schematic,the key inputs to the process are phosphate rock, sulfuric acid and water. Downstream of thisprocess, the phosphogypsum generation process takes place. There, the phosphoric acid isconcentrated and initially, kept in contact with the phosphate rock. This is done to convert thephosphate rock as far as possible to soluble monocalcium phosphate. The second stage is totake this soluble monocalcium phosphate and to precipitate calcium sulphate. This precipitateexists in a number of different crystal forms and appears as a slurry. The slurry is then filtered tocreate the final product.
Typically, the ratio of waste gypsum to product is 5 to 1. In Florida, this phosphogypsum is typi-cally stacked on the ground, and can be as high as 200 feet, covering 400 or more acres. TheFlorida Institute of Phosphate Research estimates that over 70 million tons of this waste exists inFlorida alone, with an additional 30 million tons generated annually.
Within the attack tanks, an exothermic reaction occurs, meaning that heat is produced from thechemical reaction. The heat is removed via the flash evaporation of water in the flash cooler. Thisprovides an opportunity within a phosphate fertilizer plant for cogeneration, since steam is createdwhich is otherwise wasted to the atmosphere via a condenser.
Phosphate fertilizer plants represent a potential source of pollutants to the air, water and land.However, once permitted for operation, such facilities are able to provide a source of electricalgeneration with few additional environmental impacts.
Wind GenerationWind turbines, like windmills, are mounted on a tower to capture the most energy. At 100 feet ormore above ground, they can take advantage of the faster and less turbulent wind. Turbines catchthe wind’s energy with their propeller-like blades. Usually, two or three blades are mounted on ashaft to form a rotor. A blade acts much like an airplane wing. When the wind blows, a pocket of
35
Waste gasVacuum
Weak phosphoric acid
Water
Phosphoric acid
26-32% P205
By-product
CaS04 H2O
Phosphate rock
Sulphuric acid
Water
Condenser
Venturiscrubber
Flashcooler
Attack tanksAgeingTank Dihydrate filter
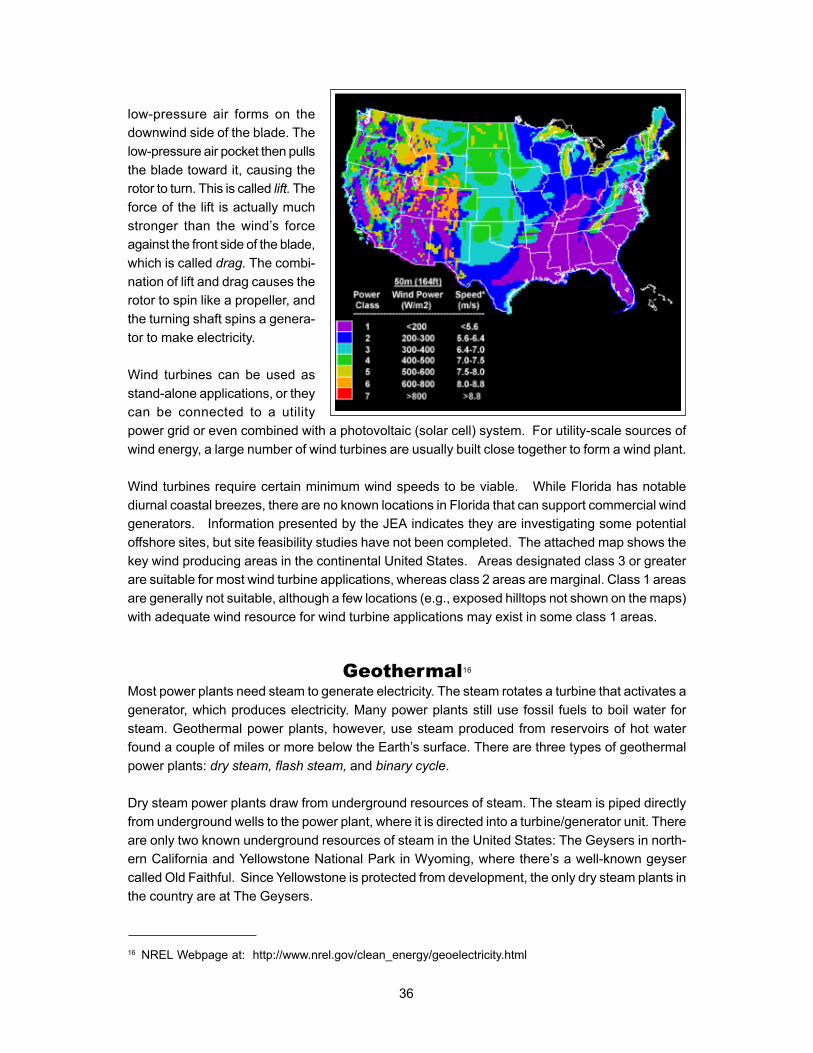
low-pressure air forms on thedownwind side of the blade. Thelow-pressure air pocket then pullsthe blade toward it, causing therotor to turn. This is called lift. Theforce of the lift is actually muchstronger than the wind’s forceagainst the front side of the blade,which is called drag. The combi-nation of lift and drag causes therotor to spin like a propeller, andthe turning shaft spins a genera-tor to make electricity.
Wind turbines can be used asstand-alone applications, or theycan be connected to a utilitypower grid or even combined with a photovoltaic (solar cell) system. For utility-scale sources ofwind energy, a large number of wind turbines are usually built close together to form a wind plant.
Wind turbines require certain minimum wind speeds to be viable. While Florida has notablediurnal coastal breezes, there are no known locations in Florida that can support commercial windgenerators. Information presented by the JEA indicates they are investigating some potentialoffshore sites, but site feasibility studies have not been completed. The attached map shows thekey wind producing areas in the continental United States. Areas designated class 3 or greaterare suitable for most wind turbine applications, whereas class 2 areas are marginal. Class 1 areasare generally not suitable, although a few locations (e.g., exposed hilltops not shown on the maps)with adequate wind resource for wind turbine applications may exist in some class 1 areas.
Geothermal16
Most power plants need steam to generate electricity. The steam rotates a turbine that activates agenerator, which produces electricity. Many power plants still use fossil fuels to boil water forsteam. Geothermal power plants, however, use steam produced from reservoirs of hot waterfound a couple of miles or more below the Earth’s surface. There are three types of geothermalpower plants: dry steam, flash steam, and binary cycle.
Dry steam power plants draw from underground resources of steam. The steam is piped directlyfrom underground wells to the power plant, where it is directed into a turbine/generator unit. Thereare only two known underground resources of steam in the United States: The Geysers in north-ern California and Yellowstone National Park in Wyoming, where there’s a well-known geysercalled Old Faithful. Since Yellowstone is protected from development, the only dry steam plants inthe country are at The Geysers.
36
16 NREL Webpage at: http://www.nrel.gov/clean_energy/geoelectricity.html

Flash steam power plants are the most common. These plants use geothermal reservoirs ofwater with temperatures greater than 360 F (182 C). This very hot water flows up through wells inthe ground under its own pressure. As it flows upward, the pressure decreases and some of thehot water boils into steam. The steam is then separated from the water and used to power aturbine/generator. Any leftover water and condensed steam are injected back into the reservoir,making this a sustainable resource.
Binary cycle power plants operate on water at lower temperatures of about 225 to 360 F (107 to182 C). These plants use the heat from the hot water to boil a working fluid, usually an organiccompound with a low boiling point. The working fluid is vaporized in a heat exchanger and used toturn a turbine. The water is then injected back into the ground to be reheated. The water and theworking fluid are kept separated during the process, so there are little or no air emissions.
Small-scale geothermal power plants (under 5 megawatts) have the potential for widespreadapplication in rural areas, possibly even as distributed energy resources. Distributed energy re-sources refer to a variety of small, modular power-generating technologies that can be combinedto improve the operation of the electricity delivery system. In the United States, most geothermalreservoirs are located in the western states, Alaska, and Hawaii.
Ocean Thermal Generation17
Ocean thermal energy conversion (OTEC) is used for many applications, including electricitygeneration. There are three types of electricity conversion systems: closed-cycle, open-cycle,and hybrid. Closed-cycle systems use the ocean’s warm surface water to vaporize a workingfluid, which has a low-boiling point, such as ammonia. The vapor expands and turns a turbine.The turbine then activates a generator to produce electricity. Open-cycle systems actually boil theseawater by operating at low pressures. This produces steam that passes through a turbine/generator. Hybrid systems combine both closed-cycle and open-cycle systems.
Ocean mechanical energy is quite different from ocean thermal energy. Even though the sunaffects all ocean activity, tides are driven primarily by the gravitational pull of the moon, and wavesare driven primarily by the winds. As a result, tides and waves are intermittent sources of energy,while ocean thermal energy is fairly constant. Also, unlike thermal energy, the electricity conver-sion of both tidal and wave energy usually involves mechanical devices.
A barrage (dam) is typically used to convert tidal energy into electricity by forcing the water throughturbines, activating a generator. For wave energy conversion, there are three basic systems:channel systems that funnel the waves into reservoirs; float systems that drive hydraulic pumps;and oscillating water column systems that use the waves to compress air within a container. Themechanical power created from these systems either directly activates a generator or transfers toa working fluid, water, or air, which then drives a turbine/generator.
Although ocean energy is renewable and clean, it is not without environmental challenges. Forinstance, tidal power plants that dam estuaries can impede sea life migration, and silt build-ups
17 NREL Webpage at: http://www.nrel.gov/clean_energy/ocean.html
37

behind such facilities can impact local ecosystems. Tidal fences may also disturb sea life migration.Newly developed tidal turbines may prove ultimately to be the least environmentally damaging ofthe tidal power technologies because they do not block migratory paths.
In general, careful site selection is the key to keepingthe environmental impacts of OTEC and wave energysystems to a minimum. OTEC experts believe that ap-propriate spacing of plants throughout the tropical oceanscan nearly eliminate any potential negative impacts ofOTEC processes on ocean temperatures and on ma-rine life. Similarly, wave energy system planners canchoose sites that preserve scenic shorefronts and avoidareas where wave energy systems are likely to signifi-cantly alter flow patterns of sediment on the ocean floor.
Another challenge with ocean energy systems is eco-nomics. While it may cost little to operate ocean energyfacilities, they are currently quite expensive to build. For
example, construction costs for tidal power plants are high, and payback periods are long. Thecost of a proposed tidal power plant across the Severn River in the United Kingdom is estimatedat about $12 billion, far more expensive than even the largest fossil fuel power plants. As a result,at present the cost per kWh of tidal power is not competitive with conventional fossil fuel power.
Wave energy systems also cannot compete economically with traditional power sources. How-ever, the costs to produce wave energy are decreasing, and some European experts predict thatwave power devices will find lucrative niche markets soon. Once built, however, wave energysystems and other ocean energy plants should have low marginal energy production costs, be-cause the fuel they use — seawater — is free.
Electricity from HydrogenAlthough not an individual technology, hydrogen itself is a potential fuel stock into generatingequipment and fuel cells. Hydrogen is not a naturally occurring molecule found in a free or gas-eous state but is nearly always bound with other elements such as water, cellulose, methane, andhigher order hydrocarbons. Depending on its form the energy required to separate hydrogen canbe quite high. To reformulate hydrogen from water for example, is only about 60 to 80 percentefficient. In other words, it takes about 1.6 units of energy to produce 1.0 unit of usable hydrogen.Hydrogen is the simplest and most common element in the universe. It has the highest energycontent per unit of weight (52,000 Btu per pound) of any known fuel. Moreover, when cooled to aliquid state, this low-weight fuel takes up 1/700 as much space as it does in its gaseous state.This is one reason hydrogen is used as a fuel for rocket and spacecraft propulsion, which requiresfuel that is low-weight, compact, and has a high energy content. Hydrogen is also a very desirablefuel from an environmental prospective since its combustion produces only water and a smallamount of nitrogen oxides. If used in a fuel cell the by-product is only water and no greenhousegases. In fuel cells, electrolysis is reversed by combining hydrogen and oxygen through an elec-trochemical process, which produces electricity, heat, and water.
38
An artist’s rendition ofocean driven mechanical turbines.

Hydrogen can be viewed as an energy storage medium in that it can be linked with intermittentand non-storable sources of energy such as windmills or photovoltaic systems to yield a useablefuel for both electric production and as a vehicular fuel. Certain desirable synergies can be achievedby combining renewable resources with hydrogen production and then using the fuel in generat-ing technologies such as fuel cells. In fact, some researchers believe the hydrogen producedfrom photo-electrochemical water decomposition is the most promising application of these tech-nologies.18
18 Bak, T., J. Nowotny and C.C. Sorrell. “Photo-electrical hydrogen generation from water using solarenergy. International Journal of Hydrogen Energy, 27(2002) 991- 1022.
The Schatz Energy Research Center (California) has designed and built a stand-alone solar hydrogen system. The system uses a 9.2 kW photovoltaic (PV) arrayto provide power to compressors that aerate fish tanks. The power not used torun the compressors runs a 7.2 kW bipolar alkaline electrolyzer. The electrolyzercan produce 53 standard cubic feet of hydrogen per hour (25 liters per minute).The unit has been operating without supervision since 1993. When there is notenough power from the PV array, the hydrogen provides fuel for a 1.5 kW protonexchange membrane fuel cell to provide power for the compressors. By extension,when the sun is shining, PV systems can provide the electricity needed to “make”hydrogen. The hydrogen could then be stored and burned as fuel, or to operatea fuel cell to generate electricity at night or during cloudy periods.
A H Y D R O G E N A P P L I C A T I O N
39

40
C H A P T E R I I I
COSTS and OTHERECONOMIC CONSIDERATIONS
It is generally recognized that renewable technologies are, in most instances, more costly thanmore traditional generation technologies. Opinions vary as to which costs should be consideredwhen comparing traditional generation technologies to their renewable counterparts. This chap-ter will focus primarily on those costs considered by the Florida Public Service Commission in itsproceedings, for example, the determination of need proceeding for new generating capacity.Information was gathered from many sources, including: the presentations of speakers at twoCommission workshops; responses to a Commission sponsored questionnaire; the research find-ings of Florida utilities and renewable industry representatives, recent need determination filings,and government and industry web sites.
The fuel costs for many renewable technologies, such as solar, wind, hydroelectric and oceanenergy are zero or negligible. However, in determining the cost impact of increased use of renew-able technologies, these cost savings must be balanced against potentially high capital costs.Operations and maintenance (O&M) costs may also be higher for certain renewable generationtechnologies per unit of energy produced. For example, fuel preparation and transportation costsmay increase, because fuels such as biomass and municipal solid waste have a lower heat valuethan traditional fuels. Therefore higher volumes of these fuels are required to produce the samequantity of energy as that produced by fossil fuels.
Costs of many renewable technologies are also highly dependent on site characteristics andresources. As discussed earlier, solar, wind, geothermal, and hydroelectric capabilities vary widelyacross regions of the United States. Other non-cost attributes of a particular generating resourcemay also have an impact on the value of the resource to the Florida electric market. For example,the value of a generating resource is increased if it can be dispatched by a utility and if theresource is available during peak electric demand periods. If not, energy storage may be addedat an additional cost, so that the energy can be used when most needed. Adding renewableresources to the generation mix may also impact environmental compliance costs. Displacingtraditional generation with renewable generation may reduce sulfur dioxide emissions and there-fore reduce the number of sulfur dioxide allowances required to achieve a certain level of energyproduction. These indirect cost savings should be considered in any exhaustive evaluation of thecosts of deploying additional renewable generation resources.
Several other economic issues are impacted by the deployment of additional renewable resources.The increased use of renewables will increase the fuel diversity of generation within Florida. Ingeneral, the cost of renewable fuel is less volatile than the price of natural gas and oil. Thusincreased use of renewables may partially offset the risk associated with fuel price increases.Several of the workshop participants also stressed that increasing renewable generation maybenefit Florida by avoiding expenditures on fossil fuels, which must be purchased outside thestate. A study by Dr. Robert Cruz was presented which estimated a net positive economic impacton state employment, income, GDP, and tax proceeds, from diverting funds which would havebeen used to purchase fossil fuels outside the state to increased biomass fueled generation.

41
Dr. Cruz stated that the higher cost of renewable technologies should be balanced against thepotential for increased employment and tax dollars within Florida.19
Cost Calculation and Pricing IssuesCost estimates for generating capacity, and renewable capacity in particular, are highly depen-dent on the underlying assumptions, such as site location, size, unit efficiency level, fuel quality,etc. To the extent possible, such parameters have been standardized in the cost comparisons ofdifferent technologies discussed below. These cost estimates were recently developed by Blackand Veatch and are based on industry assessments, and actual costs at similar Black and Veatchprojects. Where appropriate, specific cost estimates for Florida are provided based on the ques-tionnaire responses received and the research and development projects of Florida’s electricutilities and other industry representatives.
The costs per kWh provided below are levelized costs. These calculations include: capital costs,allowed return on investment, fuel costs, and fixed and variable O&M costs over the expected lifeof the generating unit. A levelized annual cost is calculated by converting booked costs into aconstant annual cost with the same present value as the actual annual capital revenue require-ments. Levelized costs per unit of energy are then determined by dividing the annual levelizedcost by the estimated energy produced each year.
Levelized costs are a useful tool for comparing alternative generating technologies in some cir-cumstances. However, in Florida’s current regulatory environment, some entities have the au-thority to price wholesale energy sales at whatever the market will bear, rather than on the costs toproduce the energy. Therefore the final impact on customer rates will be determined not just bythe cost to produce the energy, but by the price a utility must pay for the energy. However, in mostcases, an investor owned utility must calculate customer rates for energy produced by its owngeneration based on costs, using a revenue requirements calculation. In simple terms, this calcu-lation provides for a regulated utility to recover all prudently incurred costs of the resource, plus anallowed rate of return on the capital investment. Certain purchased power contracts must also bebased on costs. Pursuant to PURPA, the payments to qualifying facilities are determined basedon the cost of the utility’s next planned generating unit, commonly referred to as the utility’s avoidedcost.
Costs for Traditional TechnologiesAs a benchmark of comparison, Table 7 (page 42) provides estimates for the construction andoperation of both coal-fired and natural gas-fired, utility size, baseloaded power plants. These areassumed to be greenfield plants located at a central Florida location.
Currently, due to the lower capital costs and modular construction schedules, natural gas com-bined-cycle generators are the preferred, traditional technology choice. While they have lower
19 Cruz, Dr. Robert D., The Washington Economics Group, The Potential Economic Benefits of a RenewablePolicy Standard for Florida, Presentation to the Florida Public Service Commission at the August 28, 2002Renewables Assessment Workshop.

T A B L E 7
capital costs, the fuel component is subject to greater volatility. Conversely, a new coal unit hashigher capital costs but more stable fuel costs. The most recent utility planning documentsillustrate the utility preference for natural gas-fired plants. Over the next ten years, some 13,680MWs of new capacity will be added in Florida (exclusive of repowering at existing sites). Of thisamount, 97 percent will be gas-fired and only 3 percent will be coal-fueled.20
To ensure that comparisons can be made between traditional technologies and non-traditional,renewable technologies a levelized cost analysis is required. While capital and O&M costs arewell documented for these traditional plants based on extensive utility experience, it is the fuelcost that is more problematic for benchmarking. To develop total levelized cost, some projectionsof future fuel costs must be incorporated. For this exercise, the natural gas and coal forecasts fordelivered prices used as inputs for the fuel costs were taken from the DOE/EIA Annual EnergyOutlook 2002. The DOE/EIA forecasts projected natural gas to increase at 2.2 percent per yearover the thirty year time frame for the analysis. Coal prices are projected to decline from $1.35 permillion BTU in 2002 to $1.12 in 2020. For purposes of the analysis, the last coal price was heldconstant from 2020 to 2032. As a sensitivity, a high band scenario was used with natural gasprices escalating at 4.4 percent annually and coal escalating at 2.0 percent annually. The resultantproduction costs for traditional generation are portrayed in Table 7.
BiomassDirect Combustion
According to the U.S. National Renewable Energy Laboratory, there are more than 350 biomasspower plants in the U.S. today, with over 7,500 MW of capacity, enough to serve several millionhomes. Currently, most biomass plants use direct combustion technology. Direct combustionsystems are similar to fossil-fuel fired power plants, and replace fossil-fuels with biomass to pro-duce steam. Stand-alone biomass generators can be made available for dispatch by utilities,providing energy at peak periods of demand when it is most needed.
P R O D U C T I O N C O S T S F O R
Traditional TechnologyCOMBINED CYCLE PULVERIZED COAL
Plant Capacity 514 MW Net 446 MW NetPlant Heat Rate 7,000-7,800 btu/kWh 9,979-12,4631 btu/kWhCapacity Factor Baseload BaseloadCapital Cost $565 per kW $1268 per kWFixed O&M $6.17 per kWyear $14.89 per kWyearVariable O&M $3.59 per MWh $3.92 per MWhLevelized Cost 3.9 - 4.4¢ 5.2 - 5.5¢
42
20 Review of the Electric Utilities 2001 Ten Year Site Plans, Florida Public Service Commission, December,2001, p. 8.

Florida may have an advantage over many states in the availability of waste biomass, as well asthe ability to grow biomass crops for closed-loop biomass systems. The state’s growing populationcreates an increased need for construction and road development. Waste from this construction,along with the state’s nine paper mills, timber industry, and agricultural processing plants providesa steady stream of biomass which can be used as fuel. Florida’s extended growing season alsoincreases the feasibility of producing crops such as switchgrass and eucalyptus strictly to be usedas fuel. Forested land is most prevalent in the Northern region of the state, which implies a higherpotential for the use of wood waste to fuel electricity generation in this portion of the state. Theestimated quantity of Florida’s wood waste which is currently used to fuel electric generationranges from 10 to 25 percent.
As in any application of biomass, fuel costs can vary widely depending on the fuel source, quality,and transportation requirements. The ability to obtain low cost fuel is critical in achieving a cost-effective biomass energy source. Waste biomass is typically less costly than crops which aregrown specifically for fuel, although the cost of such crops can be reduced if the most productivecrop for a specific site is chosen. The quality of biomass fuel is also key to achieving generationefficiency and reduced O&M costs. While the avoided disposal cost can reduce the initial cost ofwaste biomass, all biomass must be prepared and transported prior to combustion. Preparationcosts are increased if a biomass waste stream: 1) must be sorted to remove potential contaminants;2) requires extensive shredding; or, 3) must be dried due to high moisture content. In addition,according to the National Renewable Energy Laboratory, the alkali content in certain forms ofbiomass can increase the cost of energy production by contaminating boilers and reducing efficiency.Biomass fuels have a low energy density relative to fossil-fuels, so much higher volumes of biomassmust be burned to achieve the same energy production. Therefore, transportation costs also playa vital role in determining the final cost of energy production. Estimates of the maximum distancebiomass can be transported cost-effectively range from 25 to 100 miles.
Due to the high cost of transport, the size of biomass generation plants is typically limited by thestream of biomass produced within the vicinity. The capacity of stand alone biomass plants isrelatively small, ranging from 10 to 50 MW, with the majority of plants under 20 MW. In general,such small capacity plants do not achieve the efficiency levels of much larger plants, becausehigh-cost efficiency measures cannot be economically justified with lower levels of energyproduction. Typical natural gas-fired combined cycle units can have twice the thermal efficiencyof stand-alone biomass units, with a heat rate of approximately 7,000 compared with a range offrom 13,000 to 15,000 Btu per kWh forstand-alone biomass technology. It followsthat the value of minimizing transportationcosts by deploying small capacity plantsmust be balanced against the loss ofgeneration efficiency associated with thesesmaller plants.
Black and Veatch provided Table 8, withcost and performance data for a 50 MWcapacity stand alone biomass plant usingurban wood waste as fuel. Fuel costs areestimated at 75 cents per MBtu.
Plant Capacity 50 MWNet Plant Heat Rate 13,500 to 15,000 Btu per kWhCapacity Factor 60 to 80 percentCapital Cost $2,000 to $3,450 per kWFixed O&M $50 to $70 per kWyearVariable O&M $6 to $10 per MWhLevelized Cost 6.3 to 11.8 cents per kWh
T A B L E 8
P R O D U C T I O N C O S T S F O R50 MW Biomass Generator
43

Questionnaire responses were received from the representatives of three stand alone biomassgenerators within Florida, with plant capacities ranging from 9 MW to 72 MW. Ages of the unitswere not provided. Cost and performance data is comparable to the Black and Veatch dataabove. Heat rates for the units ranged from 14,000 to 14,500 Btu per kWh, with capacity factorsof between 75 and 88 percent. However, the capital cost estimates provided of $1,000 to $1,650per kW, were substantially below the Black and Veatch estimates. Fixed and variable O&M costswere estimated at $20 per MW and $30 per MWh, respectively. Each of the three generators isdesigned to burn biomass waste. Costs to obtain fuel ranged from $0 to $10 per ton, with addedfuel costs of $.10 per ton mile. An estimated fuel cost of $1.40 per Mbtu was also cited.
Note, the assumed fuel cost for the calculation of levelized production cost was $.75 per Mbtu andrespondents provided a reported average of $1.40 Mbtu. In addition, information was supplied tothe authors by Fred Beck of the Renewable Energy Policy Project. Table 9 provides a supplycurve for biomass materials. This table includes wood waste, switch grass production, and someagricultural waste.21 While the delivered cost per Mbtu is competitive with fossil fuel costs, recallthat the more efficient heat rates in utility fossil fuel generators provide a lower production cost perMWh.
A study by the Washington Economics Group was provided to the Commission which evaluatedthe economic impact of biomass generation on the Florida economy. The study compared thecost of generating power using biomass with the cost of using natural gas fuels and analyzed theflow of expenditures for the two alternatives. A key finding in the study is that over 85 percent ofthe dollars spent to operate a typical biomass plant are spent in Florida. By contrast, the studyconcluded that over 85 percent of the dollars spent to operate a typical state of the art, gas firedcombined cycle unit are spent outside of Florida, mostly in the form of fuel expenditures.
Co-firing Biomass Solids in Existing Coal UnitsCo-firing biomass feedstock in existing coal units appears to be a relatively low cost and low riskmethod to increase the use of biomass fuels in Florida. U.S. Department of Energy states that co-firing “is the most economic near-term option for introducing new biomass power generation,” andin some cases, co-firing can actually reduce energy production costs at existing coal plants.
T A B L E 9
21 Post workshop comments of Fred Beck, Renewable Energy Policy Project, November 14, 2002.
44
Florida Biomass Fuel Supply Curve ($1999)FUEL COST
($/Mbtu)WOOD RESIDUE
(bone dry tons)ENERGY CROPS
(bone dry tons)
248,9951,092,2471,333,8821,351,6021,381,1361,422,484
TOTAL(bone dry tons)
248,9951,092,2471,333,8821,845,1072,661,0612,783,909
493,5051,279,9251,361,426
$.50$1.00$1.50$2.00$2.50$3.00

According to DOE, “A typical existing coal fired power plant produces power for about 2.3 centsper kWh. Co-firing inexpensive biomass fuels can reduce this cost to 2.1 cents per kWh.” DOEreports that co-firing compares favorably to stand-alone biomass plants, which it estimates havean average energy cost of 9 cents per kWh. Co-firing takes advantage of the high efficiencylevels of coal generators, leading to a conversion of biomass to energy in the 33 to 37 percentefficiency range, an over 30 percent increase in efficiency compared to stand-alone biomassplants. Capital costs per kW appear to be significantly lower for co-firing compared to stand alonebiomass plants. Co-firing also reduces coal usage and the associated sulfur dioxide and nitrogenoxide emissions. This can provide a revenue stream from sulfur dioxide emission allowances,partially offsetting the increased capital and O&M costs of co-firing. However, co-firing may resultin reduced unit efficiency, and reduce the long-term effectiveness of selective catalytic emissionreduction devices. Co-firing may also reduce the marketability of the ash resulting from thecombustion process because, in many cases, the ash can no longer be used in the production ofcement.
The data from co-firing tests within Florida indicate that DOE’s estimate of reduced costs resultingfrom co-firing are overly optimistic. For co-firing to compete favorably with coal on a cost basis,the fuel savings from inexpensive biomass, dumping (or tipping) revenue, and emission allowancerevenues must offset the increased capital and O&M costs. The data provided by workshopattendees and questionnaire responses indicates that the actual capital costs necessary for efficientfuel processing and increased O&M costs due to added labor and plant maintenance, may offsetany savings attributable to low-cost biomass.
Tampa Electric Company (TECO) provided information on its co-firing test at the Gannon station.TECO’s Gannon Unit 3 has a net summer rating of 152 MW, and is permitted to burn up to fivepercent biomass fuel by weight. Wood waste was obtained from Consolidated Resource Recovery,a contractor for Hillsborough County Solid Waste, for prices ranging from $16 to $20 per ton. Aone percent blend of biomass at Gannon Unit 3 requires approximately one ton of biomass perhour. The average quality of the fuel was 5,600 Btu per pound, or 0.9 MWh per ton. TECO hasburned 793 tons of biomass at the site, resulting in 690 MWh of biomass derived energy. Tominimize the impact on the unit’s reliability and availability, TECO limited biomass input to a rangeof one-half to two percent of fuel input. The unit is capable of accepting biomass pieces up to 2inches in size. TECO experienced some pluggage in the fuel chutes which required operatorintervention, due to the introduction of oversized biomass pieces. TECO also noted that the unit’sboiler was subject to overpressure conditions, due to a large bulk of biomass in the coal feeder.TECO found that co-firing was highly labor intensive, requiring added labor and equipment foroffloading, fuel sampling, handling, and obstruction removal. Due to the added labor costs, higherfuel costs, and special equipment required, TECO estimates that the cost to produce energy fromco-firing with biomass were approximately 50 percent higher than for coal fired generation. TheGannon station will no longer be available for co-firing after 2003 when the unit will be re-poweredto burn natural gas rather than coal.
One additional questionnaire response was received for a biomass co-firing project, with a netcapacity rating of 300 MW. The project expects to produce energy from 45 MW of the plant withlocal biomass waste. Capital costs are estimated at $1,500 per kW, with fixed and variable O&Mof $10.00 per MW and $5.00 per MWh, respectively. Fuel costs are estimated at $1.5 to $2.0 perMbtu (million btus).
45

Gasification of Biomass SolidsBiomass gasification systems convert biomass into a gas in a high temperature, oxygen-starvedenvironment. This gas can then be converted to energy using various technologies, such as gasturbines or reciprocating engines. According to the Biomass Development Company (BDC),biomass gasification will be the preferred method in the future for increasing biomass usage byco-firing in existing coal- and oil-fired boilers. BDC stated that co-firing with this gas reducesmany of the problems associated with co-firing with biomass, including efficiency reductions dueto boiler fouling. This implies that a higher percentage of biomass can be co-fired if it is firstconverted into a gas.
Tampa Electric Company provided information on its co-firing experiment at the Polk Unit 1 inte-grated gasification combined cycle (IGCC) generator. IGCC technology first converts solid fuels,such as coal and petroleum coke into a clean burning gas, which is then used to fuel a combinedcycle generating unit. TECO has recently conducted a test of the costs and operational charac-teristics of adding biomass to the fuel mix at Polk Unit 1. The closed loop biomass crop is a cropof eucalyptus trees planted by Common Purpose, Inc. Ten percent of the crop (60 trees) wasfelled and processed in December 2001, producing 8.8 tons of material with the consistency ofcoarse sawdust. Although the harvesting and processing of the crop was labor intensive on anexperimental basis, large scale harvesting and processing would substantially reduce the cost perton of biomass. One ton of eucalyptus has approximately half the Btu content of one ton of coal.The fuel provided 1.2 percent of the unit’s fuel needs over an 8 and a half hour period, generatingapproximately .860 MW of power or 7.31 MWh of energy during the test period. TECO stressedthat the biomass feeding process used was highly labor intensive. TECO did not provide esti-mates of the increase in labor costs. TECO estimates that an automated fuel handling system,which would reduce labor requirements, would cost between $1.5 and $2 million. Fuel quality isalso key to the success of the gasification effort. TECO experienced problems with pluggageduring the gasification process, due to introducing oversized pieces of the biomass. This canresult in reduced efficiency of the gasification system, increasing the costs of fuel production.TECO believes that an increase in the percentage of biomass introduced to the unit could result inreduced efficiency of the unit on an ongoing basis.
Municipal Solid WasteMass Burn MSW Technology
According to Integrated Waste Services Association, Florida currently has over 500 MW of MSWdirect combustion capacity installed. These facilities provide disposal for over one-third of Florida’swaste. The primary driver behind a municipality’s decision to install a MSW facility is the disposalof waste, due to dwindling landfill space. The generation of electricity is a secondary consider-ation.
MSW can be converted to energy with numerous technologies. The costs of energy producedvary depending on the technology used to convert the MSW to electricity, and the avoided cost ofdisposal. The degree of processing of MSW to be used as fuel is also dependent on the conver-sion technology used.
46

Black and Veatch provided Table 10 whichlists typical ranges of performance andcosts for a facility directly burning 2,000tons of waste per day.
Questionnaire responses were receivedfrom the representatives of 12 operatingdirect combustion MSW generators withinFlorida, as well as one potential site. Netsummer plant capacity ratings of the unitsranged from 10 MW to 75.5 MW. Mostquestionnaires indicated that it istechnically feasible to dispatch the unit.However, several cited contract provisionswhich currently prevent the unit from beingdispatched, or make it uneconomical forthe generator to do so. Only one of theresponses included cost data, citing a$6,500 per kW capital cost. Performance
22 David R. Wentworth, Energy Developments, Ltd., Landfill Gas to Electricity Development in the State ofFlorida. Presentation at the FPSC Staff Renewable Assessment.
T A B L E 10
P R O D U C T I O N C O S T S F O R50 MW MSW Generator
Plant Capacity 50 MWNet Plant Heat Rate 16,000 Btu per kWhMSW tons per day 2,000Capacity Factor 60 to 80 percentCapital Cost $2,500 to $4,600 per kWFixed O&M $100 to $175 per kWyearVariable O&M $25 to $50 per MWhLevelized Cost 3.5 to 15.3* cents per kWh
This assumes a $25 per ton tipping fee. Informationpresented by Integrated Waste Services Associationindicates that for Florida plants a $50 per ton fee ismore typical and thus production costs could becloser to 2¢.
data is comparable to the Black and Veatch data above. Heat rates for the units ranged from13,300 to 18,000 Btu per kWh, with capacity factors of between 78 and 95 percent. MSW plantshave negative fuel costs in that they are paid to take waste materials. Each respective municipalitypays a tipping fee to the generator to deliver MSW. One response provided a fuel cost of negative$4.23 per Mbtu, indicating a tipping fee is received by the generator from the municipality.
Landfill GasLandfill gas is one of the more mature options for obtaining energy from municipal wastes. Manylandfill sites within Florida already have gas collection technology installed in order to meet Fed-eral Clean Air and New Source Performance Standards. Energy Developments, Ltd., stated thatfor every 1 million tons of municipal solid waste in a landfill, enough gas is produced to fuelapproximately 1 MW of generating capacity, yielding about 8,500 MWhs.22 The capital costs forlandfill gas projects is dependent on site characteristics, the conversion technology used, and theextent of the collection systems already in place. However, according to Black and Veatch, thepayback period for landfill gas sites is often between 2 and 5 years. Capacity factors can varygreatly depending on the technology used to convert the landfill gas into electricity. Data providedby workshop participants and on questionnaire responses indicates that landfill gas projects arenot available for utility dispatch.
47

Black and Veatch provided Table 11, withcost and performance data for a 10 MWcapacity landfill gas internal combustionengine. Gulf Power provided energy costsof from 5.0 to 6.5 cents per kWh for Floridalandfill gas conversion, which mirrors theinformation for the generic project providedin Table 11.
Energy Developments, Ltd. provided costand performance data on the conversionof landfill gas to energy with reciprocatingengine generator sets. These facilities are
T A B L E 11
P R O D U C T I O N C O S T S F O R10 MW Landfill Gas Engine
Plant Capacity 10 MWNet Plant Heat Rate 8,500 to 13,000 Btu/kWhCapacity Factor 60 to 80 percentCapital Cost $1,000 to $1,725 per kWFixed O&M $1.00 to $1.35 per kW yearVariable O&M $6 to $20 per MWhLevelized Cost 2.4 to 6.3 cents per kWh
located at landfill sites and are interconnected to the regional transmission grid. Net capacityratings for the units are approximately 2.3 to 3.5 MW, with a capacity factor of 90 percent. Capitalcosts range from $750 to $1,250 per kW, with fixed O&M costs of from $9 to $11 per MWh.Similar units provide energy from up to 9 megawatts of capacity in Florida. This data is confirmedby the questionnaire responses received for similar operating landfill gas conversion systems,and one potential site. Energy Developments also stressed that landfill gas facilities can beplaced in service in a relatively short time, from 9 to 18 months.
The Orlando Utilities Commission (OUC) also provided data on a co-firing landfill gas operation inOrange County, Florida. Orange County collects the gas from a 200 acre waste site. The gas isthen delivered to OUC to be co-fired in either of its coal-fired boilers at the Stanton Energy Center.Stanton burns approximately 5,200 Mcf of gas per day, which provides a 3 percent reduction incoal burned at the units, and provides electricity for 10,000 homes. OUC estimates that the costsavings are $1.25 million per year, based on the cost differential between landfill gas and coal.OUC stated that there are also indirect savings due to reduced coal handling costs and environ-mental treatment costs. OUC also received $4 million in federal funding and tax incentives todevelop the co-firing project.
Gasification of Municipal Solid WasteMSW may also be converted to a synthesis fuel gas, or syn-gas. This technology is less devel-oped than direct combustion or landfill gas processes for MSW. As in direct combustion technolo-gies, costs will be highly dependent on avoided landfill costs. Brightstar Environmental providedinformation on its design for a solid waste and energy recycling facility. The facility serves a dualpurpose of capturing additional recyclable material, and converting the remaining organic wasteto a syn-gas. This syn-gas can then be converted to electricity in a variety of ways, such as co-firing in an existing gas plant. The system is modular and can be designed to fit the wastemanagement needs of any size community. In 2001, Brightstar Environmental began commercialoperation of its first solid waste and energy recycling facility located in Wollangong, New SouthWales. The unit processes 150,000 tons of MSW annually, resulting in enough syn-gas to power15 MW of reciprocating generator sets. These generators are subject to utility dispatch. The syn-gas is combusted in reciprocating engine generator sets to produce electricity. Brightstar expectsthe facility to achieve over a 90 percent capacity factor. Brightstar did not provide cost data for thefacility.
48

Geothermal EnergyGeothermal generating units are powered with steam produced from hot water reservoirs deepbeneath the earth’s surface. Geothermal generation is limited to those areas of the country withgeothermal reservoirs. According to the National Renewable Energy Laboratory, most of thegeothermal reservoirs in the United States are located in the western states, Hawaii, and Alaska.As is to be expected, costs for geothermal units are highly dependent on site characteristics, dueto the depth of the geothermal reserves, the geological characteristics of the site, and the numberof exploratory wells which must be drilled. Geothermal energy is not a viable option for Florida asthere are no known geothermal reservoirs within the state. Therefore no specific cost data for thistechnology is provided.
Solar EnergyPhotovoltaics
Capital and installation costs for PV systems are quite high, and in general, appear to be thehighest on a per kW basis of all currently developed renewable technologies feasible for meetingpart of Florida’s energy needs. However, in certain cases, PV may actually be the least costoption, such as for isolated homes or lighting applications, which would require high transmissioncosts to be connected to the power grid. Capital cost estimates provided were similar acrosssources, while O&M costs varied widely. Without the addition of energy storage capacity, PVsystems cannot provide dispatchable energy to meet the grid’s needs during periods when solarenergy is not available. As expected, the solar energy produced from a PV system begins in themorning and peaks in late afternoon. While these hours coincide with the summer peak hours forthe utility system, there is little coincidence with winter peak hours. Thus, it is difficult to assignfirm reliability value to these systems. The addition of battery storage capacity to a PV system canalleviate this issue, but will add additional capital and O&M costs.
The National Renewable Energy Laboratoryestimates that efficiency levels of PV systemshave risen from 4 percent in the 1950’s, toover 15 percent today. This increase inefficiency has significantly reduced the costsper unit of energy produced. Current capitaland O&M costs vary widely depending onthe PV system design. Black and Veatchprovided Table 12, with cost andperformance data for a fixed tilt, singlecrystalline photovoltaic system.
T A B L E 12
P R O D U C T I O N C O S T S F O RFixed Tilt PV System
There were a variety of sources for current data on installed solar cost. The U.S. Department ofEnergy and the solar industry have set a goal of reducing installed PV costs to $3,000 to $4,000per peak kW by 2010 and $1,500 per peak kW by 2020. (PV industry road map). Currently, theFSEC PV Database reports that the average total installed cost for a grid-connected PV systemin Florida is $9,720 per peak kW. This is based on data collected from 114 systems. Costs varygreatly, however, depending on the level of equipment customization and dealer/installer markup. For instance, the City of New Smyrna Beach installed the majority of their PV systems for$5,760 per peak kW, which were packaged designs using standard roof mounting hardware,
Plant Capacity .01 to 10 MWCapacity Factor 20 to 22 percentCapital Cost $3,600 to $8,050 per kWFixed O&M $5.7 to $8.2 per kW yearVariable O&M $0.5 to $1.5 per MWhLevelized Cost 19.4 to 47.4 cents per kWh
49

while JEA experienced an average installed system cost of $12,400 per peak kW, using customsystem designs and mounting hardware. The Florida Solar Energy Center has compiled morethan one year of unscheduled maintenance data. The majority of maintenance events involvedinverter reliability problems (63 percent). Once inverter technology has been improved, FSECpredicts that there will be relatively few unplanned maintenance events for grid-connected PVsystems. More detailed O&M information for grid-connected PV systems may be found on theFSEC PV database at www.fsec.ucf.edu/pvt.
Florida Power Corporation (FPC) provided preliminary cost and performance data from a re-search effort on the operation of PV systems in manufactured homes. FPC has installed PVsystems with capacities ranging from .8 kW to 1.3 kW in six Palm Harbor manufactured homes.These homes will be monitored for at least one year, providing FPC with more detailed informa-tion on system performance, and O&M costs. FPC noted the benefits of installing PV systems onnew homes, rather than retrofitting existing homes. This allows a manufacturer to streamline theinstallation process by adding structural changes necessary to support the PV system, as well aswiring upgrades. FPC estimates that installation cost savings of approximately 50 percent can beachieved if PV systems are placed on new, rather than existing manufactured homes. Totalsystem costs, including installation costs, have averaged $7,000 for an 1.08 kW PV system, or$6,480 per kW, on new manufactured homes. These systems have produced an average of 3kWh per day. FPC calculates the cost per kWh at 31 cents over the life of the unit, if only start-upcosts are included. However, FPC has experienced problems with inverter reliability. Since theseare prototype units with the attended higher startup costs, one could reasonably expect massinstallation to lower the per unit costs.
JEA currently has 162 kW of PV capacity installed on public high schools and many of JEA’sfacilities. JEA reports total up-front system costs, including installation costs, of $12,400 per kW.JEA attributes this high cost largely to structural considerations due to high wind loading designrequirements.
Six questionnaire responses regarding PV projects in Florida were received, with aggregate ca-pacities ranging from 2 kW to 218 kW. Capacity factors for the systems without battery storageranged from 15 to 25 percent, while one project with battery storage cited a capacity factor ofapproximately 90 percent. Capital and installation costs for the Florida PV systems were higherthan those estimated by Black and Veatch, ranging from $7,000 to $17,000 per kW. Little infor-mation was provided on O&M costs.
Solar ThermalIt appears that solar thermal generationapplications have lower capital costs on a perkW basis than photovoltaic systems. Ingeneral, solar thermal systems have a highercapacity factor than PV systems.
Black and Veatch provided Table 13, with costand performance data for an 80 MW capacityparabolic trough solar thermal plant.
T A B L E 13
P R O D U C T I O N C O S T S F O R80 MW Solar Thermal Unit
Plant Capacity 80 MWCapacity Factor 34 percentCapital Cost $2,700 to $4,600 per kWFixed O&M $24 to $46 per kW yearVariable O&M $3 to $5 per MWhLevelized Cost 10.8 to 18.7 cents per kWh
50

Wind EnergyUnited States Department of Energy data indicate that the cost of wind energy production incertain regions of the U.S. has dropped from 80 cents per kWh in 1979, to a range of 4 to 6 centsper kWh in 2000. These cost reductions are primarily attributed to increased turbine size, re-search and development advances, and manufacturing improvements. Wind energy projects arealso eligible to receive a U.S. federal production tax credit. The credit is currently 1.7 cents perkWh and escalates on an annual basis to account for inflation.
However, wind energy production efficiency and therefore the cost per kWh, are highly dependenton the wind velocity at a site. Gulf Power provided estimates from the EPRI Renewable TAGdocument which indicate that capacity factors of wind turbines vary from approximately 5 percentto 40 percent depending on wind velocity. A wind speed of approximately 35 miles per hour pro-vides a capacity factor of 35 percent at a cost of 8 cents per kWh. However, Florida’s average on-land wind speed is 12 to 14 miles per hour, which translates into a 5 percent capacity factor at acost of 57 cents per kWh. U.S. DOE data indicates that the potential for offshore wind energydevelopment is also low for Florida. Therefore, given current wind turbine technology, Florida’swind resource is not sufficient to produce economical power. Workshop participants identifiedCape Canaveral as the only site within Florida with wind energy potential.
Hydroelectric PowerHydroelectric power is considered to be a mature renewable technology. Capital costs forhydroelectric projects are generally high and vary widely by site. Specific site information is generallyneeded to provide estimates of unit size, performance, and costs. Capacity factors can also varywidely by site. Capacity factors for the same site may also vary throughout the year, due tochanges in rainfall and temperature. Due to the seasonal nature of energy produced from a givenlevel of capacity at these facilities, additional capacity may be needed in order to maintain reliabilitygoals.
As noted previously, Florida currently has two hydroelectric facilities. There was a general level ofagreement at the Commission’s workshops that Florida does not have the potential for additionallarge capacity hydroelectric facilities. However, a representative of Black and Veatch reportedthat practical options do exist for some increase in hydroelectric capacity within the state. Theseoptions include utilizing existing dams, and unit upgrades on existing systems. Capital costestimates vary from $1,300 to $5,980 per kW. The lowest cost options involve upgrades at existingsites, with levelized cost estimated at from approximately 2 to 4 cents per kWh. Levelized costsfor new facilities may range from 4 to 14 cents per kWh. No reliable cost estimates specific toFlorida sites were provided.
Ocean EnergyOcean Mechanical or Ocean Current
Future potential exists for the conversion of the Gulf Stream current to create energy. However,the necessary technology appears to be in the early stages of development and specific cost andoperating characteristics cannot be provided at this time.
51

Currently, multiple separate but similar ocean turbine designs are in development. A representa-tive of Florida Hydro reports that he has developed a working model of an open center turbine,which can use the energy of the Gulf Stream ocean currents to drive a generator. The electricityproduced would be delivered to shore using a buried cable. The model is ten feet in diameter, butthe proposed commercial units would be 46 feet in diameter, requiring deep water for installations.The developer estimates that the first production model could be built within the year with a capitaloutlay of $1 million.
Testing of various ocean turbine technologies has occurred since the 1980’s with limited degreesof success. However, a representative of Black and Veatch reports that encouraging data hasbeen collected from a test site of an ocean turbine design similar to the Florida Hydro unit off thecoast of England.
Ocean ThermalOcean thermal technologies use variations in ocean temperature for many applications, includingthe generation of electricity. Ocean thermal generation technology is still in the developmentalstages; however, capital costs are expected to be relatively high. As in ocean current generation,ocean thermal systems may also have high associated transmission and O&M costs. Tropicaland subtropical areas appear to have the highest potential for economic ocean thermal genera-tion. Several 50 to 200 kW demonstration projects are under way in Hawaii. Black and Veatchestimates levelized costs for typical ocean thermal systems of 10 to 22 cents per kWh. However,no estimates of the potential for ocean thermal generation along the Florida coast were providedin the Commission’s workshops or in response to the questionnaire.
Waste HeatQuestionnaire responses were received from the representatives of several existing Florida phos-phate operations, with a total generating capacity of 430 MW. Cost and operational data was alsoprovided for additional potential sites. Plant capacities of existing sites ranged from 10 MW to 60MW, with capacity factors of between 60 and 80 percent. Heat rates for the units are not availablenor are they especially meaningful because the process does not consume fossil fuel. However,because waste heat is used to produce electricity and thermal energy for process use, waste heatcogeneration is very efficient. Capital costs were estimated at $1.4 million per MW. Fixed andvariable O&M costs, which are very low, are difficult to estimate as the conversion of waste heatto steam and electricity is responsible for only a very small portion of the total fixed and variableO&M costs for a fertilizer plant. There are no fuel costs for the process.
HydrogenHydrogen can be used as a fuel in various applications including fuel cells and in a traditionalboiler. Costs are expected to vary widely depending on fuel production methodologies andgeneration technologies. Several participants in the Commission’s workshops stated that thelong term potential for energy generation fueled by hydrogen is high. However, this industry is notfully developed. Many steps must be taken in Florida before this fuel source can be used to meeta significant part of the state’s energy needs. Further developments in hydrogen conversion,storage technologies, and industry infrastructure must take place before hydrogen can competeon a cost basis with other fuels. Due to the early stage of development of this industry, and theexpected wide variations in costs for various fuel conversion and generation technologies, noreliable cost data is available at this time.
52

53
C H A P T E R I V
POLICIES and MECHANISMSTO PROMOTE RENEWABLES
Vertically integrated electric utilities that operate under the regulatory authority of public servicecommissions generally have a continuing obligation to obtain generating resources that providesafe, reliable service at the lowest possible cost. Utilities in states that have allowed retail accessfor customers are forced by competition to add similarly defined resources. In either instance,recovery of costs for providing electric services are disciplined either by regulatory oversight ormarket competition. With the exception of hydro resources, renewable energy is not generally theleast cost resource addition. Therefore implementing significant additional renewable generationcapacity is not compatible with the goal of minimizing electric rates. Utility reluctance to implementrenewable technologies may be further exacerbated by the emerging competitive environment inthe electric market, which has intensified the importance of the possible rate impacts. Becauserenewables are not currently cost competitive, significant additional renewable generation will notbe implemented without additional incentives or regulatory changes.
A variety of incentive programs have been devised by government and industry representatives topromote the addition of more renewable resources. There are at least three strategies that havebeen adopted to encourage renewable energy: market driven programs, financial based incen-tives, and renewable energy purchase mandates. These programmatic approaches generallyreflect a continuum from least prescriptive to most prescriptive. Market driven incentives includeprograms like green power pricing and tradeable renewable energy certificates, which largely relyon customers’ desire to differentiate the type of electricity they purchase. In addition, states canfacilitate the introduction of renewable technology into the market place by removing institutionalor legal barriers to the installation of these technologies. For example, states can remove taxsubsidies for conventional energy technologies, grant legal access rights to direct sunlight, orprovide credits in building codes for the installation of specified equipment.
Financial based incentive policies include tax-credits, production payments, rebates, and subsi-dized loans. Such programs can be funded through tax incentives, general revenue, or dedicatedfunding sources such as system benefit charges (SBC). SBC programs typically impose a fee onall customers’ bills to directly fund certain defined programs.
Finally, the most prescriptive approach to encouraging greater utilization of renewables is by useof governmentally mandated resource acquisition levels. These are generally called renewableportfolio standards (RPS). Under RPS mandates, companies that generate electricity or utilitieswho purchase electricity for resale are required to either produce or purchase a prescribed per-centage of the product from approved renewable resources. These strategies are discussed inmore detail below.

54
Education EffortsOne of the first concerns of any organization that initiates programs to encourage renewables isthe need for consumer education and outreach. Because many of these technologies are rela-tively new to consumers, broad public acceptance may require some upfront efforts to make thepublic familiar and more accepting of these technologies. While some renewables probably havesome inherent public attractiveness - solar comes to mind - others are not cloaked with such ahigh level of immediate acceptance. Education efforts could help make the siting and construc-tion of some of these technologies easier. In addition, for some programs that are directlytargeted to consumers, education would be needed in order to successfully market renewableprograms.
While most utilities conduct their own marketing campaigns to solicit customers to participate incertain renewable programs such as green pricing programs, it might be more effective ifcollaborative approaches were considered. Such advertising strategies might include multipleutilities targeting their campaigns or use of a third party agent that perhaps would be viewed moreimpartially, such as a public or private sector agency.
Market Driven ProgramsGreen Pricing Programs
Some utilities offer green pricing programs to allow their customers to purchase “green” powerwhich adds renewable energy to the utility’s energy mix. Since current renewable energy sourcesare often more expensive than electricity generated from traditional methods, these green pricingsolutions offer consumers the option to pay extra for clean energy. Essentially, green powerpricing programs create an “end user” or consumer market for clean energy with the option ofpaying a premium for that product. In a typical green pricing program, a ratepayer who volunteersto participate would pay either a specified dollar amount or percentage in addition to his/her bill.These funds are then used by the utility to acquire additional renewable capacity which would nothave otherwise been included in the utility’s least cost resource planning process. While thephysical characteristics of the electrical system prevent the consumer from receiving only electricitygenerated by renewable resources, the portion funded by the consumer is added to the utility’soverall resource mix.
However, experience to date indicates that while a substantial number of customers express awillingness to purchase premium priced renewables, once the program is actually implemented amuch smaller percentage of customers actually enroll in the program. In addition, administrationand marketing expenses can take a substantial portion of any renewable funds collected. Theadvantage remains, however, that green pricing programs offer an alternative to imposed systemsbenefit charges for encouraging specific renewable energy fuel types. Further, unlike a systemsbenefit charge, which is assessed to all ratepayers, green pricing programs are only supported bythose consumers interested in advancing renewable energy projects. For this reason, greenpricing programs can result in increased utility and customer knowledge about renewabletechnologies and in increased utility investment in such technologies with minimum rate impactsfor the general body of ratepayers. Green pricing programs may also increase the loyalty ofcustomers who are interested in environmental issues. This may be one strategy electric utilitiesemploy to increase customer choice and differentiate their product.

55
Consumer Education: The National Renewable Energy Laboratory reports that market researchand the education of consumers is critical to the success of green pricing programs. Approximately30 percent of consumers typically indicate a willingness to pay a portion of the added costs ofincreased deployment of renewable generation sources. However, data from utilities offeringthese programs shows that average participation levels in green pricing programs are much smaller,ranging from less than one percent to three percent of eligible consumers.23 Several workshopparticipants, including a representative of the City of Tallahassee stated that customer researchindicates that customers may be predisposed to support solar energy over other renewablegeneration technologies.24 Such market research may be necessary to determine the specifictypes of renewable technologies, willingness to pay, and payment options favored by each utility’scustomer base. Gulf Power stressed the importance of designing programs to meet a utility’sconsumers’ preferences to increase the value of green pricing programs as well as participationlevels. However, success of green pricing programs is also dependent on a basic level ofunderstanding by consumers concerning the value of renewable technology options and the costof these technologies relative to fossil fuel generation. It may reduce education costs and increaseprogram participation if utilities join together in a broad based effort to educate Florida’s consumerson the basic characteristics, costs and benefits of renewable generation technologies. Florida’smunicipal utilities have already preliminarily engaged in such a program. (See the discussion ofSunSmart in Chapter V).
Payment Options: Two general methods have been suggested for setting a price premium cal-culated as a percentage of the program participant’s electric bill. The first, or “market approach,”sets the premium percentage according to an estimate of program participants’ willingness to pay,as indicated by a utility’s market research. The second approach, or the “planning approach,”sets the premium percentage according to the projected cost of the renewable resources requiredto fulfill the expected customer demand. As an alternative to obtaining funds by setting a premiumcalculated as a percentage of program participants’ bills, funds can be obtained by requestingdonations from customers. These donations may be a set dollar amount each month, or a one-time donation of an amount chosen by the consumer. These donations are often tied to a speci-fied kWh level. Monthly premiums and donations, rather than one-time donations, encouragegreater participation with less effort on the part of consumers. Administrative costs per dollarcollected may also be reduced if a green pricing program allows monthly premiums or donations.
Green Power Certification and Fuel Source DisclosureGreen pricing programs are often coupled with disclosure requirements such that utilities providetheir customers with additional information about the source of the energy they are supplying.This information often includes fuel mix percentages and emissions statistics. Fuel mix information,for example, can be presented as a pie chart on customers’ monthly bills. “Certification,” a relatedissue, refers to the assessment of green power offerings by government representatives or anindependent third party to assure that they are indeed using the type and amount of renewable
23 Policies and Market Strategies for Supporting Renewable Resource Development, Presentation by LoriBird of the National Renewable Energy Laboratory at the Florida Public Service Commission July 2, 2002Renewables Assessment Workshop.24 Implementing a Green Power Program in Tallahassee, Presentation by Gary Brinkworth of the City ofTallahassee at the Florida Public Service Commission August 28, 2002 Renewables Assessment Workshop.

56
energy as advertised. One example of green power certification is the Green-e stamp offered bythe Center for Resource Solutions. Both disclosure and certification are designed to help consumersmake informed decisions about the energy and supplier they choose. Indeed, disclosure is oftenthought of as a good policy to help educate customers about electricity and thereby to preparemarkets in advance of retail competition. It is worth noting, though, that two states that have notmoved ahead with retail choice, Florida and Colorado, have enacted disclosure provisions. Floridaprovisions disclose fuel mix but not emissions.
Contractor Licensing and Equipment CertificationMany states have rules regarding the licensing of renewable energy contractors. Contractorlicensing requirements typically have been enacted for solar water heat, active and passive solarspace heat, solar industrial process heat, solar thermal electricity, and photovoltaic. Theserequirements, where they do exist, are designed to ensure that contractors have the necessaryexperience and knowledge to properly install systems.
Statutes requiring renewable energy equipment to meet certain standards are generally seen asa tool for reducing the chance that consumers will be sold inferior equipment. Beyond being aconsumer protecting measure, equipment certification benefits renewables by reducing the numberof problem systems and the resulting bad publicity. Both licensing and equipment certification aredesigned to minimize fraud and help ensure a positive experience on behalf of consumers whopurchase solar equipment.
Solar and Wind Access LawsStates can also implement laws to provide for solar or wind easements or access rights. Easementsallow for the rights to existing access to a renewable resource on the part of one property ownerto be secured from an owner whose property could be developed in such a way as to restrict thatresource. This easement is transferred with the property title. Access rights, conversely,automatically provide for the right to continued access to a renewable resource. Solar easementsare the most common type of state solar access rule. Furthermore, some states prohibitneighborhood covenants that preclude the use of renewables. At the local level, communities usemany different mechanisms to protect solar access, including solar access ordinances, developmentguidelines requiring proper street orientation, zoning ordinances that contain building heightrestrictions, and solar permits.
Construction and Design PoliciesConstruction and design policies include state construction policies, green building programs,and energy codes. State construction policies are typically legislative mandates requiring anevaluation of the cost and performance benefits of incorporating renewable energy technologiesinto state construction projects such as schools and office buildings. Many cities are developing“Green Building” guidelines that require or encourage consideration of renewable energytechnologies. Some guidelines are voluntary measures for all building types, while others arerequirements for municipal building projects or residential construction. Local energy codes areused to achieve energy efficiency in new construction and renovations by requiring that certainbuilding projects surpass state requirements for resource conservation. Incorporating renewablesis one way to meet code requirements.

57
Financial Incentive ProgramsFederal Financial Incentives
While the regulatory mandates in PURPA helped to advance the investment in renewable energycapacity, the bulk of federal programs designed to encourage the use of renewable energy resourcesare financial incentives such as tax credits and production incentives. Beginning in 1978, theEnergy Tax Act (ETA) provided both residential and business tax credits for renewable energyequipment purchases. ETA offered residential energy income tax credits for solar and wind energyequipment expenditures at a rate of 30 percent of the first $2,000 and 20 percent of the next$8,000. For business expenditures, there was an income tax credit of 10 percent for investmentsin solar, water, geothermal, and ocean technologies.
Following the ETA, the 1980 Crude Oil Windfall Profits Tax Act (WPT) increased the ETA’s residentialenergy income tax credits for solar, wind, and geothermal technologies from 30 percent to 40percent of the first $10,000 in expenditures. The WPT also increased the ETA business energyincome tax credit for solar, wind, geothermal, and ocean technologies from 10 percent to 15percent and extended the credits from December 1982 to December 1985. Finally, the WPTallowed tax-exempt interest on industrial development bonds for the development of solid wasteto energy (WTE) producing facilities, for hydroelectric facilities, and for facilities producing renewableenergy. In 1986, the Tax Reform Act eliminated the tax-free status of municipal solid waste(MSW) powerplants and WTE facilities financed with industrial development bonds. The 1986Tax Reform Act also extended the WPT business energy tax credit for solar, geothermal, oceanthermal, and biomass property through 1988. The business energy tax credit for wind systemswas not extended and, thus, expired on December 31, 1985.
The next major tax provision affecting renewable energy was the Energy Policy Act of 1992 (EPACT).EPACT established a permanent 10 percent business energy tax credit for investments in solarand geothermal equipment and established a 10-year, 1.5 cents per kilowatt hour (kWh) productiontax credit (PTC) for privately owned, as well as investor-owned, wind projects and biomass plantsusing dedicated crops (closed-loop). When originally established, the PTC was available to windpower generators brought on-line between January 1, 1994 and June 30, 1999, and closed-loopbiomass power plants brought on-line between January 1, 1993 and June 30, 1999. In March of2002, a two year extension of the PTC was included for new wind, closed-loop biomass, andpoultry waste facilities. This new law extends the PTC from the end of 2001 to December 31,2003 and indexed the credit to inflation. The credit is currently 1.7 cents per kWh.
EPACT also instituted the Renewable Energy Production Incentive (REPI) which provides a 1.5cents per kWh incentive, subject to annual congressional appropriations, for generation frombiomass (except municipal solid waste), geothermal (except dry steam), wind, and solar from taxexempt, publicly owned utilities and rural cooperatives. Initial payments under the REPI programfor fiscal year 1994, totaled $638,120 and were distributed among four state-owned and threecity-owned facilities with a total of 42 million kWh. By fiscal year 1998, net generation eligible forREPI payments had reached 529 million kWh from 19 facilities at a price of $4 million. Finally, infiscal year 2000, REPI payments totaled $3.991 million.
It is important to note that while the generation eligible for REPI payments increased more thantwelvefold from 1994 to 2000, the number of facilities receiving REPI support increased only

58
threefold, and that increase occurred during the first three years of the program. This could haveoccurred because the 1.5 cents per kWh was not sufficient to overcome initial cost barriers tomarket entry or because of the uncertainty associated with the year-to-year congressional appro-priations.25
State Policy Support MechanismsIn addition to Federal incentives, states have many opportunities to use financial incentives as aninducement to encourage investment in renewable energy technology. Financial incentives availableto state governments include tax incentives, rebate programs, grant programs, low-interest loans,and industrial recruitment incentives. Generally, tax incentives encourage renewable energy andare designed to facilitate the purchase, installation, or manufacture of renewable energy systemsand facilities. These tax incentive programs serve to reduce the investment costs of acquiringand installing renewable energy systems and equipment, and reward investors with tax credits ordeductions for their support of renewable energy technology. Although tax incentive programsvary widely, the most common forms are income, corporate, property, and sales tax initiatives.With an income tax incentive, taxpaying state residents are offered an income tax deduction fromtheir adjusted gross income to cover the expense of installing renewable energy systems. Thistax deduction may have a time limit following the purchase of renewable energy equipment.Corporate tax incentives operate in much the same manner by allowing corporations to receivecredits against the costs of installing renewable energy equipment. Although tax incentives mayencourage investment in renewable energy equipment, investors who are unable to meet theinitial project funding demands will be unable to participate in many tax incentive programs. Somestates eliminate or reduce the sales tax on qualified renewable equipment. Finally, propertyassessments and millage rates can have a dramatic impact on the installation of renewableequipment especially for residential or small commercial firms. It was reported by the FloridaSolar Industry Association that in Florida the installation of a photovoltaic system will increaseproperty taxes more for a homeowner than the value of the electricity it produces.26
Appendix C provides a state-by-state identification of the programs in place to promote renewableenergy.
Direct Incentive ProgramsStates have a variety of mechanisms to offer direct financial incentives to customers to encouragethem to install qualified renewable technologies. These programs are generally funded directlyfrom state funds such as general revenue sources or from monies collected directly from utilitycustomers.
Regulated electric utilities have traditionally undertaken a set of “public purpose” programs inaddition to selling electricity. These “public purpose” programs typically include low-incomesubsidies, demand-side management and energy efficiency programs, industry-wide research
25 Energy Information Administration. Office of Coal, Nuclear, Electric and Alternate Fuels. RenewableEnergy 2000: Issues and Trends. February 2001.26 Solar Energy in Florida: Policy Aspects, Status and Potential of Solar Thermal and Photovoltaics,presentation by Colleen Kettles, Florida Solar Industry Association, July 2, 2002.

59
and development (R&D), and promoting renewable energy fuels. These activities have beenpossible due to government regulations which allow the utilities to recover program costs in theprices that they charge consumers. With the move toward a more competitive market for electricity,many of these programs are in jeopardy of being phased out as utilities face greater pressure toreduce costs. However, there is currently a debate over state policy mechanisms which canstimulate development in renewable energy technology, and other “public purpose” programs, inlight of these growing market forces. A System Benefit Charge (SBC) is one mechanism thatsome states have adopted to encourage renewables.
A SBC is typically a small fee placed on all consumers’ electricity bills which accumulates in adesignated fund. Most states that have passed electric industry restructuring legislation are usinga SBC to support renewable energy, energy efficiency, low-income customer programs, or otherpublic-good functions which the competitive market is unlikely to provide. The SBC is designed tobe competitively neutral, that is, paid by every customer regardless of who sells them electricity,and can be either assessed as a per kilowatt-hour fee or a flat fee per customer. The main benefitof a SBC is the ability to keep utility programs such as consumer education, demand-sidemanagement, and low-income customer assistance, often threatened under competitive markets.However, a SBC increases electric bills when the promise of competition and intent of restructuringlegislation is meant to decrease energy bills. Finally, while a SBC that is intended to support oradvance renewable energy is a very small part of the total electric bill, it may subsidize technologieswhich should be supported solely by the competitive marketplace.
Sixty-four percent of the states with active retail choice restructuring have implemented SBCprograms, while only fifteen percent of the states with no retail choice restructuring have foundthese initiatives necessary to maintain public benefit programs. The SBC charges range from aslow as .07 mills per kWh to a high of 3.76 mills per kWh.27 The absence of an SBC programshould not be interpreted as an indication that no public benefit programs are being offered in aparticular state. It is likely that such programs continue to be offered under the auspices of thevertically integrated and regulated utility framework.
Rebate ProgramsRebate programs are offered at the state, local, and utility levels to promote the installation ofrenewable energy equipment. The majority of the programs are available from state agenciesand municipally-owned utilities and support solar water heating and/or photovoltaic systems. Eli-gible sectors usually include residents and businesses, although some programs are available toindustry, institutions, and government agencies as well. Rebates typically range from $150 to$4,000. In some cases, rebate programs are combined with low-interest or no-interest loans.
Grant ProgramsStates offer a variety of grant programs to encourage the use and development of renewableenergy technologies. Most programs offer support for a broad range of renewable energy tech-nologies, while some states focus on promoting one particular type of renewable energy such aswind technology or alternative fuels. Grants are available primarily to the commercial, industrial,
27 A mill is 1/10 of a cent. Thus, 3.0 mills is equal to 0.3 cents per kWh. For Florida, with a typical electricbill of 1000 kWhs per month, a 3.0 mill fee would add $3.00 per month to the bill.

60
utility, education, and government sectors. Some grant programs focus on research and develop-ment, while others are designed to help a project achieve commercialization. Programs vary inthe amount offered, from $500 to $1,000,000, with some states not setting a limit.
Loan ProgramsAnother option available to state governments to encourage investment in renewable energytechnology is to offer low-interest loans to assist in the purchase of renewable energy equipment.By offering low-interest loans to individuals and organizations, states are able to encourage en-ergy efficiency and diversify the mix of generation fuels. These loans are typically offered toresidential, commercial, industrial, transportation, public, and non-profit organizations; and havefixed interest rates below the market rate with various repayment schedules. Benefits of low-interest loans include local control over the application process in defining the expected costs andbenefits from a specific project, and offering local governments, utilities, and independent powerproducers the opportunity to upgrade existing power facilities.
Research and DevelopmentAn important aspect of advancing renewable energy technology is the research and developmentprocess. Here again, private venture capital will invest in technologies with very high potentialpayoffs such as fuel cells or in technologies that have near term commercial applications such asjet engine developments. It is the longer term, high risk R&D that the private sector is mostunwilling to undertake. For this reason, direct government funding may be required to advanceR&D in certain sectors of the renewable industry. Grant programs designed to encourage theuse and development of renewable energy can be broad based covering all aspects of renewableenergy, or aimed at a specific technology such as wind technology or alternative fuels. Statefunding programs can also aim to maximize federal investments in Florida through matchingfunds and other innovative ways to combine state and federal funds to further promote renewableenergy. There are certainly issues of scope and scale where some research is so expensive,fusion is probably one example, that it would not be prudent for states to invest in this domain.The funding capability of multiple states through regional collaborations or perhaps better yet theFederal government, is best suited to undertake certain high cost, high risk type of projects.
Renewable Portfolio Standards (RPS)/Set AsidesRenewable Portfolio Standards (RPS) require that a certain percentage of a utility’s overall or newgenerating capacity or energy sales must be derived from renewable resources, i.e., one percentof electric sales must be from renewable energy in the year 200x. Portfolio Standards mostcommonly refer to electric sales measured in megawatt-hours (MWh), as opposed to electriccapacity measured in megawatts (MW). The term “set asides” is frequently used to refer to pro-grams where a utility is required to include a certain amount of renewables capacity in new instal-lations.
The recent development of RPS standards seems to be a result of the movement toward retailchoice around the country. Some 41 percent of states with active retail choice restructuring haveimplemented RPS programs, while only eleven percent of states without retail choice restructuringhave found these initiatives necessary. The specific amount of energy required by the RPSstandards varies from state to state. Arizona has a goal of 1.1 percent by 2007, while California

61
has a 20 percent goal by 2017. Maine has a 30 percent goal but already achieves this level dueto its abundant hydroelectric resources. Appendix B shows a map of the various states with RPSstandards and the mandated amounts.
The portfolio standard is designed to be competitively neutral, in that it imposes an equal obligationon any company selling electricity. However, this RPS requirement is usually designed as atradable obligation. That is, one company with more than the required amount of renewableenergy in its portfolio could sell credits to a company with a portfolio that was lacking those resources.While it is argued that RPS helps to diversify a state’s energy supply and promote environmentallybenign sources of electricity, it also raises energy costs to consumers for environmental benefitswhich often accrue outside the state. Additionally, although RPS may create a short-term marketdemand for infant technologies, this same demand may result in the transfer of wealth betweenstates with indigenous renewable resources and those that do not have such resources. Therefore,the geographic scope of permitted trading could be limited to Florida to minimize such impacts.
Tradeable Renewable Electricity Certificates (T-REC)A number of programs have been developed to implement renewable programs with respect toidentifying the production source and the ultimate customer of renewable energy. Such programsinvolve various certifications to ensure that the energy meets the definition of “renewable” or“green” as is appropriate for that jurisdiction. Since the physics of the electric grid does not permitany single customer to receive specific electrons, an accounting or tagging program is needed tofollow the renewable energy from a source to the sink. Tradable Renewable Electricity Certificates(T-REC’s) also known as TAG’s or simply as energy certificates is one such system. Thedevelopment of these programs is occurring in some states under government or quasi-regulatorybodies, under the initiatives of private marketing companies in response to regulatory programssuch as Renewable Portfolio Standards (RPS’s) and sometimes at very small, local corporatelevels when municipal power companies implement Green Marketing Programs.
Essentially T-RECs separate qualified renewable kWhs and separate them into two components— an energy component that is completely indistinguishable from other energy and anenvironmental or renewable attribute component. The energy flows over the grid as any otherelectrons, but the attribute certificate is a tradeable, financial instrument. Thus, people wanting topurchase renewable or green certified energy can purchase these and have assurance that theunderlying green power was actually produced somewhere. The drawback with using financialinstruments in lieu of actual in-state generation is that certain strategic energy objectives such asthe reduction in a particular fuel source or creation of certain employment numbers within a statemay not be achieved by use of tradeable certificates.
Policy DevelopmentThis chapter has provided a survey of programs both nationally and within Florida that have beeninitiated to increase the use of renewable energy resources. Each state has its unique set ofenergy issues and constraints and it is important for policymakers to define what objectives theywant to achieve in promoting one set of policies over another. For example, a state with very highembedded electric costs, such as California, may pursue renewable programs as a means tomoderate its electric prices. Other states may view renewables as an option to reduce the amount

of fossil energy consumed or may want to promote indigenous high value, high technology industriessuch as solar manufacturing or research and development. Other states may have specific orgeneral environmental goals to reduce certain identified pollutants.
The point to be considered is that strategic objectives should be clearly articulated by policy mak-ers and then programs can be designed that most efficiently and cost-effectively achieve thoseobjectives. For example, if petroleum reduction is the strategic objective, then perhaps renew-able electric production is not the most efficacious strategy to achieve this goal. Florida’s utilitiesonly use about 14 percent of the petroleum consumed in Florida. Thus, a program designed topromote alternative transportation fuels or systems might be more effective in reducing petroleumuse. On the other hand, if the goal is to promote more indigenous employment in a state, then arenewable goal might be designed that encourages the production and use of agricultural prod-ucts that require more agricultural labor inputs.
Some states have promoted renewable resources as a means to reduce the price volatility ofcertain fuels such as natural gas. Clearly, natural gas is the preferred choice for new generatingpower plants. However, there are a variety of opinions on both the availability and price stability ofthe nation’s gas reserves. Thus, some states are promoting renewable resources as a type offuel hedge against either increasing or volatile costs of natural gas prices. All utility systems usean economic optimization system that at any given time, and subject to security constraints ongrid reliability, dispatches generating units in order of their lowest operating costs regardless offuel used. Thus, depending on system characteristics and the diversity of fuel types, someintermittent renewable resources may cause an existing generating unit to back out of the eco-nomic dispatch order. Depending on the fuel that is being burned in this unit, the inclusion ofrenewables may conflict with other stated fuel diversity objectives.
Finally, there may be other strategies to achieve some energy related policy objectives. Forexample, energy efficiency or demand-side management may provide less costly avenues forsuccess. Requiring greater diversification of power plant fuel inputs by requiring utilities to usefinancial instruments to hedge their purchases, building more capital expensive but more fuelstable plants such as coal, or requiring greater dependency on purchase power contracts wherethird parties assume fuel risk are three such methods. Promotion of renewable resources shouldbe one tool in a tool box of programs to be considered in achieving a state’s broader strategicobjectives.
Metrics, Evaluation and Economic ImpactsOnce policy objectives are articulated and programs are designed, it is important that indicatorsand benchmarks are identified to evaluate progress toward achieving the objectives. Any policymaking body will want periodic reports and feedback on the successes and failures of the renew-able programs adopted. As discussed in this report, renewable programs have an assortment ofobjectives including numerically defined resource acquisition levels. Other states have set goalsbased on funding levels and may have goals that are targeted toward end use customers such asdirect rebates or incentives. The main consideration is some kind of tracking and evaluationcomponent that allows necessary corrections be made to the goals, allows systematic feedbackto policy makers, and holds responsible the program administrative agent such as utilities, stateagencies, or economic development units.
62

General agreement exists that renewable technologies are usually more expensive than thetraditional fleet of utility power plants. Given this axiom, several important policy determinationsmust be addressed in developing a renewable strategy. First and foremost is what are the limitedfactors in the actual amount of resources that can be obtained? Second, what incremental highercosts are you willing to impose on customers or taxpayers to achieve these potentials? And third,what are the various sector impacts of these decisions on customer bills, business decisions, andrelative competitiveness across industries?
Clear directives are needed with respect to the level, duration, and source of funding necessaryto achieve the strategic objectives. As described in this chapter, states have adopted a variety offunding sources to promote renewables including system benefit charges, general revenue fundingand other charges such as utility sponsored research and development that has traditionally beenincluded in electric rates. Florida utilities currently spend around $245 million per year on efficiencyand demand-side management programs. This amounts to between 0.6 and 1.9 mills per kWhon existing bills. This equals between $.60 and $1.90 on a typical 1000 kWh per month residentialelectric bill. These funds are recovered on each customer’s bill based on the number of kWhsthey consumed using a recovery factor adjusted every year. Some of these funds are used forresearch and development on renewables. However, close to 70 percent of the $230 million isgiven back to the participating customers in the form of incentives or rebates largely to customerswho participate in load control or interruptible demand programs. Additionally, all customersbenefit from efficiency and demand-side management programs because each program for whichan investor-owned electric utility receives cost recovery must pass a RIM (Rate Impact Measure)test, to ensure the rates will either stay the same or decrease.
Attention must also be paid to the industry impacts of particular funding sources. While electricutility customers provide a source for additional funding of renewable resources, some customershave the ability to shift the amounts and types of energy they use to avoid any additional charges.For example, large industrial customers may shift to natural gas for their energy needs engagingin what economists call substitution behavior. Residential customers will likely use less electricity.System benefit charges are not fuel source neutral, that is the surcharges are assigned based onthe final product (i.e. kWhs consumed) and not assigned to the individual fuel inputs that producethose kWhs. Thus, such charges may have disproportionate impacts on the competitive postureof different industries.
Finally, it should be made clear that it is difficult, if not impossible, to monetize all the differentattributes of renewables into a single cost dimension. While production cost is a relativelystraightforward concept and is used as one benchmark to compare technologies, it is impossibleto account for all the different attributes and the non-economic impacts of various technologiesboth renewable and traditional. For example, we know that municipal solid waste facilities canhave air emission profiles not dissimilar to traditional generators, yet they provide a valuablepublic benefit in reducing trash volumes that would normally be deposited in landfills. Centralstation photovoltaic systems have very favorable air emission profiles and do not require waterfor cooling, but would require larger land areas than traditional power plants. Here again, attentionmust be given to the total set of attributes of specific technologies before assigning preferentialrankings or deciding to select one technology over another.
63

T H E F I N A L R E P O R T S T A T E D :
28 Florida... Energy Wise! A Strategy for Florida’s Energy Future. Final Report of the Energy 2020 StudyCommission, December, 2001, p.101.
The 2020 Study Commission offered guidance as to the conflict that government faces whenpromoting one technology over another.
The development path of technology is not always predictable and the ultimatearbiter of the winners and losers is the market place. Technologies once viewedas promising often fail to achieve widespread adoption due to unresolved technicalissues, failure of consumers to embrace the technology, or failure to meet cost orperformance objectives that make them competitive with alternatives. Becauseof the dynamics of technological change, it is very difficult for government, withits obligation to protect the public purse, to identify successfully which of thecompeting industries and industry technologies should be awarded financialsupport.28
64

FLORIDA ACTIVITIES with RESPECT TO RENEWABLES
Since the 1970’s, the State of Florida has enacted at least twelve laws and numerous rules in-tended to promote the growth and development of renewable energy. Most of these were de-signed to use market mechanisms to increase the utilization of renewable technologies with spe-cial encouragement to solar applications. Supported by a broad mandate under the State Com-prehensive Plan (Florida Statutes 187.201), as well as specific directives in Chapter 366, FloridaStatutes, the Florida Energy Office (FEO), now a part of the Department of Community Affairs,has extensive experience in administrating various renewable energy programs. In fact, theEnergy 2020 Study Commission recommended a revitalized role for this office. One specificrecommendation made by the Commission stated, “ In an effort to encourage energy efficiency,the FEO should utilize existing and future resources to manage a broad program of investmentsin energy efficiency and sustainable generation technology.” Most of these efforts historicallyhave been funded by the use of Petroleum Violation Escrow (PVE) settlements. These funds alsosupported a large portion of the university research on renewables. However, these oil over-charge funds are nearly depleted and can not be expected to continue at their historical fundinglevels.
Solar InitiativesFlorida has long been a leader in establishing quality control and inspection standards for solarequipment and contractors. It is in large measure due to these efforts that Florida has a strongsolar energy infrastructure. Other states may have strong incentives for solar energy deployment,but they lack the infrastructure which is required to create an industry base. The Solar EnergyStandards Act of 1976 authorized the Florida Solar Energy Center (FSEC) to establish criteria fortesting performance of solar energy systems and require disclosure of those performance results.This initiative has given the developing industry for solar equipment marketed for sale in Florida asound regulatory basis for quality, performance and consumer confidence.
All solar energy systems manufactured or sold in Florida must be tested and certified to FSECstandards. Local building code jurisdictions require evidence of certification before a buildingpermit will be issued, and the building department inspects the completed installation to assurecompliance with the standards. Florida is the only state with its own solar system certificationprogram. Other states have adopted the FSEC standards as their own, or have adopted the SolarRating and Certification Program process, a national standards and certification program which ispatterned after FSEC’s and is administered by FSEC.
In addition, Florida is one of a few states which established a contractor license specific to thesolar trade. The solar contractor is regulated by the Construction Industry Licensing Board of theDepartment of Business and Professional Regulation. The scope of work includes solar waterheating, pool heating, and photovoltaics.
The Florida Building Code provides performance credits for solar energy installations based onvarious thermal performance standards. Solar energy systems will also be covered by the Florida
C H A P T E R V
65

29 Presentation by Colleen Kettles at the FPSC Workshop on July 2, 2002 , Solar Energy in Florida: PolicyAspects, Statutes, and Potential for Solar Thermal and Photovoltaic.
Building Commission’s Product Approval process which is under development. The interrelation-ship of the standards, codes, licensing and inspection process which Florida has developed hasbeen critical to the successful development of quality solar installations.
Florida has been a leader in establishing solar rights laws. Section 704.07, Florida Statutes, hasauthorized voluntary solar energy easements which create a property right of record which cannotbe unreasonably infringed. This has contributed to the legitimization of solar energy as havingpotential value to the property owner that wishes to access it.
Section 163.04, Florida Statutes, essentially bans community association restrictions on accessto available solar resources by providing residents in deed restricted communities with the abilityto install solar energy systems without the unreasonable interference of community associations.
Finally, Section 235.212(2), Florida Statutes, requires that an assessment of the feasibility of solarwater heating systems be required on future educational facilities.
Financial IncentivesFlorida has had several successful financial incentive programs, most of which have expired orare set to expire. A sales tax exemption, established under Section 212.08, Florida Statutes, hasreduced the initial capital cost of acquiring solar equipment and systems. This exemption is set toexpire as of July 1, 2005.
While there still exists the constitutional authority for a property tax exemption, the enabling stat-ute has expired. At this time, a photovoltaic system that is fully incorporated into the appraisedvalue of the house will yield more in property tax liability than energy savings.29
More recently, the Florida Solar Energy Center with funding from the Department of CommunityAffairs administered a direct matching incentive program to encourage the installation of photo-voltaic systems in residential and commercial buildings. Approximately 53 grid connected PVsystems were installed through the Florida PV Rebate program, which offered $4 per watt toresidential, commercial, and public PV systems. It offered up to $16,000 to residential customersand $40,000 for commercial customers and public buildings. In 2003, FSEC will administer a PVRebate Program dedicated solely to installing PV systems on Florida schools. Approximately$525,000 was dedicated to this program effort. It is anticipated that at least 30 PV systems will beinstalled as a result of this new rebate program.
Education InitiativesFlorida has several successful education and information programs directed toward renewableenergy. The Florida Solar Energy Center (FSEC) has education as part of its mission. Thisincludes providing education and information dissemination. Partially funded under a Departmentof Energy grant, the FSEC has a strong K-12 education program, as well as a wide range of
66

continuing education programs for energy practitioners. FSEC maintains a public informationoffice, a solar energy library, and a website featuring general information and specializedpublications. FSEC is also supporting DOE plans to host a series of traveling briefings andequipment shows on distributed energy (addressing many renewable energy applications) whichwill visit locations in North, Central and South Florida in early 2003. Finally, the CooperativeExtension Service expanded its scope of services to include an energy education and trainingelement. Originally funded under the Florida Energy Office, the program is now self supportingunder the auspices of Institute of Food and Agricultural Sciences and operates in nearly everycounty in Florida providing a range of information on energy topics.
The Florida Solar Energy Industries Association (FlaSEIA) provides a toll-free hotline, a website,consumer literature, a newsletter, industry directory and participates in a variety of energyexpositions. The Florida Solar Energy Research and Education Foundation (FlaSEREF) providesa toll-free hotline, websites, consumer literature, and specialized educational and marketingprograms for consumers, home builders and plumbing contractors.
Florida has several current program initiatives designed to promote the development and applicationof renewable energy resources in the state. SunBuilt Marketing, an education program supportedby the Florida Solar Energy Research Foundation and the Florida Home Builders, targets the newhome construction market. Funded over multiple years by Petroleum Violation Escrow (PVE)funds by the Department of Community Affairs, this program paid for solar equipment costs to beinstalled in model homes for builders. The solar industry provided volunteer labor to install theequipment. Due to the expiration of PVE funding, support for this program was discontinued in2002.
Zero Energy Homes and Building America, a program at the Florida Solar Energy Center (FSEC),funded by the U.S. Department of Energy, is designed to incorporate energy efficiency and solarenergy into building designs as a way to qualify the building for an “Energy Star” ranking. Such aranking implies that the building is at least 30 percent more efficient than one meeting the stan-dard building code. Although the program is just ramping up, it shows great promise. The FSECdeveloped the prototype Zero Energy Home in Lakeland.
The Florida Green Building Coalition, a non-profit group associated with the Florida Solar EnergyIndustry Association and FSEC, is targeting sustainable building practices, ranging from singlefamily homes to entire developments. Participants include key builders, developers, architects,universities, and interested stakeholders.
SunSmart, supported under the Department of Energy’s Million Solar Roofs program, is workingthrough the Florida Solar Industry Association, FSEC and the Florida Municipal Electric Associa-tion (FMEA) to develop generic marketing materials for utilities interested in promoting greenpricing programs to their customers. The SunSmart program currently has 8 municipal electricutility members. It has received funding from the American Public Power Association, the U.S.Department of Energy through the Million Solar Roofs Initiative, and the Florida Energy Office.The program recently received additional funding to expand its scope and encourage further utilityparticipation in green pricing programs.
67

Utility InitiativesFlorida electric utilities can support the development of renewable capacity in several ways, includingbuilding renewable resources, or by purchasing the capacity and energy from renewable generators.In addition, several Florida utilities have on-going research and development programs for variousrenewable technologies. Many Florida utilities are also beginning to provide renewable energy tointerested customers through green-pricing programs. Utilities can also encourage the developmentof renewable technologies through customer education programs, and low interest loan programsoffered to customers interested in purchasing photovoltaic and solar thermal systems. The specificactivities of Florida’s electric utilities will be discussed further below.
Florida Power & Light CompanyFlorida Power & Light Company (FPL) began its renewable efforts in the late 1970s. FPL workedwith the Florida Solar Energy Center in the late 1970s, to explore the feasibility of residential solarPV systems. In 1984, FPL installed a 10 kW solar PV system at the Flagami substation. FPLinstalled several test PV projects in the 1980s and 1990s to collect cost and performanceinformation. FPL also provided a solar water heating program between 1982 and 1987, whichassisted 48,000 customers in installing solar thermal water heating systems. In the early 1990s,FPL also conducted a research and development program to evaluate using PV panels to powerswimming pool pumps.
In 1998, FPL initiated the Solar Research Partnership program, a green-pricing program, todetermine customer interest in supporting solar energy. Over 10,000 customers responded, withone-time contributions of from $5 to $200. FPL subsequently installed a 10.1 kW PV system at itsMartin site. FPL is currently conducting customer market research to develop an ongoing green-pricing program, and has determined that there is sufficient customer interest to support theprogram. Approximately 30 percent of those surveyed have indicated an interest in supportinggreen energy. FPL expects actual participation to be much lower, ranging from one to ten percent.Further research is being conducted to determine the appropriate sources for this renewableenergy, and the willingness to pay of potential participants. FPL has also issued a request forproposals for renewable resources to be supported by the program. Additional information onFPL’s Solar Research Partnership Program is available on FPL’s website, www.fpl.com.
FPL is also conducting the Photovoltaic Research and Development program to determine howsolar PV systems actually perform in meeting specific customer needs. FPL plans to install sevenPV systems in residential and commercial facilities and monitor these systems for a full calendaryear. Five of the seven systems are installed, with two additional planned by the end of 2002. FPLwill collect data on such issues as: the financial benefit to customers, the coincidence of thesystem with peak demand throughout the year, the actually energy generated, and actual operatingand maintenance costs. FPL is also in the process of siting and installing five fuel cells around thestate to determine the performance of this developing technology.
FPL is also purchasing energy from several qualifying facilities fueled by renewables. Thesefacilities are fueled by biomass (including bagasse), waste heat, and municipal solid waste.
68

Progress EnergyProgress Energy (formerly Florida Power Corporation (FPC)) has joined with Palm Harbor homes,a manufactured housing company, to study the operation of PV systems in manufactured homes.The program has also been supported with a grant and technological assistance by the FloridaSolar Energy Center. The objectives of the project are to increase customer awareness of PVsystems, improve the efficiency of manufactured housing, research green power programs, andreduce labor costs associated with PV installation. Progress Energy has installed PV systemsranging from .8 kW to 1.3 kW in six styles of Palm Harbor Homes. These homes will be monitoredfor at least one year. Preliminary results show average system total installed costs of $7,000, withapproximately 3 kWh per day produced. Average cost per kWh ranged from $0.31 for installationcosts alone, to $1.31 per kWh including O&M costs. Progress Energy received the 2001-innovationaward from the Interstate Renewable Energy Council for their research and development onphotovoltaics.
Progress Energy continues to conduct research to fully understand the potential of photovoltaicsat the Econolochatchee solar array in Orlando, which was originally commissioned in August of1988. Additionally, Progress Energy has formed partnerships with Disney, installing 6.5 kW ofphotovoltaics at the Nature Conservancy and is currently coordinating the installation of photovoltaicson 20 BP (British Petroleum) stores, which will total 185 kW when completed.
Progress Energy has also increased its efforts to educate the public on PV systems. ProgressEnergy has worked with the Legal Environmental Assistance Foundation to develop an educationalbrochure on PV systems. Progress Energy has also developed a website at www.fpc.com/environment/solar.html which discusses PV systems and provides sources of additional information.Finally, Progress Energy has provided a $25,000 grant to finance the Solar Energy EducationProgram (SEEP). The SEEP program is estimated to impact 7,500 students, equip thirty schoolswith solar energy education kits, curriculum materials, and an interactive energy focused web site.Each school will have the opportunity to build and race a solar powered car in a statewidecompetition.
Progress Energy is currently purchasing 205 MW of MSW and biomass derived energy fromseveral qualifying facilities.
Gulf Power CompanyGulf has been participating in the EarthCents Solar green pricing program with its sister company,Alabama Power, since December 1999. The program is designed to install 1 MW of solar generationas soon as customers commit to provide $6 per month for 10,000 100-watt blocks. Gulf hasreceived less than 1,000 commitments for 100 watt blocks at this point, and will not begin chargingcustomers for the program until enough commitments are obtained. Gulf has been advertisingthe program in bill stuffers and on its website. Gulf and its parent company, Southern Company,share the website, www.southerncompany.com, which is an excellent source of informationconcerning each type of renewable energy technology. The website also provides links to otherwebsites with additional viewpoints on renewable technologies.
69

Southern Company has had numerous research and development programs in the last ten yearson co-firing at existing coal plants with various forms of biomass, including sawdust, tree trimmingwastes, and switchgrass. Research results reveal that lowest cost sources of biomass fuel will bewaste wood in the immediate vicinity of each existing plant.
Southern Company also has two ongoing projects to evaluate fuel cells. One project is monitor-ing a 250 kW fuel cell demonstration plant. The other project is designed to study fuel cell perfor-mance under various conditions and applications.
Tampa Electric CompanyTampa Electric Company (TECO) launched its green-pricing program, Smart Source, in Novem-ber 2000. The program allows interested customers to subscribe to 50 kWh blocks of energy foran additional charge of $5 per month. Both solar and biomass projects will be supported by theprogram. TECO has conducted market research for the program, including focus groups andcustomer surveys. TECO has advertised the program through bill stuffers, targeted mailings, andthe website, www.smartsource.tampaelectric.com. TECO plans to increase customer participa-tion to 1 percent of its customer base within the next five years, and will encourage commercialand governmental participation. Customers may subscribe on the website or by phone.
TECO’s SmartSource resources currently include a PV installation and biomass. The PV systemis an 18 kW array at the Museum of Science and Industry. TECO has also conducted biomassco-firing experiments at the Gannon station using yard waste collected by Hillsborough County.TECO also has a planned landfill gas generation site. TECO is also reviewing biomass gasifica-tion at the IGCC plant located at the Polk site.
Gainesville Regional UtilitiesIn 1997, Gainesville Regional Utilities (GRU) installed a 10 kW photovoltaic system on the roof ofits system control facility. The PV panels provide energy for the equipment housed at this facility,and were purchased through government grants and customer contributions. GRU plans to in-stall additional PV panels at the Gainesville/Alachua County Regional Airport during 2002.
GRU also provides customer rebates for the purchase of active and passive solar water heatingsystems. Rebates range from $300 to $450, depending on the type and capacity of the system.Information concerning GRU’s PV installations and solar water heating system rebates is avail-able on GRU’s website: www.gru.com.
Jacksonville Electric AuthorityJacksonville Electric Authority (JEA) has committed to the Sierra Club and the American LungAssociation to achieve 7.5 percent of summer peak capacity resources from clean power, by2015. This includes 6 percent, or 200 MW, of renewable capacity, and 1.5 percent, or 50 MW, ofequivalent clean capacity. The equivalent clean capacity will consist of power generation efficiencymeasures, pollution control additions, and demand-side management programs which will mitigatean equivalent amount of emissions from a conventional generating source. JEA believes that the
70

benefits of this program are customer satisfaction, fuel diversification, and rate stability. JEA’sinternal goal is to have 4 percent clean capacity by 2007.
JEA currently has approximately 7.9 MW of renewable capacity, including approximately 162 kWsolar PV capacity, 893 kW of solar thermal, 6,000 kW in landfill biogas, and 800 kW in digesterbiogas capacity. JEA has currently installed PV systems in all of the public high schools in DuvalCounty, as well as many of JEA’s facilities. Installation costs have been approximately $12,400per kW. JEA attributes this high cost largely to structural considerations due to high wind loadingdesign requirements. JEA has also entered into a 70 MW purchased power agreement withBiomass Industries, Incorporated. This developer will grow biomass crops (E-grass and bamboo)in order to provide JEA with the energy resulting from gasifying these crops.
JEA does not currently have a green pricing program. However, JEA meters the energy producedfrom each renewable facility so that green tags can be sold to produce additional revenue.
JEA began its Solar Incentive Program for residential and commercial customers in February,2002. JEA’s customers have installed 101 eligible systems since the program’s inception, with acombined capacity of 539 kW. Customers must use solar providers which are pre-qualified byJEA. The program provides incentives of up to $4 per watt for PV systems and up to $20 persquare foot of solar water heater collectors. JEA also provides an incentive of up to $500 torestore existing PV and solar hot water systems to working order. Incentive levels are higher in allcases when the customer uses a local vendor. JEA also provides an enhanced incentive forqualifying non-profit organizations and low-income families. The total incentive is limited to $50,000per installation. Further details are available on JEA’s website, www.jea.com, or by calling (904)665-6000.
JEA’s renewable efforts also include several research and development programs. JEA is cur-rently managing and studying a 15 acre biomass energy farm. JEA has also developed a high-temperature solar collector that has the potential as an application for electric generation or in airconditioning. The utility has also contributed funding to the University of North Florida to establisha renewable energy research laboratory.
City of LakelandIn 1998, the City of Lakeland collaborated with the Florida Solar Energy Center in the Zero EnergyHomes research program. Two homes with identical floor plans and solar orientation were builtunder this program, a standard or control model, and an energy-efficient photovoltaic residence.The control home was built to the Florida Energy Efficiency Code for Building Construction. Theenergy-efficient PV model combined energy-efficiency measures with 4 kWs of solar PV cells.Data was collected from the homes for more than a year to determine the performance of energyefficiency measures and PV systems in reducing energy demand in Florida homes. Due to thepositive results of this study, the program has been used as a model for a national Zero EnergyHomes program. FSEC reports that in one year, the energy-efficient PV home used 6,960 kWh ofenergy, 5,180 kWh of which was provided by the PV system. For the same period, the controlresidence used 22,600 kWh. FSEC also found that the PV home placed nearly zero net peakdemand on the grid during periods of peak demand. This indicates that the combined energy
71

efficiency measures and PV system were coincident with system peak. FSEC stated that on thehottest day recorded in the Lakeland area, the energy efficient PV house met 70 percent of thecooling energy used, and 80 percent of the peak load compared with the control house. Moreinformation about this program can be found on FSEC’s website at www.fsec.ucf.edu.
The City of Lakeland is a partner in a pilot Solar Thermal Billing program funded by the FloridaEnergy Office. The program’s goal was to evaluate the effectiveness of using solar thermal waterheating systems in the Lakeland area by installing solar water heating systems with special meter-ing equipment at 50 Lakeland homes. The systems were installed at no cost to participants.Participants were billed for the energy produced by the system and used for water heating pur-poses. Lakeland received 418 responses, or a .4 percent response rate, from volunteers willingto participate in the program. The total installed system cost was $2,100, which included an 80gallon storage tank, glazed collector, 5 watt PV/DC pump, meter and timer. Using a kWh rate of7.5 cents, each system would produce $142 in revenue for a participating utility, indicating a 14.8year payback period.
City of Lakeland is also participating in the SunSmart green energy program. This program usespartnerships with Florida municipal utilities, the U.S. Department of Energy, the Florida EnergyOffice, and the Florida Solar Energy Center, to provide education to utilities and consumersconcerning renewable energy technologies. The goals of the SunSmart program include allowingany participating utility to offer a green pricing program, educating Florida consumers aboutrenewable energy technologies, providing Florida schools with educational materials, and assistingmunicipal utilities with overcoming barriers to the installation of renewable resources. Moreinformation about the SunSmart program can be obtained at www.sunsmart.org.
City of TallahasseeThe City of Tallahassee (Tallahassee) currently has several renewable installations, including the11 MW hydroelectric facility at the C.H. Corn Station, and an 18 kW solar PV system at the StateSatellite Office Complex that was originally part of an electric vehicle charging station. Tallahassee’smost recent renewable installation is a 10 kW solar PV system located at the Trousdell Gymnasticand Aquatic Center.
In the mid-1990s, Tallahassee initiated a Solar Water Heating Pilot Program. This program waspartially funded by a grant from the State of Florida. As a result of the program, seven commercialsolar water heaters were installed on city buildings. Fourteen residential solar water heaters werealso installed.
Tallahassee has based its solar program, Green For You, on market research. This research hasincluded a phone survey conducted 4 years ago, and several focus group sessions in June 2001.Tallahassee’s market research found that there is an overall support for expanding the city’srenewable resources, in particular, solar energy resources. Customers believed this effort shouldbe combined with increased efforts to encourage energy efficiency and conservation. Customersalso expressed concerns about being able to verify that city revenues are used to develop powerresources which are actually considered to be green.
72

Green For You will be launched in November, 2002, and has been developed in partnership withSterling Planet, a clean energy marketer, and the Legal Environmental Assistance Foundation.Tallahassee intends to provide 50 percent of the energy under the program from local solar re-sources. The other 50 percent will be obtained by purchasing Green Tags for renewable energy,such as biomass and wind energy, produced within the Southeast region. The initial webpagemarketing campaign can be found at: http://talgov.com/citytlh/utilities/index.html.
Tallahassee has also worked to increase customer awareness of solar technologies. These ef-forts include the sponsorship of the Florida A&M, Florida State University College of Engineeringsolar car entry into the national solar car race, Sunrayce99. Tallahassee has also developedseveral mobile solar demonstration modules, including an interactive computer kiosk, to be usedin Leon County schools. Tallahassee also provides information on renewable technologies andthe programs offered by the city utility on its website, www.talgov.com.
Utilities Commission of New Smyrna BeachThe Utilities Commission of New Smyrna Beach (New Smyrna) has worked with the Florida PVRebate program to offer their customers PV systems at a price of $1.82 per peak watt. Theremaining cost of $4 per watt was paid for by the Utilities Commission and the State of Floridathrough the PV Rebate Program. The utility offered their customers financing at the prime rate forthe PV installations, as well as a two-year system warranty. Eleven systems have been installedthrough the program. The Utilities Commission also offers a green-pricing program to their utilitycustomers. Participants in this program can elect to pay an additional $2, $5, or $10 per month ontheir bill to support public PV installations in their city. Currently, the utility has installed two publicPV systems: one on a municipal golf course and one on a local elementary school. The utility hasplans to install two additional school systems in 2003.
73

F L O R I D A R E N E W A B L E G E N E R A T I O N
UTILITY /FACILITY
FIRM *CAPACITYSUM (MW)
NET *CAPABILITYSUM (MW) FUEL TYPE
A S O F J A N U A R Y 1 , 2 0 0 2
11.0
0.00.0
11.043.012.823.040.014.80.0
39.60.0
12.88.0
15.00.00.05.6
10.049.054.10.00.00.0
43.50.09.0
0.00.00.00.00.00.0
30.0
11.0
2.526.5
11.043.012.823.040.014.838.039.60.0
12.89.0
15.015.027.044.1
12.056.061.0
---------
46.5---
9.0
37.440.84.0
10.05.0
20.0
30.0
C O N T I N U E D
74
A P P E N D I X A
CITY OF TALLAHASSEE Hydroelectric
FLORIDA MUNICIPAL POWER AGENCYMetro Key West Municipal Solid WasteUS Sugar Corporation Other Biomass Solids
FLORIDA POWER CORPORATIONBay County Res. Recov. Municipal Solid WasteDade County Res. Recov. Municipal Solid WasteLake County Res. Recov. Municipal Solid WastePasco County Res. Recov. Municipal Solid WastePinellas County Res. Recov. Municipal Solid WastePinellas County Res. Recov. Municipal Solid WasteProctor & Gamble (Buckeye) Wood/Wood Waste SolidsRidge Generating Station Wood/Wood Waste SolidsSt. Joe Forest Products Wood/Wood Waste SolidsTimber Energy Wood/Wood Waste SolidsJefferson Power Wood/Wood Waste SolidsCargill Waste Heat - ExothermicPotash Corp. of Saskatchewan Waste Heat - ExothermicPotash Corp. of Saskatchewan Waste Heat - ExothermicUS Agrichem Waste Heat - Exothermic
FLORIDA POWER & LIGHTBioEnergy Municipal Solid WasteBroward-North Municipal Solid WasteBroward-South Municipal Solid WasteGeorgia Pacific Wood/Wood Waste SolidsOkeelanta Other Biomass LiquidsOsceola Other Biomass LiquidsPalm Beach County Municipal Solid WasteUS Sugar-Bryant Other Biomass LiquidsRoyster Waste Heat - Exothermic
GULF POWERChampion Wood/Wood Waste SolidsChampion Wood/Wood Waste SolidsStone Container Wood/Wood Waste SolidsStone Container Wood/Wood Waste SolidsStone Container Wood/Wood Waste SolidsStone Container Wood/Wood Waste Solids
SEMINOLE ELECTRIC CO-OPLee County Resource Center Municipal Solid Waste

F L O R I D A R E N E W A B L E G E N E R A T I O N
A S O F J A N U A R Y 1 , 2 0 0 2
39.0
18.00.0
23.00.00.00.00.00.00.00.0
512.2
39.0
18.01.4
23.041.057.127.425.150.828.50.0
1,028.1
75
UTILITY /FACILITY
FIRM *CAPACITYSUM (MW)
NET *CAPABILITYSUM (MW) FUEL TYPE
SOUTHEASTERN POWER ADMIN. Hydroelectric
TAMPA ELECTRIC COMPANYCity of Tampa - Refuse Municipal Solid WasteCity of Tampa - Sewage Other Biomass LiquidsHillsborough CTY - Refuse Municipal Solid WasteCargill Millpoint Waste Heat - ExothermicCargill Ridgewood Waste Heat - ExothermicCF Industries Waste Heat - ExothermicFarmland Hydro Waste Heat - ExothermicIMC New Wales Waste Heat - ExothermicIMC South Pierce Waste Heat - ExothermicMulberry Phosphates Waste Heat - Exothermic
TOTAL
* Firm Capacity refers to amount of output committed for delivery under firm contract to purchas-ing utilities. Net Capability refers to the output potential of the generator.

76
State Renewables Portfolio Standardsand Purchase Mandates
(13 States)
Map Information provided by: Ryan Wiser, Lawrence Berkeley National Laboratory
Approximately 30% of total U.S. load covered11 states have RPSMandates in 2 states (MN and IA)
A P P E N D I X B
ME: 30% by 2000
MA: 4% new by 2009
CT: 13% by 2009
NJ: 6.5% by 2012PA: varies by utility
MN: 825 MW by 2012
WI: 2.2% by 2011
IA: 105 MW
TX: 2,880 MW by 2009
NM: 5% as available
AZ: 1.1% by 2007
CA: 20% by 2017
NV: 15% by 2013
Also, renewable energy “goals” established in Illinois, Minnesota, and Hawaii.


77
PERSONAL
TAX CORP.
TAXLOANS
SALES
TAX PROP.
TAXREBATES
GRANTSINDUST.
RECRUIT
LEASINGEQUIP.
SALES PROD.
INCENT.
1
1
2
1
2
2 3
2
1
1
1
1
1
1 1
1
1
1
1
AlabamaAlaskaArizonaArkansasCaliforniaColoradoConnecticutDelawareDist. of Colum.FloridaGeorgiaHawaiiIdahoIllinoisIndianaIowaKansasKentuckyLouisianaMaineMarylandMass.MichiganMinnesotaMississippiMissouriMontanaNebraskaNevadaN. HampshireNew JerseyNew MexicoNew YorkN.Carolina
2
2 11
31
104
1
5
1
1
11
1
1
1 1
1
2 1
2
1
1
2
2
2
1 2 3
1
1
1
1 2
3
1
1
3
1
2
3
3
11
1
2
1
1112 2
1
1
1
1
1
1
1
1
1
1
2
1
1
1
1
1 11
1
1
1
1
1
1
1 1
1 1
C O N T I N U E D
1
State Financial Incentives for Renewable Energy 2002*All 50 states including the District of Columbia
= STATE = UTILITY = LOCALNumbers in box indicate number of programs offered.
A P P E N D I X C

78
PERSONAL
TAX CORP.
TAXLOANS
SALES
TAX PROP.
TAXREBATES
GRANTSINDUST.
RECRUIT
LEASINGEQUIP.
SALES PROD.
INCENT.
State Financial Incentives for Renewable Energy 2002*All 50 states including the District of Columbia
= STATE = UTILITY = LOCAL
North DakotaOhioOklahomaOregonPennsylvaniaRhode IslandS. CarolinaSouth DakotaTennesseeTexasUtahVermontVirginiaWashingtonWest VirginiaWisconsinWyoming
1 1 1 2
1 1 1 1
1
11 1 4 31 1
1 3 31
1 1 1 2 2
1
1
1
1 1 1 1 1 11 1
1 1
1
1
1 2
1
1
11
111
1
1
1
1
1
2
Total # of Stateswith Programs
Total # ofPrograms
15
21
20
26
15
19
24
28
19
45
13
25
22
33
9
10
3
4
4
5
4
5
* Source: www.desireuse.org
Numbers in box indicate number of programs offered.