anatomy of an infographic
DESCRIPTION
for Lech Velasco's FA 172.2 classTRANSCRIPT
ANATOMY OF AN INFOGRAPHICor how to create a powerful visual

visual
content
knowledge
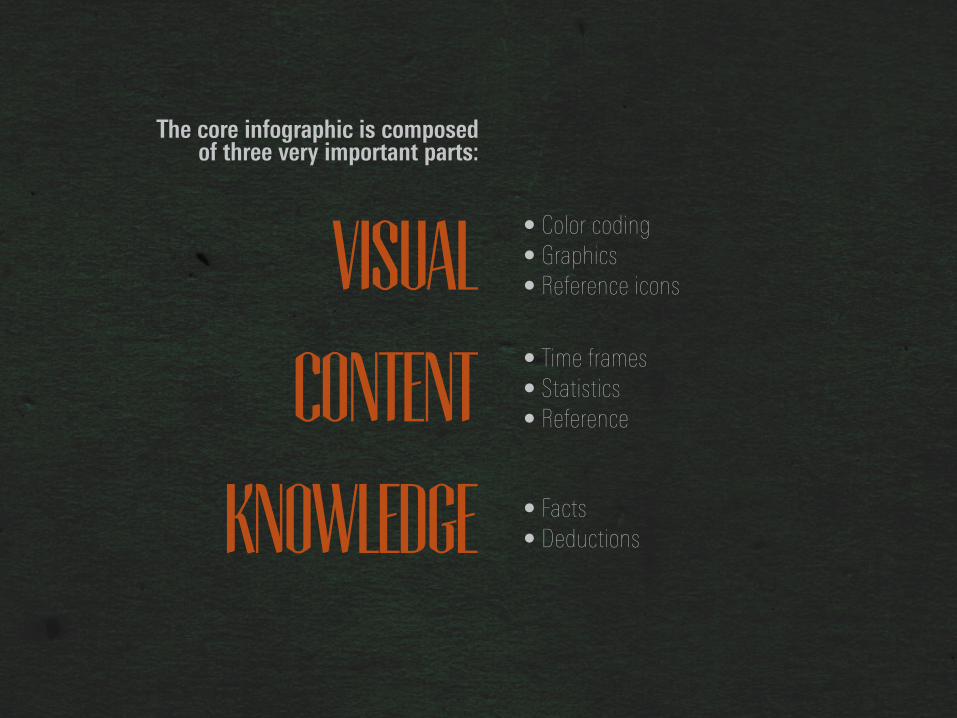
The core infographic is composed of three very important parts:
visual
content
knowledge
The core infographic is composed of three very important parts:
��&RORU�FRGLQJ��*UDSKLFV��5HIHUHQFH�LFRQV
��7LPH�IUDPHV��6WDWLVWLFV��5HIHUHQFH
��)DFWV��'HGXFWLRQV
ONE - LEVEL
TWO - LEVEL
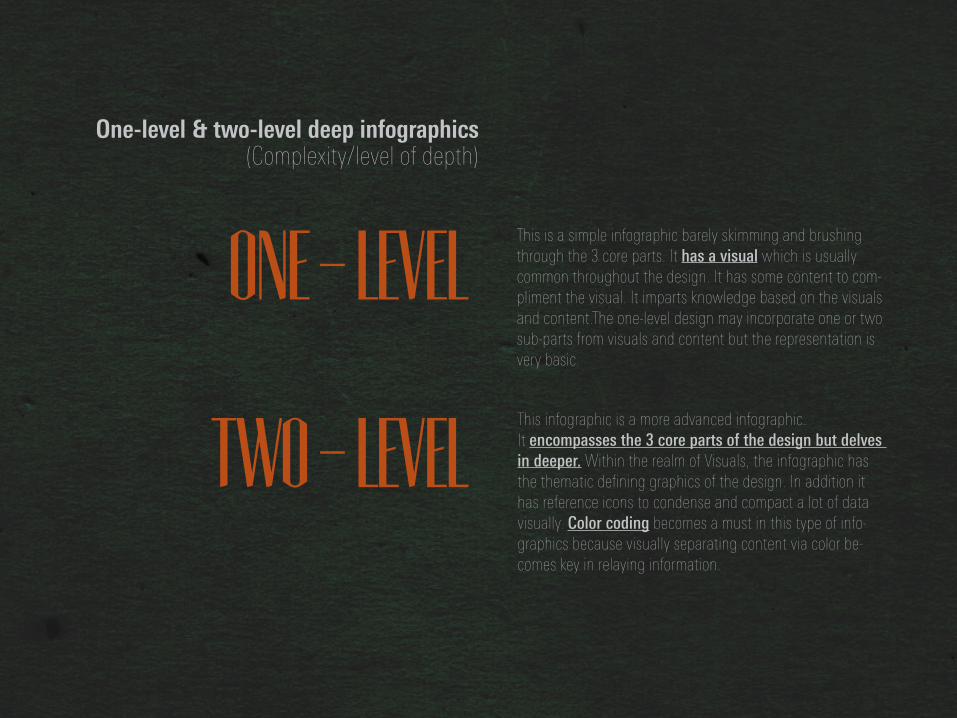
One-level & two-level deep infographics
(Complexity/level of depth)
This is a simple infographic barely skimming and brushing through the 3 core parts. It has a visual which is usually common throughout the design. It has some content to com-pliment the visual. It imparts knowledge based on the visuals and content.The one-level design may incorporate one or two sub-parts from visuals and content but the representation is very basic.
This infographic is a more advanced infographic. It encompasses the 3 core parts of the design but delves in deeper. Within the realm of Visuals, the infographic has WKH�WKHPDWLF�GH¾QLQJ�JUDSKLFV�RI�WKH�GHVLJQ��,Q�DGGLWLRQ�LW�has reference icons to condense and compact a lot of data visually. Color coding becomes a must in this type of info-graphics because visually separating content via color be-comes key in relaying information.

5 essential tipson making good infographics
1. skeletons & flowchartsApproach an infographic as you would, any other form of design. Put together a skeleton of words and arrows, grouping relevant data together and visualizing WKH�¿RZ�RI�LQIRUPDWLRQ�XVLQJ�¿RZFKDUWV��%HFDXVH�LQIRJUDSKLFV�DUH�XVXDOO\�FRP-SOH[��¿RZFKDUWV�ZLOO�VLPSOLI\�WKH�SURFHVV�DQG�FRQQHFW�HYHU\WKLQJ�SUHFLVHO\�IRU�you.
2. devise a color scheme!A color scheme is very important to convey a wide array of messages while NHHSLQJ�WKH�UHDGHU�FRQ¾QHG�LQVLGH�WKH�LQIRJUDSKLF��:LWK�KXJH�DQG�FRPSOH[�LQ-IRJUDSKLFV��UHDGHUV�ZLOO�EHFRPH�TXLFNO\�FRQIXVHG�DQG�WKHLU�SHUFHSWLRQV�ZLOO�EH�VFDWWHUHG�DOO�RYHU�WKH�SODFH�LI�WKH\�GRQ¶W�KDYH�FRORUV�W\LQJ�GRZQ�WKHLU�WKRXJKWV�YLVXDOO\��<RX�FDQ�KDYH������RU����FRORUV�EXW�DVVLJQLQJ�WKHP�EHIRUH�\RX�EHJLQ�GHVLJQLQJ�ZLOO�EH�WKH�PRVW�LPSRUWDQW�WKLQJ�\RX�GR�
3. graphicsThere are actually two kinds of graphics in an infographic...
theme graphic
reference graphics
7KLV�LV�WKH�GH¾QLQJ�YLVXDO�RI�WKH�GHVLJQ�DQG�LV�XVXDOO\�DOZD\V�LQFOXGHG�LQ�WKH�LQIRJUDSKLF��H[FHSW�ZKHQ�WKH�LQIRJUDSKLF�LV�PRUH�VWDWLVWLF�EDVHG��&KRRVLQJ�WKH�ULJKW�WKHPH�JUDSKLF�ZLOO�WHOO�\RX�UHDGHU�DW�D�JODQFH�ZKDW�NQRZOHGJH�\RX�ZLVK�WR�VKDUH�
7KHVH�DUH�QRW�PDQGDWRU\�LQ�WKH�GHVLJQ��7KH\�DUH�XVXDOO\�LFRQV�XVHG�DV�YLVXDO�SRLQWHUV�WR�DYRLG�FOXWWHULQJ�XS�WKH�GHVLJQ�ZKHQ�D�ORW�RI�FRQWHQW�QHHGV�WR�EH�UHSUHVHQWHG��7KH\�DUH�EULOOLDQWO\�FD-SDEOH�RI�PDNLQJ�QXPHURXV�UHIHUHQFHV�XVLQJ�WKH�VDPH�LQVWDQFH��6RPHWLPHV�ZRUGV�DUHQ¶W�HYHQ�QHFHVVDU\�LI�SRZHUIXO�UHIHUHQFH�LFRQV�DUH�XVHG��D�SUDFWLFH�PRUH�DQG�PRUH�GHVLJQHUV�DUH�XVLQJ�LQ�D�ELG�WR�PDNH�WKHLU�LQIRJUDSKLFV�DV�ZRUG�IUHH�DV�SRVVLEOH�

4. Research & dataIt goes without saying that all infographics must be thoroughly researched and the data presented must be backed up by established facts. While doing that, you will inevitably end up with piles of data. Sifting through that you must condense and decide what data is the most relevant and how you are going to present it. The ratio of data to the graphics works best if it is 1:1.

5. knowledgeHighlighting important content to easily provoke deductions is an art.
As mentioned before, knowledge is powerful and the imparting of that knowl-
edge must be powerful too.
but in the end, an infographic can be as simple and as complicated as you want it to be. A good infographic will not confuse you and make you feel like an idiot, that is a true tribute to the designer designing it. Put yourself in the shoes of the people who are going to be using your infographics and you’ll design a great one!

~fin~