anaxis bond opportunity europe 2018
TRANSCRIPT

Anaxis Bond Opportunity Europe 2018 French FCP (mutual fund)
Annual Report as of 31 December 2015
Asset Management Company: ANAXIS ASSET MANAGEMENT
Registered office: 9, rue Scribe, 75009 Paris
Custodian: BNP Paribas Securities Services
Publication of issue and redemption prices: available to unit-holders at the management company’s offices.

Anaxis Bond Opportunity Europe 2018
2
Contents
Contents .................................................................................................................................................. 2
Section I: Management report ................................................................................................................ 3
1. Investment orientation ............................................................................................................ 3
2. Investment policy ..................................................................................................................... 9
Section II: Annual Financial Statements ................................................................................................ 11
1. Balance sheet – Assets ........................................................................................................... 11
2. Balance sheet – Liabilities ...................................................................................................... 12
3. Off-balance sheet ................................................................................................................... 13
4. Income statement .................................................................................................................. 14
Section III: Annual Financial Statements - Notes .................................................................................. 15
1. Accounting rules and methods .............................................................................................. 15
2. Change in net assets .............................................................................................................. 18
3. Additional disclosures 1 ......................................................................................................... 19
4. Additional disclosures 2 ......................................................................................................... 20
5. Breakdown of payables and receivables by type ................................................................... 22
6. Breakdown by legal or economic type of instrument ........................................................... 23
7. Breakdown of assets, liabilities and off-balance sheet items by type of interest rate .......... 24
8. Breakdown of assets, liabilities and off-balance sheet items by residual maturity .............. 25
9. Breakdown of assets, liabilities and off-balance sheet items by quotation currency ........... 26
10. Distribution of earnings ......................................................................................................... 27
11. Statement of income and other characteristics items .......................................................... 34
12. Inventory of financial instruments as of 31 December 2015 ................................................ 38

Anaxis Bond Opportunity Europe 2018
3
Section I: Management report
1. Investment orientation
■ Classification : International bonds and other debt securities.
■ Investment objective : The Fund aims to outperform by 4.5%, net of fees, as at 31 December 2018, the
actuarial yields offered by French and German government bonds with similar maturities. More specifically, the Fund targets an annualised yield to maturity of more than 5.0% at 31 December 2018.
■ Benchmark index : None. The Fund's performance may, however, be compared ex-post to the
actuarial yields of German government bonds over the investment period at 31 December 2018.
■ Investment Strategy
a. Description of
strategies used : The investment objective must be achieved by building a portfolio comprised predominantly of speculative high-yield corporate bonds. These securities are intended to be held to maturity, but adjustments deemed appropriate may be made over the life of the Fund as part of its discretionary active management strategy.
Investment strategy in reference to the 31 December 2018 maturity
The Fund is managed according to a maturity set at 31 December 2018. The aim of the investment strategy is to build a portfolio with the best possible balance between the return achieved, the risk of potential default and the probability of a capital loss due to market fluctuations over the recommended investment period. The composition of the portfolio will therefore be adapted over time according to the residual investment period.
The portfolio's sensitivity is expected to decrease over the years. However, some of the securities held may have a maturity date falling after 31 December 2018. Furthermore, a high level of bond investment may be maintained until the liquidation of the portfolio. This liquidation will take place a few weeks prior to maturity, at a rate to be determined according to market conditions at the time.
By 31 December 2018 at the latest, the Fund will be managed on the money market in reference to the average money market rate. The Fund may, after obtaining approval from the AMF (French securities regulator) and notifying the unitholders, opt to wind up, implement a new investment strategy or merge with another UCITS.
General approach
The investment strategy is based first and foremost on an extensive fundamental analysis of European private-sector bonds and on the construction of a robust and diversified allocation based on the selection of individual bonds each for their own merits. The Fund is actively managed but does not seek to capture short-term market trends.
Financial analysis
The investment strategy assesses the issuer's financial solidity, development outlook and sensitivity to economic conditions, the liquidity of available issues and their legal characteristics. This analysis aims to identify the most attractive securities. It includes a comparative approach between similar securities in terms of issuer, sector, maturity, subordination rank, etc.

Anaxis Bond Opportunity Europe 2018
4
Geographic and sector criteria
The investment strategy favours issuers headquartered in Europe, or that generate a significant percentage of their revenue in Europe. Diversification of up to 30% in the United States and 10% in other countries is permitted.
The investment strategy seeks to obtain solid sector diversification, with a maximum of 25% per sector. All economic sectors may be considered. However, the Fund does not invest in securities issued by banks or other financial institutions. It should be noted that this exclusion does not apply to financial holding companies and financing structures sometimes used by industrial or service groups.
Geographic exposure (geographic region of issuers)
Minimum Maximum
European Economic Area and Switzerland 70% 100%
United States 0% 30%
Other countries 0% 10%
Rating criteria
The portfolio management team aims to establish reasonable exposure to credit risk, mainly but not exclusively via high yield and high risk securities. It does not invest in companies already or soon to be in default. However, it is not obligated to sell a security issued by a defaulting company after it is included in the portfolio, should it consider that this would not be in the unitholders' best interest.
Credit risk exposure Minimum Maximum
High-yield corporate debt 50% 100%
Investment Grade corporate debt 0% 50%
Unrated corporate debt 0% 25%
Investment Grade sovereign debt 0% 50%
High-yield sovereign debt 0% 10%
The Investment Grade category comprises securities with a minimum rating of BBB- by Standard & Poor's or Baa3 by Moody's or an equivalent rating by another recognised rating agency, or securities deemed to be of equivalent quality in the judgement of the Managing Company. The High Yield category comprises securities with a rating below this level. The lowest rating will be used to determine the Fund's allocation limits.
The analysis and selection of debt instruments is made independently from rating agencies.
Markets
The Fund may invest on the primary and secondary markets.
Tactical allocation and bond sensitivity
The investment strategy also uses a macroeconomic, financial and technical analysis to define the optimal positioning of the Fund. Based on this analysis, the portfolio management team may decide to hold a portion of the Fund's assets in money market products, short-term government debt instruments or government bonds. It may vary the asset allocation by rating or sector.
It may also change the portfolio's sensitivity to general interest rate trends within a range of 0 to 5. To this end, the portfolio management team may use interest rate swaps or futures, within the limit of an overall exposure (all positions combined) of 120% of the Fund's assets.

Anaxis Bond Opportunity Europe 2018
5
The credit spread sensitivity range is identical to the range indicated for sensitivity to interest rates.
Sensitivity Minimum Maximum
to interest rates 0 5
to credit spreads 0 5
Management of foreign exchange risk
The Fund's reference currency is the euro. Foreign exchange risk generated by any investments in foreign currencies is generally hedged in favour of the euro.
Furthermore, unit categories denominated in currencies such as the US dollar or the Swiss franc are continuously hedged against foreign exchange risk in order to protect investors against exchange rate fluctuations between the euro and the unit category's currency of denomination.
Foreign exchange risk is hedged via forward forex transactions or OTC derivatives. Such hedged may prove partial or imperfect. A tolerance threshold of 5% of residual exposure has been defined.
Foreign exchange risk Minimum Maximum
Euro-denominated securities 50% 100%
Securities denominated in other currencies (US dollar, Swiss franc, British pound, etc.)
0% 50%
Residual foreign exchange risk exposure after hedging
0% 5%
b. Categories of assets used : 1. Debt securities and money market instruments
Corporate bonds and negotiable debt securities
This category may comprise up to 100% of the Fund's assets.
The investment strategy focuses on bonds and negotiable debt securities issued by European companies and companies generating a significant percentage of their revenue in Europe (European Economic Area and Switzerland, in particular). These issuers may or may not be listed.
These securities are generally denominated in euro but also in other currencies (e.g. USD, CHF, GBP, JPY, DKK or SEK). Securities denominated in currencies other than the euro may comprise up to 50% of the Fund's assets. However, foreign exchange risk is hedged under the best possible conditions and is kept below 5%.
Selected securities may be of any rank (e.g. secured debt, mezzanine, subordinated debt) and have any credit rating. High-yield securities may comprise up to 100% of the Fund's assets. However, the Fund does not invest in securities issued by companies in default at the time of purchase. Unrated securities may comprise up to 25% of the Fund's assets.
The analysis and selection of debt instruments is made independently from rating agencies.
These securities may take any form: bonds and other fixed- or variable-rate securities; securities containing legal and financial clauses, such as the possibility for the issuer to recall its debt under conditions set forth at issuance, coupon enhancement clauses, coupon indexing clauses, etc.

Anaxis Bond Opportunity Europe 2018
6
Government bonds and similar securities
The Fund may also invest up to 50% of its assets in Investment Grade debt instruments issued by OECD governments and up to 10% of its assets in High Yield sovereign debt, regardless of currency.
Clarifications on the legal nature of fixed-income instruments
Negotiable debt securities of any kind;
Fixed-, variable- or floating-rate bonds;
Negotiable medium-term notes (BMTNs);
Euro medium-term notes (EMTNs), excluding structured EMTNs and EMTNs with embedded forward financial instruments;
Convertible bonds;
Inflation-indexed bonds;
Treasury notes;
Commercial papers;
Certificates of deposit.
2. Convertible bonds and related securities
The Fund may invest up to 10% of its assets in convertible bonds (or related instruments) with a bond profile, i.e. if the conversion option is largely out-of-the-money, has no significant value and does not generate a convexity effect on the price of the convertible for small variations in the price of the underlying equity. This strategy can enable the Fund to take advantage of attractive opportunities in securities similar to conventional corporate bonds, with the benefit of an option not priced in by the market. In such case, the portfolio management team will ensure that the Fund's overall equity risk does not exceed 10% of net assets. The Fund may also invest up to 10% of net assets in hybrid securities.
3. Equities
Equity exposure is limited to 10% of the Fund's assets. The Fund does not purchase stocks on the market and does not take part in IPOs. However, the Fund may be exposed to this asset category due to the sensitivity of convertible bonds held to the price of underlying equities. Furthermore, the Fund may directly hold equities after exercising the conversion option attached to convertible bonds. Although such direct positions are not intended to be held over the long term, the Fund is not required to sell them within a predefined period.
4. Deposits
For the purpose of managing its cash holdings, the Fund may carry out deposits with one or more credit institutions, within the limit of 50% of its assets. Nonetheless, it may not carry out deposits of more than 20% of its assets within the same institution.
5. Derivatives
The Fund may invest in the regulated, organised or OTC futures markets for the purpose of carrying out forex hedging transactions or adjusting the portfolio's bond sensitivity (upward or downward) within a range of 0 to 5. Instruments used may include, in particular, futures, forward foreign exchange contracts and simple interest rate swaps. The Fund's overall exposure, including derivatives, is limited to 120% of net assets.
Clarifications on derivatives
Type of markets in which the Fund may invest:
regulated,
organised,
OTC.
Risks to which the portfolio management team plans to expose the Fund:
interest rate,

Anaxis Bond Opportunity Europe 2018
7
foreign exchange.
Types of transactions, all of which are limited to the achievement of the investment objective:
hedging,
exposure.
Types of instruments used:
futures,
swaps,
forward foreign exchange contracts.
Strategy for using derivatives to achieve the investment objective:
hedging of foreign exchange risk,
variable hedging of interest rate risk according to investment committee forecasts,
increasing exposure to interest rate risk, according to investment committee forecasts, within the limit of overall interest rate risk exposure of 120% of net assets.
6. Securities with embedded derivatives
The Fund may invest in this asset category insofar as it is authorised to hold convertible bonds within the limit of 10% of its assets.
Furthermore, the corporate bonds in which the Fund predominantly invests often contain clauses offering the issuer the possibility of redeeming its bonds early, or requiring it to offer early redemption to bondholders, particularly after the expiry of a certain period, subsequent to certain events or if certain accounting or financial indicators are exceeded. The conditions for exercising these options may vary, and may or may not offer compensation to bondholders.
7. UCITS
The Fund may invest up to 10% of its assets in other French or foreign UCITS with a money market or bond strategy compliant with the European directive 2009/65/EC. These UCITS may be managed by Anaxis Asset Management or any other related entity.
8. Cash loans
The Fund does not borrow cash. Nevertheless, it may have a temporary debit balance, within the limit of 10%, due to transactions related to the Fund's payment flows: investments, divestments and liabilities transactions.
9. Securities lending and borrowing
None. ■ Contracts constituting
financial guarantees : None.
■ Overall risk : The method chosen by the asset management company to calculate the overall risk ratio of the UCIT is the commitment calculation method.
■ Risk profile : Your money will be predominantly invested in financial instruments selected by the portfolio management company. These instruments will be subject to market trends and developments.
a. Main risks : Capital risk: The Fund does not offer any guarantee or protection. There is a risk
that subscribers will not recover all of the capital initially invested.
Credit risk: This is the potential risk that the issuer's rating will be downgraded, which may lead to a decrease in the price of the security and thus the Fund's net asset value (NAV). Furthermore, subscribers should note that investments in low-rated or unrated securities generate higher credit risk.

Anaxis Bond Opportunity Europe 2018
8
Interest rate risk: When interest rates rise, bond prices fall. These fluctuations can lead to a decrease in the Fund's NAV. The portfolio's sensitivity may vary within a range of 0 to 5.
Risk linked to derivatives: The use of derivatives may increase interest rate risk beyond that associated with the bonds and other debt securities held, but without exceeding the 0-5 range indicated above.
Risk linked to discretionary portfolio management: As the Fund is managed on a discretionary basis, there is a risk that the portfolio management team will not select the top-performing securities. Consequently, the Fund may underperform its investment objective and the investment choices made may lead to a decrease in the Fund's NAV.
a. Ancillary risks: Foreign exchange risk: Up to 50% of the Fund's assets may be invested in securities denominated in currencies other than the Fund's reference currency (the euro). The foreign exchange risk associated with these investments will be hedged with the aim of keeping this exposure under 5% (all currencies combined). In addition, the Fund offers unit categories denominated in currencies other than the euro (Swiss franc and US dollar). For these unit categories, foreign exchange risk against the euro is also kept below 5% via an appropriate hedge. However, unitholders should note that the Fund may be exposed to residual foreign exchange risk, arising either from an imperfect hedge of the securities portfolio or specific to non euro-denominated unit categories. This risk, limited to 5% of net assets, may lead to a decrease in NAV.
Risk associated with holding convertible bonds: Up to 10% of the Fund's net assets may be exposed to the convertible bond market. The value of convertible bonds depends on several factors such as interest rate levels, changes in prices of underlying securities and changes in prices of embedded derivatives. These various factors can lead to a decrease in the Fund's NAV.
Equity risk: Up to 10% of the Fund's net assets may be exposed to the equity market. This limit is defined as the sum of direct and indirect exposures via convertible bonds or undertakings for collective investment. The Fund's NAV will decrease if this market declines.
Risk linked to investments in UCITS: Unitholders should note that there are liquidity risks and risks of capital losses associated with potential investments of up to 10% of the Fund's assets in UCITS. These risks may lead to a decrease in the Fund's NAV.
Counterparty risk: This risk arises from the use of financial contracts negotiated over the counter with market counterparties. These transactions expose the Fund to the risk of default by one or more counterparties and may lead to a decrease in the Fund's NAV.
Inflation risk: The Fund may be exposed to inflation risk, i.e. a widespread increase in prices.
Liquidity risk: Under very difficult market conditions, the Fund may, due to an exceptionally high volume of redemption requests or due to other exceptional circumstances, be unable to honour redemption requests according to the conditions indicated below. In such case, the portfolio management company may, in accordance with the Fund Rules and in the investors' best interest, suspend redemptions or extend the settlement period.
■ Guarantee or protection : None.
■ Minimum recommended investment period : The recommended investment period runs until maturity on 31 December 2018.
■ Auditors : PWC Sellam

Anaxis Bond Opportunity Europe 2018
9
2. Investment policy
Fund Management Comments
The European credit market underwent two distinct phases in 2015. It followed a very positive trend during the first few months of the year, driven by the exceptional measures taken by the ECB, after which risk aversion began gradually climbing.
The problems surrounding Greece (which on 30 June defaulted on a €1.6 billion loan granted by the IMF), falling oil and commodity prices, turbulence in China and Brazil, concerns over the Fed's rate hike plans (finally announced in December), financial woes plaguing a number of major groups, and the Volkswagen scandal were just a few of the contributing factors to the market's subsequent decline, without of course sparing the corporate debt segment.
The German 10-year rose from 0.54% to 0.63% over the year. Yields on HY corporate debt, offering both high returns and high credit risk, represented by the Bank of America Merrill Lynch H7PC ex-financials index, followed an irregular curve. The H7PC index fell from 4.32% at end-2014 to a low point of 3.50% at end-February, before climbing again to peak at 5.53% at end-September, capping off the year at 5.24% in the wake of a particularly volatile quarter. The portfolio's estimated actuarial return is over 6% (excl. fees).
The portfolio mainly consisted of HY corporate bonds (speculative category) which, according to the portfolio managers’ analysis, offered a high yield on credit risk with a low probability of default. The fund was partial to Western European issuers, in line with its positioning, and did not invest in financial sector issuers.
The fund was not directly exposed to oil production or exploration companies and was thus less affected by oil price volatility. Performance was also boosted by a sharp rebound in its consumer sector positions in the first half of the year, but was hurt by its exposure to the construction and infrastructure sectors.
The fund is moderately correlated with characteristic credit market indicators. Its beta with the European HY market, excluding financials (represented by the H7PC index) is just 0.62.
Performance
The different unit categories delivered the following performances over the year:
Unit 2015 performance Unit 2015 performance
E1 +0.57% I +1.03%
E2 +0.58% J +1.08%
U1 +0.69% K -0.98% (over 11 months, since unit launch)
S1 -0.58%
Source: BNP Paribas Fund Services, Anaxis Asset Management. Each performance is given in the currency of denomination of the unit category in question. The data provided pertain to past performances, which are not reliable indicators of future performances
Dividends
The fund offers capitalisation units (E1, U1, S1, I, J, K) as well as dividend units (E2).
In 2015, the E2 unit paid a dividend of €5.73 in respect of fiscal year 2014. The ex-date was 18 May 2015.
The E2 unit will also pay a dividend in respect of fiscal year 2015. This dividend is indicated on the corresponding page of this annual report.
Measurement of overall risk
The commitment method is used to measure overall risk. The fund's leverage is limited to 100% of net assets.
Information on portfolio management activity in 2015
One bond reached maturity in 2015 and a series of 43 other bonds issued by 30 different groups were early-redeemed for a total of $36 million, i.e. 27% of the fund's average AuM in 2015.
AuM grew over the course of the year from €97.9 million to €158.6 million, an increase of €60.7 million. Several purchases were carried out to invest subscriptions and maintain the fund's investment level.

Anaxis Bond Opportunity Europe 2018
10
These purchases covered a wide variety of sectors, with the aim of obtaining a balance and avoiding a concentration of risks in certain specific factors. The purchases were made in several currencies (EUR, USD, GBP, NOK, SEK), but the corresponding foreign exchange risk is hedged.
Information on financial contracts
The fund only used forward foreign exchange contracts entered into with BNP Paribas Securities Services. The purpose of some of these contracts was to hedge against foreign exchange risk arising from investments in currencies other than the EUR, for example when the fund bought bonds denominated in GBP, CHF, NEK, etc.
Similar opposing transactions were carried out to hedge against the foreign exchange risk specific to units denominated in USD or CHF, in the interest of protecting them against exchange rate fluctuations between the fund's currency of denomination (EUR) and the currency in which their NAV is denominated (USD or CHF).
No financial contracts were used over the course of 2015 in order to generate additional exposure to a given market or underlying instrument, nor were any financial guarantees implemented for this purpose.
Securities and affiliated funds
The fund does not invest in securities issued by the portfolio management company or affiliated entities.
At no time over the course of 2015 did the fund hold any units or shares in collective investment undertakings managed by Anaxis Asset Management or affiliated entities.
Affiliated unitholders
At no time over the course of 2015 were the fund's units held by the portfolio management company, affiliated entities, their associates, executive managers or employees.
ESG criteria
Anaxis Asset Management predominantly bases its investment process on economic and financial analysis. It does not explicitly take into consideration criteria such as an issuer's respect for the environment, corporate social responsibility or good governance (ESG criteria).
Intermediation and other fees
Anaxis Asset Management does not charge intermediation or account activity fees on the transactions carried out for the fund. The company does not receive rebates from the custodian or from any other service provider or intermediary involved in the management of the fund.
The provision for custodian and accounting delegation fees is 0.10% (annualised).
The decision-making and intermediation fees are below the regulatory maximum.
Intermediary selection procedure
The portfolio managers work with intermediaries which are required to be on the list of intermediaries approved by the portfolio management company in accordance with internal procedures. This list is prepared on the basis of objective criteria that notably take into consideration the quality of service provided and pricing conditions. Additional information may be obtained on request from the portfolio management company or downloaded from its website at www.analxis-am.com.
Significant post-closing events
None.

Anaxis Bond Opportunity Europe 2018
11
Section II: Annual Financial Statements
1. Balance sheet – Assets
FY ended 31/12/2015
FY ended 31/12/2014
Net fixed assets - Share - -
Deposits - -
Financial instruments 144 214 961.11 94 611 493.23
Equities and equivalent securities - -
Traded on a regulated or equivalent market - -
Not traded on a regulated or equivalent market - -
Bonds and equivalent securities 126 401 164.52 76 664 107.79
Traded on a regulated or equivalent market 126 401 164.52 76 664 107.79
Not traded on a regulated or equivalent market - -
Debt securities 17 813 796.59 17 947 385.44
Traded on a regulated or equivalent market – Negotiable debt securities - -
Traded on a regulated or equivalent market – Other debt instruments 17 813 796.59 17 947 385.44
Not traded on a regulated or equivalent market - -
Investments in mutual funds - -
Standard UCITS and AIFs for non -professional investors and equivalent funds from other EU member states - -
Other funds for non-professional investors and equivalent funds from other EU member states - -
Standard professional funds and equivalent funds from other EU member states and listed securitisation undertakings - -
Other professional funds and equivalent funds from other EU member states and unlisted securitisation undertakings - -
Other non-European undertakings - -
Temporary security transactions - -
Receivables representing reverse repurchase agreement - -
Receivables representing securities loaned - -
Borrowed securities - -
Securities given under repurchase agreements - -
Other temporary transactions - -
Forward financial instruments - -
Transactions on a regulated or equivalent market - -
Other transactions - -
Other financial instruments - -
Receivables 86 663 990.85 55 689 243.97
Foreign currency forward exchange transactions Other 86 480 918.37 55 648 657.04
Other 183 072.48 40 586.93
Cash accounts 14 191 153.86 3 541 328.54
Cash 14 191 153.86 3 541 328.54
TOTAL ASSETS 245 070 105.82 153 842 065.74

Anaxis Bond Opportunity Europe 2018
12
2. Balance sheet – Liabilities
FY ended 31/12/2015
FY ended 31/12/2014
Equity
Capital 150 437 397.35 93 932 337.35
Undistributed net capital gains/losses from previous years (a) - -
Retained earnings (a) 474.37 192.25
Net capital gains and losses for the financial year (a,b) -3 590 877.53 -1 342 708.43
Income for the financial year (a,b) 11 734 592.57 5 327 870.09
Total equity 158 581 586.76 97 917 691.26
(=Amount representative of net assets)
Financial instruments - -
Sales of financial instruments - -
Temporary securities transactions - -
Debts representing securities sold under repurchase agreements - -
Debts representing securities borrowed - -
Other temporary transactions - -
Forward financial transactions - -
Transactions on a regultaed or equivalent market - -
Other transactions - -
Debts 86 488 096.35 55 924 374.48
Forward currency transactions 86 140 437.83 55 716 312.74
Others 347 658.52 208 061.74
Cash accounts 422.71 -
Bank overdrafts 422.71 -
Borrowings - -
TOTAL LIABILITIES 245 070 105.82 153 842 065.74
(a) Including adjustment accounts
(b) Minus interim dividends paid during the financial year
Anaxis Bond Opportunity Europe 2018
13
3. Off-balance sheet
FY ended 31/12/2015
FY ended 31/12/2014
Hedging transactions None None
Commitments on regulated or equivalent markets - -
OTC commitments - -
Other commitments - -
Other transactions None None
Commitments on regulated or equivalent markets - -
OTC commitments - -
Other commitments - -

Anaxis Bond Opportunity Europe 2018
14
4. Income statement
FY ended 31/12/2015
FY ended 31/12/2014
Income on financial transactions
Income on equity and similar securities 0.40 -
Income on bonds and similar securities 9 692 775.10 3 725 270.45
Income on debt instruments 1 621 995.83 831 432.54
Income on forward financial instruments - -
Income on temporary purchases and sales of securities - -
Income on deposits and cash accounts - 30.04
Other financial income - -
TOTAL (I) 11 314 771.33 4 556 733.03
Charges on financial transactions
Charges on temporary purchases and sales of securities - -
Charges on forward financial instruments - -
Charges on financial debt -3 282.54 -20 877.15
Other financial charges - -
TOTAL (II) -3 282.54 -20 877.15
Income on financial transactions (I + II) 11 311 488.79 4 535 855.88
Other income (III) - -
Administrative fees and depreciation expenses (IV) -1 764 174.20 -890 002.27
Net income for the financial year (I + II + III + IV) 9 547 314.59 3 645 853.61
Income adjustment for the financial year (V) 2 187 277.98 1 682 016.48
Interim dividends paid in respect of the financial year (VI) - -
income (I + II + III + IV + V + VI) 11 734 592.57 5 327 870.09

Anaxis Bond Opportunity Europe 2018
15
Section III: Annual Financial Statements - Notes
1. Accounting rules and methods
The undertaking complied with ANC (Accounting Standards Authority) Regulation No. 2014-01 of 14 January 2014 governing the chart of accounts of open-ended mutual funds.
The accounting currency is the Euro.
All marketable securities comprising the portfolio were recognised at historic cost, excluding fees.
Any non-euro-denominated futures and options held in the portfolio are translated into the accounting currency at the Paris exchange rate observed at the valuation date.
The portfolio’s value is determined on each NAV calculation date and on the balance sheet date, in accordance with the followings methods:
Marketable securities
- Listed securities: market value - including accrued coupons (closing price at D)
However, any marketable securities whose price was not observed on the valuation date, or that were quoted by contributors and whose price was corrected, as well as securities not traded on a regulated market, are measured under the responsibility of the portfolio management company (or the Board of Directors for corporate funds structures) at their probable trade value. Prices are corrected by the portfolio management company based on its knowledge of the issuers and/or markets.
- Mutual funds: at the last known NAV; failing that, at the last estimated value. The net asset values of foreign mutual funds determined on a monthly basis are confirmed by the fund administrators. Valuations are updated weekly on the basis of estimates provided by the fund administrators and validated by the fund manager.
- Debt securities and similar negotiable instruments that are not involved in significant transactions are measured using an actuarial method; the interest rate used is the rate applicable to equivalent securities adjusted, where applicable, for a differential reflecting the issuer's intrinsic characteristics. In the absence of sensitivity, securities with a residual maturity of three months are measured at the last rate to maturity. For securities with a maturity of less than three months, interest is calculated on a straight-line basis.
- EMTNs are marked-to-market at prices provided by the counterparties. These valuations are checked by the portfolio management company.
- Temporary purchases and sales of securities:
- Securities lending: receivables representing loaned securities are measured at the securities' MtM.
- Securities borrowing: borrowed securities and the debt representing borrowed securities are measured at the securities' MtM.
- Collateral: as regards securities received as collateral for securities lending transactions, the fund has chosen to recognise these securities in the balance sheet for the amount of the debt corresponding to the obligation to return the securities.
- Securities sold under repurchase agreements with a residual maturity of three months or less: the debt is individually recognised on the basis of the contractual price. In such case, the corresponding interest is calculated on a straight-line basis.
- Long-term repurchase agreements are recorded and measured at their nominal value, even if they have a maturity of more than three months. Accrued interest is then added to this amount. However, some contracts include specific terms and conditions in the event of early redemption, in order to incorporate the impact of an increase in the counterparty's cost of funds curve. This impact may be subtracted from accrued interest, with no floor value. The impact is proportional to the residual maturity of the repurchase agreement and the observed difference between the contractual margin and the market margin for a given maturity date.

Anaxis Bond Opportunity Europe 2018
16
- Repurchase agreements with a residual maturity of three months or less: Market value. The debt measured on the basis of the contractual value is recorded on the liabilities side of the balance sheet. In such case, the corresponding interest is calculated on a straight-line basis.
Futures and options
Futures: settlement price at D. The calculation of the off-balance sheet valuation is based on the nominal, the settlement price and, where applicable, the exchange rate.
Currency Futures: revaluation of currency commitments at the swap rate determined according to the contract maturity.
Term Deposits: terms deposits are recorded and measured at their nominal amount, even if they have a maturity of more than three months. Accrued interest is then added to this amount. However, some contracts include specific terms and conditions in the event of early redemption, in order to incorporate the impact of an increase in the counterparty's cost of funds curve. This impact may be subtracted from accrued interest, which cannot be negative. Accordingly, term deposits are at the very least measured at their nominal value.
Interest rate swaps:
- for swaps with an expiry of less than three months, interest is calculated on a straight-line basis.
- swaps with an expiry of more than three months are marked-to-market.
Synthetic products (combining a security and a swap) are recognised globally. Interest receivable on swaps is calculated on a straight-line basis.
Asset swaps and synthetic products are marked-to-market. The valuation of asset swaps is based on the valuation of the hedged securities, minus the impact of the change in credit spreads. This impact is measured using the average spreads provided by four counterparties surveyed monthly, corrected for a margin according to the issuer's rating.
The off-balance sheet commitment linked to swaps is recorded at their nominal value.
Structured swaps (swaps with embedded options): these swaps are marked-to-market at prices provided by the counterparties. These valuations are checked by the portfolio management company.
The off-balance sheet commitment linked to structured swaps is recorded at their nominal value.
Management fees
- E1, F1, U1 and S1 units: 1.35% maximum (incl. VAT)
- I, J and K units: 0.85% maximum (incl. VAT)
Management fees are calculated on the basis of net assets. They are expensed directly in the Fund's income statement.
Management fees cover all expenses invoiced to the Fund, with the exception of transaction fees. Transaction fees include intermediation fees (brokerage, stock market tax, etc.) and the account activity fee, where applicable, that may be charged by the custodian and the portfolio management company.
External management fees
0.10% with tax (maximum) of net assets, with any surplus covered by the portfolio management company.
Incentive fees
10% with tax of the any performance beyond an annualised net performance of 5.0%.
With each NAV calculation, the fund's excess return is defined as the positive difference between the fund's net assets, before factoring in any provision for incentive fees and after factoring in fixed management fees, and the net assets of a notional fund with an annualised net performance of +5% and recording the same subscriptions and redemptions as the actual fund. With each NAV calculation, a provision in the amount of 10% (with tax) of the excess return or, where applicable, a provision reversal if the fund underperforms, is recognised. In the event of redemptions, the share of the incentive fee

Anaxis Bond Opportunity Europe 2018
17
associated with the redeemed units is permanently paid to the fund. Aside from these cases, the annual period taken into consideration when calculating incentive fees is the financial year. However, the initial fees were calculated over a period ranging from the Fund’s inception date (6 June 2013) to 31 December 2014.
Chargebacks of management fees
None.
Interest recognition method
Fixed income is recognised using the redeemed coupon method.
Distribution of earnings
E1 unit (FR0011426881): Capitalisation
E2 unit (FR0011512375): Distribution and/or capitalisation
U1 unit (FR0011426915): Capitalisation
S1 unit (FR0011426923): Capitalisation
I unit (FR0011426931): Capitalisation
J unit (FR0011426949): Capitalisation
Allocation of net capital gains
Capitalisation for all unit categories.
Changes affecting the Fund
None.

Anaxis Bond Opportunity Europe 2018
18
2. Change in net assets
FY ended 31/12/2015
FY ended 31/12/2014
Net assets at start of financial year 97 917 691.26 29 119 246.83
Subscriptions (including subscription fees paid to the Fund) 73 415 869.69 74 056 540.67
Redemptions (minus fees paid to the Fund) -13 370 375.77 -5 609 896.44
Capital gains realised on deposits and financial instruments 720 003.20 422 653.38
Capital losses realised on deposits and financial instruments -2 572 025.56 -726 133.38
Capital gains realised on forward financial instruments - -
Capital losses realised on forward financial instruments - -
Transaction fees -24.23 -3 329.36
Foreign exchange differences -863 058.93 -803 104.52
Change in valuation difference on deposits and financial instruments -5 795 160.75 -2 093 050.11
Valuation difference Year N -7 533 302.38 -1 738 141.63
Valuation difference Year N-1 1 738 141.63 -354 908.48
Change in valuation difference on forward financial instruments - -
Valuation difference Year N - -
Valuation difference Year N-1 - -
Distribution for the previous year based on net capital gains and losses - -
Distribution for the previous year based on income -418 646.74 -91 089.42
Net income for the financial year before accruals 9 547 314.59 3 645 853.61 Interim dividend(s) paid during the financial year based on net capital gains and losses - -
Interim dividend(s) paid during the financial year based on income - -
Other items - -
NET ASSETS AT END OF FINANCIAL YEAR 158 581 586.76 97 917 691.26

Anaxis Bond Opportunity Europe 2018
19
3. Additional disclosures 1
FY ended 31/12/2015
Commitments given or received None
Commitments given or received (capital guarantee or other commitments)(*) -
Present value of financial instruments in portfolio constituting collateral None
Financial instruments received as collateral and not recorded in the balance sheet -
Financial instruments pledged as collateral and maintained on the initial balance sheet line -
Financial instruments held in portfolio issued by service provider or entities belonging to its group
None
Deposits -
Equities -
Fixed income securities -
UCITS -
Temporary purchases and sales of securities -
Swaps (nominal) -
Present value of borrowed financial instruments None
Securities sold under repurchase agreements -
Securities purchased under resale agreements -
Borrowed securities -
(*) Information concerning guaranteed UCITS is provided in the accounting rules and methods.

Anaxis Bond Opportunity Europe 2018
20
4. Additional disclosures 2
Issues and redemptions during the accounting period
FY ended 31/12/2015
Units
Category E1 (currency: EUR)
Number of securities issued 269 728.2435
Number of securities redeemed 45 095.7232
Category E2 (currency: EUR)
Number of securities issued 51 249.8341
Number of securities redeemed 9 145.0000
Category I (currency: EUR)
Number of securities issued 180 056.7130
Number of securities redeemed 21 133.3320
Category J (currency: USD)
Number of securities issued 54 540.1414
Number of securities redeemed 4 037.6211
Category K (currency: CHF)
Number of securities issued 40 182.2951
Number of securities redeemed 1 787.0000
Category S1 (currency: CHF)
Number of securities issued 79 407.7947
Number of securities redeemed 32 257.4746
Category U1 (currency: USD)
Number of securities issued 21 986.0050
Number of securities redeemed 14 810.0000
Subscription and redemption fees
Amount (EUR)
Amount of subscription fees received 19 801.12
Amount of redemption fees received 27 171.81
Amount of subscription fees received and charged back -
Amount of redemption fees received and charged back -
Anaxis Bond Opportunity Europe 2018
21
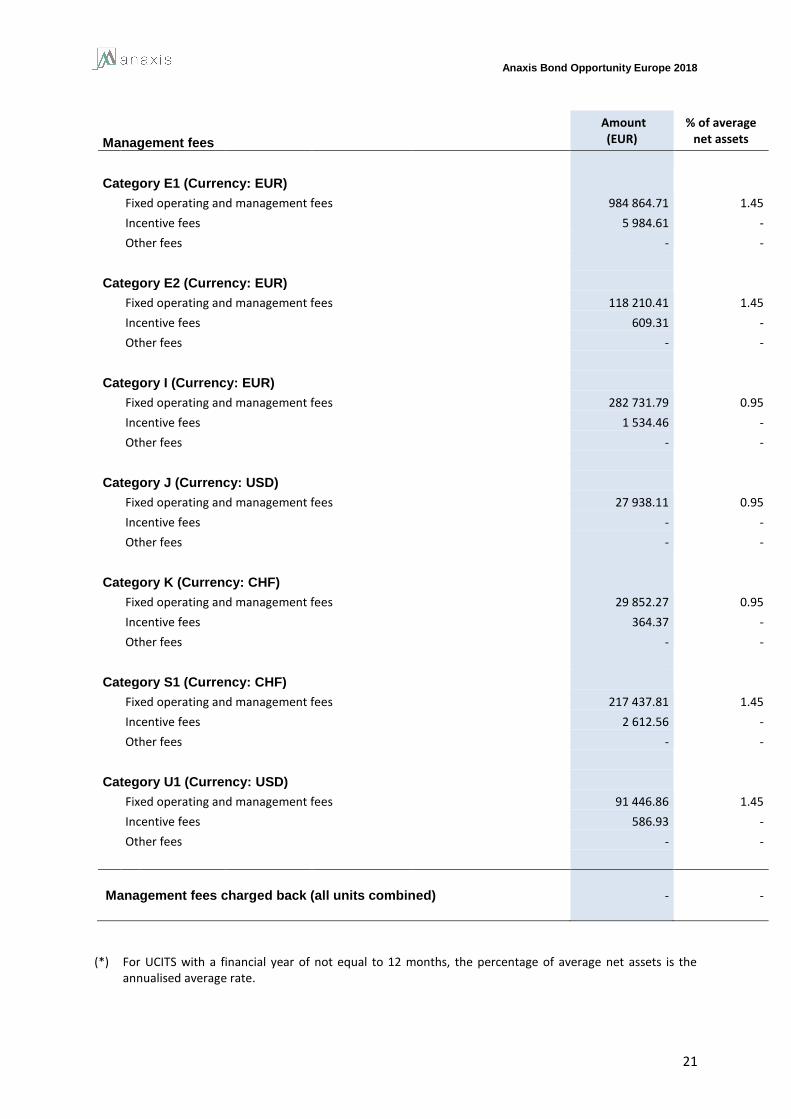
Management fees
Amount (EUR)
% of average net assets
Category E1 (Currency: EUR)
Fixed operating and management fees 984 864.71 1.45
Incentive fees 5 984.61 -
Other fees - -
Category E2 (Currency: EUR)
Fixed operating and management fees 118 210.41 1.45
Incentive fees 609.31 -
Other fees - -
Category I (Currency: EUR)
Fixed operating and management fees 282 731.79 0.95
Incentive fees 1 534.46 -
Other fees - -
Category J (Currency: USD)
Fixed operating and management fees 27 938.11 0.95
Incentive fees - -
Other fees - -
Category K (Currency: CHF)
Fixed operating and management fees 29 852.27 0.95
Incentive fees 364.37 -
Other fees - -
Category S1 (Currency: CHF)
Fixed operating and management fees 217 437.81 1.45
Incentive fees 2 612.56 -
Other fees - -
Category U1 (Currency: USD)
Fixed operating and management fees 91 446.86 1.45
Incentive fees 586.93 -
Other fees - -
Management fees charged back (all units combined)
- -
(*) For UCITS with a financial year of not equal to 12 months, the percentage of average net assets is the annualised average rate.

Anaxis Bond Opportunity Europe 2018
22
5. Breakdown of payables and receivables by type
FY ended 31/12/2015
Breakdown of receivables by type
Deposits in euro -
Deposits in other currencies -
Cash collateral -
Valuation of forward currency purchases 35 397 935.96
Exchange value of forward currency sales 51 082 982.41
Other sundry debtors -
Coupons receivable 183 072.48
TOTAL RECEIVABLES 86 663 990.85
Breakdown of payables by type
Deposits in euro -
Deposits in other currencies -
Cash collateral -
Provision for borrowing costs -
Valuation of forward currency sales 50 752 974.46
Exchange value of forward currency purchases 35 387 463.37
Fees and expenses not paid 347 658.52
Other sundry creditors -
Provision for liquidity risk -
TOTAL PAYABLES 86 488 096.35

Anaxis Bond Opportunity Europe 2018
23
6. Breakdown by legal or economic type of instrument
FY ended 31/12/2015
Assets
Bonds and similar securities 126 401 164.52
Indexed bonds -
Convertible bonds -
Participating securities -
Other bonds and similar securities 126 401 164.52
Debt securities 17 813 796.59
Traded on a regulated market 17 813 796.59
Treasury notes -
Other negotiable debt securities -
Other debt securities 17 813 796.59
Not traded on a regulated market -
Liabilities None
Sales of financial instruments
Equities -
Bonds -
Others -
Off-balance sheet None
Hedging transactions
Fixed income -
Equities -
Others -
Other transactions
Fixed income -
Equities -
Others -

Anaxis Bond Opportunity Europe 2018
24
7. Breakdown of assets, liabilities and off-balance sheet items by type of interest rate
Fixed rate Variable rate Adjustable rate Others
Assets None
Deposits - - - -
Bonds and similar securities 99 400.785.76 - 27 000 378.76 -
Debt securities 13 866 901.91 - 3 946 894.68 -
Temporary securities transactions - - - -
Cash accounts - - - 14 191 153.86
Liabilities None None None
Temporary securities transactions - - - -
Cash accounts - - - 422.71
Off-balance sheet None None None None
Hedging transactions - - - -
Other transactions - - - -

Anaxis Bond Opportunity Europe 2018
25
8. Breakdown of assets, liabilities and off-balance sheet items by residual maturity
0 to 3 months 3 months to
1 year 1 to 3 years 3 to 5 years
More than 5 years
Assets
Deposits - - - - -
Bonds and similar securities 1 048 476.64 - 23 147 361.86 87 234 344.79 14 970 981.23
Debt securities - 1 103 042.12 539 705.47 16 171 049.00 -
Temporary securities transactions - - - - -
Cash accounts 14 191 153.86 - - - -
Liabilities None None None None
Temporary securities transactions - - - - -
Financial accounts 422.71 - - - -
Off-balance sheet None None None None None
Hedging transactions - - - - -
Other operations - - - - -

Anaxis Bond Opportunity Europe 2018
26
9. Breakdown of assets, liabilities and off-balance sheet items by quotation currency
CHF GBP NOK SEK USD
Assets None None None None
Deposits - - - - -
Equities and similar securities - - - - -
Bonds and similar securities - 9 670 731 63 3 770 123.32 7 081 176.02 24 269 862.62
Debt securities - 2 088 065.48 - - -
Mutual fund securities - - - - -
Temporary securities transactions - - - - -
Other financial instruments - - - - -
Receivables 21 216 452.49 - 11 522.58 - 14 181 483.47
Cash accounts - 18 994.64 31 179.06 - 2 436 032.78
Liabilities
Sales of financial instruments - - - - -
Temporary securities transactions - - - - -
Payables 276 007.90 11 783 708.03 3 837 896.49 7 060 988.12 27 794 373.92
Cash accounts 422.71 - - - -
Off-balance sheet None None None None None
Hedging transactions - - - - -
Other operations - - - - -
Only the five currencies whose amount is most representative of the Fund's net assets are included in this table.

Anaxis Bond Opportunity Europe 2018
27
10. Distribution of earnings
Category: E1 (currency: EUR) FY ended
31/12/2015 FY ended
31/12/2014
Statement of allocation of amounts available for distribution related to income
Amounts remaining to be distributed
Retained earnings - -
Income 5 533 953.45 2 795 597.05
TOTAL 5 533 953.45 2 795 597.05
Allocation
Distribution - -
Retained earnings for the financial year - -
Capitalisation 5 533 953.45 2 795 597.05
TOTAL 5 533 953.45 2 795 597.05
Information concerning securities entitling the holder to dividends
Number of securities - -
Unit distribution - -
Tax credits associated with the distribution of earnings
Overall amount of tax credits associated with the distribution of earnings : - -
for financial year - -
for financial year N-1 - -
for financial year N-2 - -
for financial year N-3 - -
for financial year N-4 - -
Statement of allocation of amounts available for distribution related to income
Amounts remaining to be distributed
Undistributed net capital gains and losses from previous financial years - -
Net capital gains and losses for the financial year -3 322 889.39 -1 137 357.19
Interim dividends paid on net capital gains and losses for the financial year - -
TOTAL -3 322 889.39 -1 137 357.19
Allocation
Distribution - -
Retained earnings for the financial year - -
Undistributed net capital gains and losses -3 322 889.39 -1 137 357.19
TOTAL -3 322 889.39 -1 137 357.19
Information concerning securities entitling the holder to dividends
Number of securities - -
Unit distribution - -

Anaxis Bond Opportunity Europe 2018
28
Category: E2 (currency: EUR) FY ended
31/12/2015 FY ended
31/12/2014
Statement of allocation of amounts available for distribution related to income
Amounts remaining to be distributed
Retained earnings 474.37 192.25
Income 764 110.80 347 987.77
TOTAL 764 585.17 348 180.02
Allocation
Distribution 355 758.04 347 899.29
Retained earnings for the financial year 408 827.13 280.73
Capitalisation - -
TOTAL 764 585.17 348 180.02
Information concerning securities entitling the holder to dividends
Number of securities 102 820.2430 60 715.4089
Unit distribution 3.46 5.73
Tax credits associated with the distribution of earnings
Overall amount of tax credits associated with the distribution of earnings : - -
for financial year - -
for financial year N-1 - -
for financial year N-2 - -
for financial year N-3 - -
for financial year N-4 - -
Statement of allocation of amounts available for distribution related to income
Amounts remaining to be distributed
Undistributed net capital gains and losses from previous financial years - -
Net capital gains and losses for the financial year -464 762.98 -138 622.42
Interim dividends paid on net capital gains and losses for the financial year - -
TOTAL -464 762.98 -138 622.42
Allocation
Distribution - -
Retained earnings for the financial year - -
Undistributed net capital gains and losses -464 762.98 -138 622.42
TOTAL -464 762.98 -138 622.42
Information concerning securities entitling the holder to dividends
Number of securities - -
Unit distribution - -

Anaxis Bond Opportunity Europe 2018
29
Category: I (currency: EUR) FY ended
31/12/2015 FY ended
31/12/2014
Statement of allocation of amounts available for distribution related to income
Amounts remaining to be distributed
Retained earnings - -
Income 2 884 301.62 1 192 771.79
TOTAL 2 884 301.62 1 192 771.79
Allocation
Distribution - -
Retained earnings for the financial year - -
Capitalisation 2 884 301.62 1 192 771.79
TOTAL 2 884 301.62 1 192 771.79
Information concerning securities entitling the holder to dividends
Number of securities - -
Unit distribution - -
Tax credits associated with the distribution of earnings
Overall amount of tax credits associated with the distribution of earnings : - -
for financial year - -
for financial year N-1 - -
for financial year N-2 - -
for financial year N-3 - -
for financial year N-4 - -
Statement of allocation of amounts available for distribution related to income
Amounts remaining to be distributed
Undistributed net capital gains and losses from previous financial years - -
Net capital gains and losses for the financial year -1 625 528.34 -447 601.14
Interim dividends paid on net capital gains and losses for the financial year - -
TOTAL -1 625 528.34 -447 601.14
Allocation
Distribution - -
Retained earnings for the financial year - -
Undistributed net capital gains and losses -1 625 528.34 -447 601.14
TOTAL -1 625 528.34 -447 601.14
Information concerning securities entitling the holder to dividends
Number of securities - -
Unit distribution - -

Anaxis Bond Opportunity Europe 2018
30
Category: J (currency: USD) FY ended
31/12/2015 FY ended
31/12/2014
Statement of allocation of amounts available for distribution related to income
Amounts remaining to be distributed
Retained earnings - -
Income 541 836.87 111 593.17
TOTAL 541 836.87 111 593.17
Allocation
Distribution - -
Retained earnings for the financial year - -
Capitalisation 541 836.87 111 593.17
TOTAL 541 836.87 111 593.17
Information concerning securities entitling the holder to dividends
Number of securities - -
Unit distribution - -
Tax credits associated with the distribution of earnings
Overall amount of tax credits associated with the distribution of earnings : - -
for financial year - -
for financial year N-1 - -
for financial year N-2 - -
for financial year N-3 - -
for financial year N-4 - -
Statement of allocation of amounts available for distribution related to income
Amounts remaining to be distributed
Undistributed net capital gains and losses from previous financial years - -
Net capital gains and losses for the financial year 647 079.12 113 566.15
Interim dividends paid on net capital gains and losses for the financial year - -
TOTAL 647 079.12 113 566.15
Allocation
Distribution - -
Retained earnings for the financial year - -
Undistributed net capital gains and losses 647 079.12 113 566.15
TOTAL 647 079.12 113 566.15
Information concerning securities entitling the holder to dividends
Number of securities - -
Unit distribution - -

Anaxis Bond Opportunity Europe 2018
31
Category: K (currency: CHF) FY ended
31/12/2015
Statement of allocation of amounts available for distribution related to income
Amounts remaining to be distributed
Retained earnings -
Income 244 838.21
TOTAL 244 838.21
Allocation
Distribution -
Retained earnings for the financial year -
Capitalisation 244 838.21
TOTAL 244 838.21
Information concerning securities entitling the holder to dividends
Number of securities -
Unit distribution -
Tax credits associated with the distribution of earnings
Overall amount of tax credits associated with the distribution of earnings : -
for financial year -
for financial year N-1 -
for financial year N-2 -
for financial year N-3 -
for financial year N-4 -
Statement of allocation of amounts available for distribution related to income
Amounts remaining to be distributed
Undistributed net capital gains and losses from previous financial years -
Net capital gains and losses for the financial year -241 007.64
Interim dividends paid on net capital gains and losses for the financial year -
TOTAL -241 007.64
Allocation
Distribution -
Retained earnings for the financial year -
Undistributed net capital gains and losses -241 007.64
TOTAL -241 007.64
Information concerning securities entitling the holder to dividends
Number of securities -
Unit distribution -

Anaxis Bond Opportunity Europe 2018
32
Category: S1 (currency: CHF) FY ended
31/12/2015 FY ended
31/12/2014
Statement of allocation of amounts available for distribution related to income
Amounts remaining to be distributed
Retained earnings - -
Income 1 299 620.69 625 348.20
TOTAL 1 299 620.69 625 348.20
Allocation
Distribution - -
Retained earnings for the financial year - -
Capitalisation 1 299 620.69 625 348.20
TOTAL 1 299 620.69 625 348.20
Information concerning securities entitling the holder to dividends
Number of securities - -
Unit distribution - -
Tax credits associated with the distribution of earnings
Overall amount of tax credits associated with the distribution of earnings : - -
for financial year - -
for financial year N-1 - -
for financial year N-2 - -
for financial year N-3 - -
for financial year N-4 - -
Statement of allocation of amounts available for distribution related to income
Amounts remaining to be distributed
Undistributed net capital gains and losses from previous financial years - -
Net capital gains and losses for the financial year 722 590.60 -49 605.33
Interim dividends paid on net capital gains and losses for the financial year - -
TOTAL 722 590.60 -49 605.33
Allocation
Distribution - -
Retained earnings for the financial year - -
Undistributed net capital gains and losses 722 590.60 -49 605.33
TOTAL 722 590.60 -49 605.33
Information concerning securities entitling the holder to dividends
Number of securities - -
Unit distribution - -

Anaxis Bond Opportunity Europe 2018
33
Category: U1 (currency: EUR) FY ended
31/12/2015 FY ended
31/12/2014
Statement of allocation of amounts available for distribution related to income
Amounts remaining to be distributed
Retained earnings - -
Income 465 930.93 254 572.11
TOTAL 465 930.93 254 572.11
Allocation
Distribution - -
Retained earnings for the financial year - -
Capitalisation 465 930.93 254 572.11
TOTAL 465 930.93 254 572.11
Information concerning securities entitling the holder to dividends
Number of securities - -
Unit distribution - -
Tax credits associated with the distribution of earnings
Overall amount of tax credits associated with the distribution of earnings : - -
for financial year - -
for financial year N-1 - -
for financial year N-2 - -
for financial year N-3 - -
for financial year N-4 - -
Statement of allocation of amounts available for distribution related to income
Amounts remaining to be distributed
Undistributed net capital gains and losses from previous financial years - -
Net capital gains and losses for the financial year 693 641.10 316 911.50
Interim dividends paid on net capital gains and losses for the financial year - -
TOTAL 693 641.10 316 911.50
Allocation
Distribution - -
Retained earnings for the financial year - -
Undistributed net capital gains and losses 693 641.10 316 911.50
TOTAL 693 641.10 316 911.50
Information concerning securities entitling the holder to dividends
Number of securities - -
Unit distribution - -

Anaxis Bond Opportunity Europe 2018
34
11. Statement of income and other characteristics items
Category: E1 (currency: EUR) 06/06/2013 (1) 31/12/2013 (*) 31/12/2014 31/12/2015
Amounts remaining to be distributed 100.00 104.53 105.91 106.51
Net assets (in € thousands) 1 145.00 16 276.81 51 978.46 76 200.79
Number of securities 11 450.0000 155 700.4884 490 759 0337 715 391.5540
Payment date 31/12/2013 31/12/2014 31/12/2015
Unit distribution based on net capital gains and losses - - -
(including interim dividends)(in €)
Unit distribution based on income - - -
(including interim dividends)(in €)
Unit tax credit (*) - - -
Individuals (in €)
Unit capitalisation based on net capital gains and losses 0.48 -2.31 -4.64
Unit capitalisation based on income 1.60 5.69 7.73
Category: E2 (currency: EUR) 13/06/2013 (1) 31/12/2013 (*) 31/12/2014 31/12/2015
Amounts remaining to be distributed 100.00 104.57 104.47 99.56
Net assets (in € thousands) 1 725.00 3 692.25 6 343.14 10 237.68
Number of securities 17 250.0000 35 306.5041 60 715.4089 102 820.2430
Payment date 31/12/2013 31/12/2014 31/12/2015
Unit distribution based on net capital gains and losses - - -
(including interim dividends)(in €)
Unit distribution based on income 1.61 5.73 3.46
(including interim dividends)(in €)
Unit tax credit (*) - - -
Individuals (in €)
Unit capitalisation based on net capital gains and losses 0.50 -2.28 -4.52
Unit capitalisation based on income - - -

Anaxis Bond Opportunity Europe 2018
35
Category: I (currency: EUR) 11/10/2013 (1) 31/12/2013 (*) 31/12/2014 31/12/2015
Amounts remaining to be distributed 100.00 102.17 103.99 105.06
Net assets (in € thousands) 3 000.00 3 603.78 20 489.92 37 396.50
Number of securities 30 000.0000 35 270.0000 197 028.6310 355 952.0120
Payment date 31/12/2013 31/12/2014 31/12/2015
Unit distribution based on net capital gains and losses - - -
(including interim dividends)(in €)
Unit distribution based on income - - -
(including interim dividends)(in €)
Unit tax credit (*) - - -
Individuals (in €)
Unit capitalisation based on net capital gains and losses -0.09 -2.27 -4.56
Unit capitalisation based on income 0.75 6.05 8.10
Category: J (currency: USD) 06/12/2013 (1) 31/12/2013 (*) 31/12/2014 31/12/2015
Amounts remaining to be distributed 100.00 100.61 102.47 103.58
Net assets (in € thousands) 730.84 730.18 2 113.57 7 195.45
Number of securities 10 000.0000 10 000.0000 24 958.7103 75 461.2306
Payment date 31/12/2013 31/12/2014 31/12/2015
Unit distribution based on net capital gains and losses - - -
(including interim dividends)(in €)
Unit distribution based on income - - -
(including interim dividends)(in €)
Unit tax credit (*) - - -
Individuals (in €)
Unit capitalisation based on net capital gains and losses 0.47 4.55 8.57
Unit capitalisation based on income 0.17 4.47 7.18

Anaxis Bond Opportunity Europe 2018
36
Category: K (currency: CHF) 02/02/2015 (1) 31/12/2015
Amounts remaining to be distributed 100.00 99.02
Net assets (in € thousands) 1 795.58 3 498.23
Number of securities 18 825.0000 38 415.2951
Payment date 31/12/2015
Unit distribution based on net capital gains and losses -
(including interim dividends)(in €)
Unit distribution based on income -
(including interim dividends)(in €)
Unit tax credit (*) -
Individuals (in €)
Unit capitalisation based on net capital gains and losses -6.27
Unit capitalisation based on income 6.37
Category: S1 (currency: CHF) 13/06/2013 (1) 31/12/2013 (*) 31/12/2014 31/12/2015
Amounts remaining to be distributed 100.00 104.46 105.54 104.93
Net assets (in € thousands) 131.85 4 098.99 11 719.01 17 433.14
Number of securities 1 610.0000 48 084.2763 133 498.9565 180 649.2766
Payment date 31/12/2013 31/12/2014 31/12/2015
Unit distribution based on net capital gains and losses - - -
(including interim dividends)(in €)
Unit distribution based on income - - -
(including interim dividends)(in €)
Unit tax credit (*) - - -
Individuals (in €)
Unit capitalisation based on net capital gains and losses 0.26 -0.37 4.00
Unit capitalisation based on income 1.32 4.68 7.19

Anaxis Bond Opportunity Europe 2018
37
Category: U1 (currency: USD) 13/06/2013 (1) 31/12/2013 (*) 31/12/2014 31/12/2015
Amounts remaining to be distributed 100.00 104.50 105.95 106.68
Net assets (in € thousands) 200.00 717.24 5 273.59 6 619.79
Number of securities 2 000.0000 9 457.4212 60 226.0525 67 402.0575
Payment date 31/12/2013 31/12/2014 31/12/2015
Unit distribution based on net capital gains and losses - - -
(including interim dividends)(in €)
Unit distribution based on income - - -
(including interim dividends)(in €)
Unit tax credit (*) - - -
Individuals (in €)
Unit capitalisation based on net capital gains and losses -1.78 5.26 10.29
Unit capitalisation based on income 1.18 4.22 6.91
(1) First valuation date.
(*) The unit tax credit is determined at the payment date, in accordance with the Tax Instruction of 04/03/93 (Inst. 4 K-1-93). Theoretical amounts, calculated according to the rules applicable to individuals, are shown here for information purposes. Instruction 4 J-2-99 of 08/11/99 also stipulates that beneficiaries of a tax credit other than individuals calculate the amount of the tax credit to which they are entitled under their own responsibility.

Anaxis Bond Opportunity Europe 2018
38
12. Inventory of financial instruments as of 31 December 2015
Asset items and name of securities Quantity Price Quotation currency Present value
% rounded of net assets
Traded on a regulated or equivalent market
126 401 164.52 79.71
ABENGOA 8,875%10-011117 REGS 650 000 15.25 USD 100 838.44 0,06
ABENGOA FINANCE 7%15-150420 900 000.00 12.50 EUR 126 614.75 0,08
ABENGOA GREEN.6,5%14-011019 400 000.00 11.50 USD 48 595.13 0,03
ABENGOA GREEN.6,5%14-011019 SR 700 000.00 11.50 USD 85 157.83 0,05
ABENGOA YIELD 7%14-151119 SR 1 800 000.00 88.50 USD 1 482 877.65 0,94
AGROKOR DD 8,875%12-010220 200 000.00 107.00 USD 204 034.21 0,13
AGROKOR DD 9,875%12-010519 1 870 000.00 107.45 EUR 2 042 143.90 1,29
AINMT SCANDINAVIA 9,75%14-0319 11 000 000.00 106.00 SEK 1 308 121.44 0,82
ALPHABET HLDG TV13-011117 900 000.00 97.75 USD 821 452.40 0,52
ARDAGH 9,25%10-151020 REGS 600 000.00 104.84 EUR 641 465.43 0,40
ARDAGH FINL 8,375%14-150619 1 896 188 102.22 EUR 1 947 105.91 1,23
ARDAGH PCK TV14-151219 1 000 000.00 98.00 USD 904 120.62 0,57
BOA OFFSHORE TV13-181218 10 000 000.00 29.00 NOK 305 665.49 0,19
BOXER PARENT TV14-151019 895 000.00 62.38 USD 530 590.07 0,33
BUILDING MAT HLDG 9%13-150918 1 300 000.00 104.50 USD 1 283 784.41 0,81
CABLE COMM SYS 7,5%13-011120 3 000 000.00 105.96 EUR 3 218 830.00 2,03
CAPSUGEL TV13-150519 144A 2 000 000.00 98.38 USD 1 829 451.65 1,15
CEGAL HOLDING TV14-260617 6 000 000.00 90.50 NOK 565 662.54 0,36
CEGEDIM 6,75%13-010420 1 105 000.00 106.38 EUR 1 194 974.63 0,75
CEMEX LUXEMBG 9,875%12-300419 250 000.00 107.00 EUR 271 957.47 0,17
CEMEX TV13-151018 SR 1 750 000.00 98.50 USD 1 605 641.22 1,01
CERBA 7%13-010220 450 000.00 104.13 EUR 482 037.50 0,30
CERBERUS NIGHT. 8,25%15-010220 3 000 000.00 103.06 EUR 3 188 110.00 2,01
CHINOS INTER A TV13-010519 1 900 000.00 25.50 USD 470 484.04 0,30
CMA CGM 7,75%15-150121 SR 1 700 000.00 87.98 EUR 1 571 670.79 0,99
CMC RAVENNA 7,50%14-010821 2 050 000.00 86.68 EUR 1 842 751.77 1,16
CONVATEC 10,875%10-151218 1 550 000.00 103.02 EUR 1 606 174.58 1,01
CONVATEC FIN TV13-150119 1 800 000.00 93.63 USD 1 616 300.75 1,02
DENALI 5,625%13-151020 1 000 000.00 105.00 USD 978 234.61 0,62
DEUT RAST GRUP 6,75%13-301220 2 450 000.00 106.85 EUR 2 620 121.88 1,65
DOF TV12-070217 2 500 000.00 75.31 NOK 199 242.09 0,13
DOF TV14-070218 10 000 000.00 65.00 NOK 685 626.13 0,43
EMPARK FDG 6,75%13-151219 1 500 000.00 107.72 EUR 1 621 417.50 1,02
EMPARK VAR 13-15.12.19 REG S 2 050 000.00 100.75 EUR 2 071 799.02 1,31
EPHIOS BONDCO TV15-010722 3 200 000.00 100.79 EUR 3 225 808.71 2,03
EUROPCAR GRP 5,75%15-150622 2 200 000.00 104.25 EUR 2 300 417.78 1,45
EXMAR NETHERLANDS TV14-070717 6 000 000.00 100.50 NOK 635 896.10 0,40
FAGE DAIRY 9,875%10-010220 SR 2 175 000.00 104.19 USD 2 171 180.51 1,37
GALAXY BIDCO TV13-151119 550 000.00 100.27 GBP 754 038.75 0,48
GANNETT CO 7,125%10-010918 1 003 000.00 102.13 USD 965 780.67 0,61
GIBSON BRANDS 8,875%13-010818 1 200 000.00 58.50 USD 688 441.64 0,43
GRUPO ISO COR F 6,625%14-0421 1 800 000.00 24.60 EUR 469 317.99 0,30
HEMA BONDCO I 6,25%14-150619 1 000 000.00 75.25 EUR 755 972.22 0,48
HEMA BONDCO I TV14-150619 1 000 000.00 73.50 EUR 737 987.84 0,47

Anaxis Bond Opportunity Europe 2018
39
HSS FINANCING 6,75%14-010819 2 574 480 100.50 GBP 3 611 275.38 2,28
HYDRA DUTCH H2 8%15-150419 390 938 103.00 EUR 416 044.38 0,26
HYDRA DUTCH H2 TV14-150419 1 300 000.00 97.20 EUR 1 279 741.01 0,81
IDH FINANCE TV13-011218 750 000.00 100.00 GBP 1 023 007.55 0,65
INTER GAME TECH 5,625%15-150220 3 500 000.00 99.00 USD 3 260 206.66 2,06
INTEROUTE FINCO 7,375%15-1020 1 700 000.00 104.91 EUR 1 813 336.86 1,14
INTEROUTE FINCO TV15-151020 900 000.00 102.25 EUR 933 866.49 0,59
JBS USA 8,25%12-010220 3 000 000.00 101.00 USD 2 887 381.48 1,82
LAFINAT 7,25%13-15120 3 020 000.00 108.20 EUR 3 371 002.85 2,13
LOXAM 7,375%13-240120 REGS 3 000 000.00 105.85 EUR 3 251 558.33 2,05
MANUTENCOOP FM 8,5%13-010820 2 400 000.00 82.75 EUR 2 073 266.65 1,31
MATALAN FINANCE 6,875%14-0619 900 000.00 83.99 GBP 1 033 799.09 0,65
MATTERHORN TEL TV15-010522 1 900 000.00 93.86 EUR 1 795 776.98 1,13
MEDI-PARTENAIRES 7%13-150520 3 000 000.00 106.61 EUR 3 227 481.65 2,04
NORCELL SHLDG 3 5,25%14-1119 36 000 000.00 104.25 SEK 4 133 531.33 2,61
NORWEGIAN AIR SHUT TV14-0717 9 000 000.00 98.13 NOK 918 589.74 0,58
OBERTHUR 9,25%13-300420 REGS 750 000.00 109 EUR 830 026.05 0,52
OI BRASIL HOLD 5,625%15-0621 500 000.00 45.42 EUR 242 218.32 0,15
PAPREC HOLDING 7,375%15-0423 2 000 000.00 98.50 EUR 2 008 513.89 1,27
PERNOD-RICARD 4,875%10-180316 1 000 000.00 100.95 EUR 1 048 476.64 0,66
PICARD GPE TV13-010819 REG-S 150 000.00 100.37 EUR 151 673.20 0,10
PLAY FIN2 5,25%14-010219 150 000.00 102.66 EUR 157 349.71 0,10
PLAY FINANCE 1 6.5%14-010819 2 700 000.00 104.50 EUR 2 896 575.01 1.83
PORTAVENT. VAR 13- 19 1 100 000.00 100.49 EUR 1 111 277.08 0.70
RHINO BONDCO TV13-151219 2 350 000.00 100.39 EUR 2 366 529.21 1.49
RR PIK 9.25%13-150518 PIK 1 800 000.00 102.00 EUR 1 859 125.00 1.17
SAS 9%13-151117 14 000 000.00 106.00 SEK 1 639 523.25 1.03
SCHAEFF HOLD FI TV14-151119 1 100 000.00 104.94 USD 1 071 404.41 0.68
SCHAEFFLER HLD.F.TV13-0818 PIK 2 550 000.00 103.73 EUR 2 713 164.60 1.71
SHIP 7.25%13-300917 2 200 000.00 98.75 EUR 2 214 590.19 1.40
SMCP 8.875%13-150620 REGS 2 300 000.00 107.50 EUR 2 559 820.15 1.61
STONEGATE PUB 5.75%14-150419 250 000.00 102.00 GBP 350 343.43 0.22
STONEGATE PUB TV14-150419 2 100 000.00 100.53 GBP 2 898 267.43 1.83
TEEKAY OFFSH PART 6%14-300719 1 000 000.00 66.50 USD 622 295.87 0.39
TEEKAY OFFSH PART TV12-270117 4 500 000.00 96.83 NOK 459 441.23 0.29
THOM EUROPE 7.375%14-150719 1 500 000.00 104.39 EUR 1 618 052.08 1.02
UNILABS SUBHOLD 8.5%13-150718 800 000.00 104.19 EUR 865 602.32 0.55
UNITED GROUP 7.875%13-151120 2 800 000.00 105.77 EUR 2 992 185.01 1.89
VANDER INTER II TV14-010219 1 000 000.00 65.50 USD 641 608.35 0.40
VOUGEOT BIDCO TV13-150720 450 000.00 100.40 EUR 457 131.02 0.29
WIND ACQUISITION 7%14-230421 1 500 000.00 99.57 EUR 1 514 505.00 0.96
WIND ACQUISITION TV13-300419 500 000.00 100.30 EUR 506 343.07 0.32
WIND ACQUISITION TV14-150720 1 200 000.00 99.63 EUR 1 206 299.40 0.76
WIND ACQUISITION TV15-150720 200 000.00 99.55 EUR 200 946.84 0.13
ZOBELE HOLDING 7.875%13-0218 1 900 000.00 101.37 EUR 1 990 112.27 1.25
Negotiable debt securities 17 813 796.59 11.23
Other debt securities 17 813 796.59 11.23
ABENGOA FIN.8.875%13-050218 1 000 000.00 15.50 EUR 191 979.17 0.12
AGROKOR DD 9.125%12-010220 1 500 000.00 107.16 EUR 1 665 907.08 1.05
BUT 7.375%14-150919 EMTN 1 400 000.00 104.95 EUR 1 501 069.23 0.95
GHD BONDCO 7%14-150420 400 000.00 91.25 GBP 495 745.05 0.31

Anaxis Bond Opportunity Europe 2018
40
IDH FINANCE 6%13-011218 250 000.00 100.45 GBP 347 726.30 0.22
IDH FINANCE 8.5%13-010619 500 000.00 102.00 GBP 711 809.08 0.45
INNOVIA GROUP TV14-310320 750 000.00 100.00 EUR 752 116.50 0.47
KION FIN 6.75%13-150220 1 068 000.00 104.37 EUR 1 142 653.20 0.72
MAGNOLIA BC 9%13-010820 EMTN 1 000.00
000.00 106.82 EUR 1 106 596.73 0.70
NOVACAP TV14-010519 EMTN REGS 3 135 000.00 101.03 EUR 3 194 778.18 2.01
OBRASCON HUARTE 7.625%12-0320 1 625 000.00 99.39 EUR 1 652 907.11 1.04
SACYR 6.5%11-010516 EMTN CV 1 100 000.00 99.12 EUR 1 103 042.12 0.70
TECHEM 6.125%12-011019 3 200 000.00 105.11 EUR 3 414 681.79 2.15
TELECOM ITAL.6 3/8%04-19 EMTN 350 000.00 108.8 GBP 532 785.05 0.34
Forward financial instruments - -
Margin calls - -
Swaps - -
Receivables 86 663 990.85 54.65
Payables -86 488 096.35 -54.54
Deposits - -
Other cash accounts 14 190 731.15 8.95
Liabilities 158 581 586.76 100.00