and intestinal parasitism in dogs in quito, ecuador
TRANSCRIPT

Page 1/15
Estimating the Dog Population, Responsible Pet Ownership,and Intestinal Parasitism in Dogs in Quito, EcuadorColon Jaime Grijalva ( [email protected] )
Universidad San Francisco de Quito https://orcid.org/0000-0001-8492-5489Heather S. Walden
University of Florida College of Veterinary MedicineP. Cynda Crawford
University of Florida College of Veterinary MedicineJulie K. Levy
University of Florida College of Veterinary MedicineWilliam E. Pine
University of Florida Department of Wildlife Ecology and ConservationJorge A. Hernandez
University of Florida College of Veterinary Medicine
Research Article
Keywords: Quito, dogs, dog population, responsible pet ownership, burden of intestinal parasites, canine ecology
Posted Date: May 24th, 2021
DOI: https://doi.org/10.21203/rs.3.rs-264981/v1
License: This work is licensed under a Creative Commons Attribution 4.0 International License. Read Full License

Page 2/15
AbstractIn 2011, authorities of Quito, the capital city of Ecuador, approved an ordinance to promote public health and animal welfarethrough responsible pet ownership promotion. The population of dogs was not known, and the relationships between dogabundance, socio-economic factors, prevalence of zoonotic gastrointestinal parasites, and pet ownership responsibility hadnot been investigated. The objectives of this study were (i) to estimate the human:dog (HD) ratio, (ii) to examine therelationship between household factors and responsible pet ownership and (iii) to estimate the prevalence of households withone or more dogs infected with intestinal parasites in Quito, Ecuador. Space-based random sampling procedures were used forestimation of HD ratios in stray dogs and con�ned owned dogs. The relationship between household factors and a responsiblepet ownership index was examined using logistic regression. Dog fecal samples were tested for intestinal parasites. Amongstray dogs, the observed HD ratio was 58:1. Among dogs kept indoors, the observed HD ratio was 3,5:1. A positive interactioneffect between number of dogs in study households and household living conditions (a proxy for household wealth) onresponsible pet ownership was observed, which we discuss in this report. Prevalence of households with dogs infected withintestinal parasites was 28% (95% CI = 21-37). Ancylostoma spp. was the most frequent intestinal parasite in study dogs keptindoors. This study provides new information that can be used by policy makers to formulate, implement, and evaluate publicpolicies and education programs aimed at enhancing pet ownership responsibility in Ecuador.
IntroductionResponsible pet ownership is a new practice that is becoming more common in the growing, mostly urban Ecuadoran middleclass (Castellanos 2016; Universo 2017). However, dog overpopulation, lack of responsible pet ownership, and absence ofanimal shelter programs are continuing public health issues of concern in Quito, the capital city of Ecuador. In recent years, anumber of organizations have advocated for improving pet welfare and in 2011, authorities in the city of Quito approved anordinance to prevent cruel treatment of animals, promote responsible pet ownership, improve dog health, and reduce the risk ofdog bites to people, dog defecation in public spaces, and stray and unwanted animals. In recent years, the number oforganizations advocating for the implementation of policies that support responsible pet ownership has increased, as well asthe demand for high quality high volume spay neuter (HQHVSN) clinics. A single agent type model utilized in Santa Cruz’s(Santa Cruz Island, Galapagos, Ecuador ) dog population recommend an annual spay-neutering between 300/3300 (~12%) to500/3300 (~15%) of the total population of dogs via HQHVSN clinics to signi�cantly reduce the population in 10 years (Diaz etal. 2018). Rural residence, low level of education, and low income have been identi�ed as broad factors associated with a lackof responsible pet ownership including normal hygienic practices, responsible breeding, pet adequate nutrition, comfortablehousing, mental health, and physical health (Ortega-Pacheco et al. 2007; Slater et al. 2008; Acosta-Jamett et al. 2010;Overgaauw et al. 2020)
To our knowledge, the population of dogs in Quito has not been investigated using objective research methods. In 2010 and2013, Quito o�cials reported a human:dog (HD) ratio of 12:1 based on data extrapolated from published reports for capitalcities in Latin America (Diario Hoy 2010; Jacome 2013). However, the absence of direct estimates for Quito makes itimpossible to assess whether dog populations are responding as intended to government ordinances.
There are limited published studies related to prevalence of dog with gastrointestinal (GI) parasites in Ecuador and the AndeanRegion. These studies are useful to provide information on pet and human health conditions. A study in Santa Cruz, SanCristobal and Isabela analyzed the prevalence of intestinal parasitism using a convenience sample of 97 owned dogs thatwere presented to temporary HQHVSN clinics in Isabela, Santa Cruz and San Cristobal. Fecal samples were collected during aneutering process and processed using the Sheather Sugar �otation method. Morphological analysis was used to determinethe presence of gastrointestinal parasites. In addition, a commercially available immuno�uorescence assay for analysis ofCryptosporidium spp. and Giardia spp. was used. The prevalence of infected dogs for the whole sample population was 71,4%. The most commonly detected parasites were Ancylostoma caninum (57,7%) and Toxocara canis (16,5%) (Gingrich et al.2010). Another study in Santa Cruz in 2014 used a randomly selected household sample. A total of 56 fecal samplesprocessed using Sheather sugar �otation for morphological analysis stained samples for Cryptosporidium spp. Also, the

Page 3/15
samples were evaluated by a commercial ELISA for the presence of soluble antigen of Giardia spp. The most prevalent GIparasites in this study were Ancylostoma spp. (38%), Toxocara spp. (5%), and Cryptosporidium spp. (4%). No dogs werepositive to Giardia spp (Diaz et al. 2016).
Ancylostoma spp. is the most frequent parasite found in studies in the Andean Region (Ramirez-Barrios et al. 2004; Gingrich etal. 2010). The geographic distribution of this parasite is related to the temperature of the location and some species ofAncylostoma spp. are frequently found in places with a temperature higher than 20oC. Only three species of Ancylostoma areconsidered zoonotic: A. ceylanicum, A. caninum and A brazilense. A. ceylanicum often successful infecting humans and A.caninum has zoonotic behavior occasionally. On the other hand, A. brazilense is mainly responsible for the “creeping eruption”or cutaneous larva migrans which is the percutaneous infection of L3 in humans. Human infections with Ancylostoma spp.are more common in children and adults that spend time barefoot in areas with warm and moist weather. Professionals withmore risk are construction workers and gardeners since their job puts them in direct contact with dirt that could becontaminated with L3. The organ systems involved most commonly are skin, blood and intestine. The infection by skin of theinfectious third-stage larvae of A. caninum or A. brazilense will cause skin lesions. Eosinophilic enteritis has been reported ininfections with A. caninum. or A. ceylanicum. Infections occur mainly peroral and cause abdominal symptoms (Overgaauwand Van Knapen 2000; Bowman et al. 2010). Toxocara canis is probably the most common GI helminth that infects dogsworldwide. The reported infection rates in domestic dogs vary from 3,5% in adults to 79% in puppies. The mode oftransmission in humans is ingesting eggs from contaminated soil, hands and raw vegetables or by the consumption ofundercooked meat of a paratenic host. Direct contact with infected dogs is not considered a transmission risk since theparasite ova requires a period of three weeks to embryonate and become infective. In humans, the literature reports thatinfections in children are more frequent. Severe visceral larva migrans is mainly found in children between 1-3 years of age.Geophagic pica is described as a major risk factor to be infected with T. canis. This behavioral disorder may affect a range of2 to 10 % of children between 1 and 6 years old (Overgaauw and Van Knapen 2000; Moreiral et al. 2014).
In 2012 Quito authorities requested assistance in estimating the dog population, baseline data on responsible pet ownershipand the burden of dogs infected with intestinal parasites in the city of Quito. We present the results of an effort to addressthese questions by: (i) estimate the HD ratio, (ii) examine the relationship between household factors and responsible petownership and (iii) estimate the prevalence of households with one or more dogs infected with intestinal parasites in Quito,Ecuador.
Materials And Methods2.1 Study site
This study was conducted in the Metropolitan District of Quito, the capital city of Ecuador, during June-August 2013. Theestimated human population was about 2,3 million people residing in 634 611 households (INEC 2011a). Quito is divided into65 Parishes, of which 32 are located in urban areas and 33 in rural areas.
2.2 De�nitions
Stray dogs were those (owned or not owned) observed stray by one of the authors (CJG) between 4 00 and 6 00 on two-consecutive days during the study period (World Organisation for Animal Health 2019)Con�ned owned dogs were those declared as owned by the household chief and kept indoors or inside household (property)limits at the time of the visit. Some dogs were allowed to roam free (with or without supervision) in public spaces to play ordefecate during AM or PM hours.
A household is a housing unit composed by those living together under the same roof (e.g., home or apartment).
The household chief is the person who is in charge of the household at the moment of the data collection.
Page 4/15
Commercial food was de�ned as food manufactured for the purpose of feeding dogs produced by the industry that generallyhas a veterinarian specialist in nutrition behind the formulation.
Specially prepared food was de�ned as fresh food specially prepared by the dog owner for the dogs in the household.
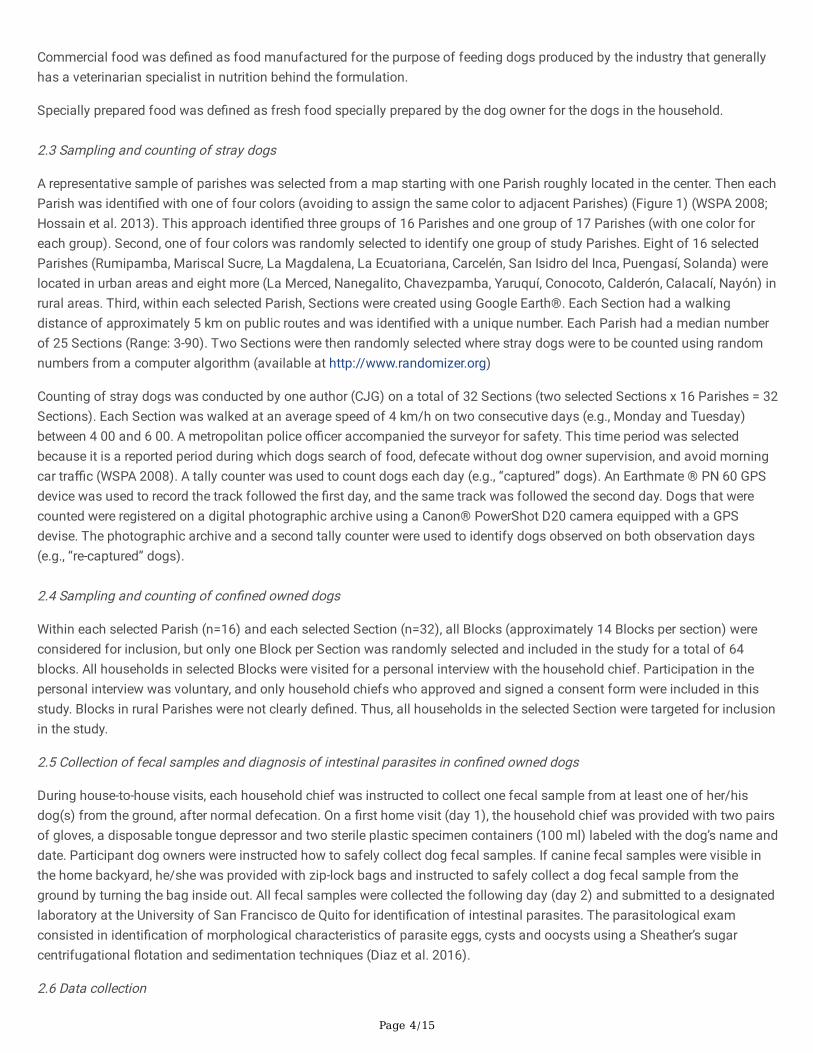
2.3 Sampling and counting of stray dogs
A representative sample of parishes was selected from a map starting with one Parish roughly located in the center. Then eachParish was identi�ed with one of four colors (avoiding to assign the same color to adjacent Parishes) (Figure 1) (WSPA 2008;Hossain et al. 2013). This approach identi�ed three groups of 16 Parishes and one group of 17 Parishes (with one color foreach group). Second, one of four colors was randomly selected to identify one group of study Parishes. Eight of 16 selectedParishes (Rumipamba, Mariscal Sucre, La Magdalena, La Ecuatoriana, Carcelén, San Isidro del Inca, Puengasí, Solanda) werelocated in urban areas and eight more (La Merced, Nanegalito, Chavezpamba, Yaruquí, Conocoto, Calderón, Calacalí, Nayón) inrural areas. Third, within each selected Parish, Sections were created using Google Earth®. Each Section had a walkingdistance of approximately 5 km on public routes and was identi�ed with a unique number. Each Parish had a median numberof 25 Sections (Range: 3-90). Two Sections were then randomly selected where stray dogs were to be counted using randomnumbers from a computer algorithm (available at http://www.randomizer.org)
Counting of stray dogs was conducted by one author (CJG) on a total of 32 Sections (two selected Sections x 16 Parishes = 32Sections). Each Section was walked at an average speed of 4 km/h on two consecutive days (e.g., Monday and Tuesday)between 4 00 and 6 00. A metropolitan police o�cer accompanied the surveyor for safety. This time period was selectedbecause it is a reported period during which dogs search of food, defecate without dog owner supervision, and avoid morningcar tra�c (WSPA 2008). A tally counter was used to count dogs each day (e.g., “captured” dogs). An Earthmate ® PN 60 GPSdevice was used to record the track followed the �rst day, and the same track was followed the second day. Dogs that werecounted were registered on a digital photographic archive using a Canon® PowerShot D20 camera equipped with a GPSdevise. The photographic archive and a second tally counter were used to identify dogs observed on both observation days(e.g., “re-captured” dogs).
2.4 Sampling and counting of con�ned owned dogs
Within each selected Parish (n=16) and each selected Section (n=32), all Blocks (approximately 14 Blocks per section) wereconsidered for inclusion, but only one Block per Section was randomly selected and included in the study for a total of 64blocks. All households in selected Blocks were visited for a personal interview with the household chief. Participation in thepersonal interview was voluntary, and only household chiefs who approved and signed a consent form were included in thisstudy. Blocks in rural Parishes were not clearly de�ned. Thus, all households in the selected Section were targeted for inclusionin the study.
2.5 Collection of fecal samples and diagnosis of intestinal parasites in con�ned owned dogs
During house-to-house visits, each household chief was instructed to collect one fecal sample from at least one of her/hisdog(s) from the ground, after normal defecation. On a �rst home visit (day 1), the household chief was provided with two pairsof gloves, a disposable tongue depressor and two sterile plastic specimen containers (100 ml) labeled with the dog’s name anddate. Participant dog owners were instructed how to safely collect dog fecal samples. If canine fecal samples were visible inthe home backyard, he/she was provided with zip-lock bags and instructed to safely collect a dog fecal sample from theground by turning the bag inside out. All fecal samples were collected the following day (day 2) and submitted to a designatedlaboratory at the University of San Francisco de Quito for identi�cation of intestinal parasites. The parasitological examconsisted in identi�cation of morphological characteristics of parasite eggs, cysts and oocysts using a Sheather’s sugarcentrifugational �otation and sedimentation techniques (Diaz et al. 2016).
2.6 Data collection

Page 5/15
Poverty rates (%) published in Ecuador’s National Population and Housing Census in 2010 were collected for each studyparish. For each study household, the following data were collected: date of interview; Parish identi�cation; residence (urban,rural); number of people in the household; number of dogs in the household; household with one or more dogs with a positivediagnosis of intestinal parasites (yes, no); responsible pet ownership index (score 1 to 8); and living condition index (score 1 to9). Finally, for each study dog, the following data were collected: dog name, age, sex (male, female), spay neuter status (yes,no), free-roam (yes, no), dog is walked with a leash (yes, no), adequate shelter (yes, no), feeding (commercial food, speciallyprepared food, scrap food from human meals), dog visited veterinary o�ce in the last 12 months (yes, no), dog was de-wormed in the last 6 months (yes, no), and last time dog was vaccinated against rabies (months, don’t know).
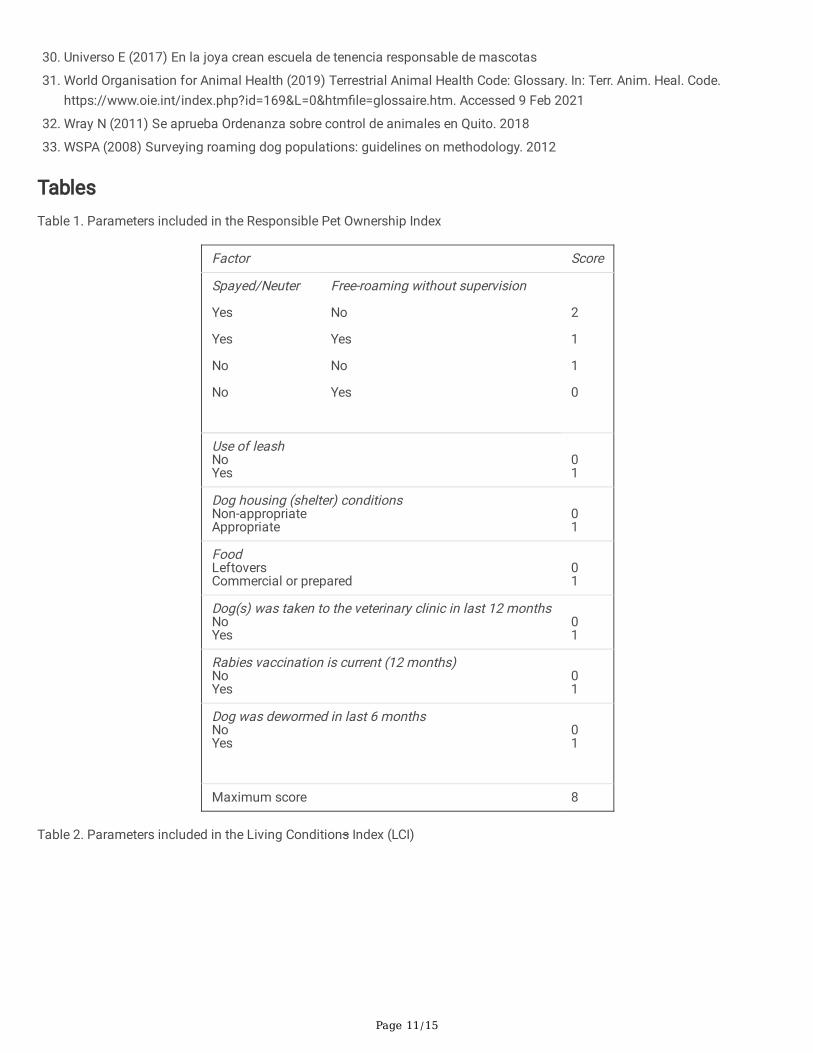
An instrument was prepared to measure a Responsible Pet Ownership Index (RPOI) in each study household (Table 1). Theinstrument included eight parameters (i) spayed/neuter status; (ii) use of leash; (iii) dog shelter conditions; (iv) food; (v)veterinary care; (vi) rabies vaccination compliance; (vii) deworming; and (viii) allowance to free roaming. Scores of 0 to 1 or 0to 2 were assigned to each parameter for a maximum score of 8 in each household. An instrument was prepared to measure aLiving Condition Index (LCI) as a proxy for wealth in each study household (Table 2). The instrument included two parameters:(i) accumulated wealth (PC, e-mail account, TV, cars) and (ii) education (elementary school, middle school, high school,university). Scores of 0 to 4 were assigned to parameter, except for number of cars, for a maximum score of 9.
2.7 Data analysis
2.7.1 Free Roaming Dogs
Within each selected Section, the proportion of observed stray dogs during the �rst and second observations (e.g., “recaptured”dogs) was calculated using data collected with the second tally counter and GPS camera (WSPA 2008; Dias et al. 2013). TheChapman modi�ed Lincoln-Petersen equation (Equation 1; Krebs 1999) was used to estimate the number of dogs (Greenwoodand Robinson 2006),
where n1 is the number of dogs observed during the �rst day (captured dogs), n2 is the number of dogs observed the next day,m2 is the number of dogs observed during the �rst and second day (e.g., “recaptured” dogs) and N is the estimated number ofanimals in each section. The rationale for using this method for counting dogs is to estimate the proportion of “recaptured”dogs during the second count (m2/n2); the assumption is that this proportion is the same as that in the population at large(n1/N). Ninety-�ve percent con�dence intervals (CI) were estimated by using the Poisson distribution because data were notnormally distributed, and the number of recaptures was less than 50 in study Parishes (Krebs 1999). Con�dence intervalsusing the two-sample method (Greenwood and Robinson 2006)were only determined for residence (urban, rural) and for thetotal count since only 4 of 32 study Sections had a required number of ≥ 8 recaptured dogs.
To estimate number of dogs in each selected Parish, the estimated numbers of dogs on Sections 1 and 2 were averaged, thenmultiplied by the total number of Sections in each selected Parish. To calculate the HD ratio in each study Parish, the o�cialhuman population was divided by the estimated dog population. The sampling fraction method was used to estimate theoverall number of dogs by residence in studied Parishes (urban, rural) (WSPA 2008). Overall HD ratios by residence werecalculated dividing the o�cial human population by the estimated dog population. The overall dog population estimate in allsampled Parishes and the estimated HD ratio for Quito were calculated using the same method.
The relationship between the abundance of stray dogs (HD ratio) (rank data) and o�cial poverty rates (rank data) in studyParishes (n = 16) was examined using simple linear regression.
2.7.2 Con�ned owned dogs

Page 6/15
The observed HD ratio was calculated by dividing the total number of people by the total number of dogs in study households.The variables for number of dogs and number of people in study Parishes (n = 16) were normally distributed. Thus, simplelinear regression was used to calculate a beta coe�cient to produce an additional HD ratio (i.e., 1 divided by the betacoe�cient) and 95% CI derived from the regression results.
The median time of last rabies vaccination and deworming was computed. Wilcoxon sign rank test was used to calculate95%CI. The frequency of dogs that were examined by a veterinarian within last year was determined.
The association between responsible pet ownership index (RPOI) and investigated household factors was examined by usingunconditional logistic regression (Szklo and Nieto 2000; Diaz et al. 2016). Study households were assigned into one of twogroups with a low (0 to 5) or high (6 to 8) RPOI scores—based on the median distribution.
2.7.3 Prevalence of and identi�cation of exposure factors associated with intestinal parasitism in con�ned owned dogs.
Prevalence of households with ≥ 1 dogs with a positive diagnosis of intestinal parasites was calculated as the number ofhouseholds with a positive diagnosis divided by the total number of households with dogs sampled and tested. In addition,prevalence of dogs with a positive diagnosis of intestinal parasites was calculated as the number of dogs with a positivediagnosis divided by the total number of dogs sampled and tested; 95% CI were calculated for each prevalence estimateassuming normal distribution (Dean et al. 2013). Finally, the relationship between investigated household factors andhouseholds with one or more dogs classi�ed as infected with intestinal parasites was examined using unconditional logisticregression.
Results3.1 Stray dogs
The estimated number of free roaming dogs in the 32 study Sections was 726 (95% CI = 653-822). Overall, the HD ratio was58:1 (95% CI = 52:1-65:1). The abundance of stray dogs was higher in rural Parishes (HD ratio = 47:1; 95% CI = 39:1-55:1)compared to urban Parishes (HD ratio = 73:1; 95% CI = 61:1-84:1) (Tables 3 and 4). Using linear regression, the HD ratio wasnegatively associated with o�cial poverty rates in study Parishes (β=-0,77; r = 0,77; R2 = 0,59; p < 0,01).
3.2 Con�ned owned dogs
Among the 32 selected Blocks, 232/998 (23%) households voluntarily participated in this study. The proportions of surveyedhouseholds were signi�cantly different in urban (126/701 or 18%) and rural neighborhoods (106/297 or 36%) (p <0,01). A totalof 194/232 or 84% household chiefs reported having one or more dogs for a total of 318 dogs. The median age of dogs was 2years (minimum= 6 weeks, �rst quartile = 1 year; third quartile = 4 years, maximum=16 years). A total of 195 dogs (61%; 95% CI= 56-67) were male, and 44 dogs (14%; 95% CI = 10-18) were classi�ed as spayed or neutered. The proportion of neutered maledogs (20/194 or 10%; 95% CI = 7-15) was lower compared to female spayed dogs (24/122 or 20%; 95% CI = 14-28) (p=0,02).Furthermore, 71 dogs (22%; 95% CI = 18-27) were reported as allowed to free roam in public spaces. The proportion of dogsallowed to roam in public places was higher in rural Parishes (36%; 95% CI = 28-44), compared to urban Parishes (11%; 95% CI= 7-17). Dogs in rural parishes were 4,37 times more likely to roam in rural parishes compared to urban parishes (OR=4,37; 95%CI 2.49-7.94; p<0,01). The proportion of free roaming males was higher (54/194 or 28%; 95% CI = 22-35) compared to females(17/124 or 14%; 95% CI = 9-21) (p<0,01). The proportion of owned free roaming spayed females was higher (6/20 or 30%; 95%CI = 15-52) than the proportion of owned free roaming males (1/24 or 4%; 95% CI = 1-20) (p=0,03). The observed abundance ofcon�ned owned dogs was similar in urban Parishes (HD ratio = 3,2:1) and rural Parishes (3,3:1). The proportion of dogs thatwere examined by a veterinarian within the last year was 187/319 or 58,62% (95% CI 53,15-63,89%;p<0,01). The median timefrom last deworming was 4 months (pseudo median 4,49; 95% CI= 3,99-4,99). The median time from last rabies vaccinationwas 4 months (pseudo median 4,5; 95%CI= 4-5).
Using linear regression, the estimated correlation between number of dogs and number of people in participant households (r)

Page 7/15
was 0,94, and the beta coe�cient was 0,29 (CI = 0,23- 0,34) (SE = 0,02). In addition, using an estimated HD ratio of 3,5:1 (i.e., 1/ beta coe�cient) and a human population of 2 239 191, the estimated population of con�ned owned dogs in Quito was 649365 (95% CI = 515 014-761 325).
3.3 Household factors associated with Responsible Pet Ownership
We found that the responsible pet ownership in a household was in�uenced by the residence type, number of dogs, and LCIwere all signi�cant (p < 0,01). The variable for LCI was associated (p < 0,01) with the variable for residence. Thus, theexplanatory variables for number of dogs in a household and LCI were further examined.We found that the combined effect of number of dogs in the household and LCI on RPOI, and the analysis revealed thathouseholds with ≥ 2 dogs and low LCI were 16,71 times more likely to have a low RPOI, compared to households with 1 dogand high LCI (OR = 16,71; 95% CI = 5,90-47,37; p < 0,01). This observed combined effect on low RPOI (OR = 16,71) was higherthan the expected combined effect based on adding (OR = 7,37), and multiplying (OR = 11,90) absolute independent excessesdue to LCI (OR = 2,39) or (OR = 4,98) number of dogs in the household (Table 5)
3.4 Intestinal parasites in con�ned owned dogs
A total of 110 of 194 (57%) households with one or more dogs returned a dog fecal sample. Thirty-one of 110 or 28% (95% CI=21-37) study households had one or more dogs classi�ed as infected with one or more intestinal parasites. Using univariablelogistic regression, the odds of household with dogs infected with intestinal parasites was two times higher in households withlow RPOI scores, compared to households with high RPOI scores; however, this association was not signi�cant (crude OR =2,09; 95% CI = 0,90-4,86; p = 0,09). Other investigated household factors were not associated with a positive diagnosis ofintestinal parasites (p ≥ 0,12).
At the dog level, 39 of 154 or 25% (95% CI = 19-33) dogs were infected with one or more intestinal parasites (Table 6).Ancylostoma spp. was the most frequent parasite diagnosed in dogs (18/154 or 12%; 95% CI = 7- 17) followed by Toxocaracanis (11/154 or 7%; 95% CI = 4-12). Finally, eight (5%) dogs were diagnosed as infected with two intestinal parasites (95% CI =2, 9). In urban households the prevalence of dogs with Ancylostoma spp. was 9/59 or 15% (95% CI= 8-27) similar (p=0,74) torural households which was 9/51 or 18% (95% CI=9-31).
Discussion4.1 Stray dogs
Overall, the estimated HD ratio of stray dogs was 58:1 and the abundance of stray dogs was higher in rural Parishes,compared to urban Parishes. In addition, a higher abundance of dogs was associated with higher poverty rates in studyParishes. These �ndings are in agreement with previous observations that a higher abundance of stray dogs is associatedwith low- or middle-income neighborhoods in Baltimore, Maryland between 1970 and 1971 (Overgaauw and Van Knapen2000). In another study conducted in rural households in Yucatan, Mexico, 77% of study households did not have adequatefences to prevent dogs from roaming (Beck 2002; Ortega-Pacheco et al. 2007). Although the variable for inadequate fenceswas not measured in this study, households with inadequate fences or no fences are commonly observed in rural Parishes inQuito. To our knowledge, no other published studies have estimated the abundance of stray dogs relative to the humanpopulation in Quito.
4.2 Con�ned owned dogs
Among 998 selected households, 232 or 23% were surveyed, and the proportion of surveyed households was different betweenurban (18%) and rural (36%) neighborhoods. The response rate was lower in this study than a survey on Santa Cruz Island,Galapagos in September 2014 (166/227 or 73%) (Diaz et al. 2016). It is possible that this was due in part to the lack ofgovernment o�cials participating in the current survey. The prevalence of crime against people in Quito (21,83%) is higher

Page 8/15
than in the Galapagos (7,06%), consequently, residents may be more reluctant to open the door to a stranger in Quito (INEC2011b)
Among 232 study households, the observed HD ratio was 3,5:1. The observed HD ratio in Quito is smaller than that reported byCity O�cials in Quito in 2010 and 2013 (12:1) (Wray 2011) and in previous studies in Guayaquil, Ecuador in 1986 (7:1) (Beranand Frith 1988), and Santa Cruz Island, Ecuador in 2014 (6,1:1) (Diaz et al. 2016)All the cited studies had differences inmethodologies for data collection and statistical analysis. Between 2009 and 2011 in Quito, city o�cials estimated HD ratiobased on rates reported in other Latin American capital cities similar to Quito. On the other hand, in Guayaquil, Beran and Frithsurveyed 1938 homes in 394 randomly selected squares of the city. Another approach was used in Santa Cruz, Galapagos.Explanations for a lower population in Santa Cruz, Galapagos could include the effects of the dog importation prohibition or ahigher prevalence of sterilized dogs (40%) compared to Quito (14%) (Asamblea Nacional de la Republica del Ecuador 2015;Diaz et al. 2016)4.3 Household factors associated with Responsible Pet OwnershipWe observed a positive interaction effect between ≥ 2 dogs in study households and a low household living condition index onresponsible pet ownership. This �nding can be explained by education and economic factors at the household level, which canin�uence compliance for responsible pet ownership as expected by policy makers in Quito, veterinary organizations, and theWorld Society for the Protection of Animals. Families with a low level of education may not appreciate the dimension ofpotential health hazards and consequences caused by irresponsible pet ownership practices. Low-income families may nothave the �nancial means or access to pet veterinary services. Finally, family budgets can be further compromised with a highernumber of dogs on the household. In a similar study developed in Pelotas, Brazil, 1558 households were examined forresponsible pet ownership. Using similar parameters to develop a score for responsible pet ownership they found anassociation between level of education of the household chief (p<0,001) and low responsible pet ownership index (Domingueset al. 2015). To our knowledge, no other published studies have examined the relationship between socio-economic drivers andresponsible pet ownership.
4.4 Intestinal parasites in con�ned owned dogs
At the dog level, 25% of dogs were infected with one or more intestinal parasite, with Ancylostoma spp., the most commonparasite, identi�ed in 12% A. caninum is a parasite that causes cutaneous larva migrans by third stage larvae penetration andmigration under the skin of humans; however, in contrast to canids, humans are dead-end hosts (Shalaby et al. 2010). Theobserved burden of Ancylostoma spp. in dogs in Quito, Ecuador during June-August 2013 was lower, compared to that in dogson Santa Cruz Island, Galapagos, Ecuador in September 2014 (21/56 or 38%; 95% CI = 25, 50%) (Diaz et al. 2016). On SantaCruz Island, the frequency of dogs infected with Ancylostoma spp. was higher in rural neighborhoods, compared to urbanneighborhoods; one explanation offered by Diaz et al (2016) was that environmental conditions (greater exposure and longersurvival in soil) are more favorable in rural than in urban neighborhoods in Santa Cruz Island. In this study the prevalence ofAncylostoma spp. was similar in urban households compared to rural households. An explanation for this can be that thesamples were taken during the dry season of Quito. Also, there is no major difference on the weather and altitude between thestudied sections with the exception of Nanegalito (INAMHI 2011). Ancylostoma spp. is often the most frequent parasite foundin dog studies in the Andean Region countries with a prevalences of 24.5% in Maracaibo, Venezuela, 13.9% in Quindio,Colombia, 38% in Santa Cruz and 57.7% in Isabela, Galápagos (Ramirez-Barrios et al. 2004; Giraldo et al. 2005; Gingrich et al.2010; Diaz et al. 2016).
4.5 Study limitations
This study had several limitations. First, counting of stray dogs was limited to two of a median of 25 sections per selectedParish during two consecutive days, in a narrow time frame between 4 00 and 6 00. It is possible the inclusion of more studysections, additional days of dog counting (e.g., 10 consecutive days), or additional time frames could have produced a higheror lower HD ratio, with more precision.

Page 9/15
Second, among con�ned owned dogs, the number of surveyed households was 23%. The response rate was higher in ruralareas (36%) compared to urban areas (18%) with the consequent reduction of the expected sample size. Third, the RPOI and LCI were estimated based on information provided by household chiefs. It is possible several householdscould have been misclassi�ed as having a low or high Index value. Although in this study, a low RPOI was associated with alow LCI, an indication that observation bias was not high.
Finally, the burden of dogs infected with intestinal parasites was based on one fecal sample collected during the study period.
ConclusionsThis study provides new baseline dog population, preventive veterinary medicine practices and veterinary care access datathat can be used to formulate, implement, and evaluate the impact of HQHVSN clinics for dogs in Quito, Ecuador. Although thetotal dog population and their parasite burden was lower than reported in other areas of Ecuador, 28% of households owneddogs with parasites of zoonotic signi�cance. Study results support allocation of resources to further promote educationprograms that can support Responsible Pet Ownership principles (spay-neuter procedures, deworming, access to veterinaryservices at low cost), particularly in rural neighborhoods, and neighborhoods with high poverty rates.
DeclarationsFunding.- This study was funded by the Secretary of Higher Education, Science, Technology and Innovation (SENESCYT) theUniversity of Florida’s Center for Latin American Studies and the Tinker Foundation
Con�ict of interests.- The authors declare that they have no con�ict of interest
Availability of data and material.- The datasets generated during and/or analyzed during the current study are available fromthe corresponding author on reasonable request.
Code Availability.- Statistix 9 was used for statistical analysis
Ethics approval.- This study was approved by the Universidad San Francisco de Quito’s Bioethics Committee, the University ofFlorida’s Institutional Animal Care and Use Committee, and the University of Florida’s Institutional Review Board.
Consent to participate.- Informed consent was obtained from all individual participants included in the study.Consent for publication.- Not Applicable
Acknowledgments
The author (CJG) was funded by Ecuador’s Secretary of Higher Education, Science, Technology and Innovation (SENESCYT),the University of Florida’s College of Veterinary Medicine, the Center for Latin American Studies and the Tinker Foundation. TheCollege of Veterinary Medicine at Universidad San Francisco de Quito allowed the use of laboratory space for processing offecal samples and diagnosis of intestinal parasites in dogs. The City of Quito’s Metropolitan Police Department providedassistance during the survey of stray dogs in study neighborhoods.
References1. Acosta-Jamett G, Cleaveland S, Cunningham A, Bronsvoort B (2010) Demography of domestic dogs in rural and urban
areas of the Coquimbo region of Chile and implications for disease transmission. Prev Vet Med 94:272–281
2. Asamblea Nacional de la Republica del Ecuador (2015) Ley Organica de Regimen Especial de la Provincia de Galapagos.Of. No 520 30
3. Beck AM (2002) The Ecology of Stray Dogs. Purdue University Press, West Lafayette, Indiana
4. Beran GW, Frith M (1988) Domestic Animal Rabies Control: An Overview. Rev Infect Dis 10:S672–S677

Page 10/15
5. Bowman DD, Montgomery SP, Zajac AM, et al (2010) Review: Hookworms of dogs and cats as agents of cutaneous larvamigrans. Trends Parasitol 26:162–167. https://doi.org/10.1016/j.pt.2010.01.005
�. Castellanos G (2016) Adopciones y eutanasias, las dos caras del bienestar animal | El Comercio. In: El Comer.https://www.elcomercio.com/tendencias/adopciones-eutanasias-cifras-ecuador-animalescallejeros.html. Accessed 19Sep 2019
7. Dean K, Soe M, Sullivan A (2013) OpenEpi: Open Source Epidemiologic Statistics for Public Health
�. Diario Hoy (2010) hoy.com.ec
9. Dias R, Guilloux A, Borba M, et al (2013) Size and spatial distribution of stray dog population in the University of SãoPaulo campus, Brazil. Prev Vet Med 110:263–273
10. Diaz NM, Mendez GS, Grijalva CJ, et al (2016) Dog overpopulation and burden of exposure to canine distemper virus andother pathogens on Santa Cruz Island, Galapagos. Prev Vet Med 123:128–137.https://doi.org/10.1016/j.prevetmed.2015.11.016
11. Diaz NM, Walden HS, Yoak A, et al (2018) Dog overpopulation and diagnosis of intestinal parasites on Santa Cruz Island,Galapagos 2016. Prev Vet Med 157:99–104. https://doi.org/10.1016/j.prevetmed.2018.06.003
12. Domingues LR, Cesar JA, Fassa AG, Domingues MR (2015) Responsible pet animal guardianship in the urban area of themunicipality of Pelotas in the state of Rio Grande do Sul, Brazil. Cien Saude Colet 20:185–192.https://doi.org/10.1590/1413-81232014201.19632013
13. Gingrich EN, Scorza A V, Clifford EL, et al (2010) Intestinal parasites of dogs on the Galapagos. Vet Parasitol 169:404–407
14. Giraldo MI, García NL, Castaño JC (2005) Prevalencia de helmintos intestinales en caninos del departamento del Quindío
15. Greenwood J, Robinson R (2006) Ecological census techniques: a handbook. Cambridge University Press., Cambridge, UK,
1�. Hossain M, Ahmed K, Marma A, et al (2013) A survey of the dog population in rural Bangladesh. Prev Vet Med 111:134–138
17. INAMHI (2011) Anuario Meteorológico. Anu. Meteorológico 2014
1�. INEC (2011a) Resultados del Censo 2010 de Poblacion y Vivienda en el Ecuador: Fasciculo Provincial Pichincha.2012:2010 population census results for the province of
19. INEC (2011b) Encuesta de Victimización y Percepción de Inseguridad 2011. Ecuador en Cifras 2018
20. Jacome E (2013) El Comercio.com
21. Krebs CJ (1999) Ecological methodology, 2nd ed. Benjamin/Cummings, Menlo Park, Calif
22. Moreiral G, Telmo PD, Mendonca M, et al (2014) Human toxocariasis: current advances in diagnostics, treatment, andinterventions. Trends Parasitol 30:456–464. https://doi.org/10.1016/j.pt.2014.07.003
23. Ortega-Pacheco A, Rodriguez-Buen�l J, Bolio-Gonzalez M, et al (2007) A Survey of Dog Populations in Urban and RuralAreas of Yucatan, Mexico. Anthrozoos 20:261–274
24. Overgaauw P, Van Knapen F (2000) Dogs, zoonoses, and public health. CABI Pub, New York
25. Overgaauw PAM, Vinke CM, Hagen MAE van, Lipman LJA (2020) A One Health Perspective on the Human-CompanionAnimal Relationship with Emphasis on Zoonotic Aspects. Int J Environ Res Public Health 17:3789.https://doi.org/10.3390/ijerph17113789
2�. Ramirez-Barrios RA, Barboza-Mena G, Munoz J, et al (2004) Prevalence of intestinal parasites in dogs under veterinarycare in Maracaibo, Venezuela. Vet Parasitol 121:11–20. https://doi.org/10.1016/j.vetpar.2004.02.024
27. Shalaby HA, Abdel-Shafy S, Derbala AA (2010) The role of dogs in transmission of Ascaris lumbricoides for humans.Parasitol Res 106:1021–1026. https://doi.org/10.1007/s00436-010-1755-8
2�. Slater MR, Di Nardo A, Pediconi O, et al (2008) Free-roaming dogs and cats in central Italy: Public perceptions of theproblem. Prev Vet Med 84:27–47. https://doi.org/10.1016/J.PREVETMED.2007.10.002
29. Szklo M, Nieto FJ (2000) De�ning and assessing heterogeneity of effects: interaction. In: Epidemiology: beyond basics.Aspen Publishers Inc, Gaithersburg Maryland
Page 11/15
30. Universo E (2017) En la joya crean escuela de tenencia responsable de mascotas
31. World Organisation for Animal Health (2019) Terrestrial Animal Health Code: Glossary. In: Terr. Anim. Heal. Code.https://www.oie.int/index.php?id=169&L=0&htm�le=glossaire.htm. Accessed 9 Feb 2021
32. Wray N (2011) Se aprueba Ordenanza sobre control de animales en Quito. 2018
33. WSPA (2008) Surveying roaming dog populations: guidelines on methodology. 2012
TablesTable 1. Parameters included in the Responsible Pet Ownership Index
Factor Score
Spayed/Neuter
Yes
Yes
No
No
Free-roaming without supervision
No
Yes
No
Yes
2
1
1
0
Use of leashNoYes
01
Dog housing (shelter) conditionsNon-appropriate Appropriate
01
Food LeftoversCommercial or prepared
01
Dog(s) was taken to the veterinary clinic in last 12 monthsNoYes
01
Rabies vaccination is current (12 months)NoYes
01
Dog was dewormed in last 6 monthsNoYes
01
Maximum score 8
Table 2. Parameters included in the Living Conditions Index (LCI)

Page 12/15
Factor Category Score
Accumulated wealth PC
TV
Car(s)
1
1
1
≤ 2
Education Elementary
Middle
High school
University
1
2
3
4
Maximum score 9
Table 3: Estimated population of stray dogs in the metropolitan area of Quito

Page 13/15
Section 1 Section 2
n1 n2 m2 N
95%CI n1 n2 m2 N 95%CI MeanDogs inSections1&2
EstimatedHumanPopulationin Section
EstimatedHuman:Dog Ratioin Parish
UrbanS.I. Inca
14
16
8
27
18-38
11
8
1
53
40-68
40
978
24:1
Ecuatoriana 23 28 15 43 32-57 30 27 15 53 40-68 48 1 833 38:1
Puengasí 9 13 3 34 24-47 14 12 4 38 26-51 36 1 456 40:1
Magdalena 3 3 0 15 ND 16 18 7 39 28-52 27 1 893 70:1
Carcelén 14 14 5 37 26-50 1 0 0 1 1-8 19 2 113 113:1
Solanda 7 7 1 31 21-44 10 6 2 25 17-36 28 4 349 156:1
Rumipamba 0 3 0 3 ND 0 1 0 1 ND 2 1 739 869:1
Mariscal 0 1 0 1 ND 0 1 0 1 ND 1 998 998:1
RuralLa Merced
16
21
3
93
76-113
5
3
2
7
3-14
50
271
5:1
Nanegalito 6 3 3 6 3-13 2 5 0 17 ND 12 112 10:1
Calacalí 1 8 0 17 ND 2 0 0 2 1-7 10 169 18:1
Nayón 22 15 6 52 38-67 10 18 6 29 19-41 40 920 23:1
Chavezpamba 8 8 4 15 8-24 5 2 2 5 2-12 10 267 26:1
Calderón 25 27 13 51 38-69 5 7 4 9 5-17 30 1 692 57:1
Yaruquí 8 4 2 14 8-23 6 8 5 10 5-18 12 1 050 89:1
Conocoto 4 3 2 6 3-13 4 9 2 16 10-25 11 1 052 99:1
n1= dogs observed in the �rst count (captured dogs).n2= dogs observed in the second count.m2= dogs observed in both counts (re-captured dogs). N = [ (n1 + 1) (n2 + 1) / (m2 + 1)] – 1. (Greenwood and Robinson, 2006).
Table 4: Overall Estimated population of stray dogs in the metropolitan area of Quito

Page 14/15
n1 n2 m2 N (95% CI)
Sampling Fraction
(Sampled sections/TotalSections)
Estimated Human: DogRatio(E)
D/C
Human: DogRatio95%CI
Urban 152 157 61 389 ((337-466))
16/211 73:1 61:1-84:1
Rural 129 141 54 335 (288-406)
16/286
47:1 39:1-55:1
Total
281 298 115 726 (653-822)
32/497 58:1 52:1-65:1
Table 5. Observed and expected effects of number of dogs in household and Living Condition Index on households with lowResponsible Pet Ownership Index
Dogs in household Living Condition Index Odds ratio 95% CI* p
1
1
≥2
≥2
High
Low
High
Low
1.00
2.39
4.98
16.71
Reference
1.00, 5.74
2.09, 11.87
5.90, 47.37
NA
0.05
<0.01
<0.01
*95% con�dence interval
Table 6: Frequency of observed gastrointestinal parasites in con�ned owned dogs
Parasite Frequency
Ancylostoma spp. 18
Toxocara canis 11
Cystoisospora spp. 1
Trichuris spp. 1
Co-infections: 8
Figures

Page 15/15
Figure 1
Geographic location of 65 parishes in the metropolitan area of Quito. Each parish was assigned to 1 of 4 colors (blue, yellow,green orange). Note: The designations employed and the presentation of the material on this map do not imply the expressionof any opinion whatsoever on the part of Research Square concerning the legal status of any country, territory, city or area or ofits authorities, or concerning the delimitation of its frontiers or boundaries. This map has been provided by the authors.