and justice - nccdglobal.org · the u.s. supreme court, the juvenile justice system is anything but...
TRANSCRIPT
AND JUSTICE SOME
FOR
Differential Treatment of Youth of Color in the Justice System
JANUARY 2007
NATIONAL COUNCIL ON CRIME AND DELINQUENCY
And Justice for Some i
TABLE OF CONTENTS
Executive Summary 1
Introduction 4
Methodology 5
Arrest Data 6
Juvenile Court Processing 8
Referrals 8
Detention Data 11
Formal Processing 13
Waiver to Adult Court 16
Disposition 20
The State Perspective 23
Incarceration in Juvenile Corrections 25
The National Perspective 25
The State Perspective 30
Incarceration in Adult Corrections 34
The National Perspective 34
The State Perspective 35
Conclusion 37
References 38
And Justice for Some 1
The overrepresentation of people of color inthe nation’s prisons, particularly AfricanAmerican men and women, has receivedmuch attention in recent years. The dispro-
portionate representation of racial or ethnic minoritiesis also found in all stages of the juvenile justice system.
While public attention has tended to focus on the dis-proportionate number of youth of color in confine-ment, this overrepresentation is often a product ofactions that occur at earlier points in the juvenile jus-tice system, such as the decision to make the initialarrest, the decision to hold a youth in detention pend-ing investigation, the decision to refer a case to juve-nile court, the decision to waive a case to adult court,the prosecutor’s decision to petition a case, and thejudicial decision and subsequent sanction.
Some have argued that this overrepresentation ofyouth of color in the justice system is simply a resultof those youths committing more crimes than Whiteyouth. However, a true analysis is much more compli-cated. It is not clear whether this overrepresentation isthe result of differential police policies and practices (targeting patrols in certain low-income neighbor-hoods, policies requiring immediate release to biologi-cal parents, group arrest procedures); location ofoffenses (African American youth using or sellingdrugs on street corners, White youth using or sellingdrugs in homes); different behavior by youth of color(whether they commit more crimes than Whiteyouth); different reactions of victims to offenses com-mitted by White and youth of color (whether Whitevictims of crimes disproportionately perceive theoffenders to be youth of color); or racial bias withinthe justice system. In a meta-analysis of studies onrace and the juvenile justice system, researchers foundthat about two-thirds of the studies of disproportion-ate minority confinement showed negative “raceeffects” at one stage or another of the juvenile justiceprocess (Pope, Lovell, & Hsia, 2002).
Unfortunately, research in this area specific to Latinoyouth is scant. Although there is evidence of disproportionate representation of Latinos in the juvenile justice system, gaps and inconsistencies in thecollection and presentation of information on Latinos continue to be a problem. Since many data systemsfail to disaggregate ethnicity from race, Latino youthare often counted as “White.” As a result, data on theextent to which young people of color are overrepre-sented in the juvenile justice system are generallyunderreported in much of the analysis of this issue.
It is clear that youth of color are more likely than others to become involved with the juvenile justicesystem. Racial or ethnic differences tend to accumu-late as youth are processed through the system. Thisreport updates a 2000 report entitled “And Justice forSome: Differential Treatment of Minority Youth in theJustice System,” published by the National Council onCrime and Delinquency (NCCD) in collaborationwith Building Blocks for Youth. It documented“cumulative disadvantage” at the national level. We are indebted to Mark Soler, President of the YouthLaw Center, for suggesting that NCCD produce thefirst report, and for his support throughout thereport’s assembly. The original report from 2000 wasdrafted by Eileen Poe-Yamagata and Michael Jones.This update was drafted by Christopher Hartney andFabiana Silva.
Arrests
• In 2004, the majority of juvenile arrests were White youth.
• In 2004, African American youth were disproportionately arrested in 26 of 29 offense categories documented by the FBI.
Referrals to Juvenile Court
• In 2003, the overall majority of cases referred to juvenile court involved White youth.
• African American youth were overrepresented among cases referred to juvenile court.
EXECUTIVE SUMMARY
2 And Justice for Some
Detention
• Although White youth made up 67% of the juvenile court referral population, they made up 60% of the detained population. In contrast, African American youth made up 30% of the referral population and 37% of the detained population.
• Nationwide, in every offense category—person, property, drug, public order—African American youth were dispro-portionately detained.
• In comparison to White youth, African American youth were overrepresented in the detained population in 45 states.
Formal Processing
• African American youth were more likely than White youthto be formally charged in juvenile court, even when referred for the same type of offense.
• Although just over half of drug cases involving White youth resulted in formal processing, over three-quarters of drug cases involving African American youth result in formal processing.
Waiver to Adult Court
• An estimated 6,735 petitioned delinquency cases were waived from juvenile to adult court in 2003.
• African American youth were somewhat more likely to be waived to adult criminal court than White youth. This varied to a degree by offense category.
• For drug cases, White youth were 69% of cases petitionedbut only 58% of cases waived to adult court. African American youth charged with drug offenses were 29% of cases petitioned but 41% of cases waived to adult court. Thus, among drug offense cases referred to juvenile court,White youth enjoy an 11% “waiver advantage,” while African American youth carry a 12% “waiver disadvantage.”
Disposition
• African American youth were overrepresented among cases receiving a disposition of out-of-home placement (commitment to a locked institution). This was true in all offense categories and was most pronounced among drug offense cases.
• Conversely, White youth were more likely than African American youth to be placed on probation.
Detention and Incarceration in Juvenile Facilities
• Although African American youth are 16% of the adolescent population in the United States, they are 38% of the almost 100,000 youth confined in local detention and state correctional systems. They were overrepresentedin all offense categories.
• Youth of color make up the majority of youth held in both public and private facilities.
! Youth of color, especially Latino youth, are a much larger proportion of youth in public than private facilities, which tend to be less harsh environments.
! While representing just 34% of the U.S. population in 1999, youth of color were 62% of youth in detention, 66% of youth committed to public facilities, and 55% of youth committed to private facilities.
• Nationwide, youth of color were overrepresented in the detained population at 3.1 times the rate of White youth, among commitments to public facilities at 2.9 times the rate of White youth, and among private commitments at 2.0 times the rate of White youth.
• Overall, custody rates were 4 times greater for African American youth than for White youth. Custody rates for Latino and Native American youth were 1.8 and 2.6 times the custody rate of White youth, respectively.
• In a 1995 study, NCCD found that African American and Latino youth had higher incarceration rates in state public facilities than White youth when controlling for current offense and prior admissions.
! When White youth and African American youth were charged with the same offenses, African American youth with no prior admissions were six times more likely to be incarcerated in public facilities than White youth with the same background.
! Latino youth were three times more likely than White youth to be incarcerated.
! Admission rates to public facilities were seven times greater among African American youth with one or two prior admissions than among White youth in 1993. The admission rate for Latino youth was twice the rate of White youth.
! African American youth were confined on average for 61 days longer than White youth, and Latino youth were confined 112 days longer than White youth.
And Justice for Some 3
Incarceration in Adult Prisons
• In 2002, an estimated 4,100 new admissions to adultprisons involved youth under the age of 18. Three out of fourof these youths were youth of color. African American youthaccounted for 58% of total admission to adult prisons.
• Overrepresentation of youth of color and underrepresenta-tion of White youth were reported by nearly every statereporting admissions of youth under age 18 to adult prisonsin 2002.
Accumulated Disadvantage
From 2002 to 2004, African Americans were:
• 16% of youth.
• 28% of juvenile arrests.
• 30% of referrals to juvenile court.
• 37% of the detained population.
• 34% of youth formally processed by the juvenile court.
• 30% of adjudicated youth.
• 35% of youth judicially waived to criminal court.
• 38% of youth in residential placement.
• 58% of youth admitted to state adult prison.
While “Equal Justice Under the Law” is the founda-tion of our legal system, and is carved on the front ofthe U.S. Supreme Court, the juvenile justice system isanything but equal for all. Throughout the system,youth of color—especially African American youth—receive different and harsher treatment for similaroffenses. This report documents a juvenile justice system that is “separate and unequal.”
4 And Justice for Some
There has been growing national concern aboutthe overrepresentation of youth of color (traditionally defined as African Americans,
Native Americans, Latinos, Asians, and PacificIslanders) confined in secure facilities. Research hasshown that youth of color, and in particular AfricanAmerican youth, are confined in public correctionalfacilities at higher rates than White youth.
The disproportionate minority contact (DMC)requirement of the Juvenile Justice and DelinquencyPrevention Act (JJDPA) of 2002 urges states toimprove juvenile delinquency prevention efforts andto reduce the disproportionate number of juvenilemembers of minority groups in the system. The aim ofthis requirement is to ensure equal and fair treatmentfor every youth regardless of race and ethnicity.
Although public attention has focused on the dispro-portionate number of youth of color in confinement,it is necessary to view the justice system as a process.Representation of youth of color can be examined as a series of critical decision points as youth movethrough the system. Amendments to the JJDPArequired states to assess disproportion by systemati-cally identifying the extent of overrepresentation ofyouth of color at each decision point in the process.This systematic approach views the overall processthat creates overrepresentation rather than focusingonly on the end result of confinement.
Depending on local practices and traditions, statesand communities can differ in the way that theyprocess juvenile law violators. However, a commonset of critical decision points—arrest, intake, deten-tion, adjudication, and disposition—have become thebasis for research on system overrepresentation ofyouth of color.
Studies that have found evidence of disproportionateminority confinement typically ascribe its causes toeither racial bias against youth of color within the
juvenile justice system or more serious and/or morefrequent offenses being committed by youth of color(see Hsia, Bridges, & McHale, 2004). Determiningwhether either or both of these phenomena are thereason for disparity requires analysis of detailed dataon specific offense classifications, criminal history,and other factors used to make decisions. Studies suchas this suggest that processing decisions are not racial-ly neutral. Youth of color are more likely than Whiteyouth to become involved in the system, and theiroverrepresentation increases at each stage of theprocess.
When racial or ethnic differences are found, they tendto accumulate as youth are processed through the system. This “cumulative disadvantage” is reflected ina 1997 report on DMC which found that overrepre-sentation increased from the point of arrest throughother points in the system to the final point of securejuvenile corrections in 31 of 36 states studied(Hamparian & Leiber, 1997). A 2005 report by theChild Welfare League of America compiled evidenceof this phenomenon among different ethnic groups(Short & Sharp, 2005). This NCCD report updates a2000 report entitled “And Justice for Some:Differential Treatment of Minority Youth in theJustice System,” published by NCCD in collaborationwith Building Blocks for Youth, which documentedthe cumulative disadvantage African Americans at thenational level.
As expected, much of the existing research on DMChas primarily focused on disparity in the processing of youth through the juvenile justice system and thedisproportionate confinement of youth of color whileunder juvenile court jurisdiction. However, with leg-islative efforts in the past two decades to “get tough”on serious and violent juvenile offending, significantnumbers of juveniles are being processed throughadult criminal courts. Currently, all states and theDistrict of Columbia allow adult criminal prosecutionof juveniles under some circumstances. In addition,
INTRODUCTION
And Justice for Some 5
between 1992 and 1997, legislatures in 47 states andthe District of Columbia enacted laws that eithermade it easier to transfer youth from the juvenile jus-tice system to the criminal justice system, that gavecriminal and juvenile courts expanded sentencingoptions, or modified or removed traditional juvenilecourt confidentiality provisions (Snyder & Sickmund,1999). Also, the threshold age for processing youthin adult court is less than 18 years in 13 states—inthese states, 16- or 17-year-olds are not “waived” butrather automatically considered “adults” andprocessed in the adult system, regardless of offensetype or criminal history.
As a result, the reality of disproportionate numbers ofyouth of color flowing through the juvenile justicesystem is no longer just about juvenile court sanc-tions. It is also about youth of color being too oftensubjected to adult court processing and incarcerationin adult jail and prison, with all of its collateral conse-quences and obstacles to reentry.
Unfortunately, research in this area specific to Latinoyouth is scant. Although there is evidence of dispro-portionate representation of Latinos in the juvenilejustice system, gaps and inconsistencies in the collec-tion and presentation of information on Latinos con-tinue to be a problem. Since many data systems fail todisaggregate ethnicity from race, Latino youth areoften counted as “White.” As a result, data on theextent to which young people of color are overrepre-sented in the juvenile justice system are generallyunderreported in much of the analysis of this issue.
In recent years, there has been a decrease in the num-ber of youth in the juvenile justice system. From 1997to 2004, juvenile arrests decreased 22%. From 1997to 2003, referrals decreased 11% and placements inresidential facilities decreased 8%. The biggest changeoccurred in the number of new admissions to stateprison; between 1997 and 2002, this numberdecreased 45%. This signified a large turnaroundfrom previous years. Between 1985 and 1997, thenumber of youth admitted to state prisons had morethan doubled from 3,400 to 7,400. Nevertheless, this
report demonstrates that the overrepresentation ofyouth of color, particularly African American youth,remains a serious issue. (Puzzanchera, Adams, Snyder,& Kang, 2006; Sickmund, Sladky, & Kang, 2005;Snyder & Sickmund, 2006; Stahl, Finnegan, & Kang,2006; Strom, 2000).
METHODOLOGY
This report presents several sources of data anddraws from both original and previously pub-lished analysis. Population estimates from the
National Center for Health Statistics were obtainedthrough Easy Access to Juvenile Populations(Puzzanchera, Finnegan, & Kang, 2006). Nationalestimates of juvenile arrest data derived from the FBI’sUniform Crime Report (UCR) Program were obtainedfrom Easy Access to FBI Arrest Statistics, 1994-2004(Puzzanchera, Adams, Snyder, & Kang, 2006) andCrime in the United States 2004 (U.S. Dept. ofJustice, 2006a). Analysis of juvenile court data wasperformed using national estimates developed by theOJJDP National Juvenile Court Data Archive and dis-tributed through the data presentation and analysispackage, Easy Access to Juvenile Court Statistics,1985-2003 (Stahl, Finnegan, & Kang, 2006). Thejuvenile corrections data came from OJJDP’s Censusof Juveniles in Residential Placement (Sickmund,Sladky, & Kang, 2005), the Juveniles Taken intoCustody Research Program (DeComo, 1993; Krisberg,DeComo, Rudenstine, & Del Rosario, 1995), and theOJJDP report, Juveniles in Corrections (Sickmund,2004). Analysis presented on juveniles in adult cus-tody was derived from the Bureau of Justice Statistics’National Corrections Reporting Program, 2002 (U.S.Dept. of Justice, 2006b). Additional information wasobtained from OJJDP’s Juvenile Offenders andVictims: 2006 National Report (Snyder & Sickmund,2006).
Generally, “disproportionate minority contact” refersto the differential representation of racial and/or eth-nic groups in the juvenile justice system. As described
6 And Justice for Some
in Juveniles in Corrections, the following terms areoften used when examining this issue and are key tounderstanding its occurrence:
• “Overrepresentation” refers to a situation in which a largerproportion of a particular group is present at various stages within the juvenile justice system than would be expected based on their proportion in the general population.
• “Disparity” means that the probability of receiving a particular outcome differs for different groups. Disparity may in turn lead to overrepresentation.
• “Discrimination” occurs if and when juvenile justice system decision-makers treat one group of juveniles differently from another group based wholly or in parton their gender, race, and/or ethnicity.
In this report, two types of data are presented foreach level of involvement in the system. First, data is presented expressing the cumulative nature of disproportionate representation as youth movethrough successive levels of the system, for example,comparing ethnic proportions of arrests to propor-tions of referrals. Second, overall data describes eachlevel in relation to the number of youth in the generalpopulation.
ARREST DATA
Police are typically the first officials of the justice system that a youth encounters. Responsesrange from a simple warning, to arrest and
detention, to transfer to adult court.
At arrest, law enforcement officials decide to eithersend a case further into the justice system or to divertit, often into alternative programs. In 2003, 71% of all
juvenile arrests were referred to juvenile court, 20%were handled within the department and released, and 7% were referred directly to criminal court. The remaining youth were referred to a welfareagency or another police agency (Snyder & Sickmund,2006).
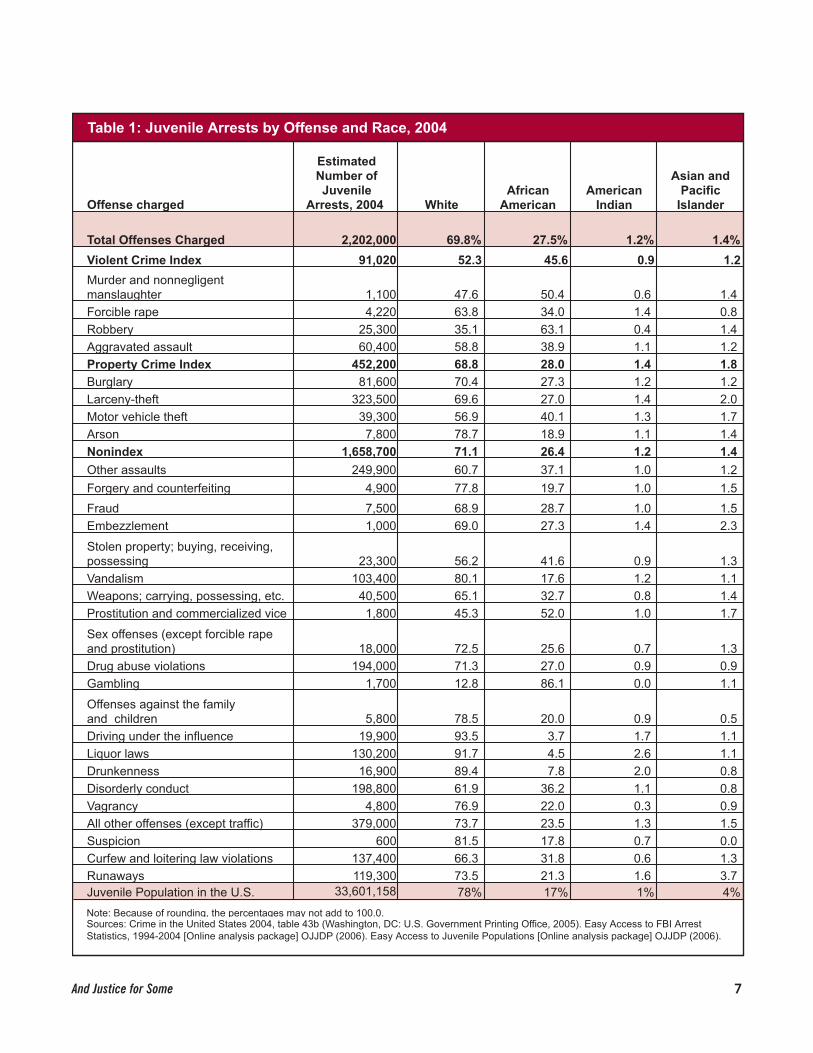
United States law enforcement agencies made an estimated 2.2 million arrests of persons under age 18in 2004 (Table 1). Less than 5% of those arrests werefor Violent Crime Index offenses, and an estimated.05% were for murder.
The majority (70%) of those arrests involved Whiteyouth. Still, African American youth were overrepre-sented in most offense categories. Some have arguedthat this overrepresentation of youth of color in thejustice system simply is a result of these youth committing more crimes than White youth. However,a true analysis is much more complicated. It is notclear whether this overrepresentation is the result ofdifferential police policies and practices (targetingpatrols in certain low-income neighborhoods, policiesrequiring immediate release to biological parents,group arrest procedures); location of offenses (youthof color using or selling drugs on street corners, Whiteyouth using or selling drugs in homes); differentbehavior by youth of color (whether youth of colorcommit more crimes than White youth); differentialreactions of victims to offenses committed by Whiteand youth of color (whether White victims of crimesdisproportionately perceive the offenders to be youthof color); or racial bias within the justice system. Inaddition, in a meta-analysis of studies on race and thejuvenile justice system, researchers have found thatalmost three-quarters of the studies of disproportion-ate minority confinement showed negative “raceeffects” at one stage or another of the juvenile justiceprocess (Pope, Lovell, & Hsia, 2002).
And Justice for Some 7
Offense charged
Estimated Number of Juvenile
Arrests, 2004 WhiteAfrican
AmericanAmerican
Indian
Asian and Pacific
Islander
Total Offenses Charged 2,202,000 69.8% 27.5% 1.2% 1.4%
Violent Crime Index 91,020 52.3 45.6 0.9 1.2
Murder and nonnegligent manslaughter 1,100 47.6 50.4 0.6 1.4 Forcible rape 4,220 63.8 34.0 1.4 0.8 Robbery 25,300 35.1 63.1 0.4 1.4 Aggravated assault 60,400 58.8 38.9 1.1 1.2 Property Crime Index 452,200 68.8 28.0 1.4 1.8 Burglary 81,600 70.4 27.3 1.2 1.2 Larceny-theft 323,500 69.6 27.0 1.4 2.0 Motor vehicle theft 39,300 56.9 40.1 1.3 1.7 Arson 7,800 78.7 18.9 1.1 1.4 Nonindex 1,658,700 71.1 26.4 1.2 1.4 Other assaults 249,900 60.7 37.1 1.0 1.2
Forgery and counterfeiting 4,900 77.8 19.7 1.0 1.5
Fraud 7,500 68.9 28.7 1.0 1.5 Embezzlement 1,000 69.0 27.3 1.4 2.3
Stolen property; buying, receiving, possessing 23,300 56.2 41.6 0.9 1.3 Vandalism 103,400 80.1 17.6 1.2 1.1 Weapons; carrying, possessing, etc. 40,500 65.1 32.7 0.8 1.4 Prostitution and commercialized vice 1,800 45.3 52.0 1.0 1.7
Sex offenses (except forcible rape and prostitution) 18,000 72.5 25.6 0.7 1.3 Drug abuse violations 194,000 71.3 27.0 0.9 0.9 Gambling 1,700 12.8 86.1 0.0 1.1
Offenses against the family and children 5,800 78.5 20.0 0.9 0.5 Driving under the influence 19,900 93.5 3.7 1.7 1.1 Liquor laws 130,200 91.7 4.5 2.6 1.1 Drunkenness 16,900 89.4 7.8 2.0 0.8 Disorderly conduct 198,800 61.9 36.2 1.1 0.8 Vagrancy 4,800 76.9 22.0 0.3 0.9 All other offenses (except traffic) 379,000 73.7 23.5 1.3 1.5 Suspicion 600 81.5 17.8 0.7 0.0 Curfew and loitering law violations 137,400 66.3 31.8 0.6 1.3 Runaways 119,300 73.5 21.3 1.6 3.7 Juvenile Population in the U.S. 33,601,158 78% 17% 1% 4%
Table 1: Juvenile Arrests by Offense and Race, 2004
Note: Because of rounding, the percentages may not add to 100.0. Sources: Crime in the United States 2004, table 43b (Washington, DC: U.S. Government Printing Office, 2005). Easy Access to FBI Arrest Statistics, 1994-2004 [Online analysis package] OJJDP (2006). Easy Access to Juvenile Populations [Online analysis package] OJJDP (2006).
8 And Justice for Some
Most delinquency cases are referred to juve-nile court by law enforcement while othersare made by parents, victims, schools, and
probation officers. At court intake, a decision ismade—typically by either juvenile probation or aprosecutor’s office—to dismiss the case, handle thematter informally, or request formal intervention bythe juvenile court.
During the processing of a case, a youth may be heldin a secure detention facility if this is determined to bein the best interest of the child or the community.While an initial decision to detain may be made byprobation or detention workers, a detention hearingmust follow (generally within 24 hours) to determinethe need for continued detention.
If the case is handled in juvenile court, a petition isfiled to either adjudicate or judicially waive the youthto adult court. A delinquency petition results in anadjudicatory hearing in which a juvenile court judgedetermines the responsibility for the offense after wit-nesses are called and the facts of the case are present-ed. A waiver petition results in a judicial hearinginvolving a review of the facts of the case and a deter-mination of probable cause that the young personcommitted the act. The court must then considerwhether juvenile court jurisdiction should be waivedand the case transferred to criminal court.
An adjudication of delinquency is followed by a dis-position hearing. At this time a disposition plan ismade by probation, and recommendations may bepresented to the judge who orders the disposition inthe case. Dispositions may include a variety of servic-es and sanctions including probation, residentialplacement (publicly or privately operated), substanceabuse treatment, or other sanctions such as weekenddetention, community or victim restitution, or coun-seling. Transfer to adult court is followed by trial andsentencing in that court.
A growing number of states have adopted legislationto exclude certain serious crimes from the jurisdictionof juvenile court and send them directly to adult courtor to increase the discretion of prosecutors to directlyfile certain cases in adult court. In such circumstances,the case commences with charges brought in adultcriminal court.
The following sections identify racial disparities asyouth are processed through juvenile court, includingreferral, detention, formal petition, waiver to adultcourt, and disposition. As stated previously, attempt-ing to explain racial disparity without more detaileddata is inappropriate.
Referrals
After arrest, a decision is made to refer the case tojuvenile court or handle it in some other way, such asdismissal or diversion. In 2003, of the estimated1,628,822 delinquency cases referred to the nation’sjuvenile courts in 2003, 67% involved White youth,30% involved African American youth, and 3%involved youth of other races. Nevertheless, AfricanAmerican and Native American youth were referredto juvenile court at significantly higher rates thanWhite youth. White youth were referred to juvenilecourt at a rate of 4,431 per 100,000 youth, comparedto 9,633 for African American youth and 5,409Native American youth. Though females werereferred to juvenile court at lower rates than males,the pattern of disparate representation remained(Figure 1).
JUVENILE COURT PROCESSING

And Justice for Some 9
Rate (per 100,000)
6,365
2,391
13,973
5,158
7,373
3,390
2,396
839
-
2,000
4,000
6,000
8,000
10,000
12,000
14,000
16,000
Male Female
Figure 1: Rates of Youth Referred to Juvenile Court by Sex and Race, 2003
Note: The rate is the number of youth referred to juvenile court, per 100,000 juveniles age 10 through the upper age of jurisdiction in the general population of each state. Source: Easy Access to Juvenile Court Statistics, 1985-2003 [Online analysis package] OJJDP (2006). Easy Access to Juvenile Populations [Online analysis package] OJJDP (2006).
White African American Native American Asian and Pacific Islander

10 And Justice for Some
Figure 2: Racial Proportions of the Juvenile Population and of Referrals to Juvenile Court, 2003
Sources: Easy Access to Juvenile Court Statistics, 1985-2003 [Online analysis package] OJJDP (2006). Easy Access to Juvenile Populations [Online analysis package] OJJDP (2006).
78%
16%
1%4%
67%
30%
2% 1%
0%
10%
20%
30%
40%
50%
60%
70%
80%
90%
White African American Native American Asian and Pacific Islander
Population
Referrals
Racial representation varies according to offense type(Table 2). White youth represent a higher percentageof drug offenses (76%) than person offenses (60%);in contrast, African Americans represent a higher per-
centage of person crimes (38%) than drug crimes (22%).Nevertheless, compared to their population figures,White youth are underrepresented and AfricanAmerican youth are overrepresented in every category.
Compared to their percentage in the general juvenilepopulation, African American and Native American
youth are overrepresented (Figure 2).
Table 2: The Offense Profiles of Juvenile Court Referrals by Race, 2003Person Property Drug Public Order
White 60% 69% 76% 67%African American 38% 28% 22% 30%Native American 1% 2% 1% 1%Asian and Pacific Islander 1% 2% 1% 1%Total 100% 100% 100% 100%
Note: Details may not add to totals due to roundingSources: Easy Access to Juvenile Court Statistics, 1985-2003 [Online analysis package] OJJDP (2006).
.

And Justice for Some 11
Detention Data
Some youth who are referred to juvenile court areheld in detention as their case progresses, usuallybecause of the seriousness of the crime or risk to thecommunity or the youth. An estimated 331,779 delin-quent youth were detained in 2003. With respect totheir proportion of referrals, White youth were under-represented while African American youth were overrepresented. While White youth made up 67% of juvenile referrals, they accounted for 60% of deten-tions. In contrast, African American youth made up30% of referrals and 37% of detentions.
This disparity remained when the referrals and deten-tions were separated according to offense categories(Figures 3a & 3b). The pattern was most pronouncedamong drug cases. Drug offense cases involving Whiteyouth were 76% of those referred but only 62% ofthose detained. In contrast, drug offense cases involv-ing African American youth were 22% of thosereferred but 36% of those detained. In every offensecategory, a substantially greater percentage of AfricanAmerican youth were detained than White youth.
Figure 3a: Racial Proportions of Referred and Detained Delinquency Cases, 2003
Person Offenses
Property Offenses
60%
38%
1% 1%
55%
42%
1% 2%
0%
10%
20%
30%
40%
50%
60%
70%
White African American Native American Asian and Pacific Islander
Referred
Detained
69%
28%
2% 2%
61%
35%
1% 2%
0%
10%
20%
30%
40%
50%
60%
70%
80%
White African American Native American Asian and Pacific Islander
Referred
Detained
Sources: Easy Access to Juvenile Court Statistics, 1985-2003 [Online analysis package] OJJDP (2006).

12 And Justice for Some
Figure 3b: Racial Proportions of Referred and Detained Delinquency Cases, 2003
Drug Law Violations
76%
22%
1% 1%
62%
36%
1% 1%0%
10%
20%
30%
40%
50%
60%
70%
80%
White African American Native American Asian and Pacific Islander
Referred
Detained
Public Order Offenses
67%
30%
1% 1%
63%
34%
2% 2%
0%
10%
20%
30%
40%
50%
60%
70%
80%
White African American Native American Asian and Pacific Islander
Referred
Detained
Sources: Easy Access to Juvenile Court Statistics, 1985-2003 [Online analysis package] OJJDP (2006).
African Amerian youth are more likely than Whiteyouth to be detained pretrial, even when chargedwithin the same offense category.
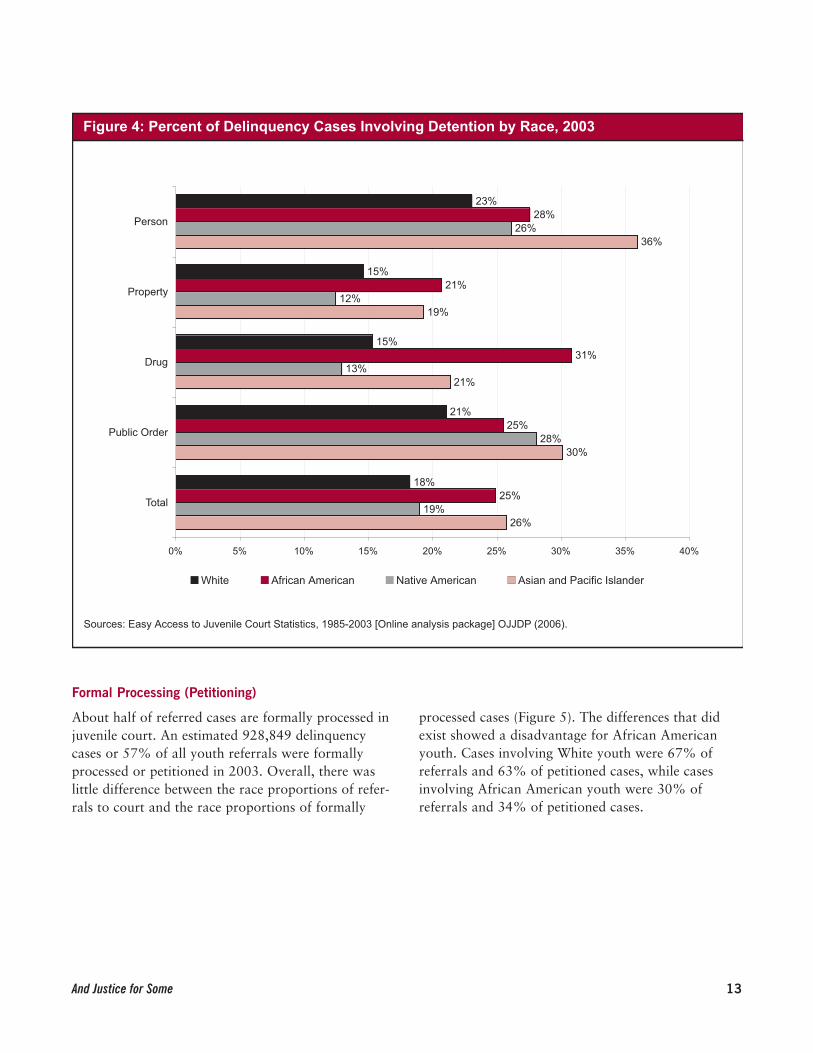
Overall, detention was used more often for referredAfrican American youth (25%) and Asian and PacificIslander youth (26%), than for referred White youth(18%) (Figure 4). This was true among each of the four
major offense categories as well. For youth chargedwith comparable offenses—whether person, property,drug, or public order offenses—youth of color, especially African Americans and Asian and PacificIslanders, were locked up more often than Whiteyouth. Cases involving African American youth weremore than twice as likely to be detained for a drugoffense than White youth (31% and 15%, respectively).
And Justice for Some 13
Figure 4: Percent of Delinquency Cases Involving Detention by Race, 2003
23%
15%
15%
21%
18%
28%
21%
31%
25%
25%
26%
12%
13%
28%
19%
36%
19%
21%
30%
26%
0% 5% 10% 15% 20% 25% 30% 35% 40%
Person
Property
Drug
Public Order
Total
Sources: Easy Access to Juvenile Court Statistics, 1985-2003 [Online analysis package] OJJDP (2006).
White African American Native American Asian and Pacific Islander
Formal Processing (Petitioning)
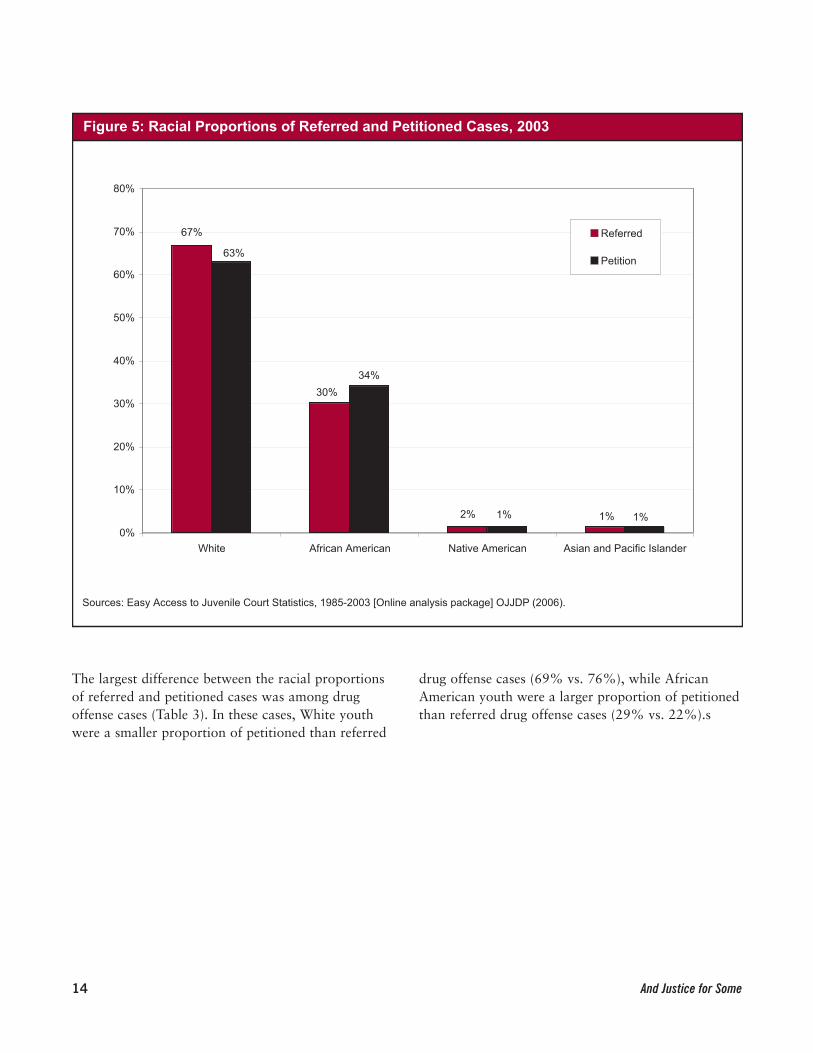
About half of referred cases are formally processed injuvenile court. An estimated 928,849 delinquencycases or 57% of all youth referrals were formallyprocessed or petitioned in 2003. Overall, there waslittle difference between the race proportions of refer-rals to court and the race proportions of formally
processed cases (Figure 5). The differences that didexist showed a disadvantage for African Americanyouth. Cases involving White youth were 67% ofreferrals and 63% of petitioned cases, while casesinvolving African American youth were 30% of referrals and 34% of petitioned cases.
14 And Justice for Some
Figure 5: Racial Proportions of Referred and Petitioned Cases, 2003
Sources: Easy Access to Juvenile Court Statistics, 1985-2003 [Online analysis package] OJJDP (2006).
67%
30%
2% 1%
63%
34%
1% 1%0%
10%
20%
30%
40%
50%
60%
70%
80%
White African American Native American Asian and Pacific Islander
Referred
Petition
The largest difference between the racial proportionsof referred and petitioned cases was among drugoffense cases (Table 3). In these cases, White youthwere a smaller proportion of petitioned than referred
drug offense cases (69% vs. 76%), while AfricanAmerican youth were a larger proportion of petitionedthan referred drug offense cases (29% vs. 22%).s

And Justice for Some 15
Referred Cases Petitioned Cases
PersonWhite 60% 56%African American 38% 42%Native American 1% 1%Asian and Pacific Islander 1% 1%Total 100% 100%PropertyWhite 69% 65%African American 28% 31%Native American 2% 2%Asian and Pacific Islander 2% 2%Total 100% 100%DrugWhite 76% 69%African American 22% 29%Native American 1% 1%Asian and Pacific Islander 1% 1%Total 100% 100%Public OrderWhite 67% 64%African American 30% 33%Native American 1% 1%Asian and Pacific Islander 1% 2%Total 100% 100%
Table 3: Referred and Petitioned Delinquency Cases, 2003
Percent of
Source: Easy Access to Juvenile Court Statistics, 1985-2003 [Online analysis package] OJJDP (2006).
Overall, delinquency cases were petitioned more oftenamong cases involving African American youth (64%)and Asian and Pacific Islander youth (60%) thanWhite youth (54%) in 2003 (Figure 6). This was truefor each of the four offense categories. The most strik-
ing difference was among drug offense cases. In 2003,about three in four (77%) drug offense cases involv-ing African American youth were formally processedcompared to about one-half of cases involving Whiteyouth (54%).

16 And Justice for Some
Figure 6: Percent of Delinquency Cases Petitioned by Race, 2003
Sources: Easy Access to Juvenile Court Statistics, 1985-2003 [Online analysis package] OJJDP (2006).
56%
52%
54%
54%
54%
66%
62%
77%
62%
64%
55%
50%
48%
60%
53%
67%
53%
59%
68%
60%
0% 10% 20% 30% 40% 50% 60% 70% 80% 90%
Person
Property
Drug
Public Order
Total
White African American Native American Asian and Pacific Islander
Waiver to Adult Court
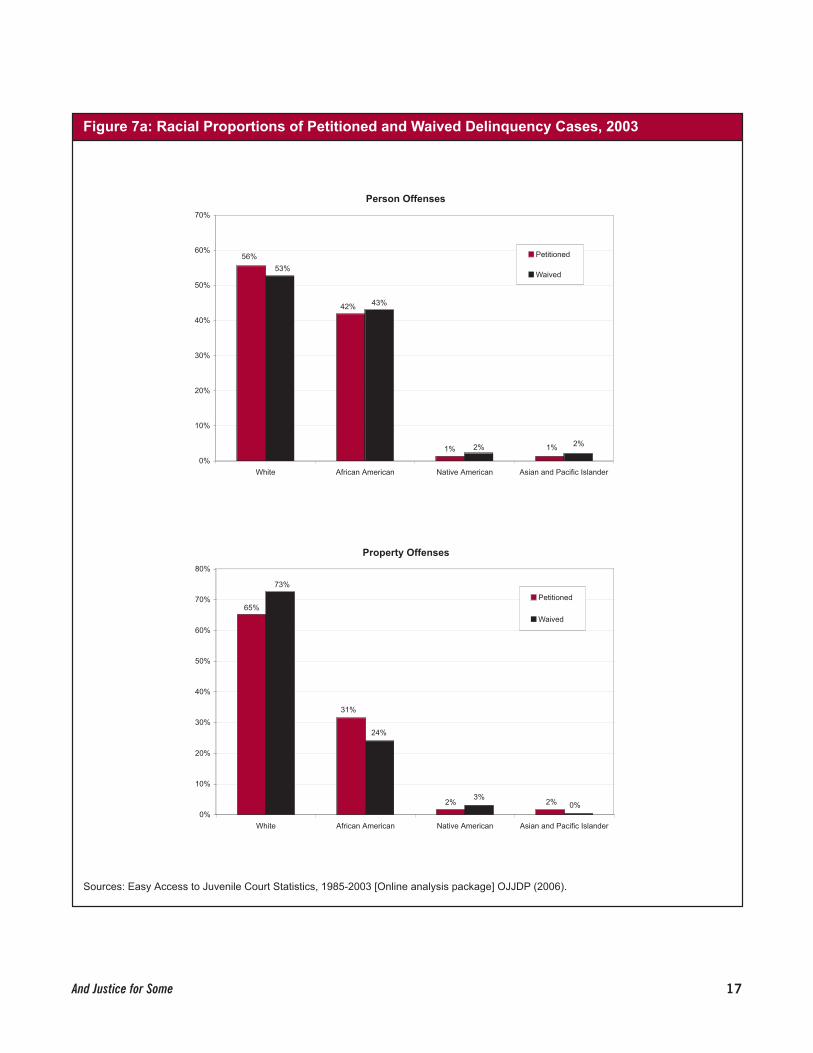
Some petitioned juveniles are processed in the adultsystem instead of the juvenile system, usually becauseof the seriousness of their crime and their arrest histo-ry. An estimated 6,735 petitioned delinquency caseswere judicially waived from juvenile to adult court in2003. This represents less than 1% of all petitionedcases. The racial proportions were fairly similar forpetitioned and judicially waived cases. Overall, casesinvolving White youth represented a slightly smallerproportion of waived cases than of petitioned cases(61% vs. 63%), and cases involving African Americanyouth represented a slightly larger proportion ofwaived cases than petitioned cases (35% vs. 34%).
This pattern varied somewhat according to offensetype (Figures 7a and 7b). For drug offenses, Whiteyouth were 69% of the cases petitioned but only 58% of cases waived to adult court. AfricanAmerican youth charged with similar offenses were29% of cases petitioned but 41% of cases waived toadult court. On the other hand, White youth repre-sented 65% of property cases petitioned but 73% of property cases waived to adult court. AfricanAmerican youth charged with similar offenses were31% of cases petitioned but 24% of cases waived toadult court.
And Justice for Some 17
Figure 7a: Racial Proportions of Petitioned and Waived Delinquency Cases, 2003
Sources: Easy Access to Juvenile Court Statistics, 1985-2003 [Online analysis package] OJJDP (2006).
Person Offenses
1%1%
42%
56%
2%2%
43%
53%
0%
10%
20%
30%
40%
50%
60%
70%
White African American Native American Asian and Pacific Islander
Petitioned
Waived
Property Offenses
2%2%
31%
65%
0%3%
24%
73%
0%
10%
20%
30%
40%
50%
60%
70%
80%
White African American Native American Asian and Pacific Islander
Petitioned
Waived

18 And Justice for Some
Figure 7b : Racial Proportions of Petitioned and Waived Delinquency Cases, 2003
Sources: Easy Access to Juvenile Court Statistics, 1985-2003 [Online analysis package] OJJDP (2006).
Public Order Offenses
2%1%
33%
64%
0%2%
28%
70%
0%
10%
20%
30%
40%
50%
60%
70%
80%
White African American Native American Asian and Pacific Islander
Petitioned
Waived
Drug Law Violations
1%1%
29%
69%
0%1%
41%
58%
0%
10%
20%
30%
40%
50%
60%
70%
80%
White African American Native American Asian and Pacific Islander
Petitioned
Waived

And Justice for Some 19
The likelihood of waiver among petitioned delinquen-cy cases was slightly greater for African Americanyouth (0.8%) and youth of other races (0.9%) thanfor White youth (.7%) (Figure 8). Again, the differ-ence between White youth and African American
youth is particularly noticeable for drug offenses. In 2003, 0.7% of the White youth charged with person offenses were waived to adult court, while1.2% of the African American youth were waived.
Figure 8: Percent of Petitioned Cases Waived to Criminal Court by Race, 2003
Sources: Easy Access to Juvenile Court Statistics, 1985-2003 [Online analysis package] OJJDP (2006).
1.2%
0.7%
0.7%
0.2%
0.7%
1.3%
0.5%
1.2%
0.2%
0.8%
2.2%
1.2%
1.0%
0.3%
1.2%
2.0%
0.2%
0.0%
0.0%
0.5%
0.0% 0.5% 1.0% 1.5% 2.0% 2.5%
Person
Property
Drug
Public Order
Total
White African American Native American Asian and Pacific Islander
20 And Justice for Some
Disposition
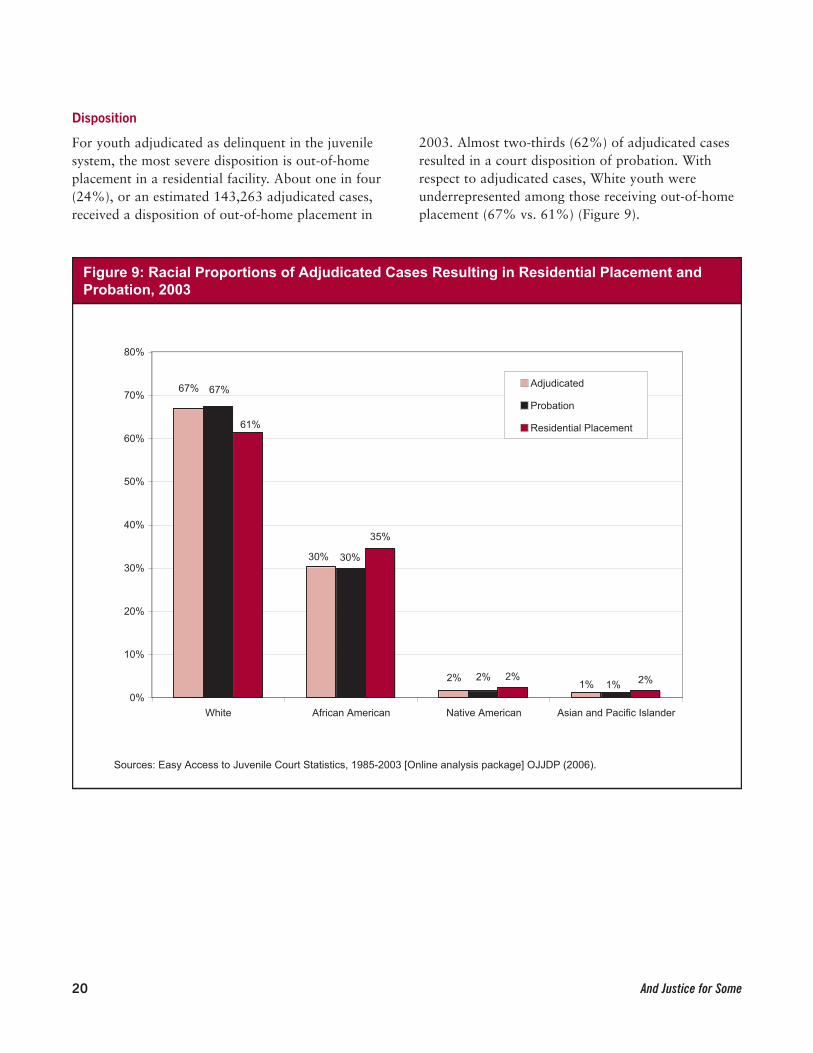
For youth adjudicated as delinquent in the juvenilesystem, the most severe disposition is out-of-homeplacement in a residential facility. About one in four(24%), or an estimated 143,263 adjudicated cases,received a disposition of out-of-home placement in
2003. Almost two-thirds (62%) of adjudicated cases resulted in a court disposition of probation. Withrespect to adjudicated cases, White youth were underrepresented among those receiving out-of-homeplacement (67% vs. 61%) (Figure 9).
Figure 9: Racial Proportions of Adjudicated Cases Resulting in Residential Placement andProbation, 2003
Sources: Easy Access to Juvenile Court Statistics, 1985-2003 [Online analysis package] OJJDP (2006).
2% 2%
67%
30%
2%1%
67%
30%
2%1%
35%
61%
0%
10%
20%
30%
40%
50%
60%
70%
80%
White African American Native American Asian and Pacific Islander
Adjudicated
Probation
Residential Placement
And Justice for Some 21
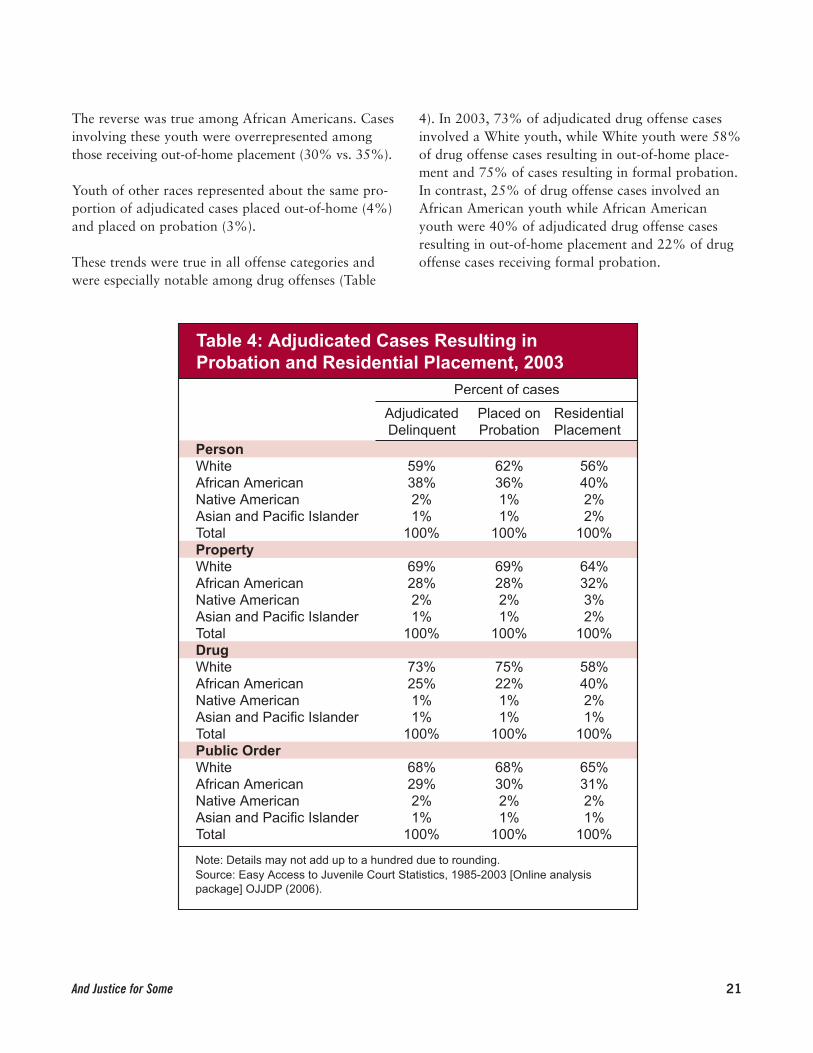
The reverse was true among African Americans. Casesinvolving these youth were overrepresented amongthose receiving out-of-home placement (30% vs. 35%).
Youth of other races represented about the same pro-portion of adjudicated cases placed out-of-home (4%)and placed on probation (3%).
These trends were true in all offense categories andwere especially notable among drug offenses (Table
4). In 2003, 73% of adjudicated drug offense casesinvolved a White youth, while White youth were 58%of drug offense cases resulting in out-of-home place-ment and 75% of cases resulting in formal probation.In contrast, 25% of drug offense cases involved anAfrican American youth while African Americanyouth were 40% of adjudicated drug offense casesresulting in out-of-home placement and 22% of drugoffense cases receiving formal probation.
Adjudicated Delinquent
Placed on Probation
Residential Placement
PersonWhite 59% 62% 56%African American 38% 36% 40%Native American 2% 1% 2%Asian and Pacific Islander 1% 1% 2%Total 100% 100% 100%PropertyWhite 69% 69% 64%African American 28% 28% 32%Native American 2% 2% 3%Asian and Pacific Islander 1% 1% 2%Total 100% 100% 100%DrugWhite 73% 75% 58%African American 25% 22% 40%Native American 1% 1% 2%Asian and Pacific Islander 1% 1% 1%Total 100% 100% 100%Public OrderWhite 68% 68% 65%African American 29% 30% 31%Native American 2% 2% 2%Asian and Pacific Islander 1% 1% 1%Total 100% 100% 100%
Table 4: Adjudicated Cases Resulting in Probation and Residential Placement, 2003
Percent of cases
Note: Details may not add up to a hundred due to rounding.Source: Easy Access to Juvenile Court Statistics, 1985-2003 [Online analysis package] OJJDP (2006).

22 And Justice for Some
Adjudicated cases involving White youth were lesslikely to result in out-of-the-home placement in 2003(22%) than were cases involving African Americanyouth (27%) or youth of other races (32%) (Figure 10).
Among youth charged with similar crimes, in everyoffense category, youth of color were more likely to be placed out of home.
Figure 10: Percent of Adjudicated Delinquency Cases Placed Out of the Home by Race, 2003
Sources: Easy Access to Juvenile Court Statistics, 1985-2003 [Online analysis package] OJJDP (2006).
25%
21%
16%
24%
22%
28%
26%
32%
27%
27%
38%
32%
23%
32%
33%
37%
29%
20%
34%
31%
0% 5% 10% 15% 20% 25% 30% 35% 40% 45%
Person
Property
Drug
Public Order
Total
White African American Native American Asian and Pacific Islander
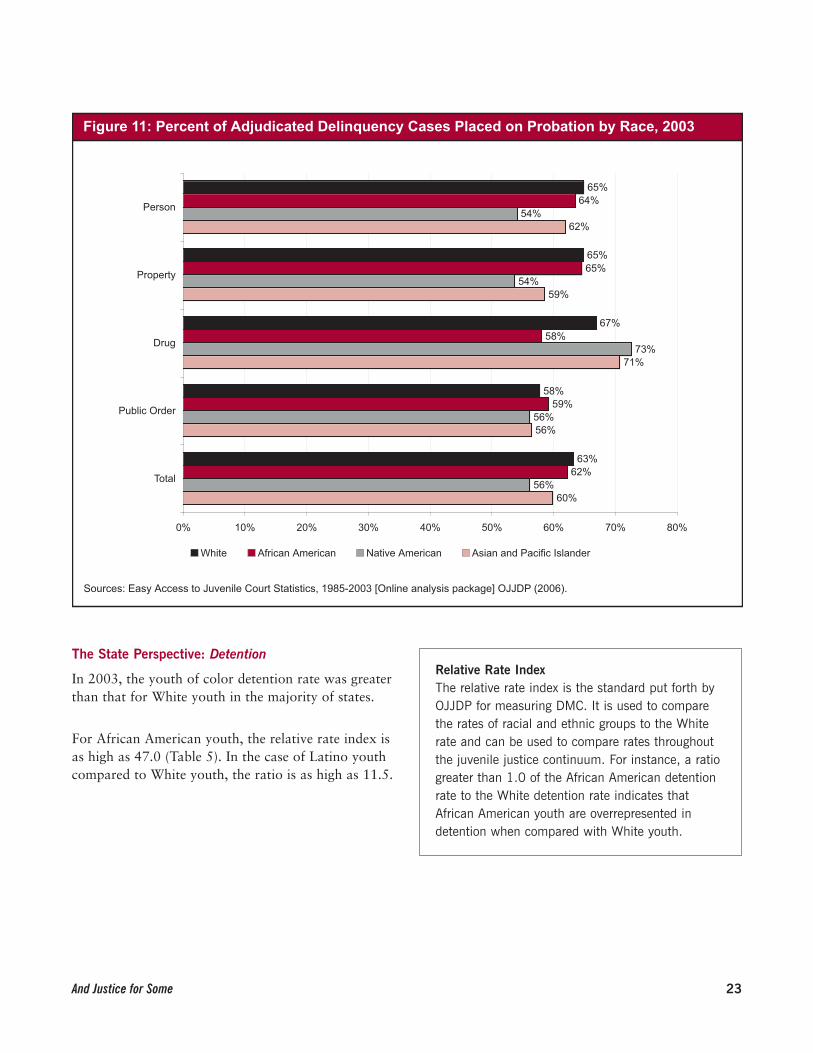
Adjudicated delinquency cases involving White juve-niles (63%) were generally more likely to result in for-mal probation than were cases involving eitherAfrican American youth (62%) or youth of otherraces (58%) in 2003 (Figure 11). The difference in the
likelihood of probation was most pronounced amongadjudicated drug offense cases. In 2003, 67% of adju-dicated drug offense cases involving White youthresulted in probation compared to 58% of casesinvolving African American youth.
And Justice for Some 23
Figure 11: Percent of Adjudicated Delinquency Cases Placed on Probation by Race, 2003
Sources: Easy Access to Juvenile Court Statistics, 1985-2003 [Online analysis package] OJJDP (2006).
65%
65%
67%
58%
63%
64%
65%
58%
59%
62%
54%
54%
73%
56%
56%
62%
59%
71%
56%
60%
0% 10% 20% 30% 40% 50% 60% 70% 80%
Person
Property
Drug
Public Order
Total
White African American Native American Asian and Pacific Islander
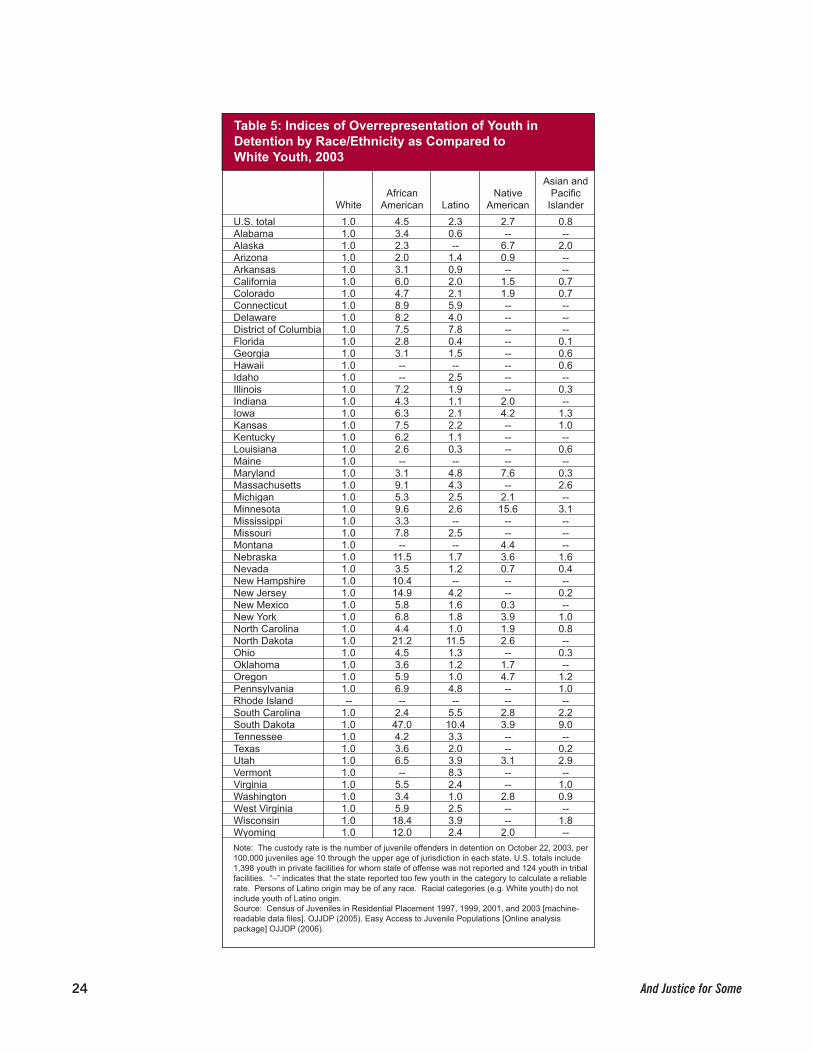
The State Perspective: Detention
In 2003, the youth of color detention rate was greaterthan that for White youth in the majority of states.
For African American youth, the relative rate index isas high as 47.0 (Table 5). In the case of Latino youthcompared to White youth, the ratio is as high as 11.5.
Relative Rate IndexThe relative rate index is the standard put forth byOJJDP for measuring DMC. It is used to comparethe rates of racial and ethnic groups to the Whiterate and can be used to compare rates throughoutthe juvenile justice continuum. For instance, a ratiogreater than 1.0 of the African American detentionrate to the White detention rate indicates thatAfrican American youth are overrepresented indetention when compared with White youth.
24 And Justice for Some
WhiteAfrican
American LatinoNative
American
Asian and Pacific
Islander
U.S. total 1.0 4.5 2.3 2.7 0.8Alabama 1.0 3.4 0.6 -- --Alaska 1.0 2.3 -- 6.7 2.0Arizona 1.0 2.0 1.4 0.9 --Arkansas 1.0 3.1 0.9 -- --California 1.0 6.0 2.0 1.5 0.7Colorado 1.0 4.7 2.1 1.9 0.7Connecticut 1.0 8.9 5.9 -- --Delaware 1.0 8.2 4.0 -- --District of Columbia 1.0 7.5 7.8 -- --Florida 1.0 2.8 0.4 -- 0.1Georgia 1.0 3.1 1.5 -- 0.6Hawaii 1.0 -- -- -- 0.6Idaho 1.0 -- 2.5 -- --Illinois 1.0 7.2 1.9 -- 0.3Indiana 1.0 4.3 1.1 2.0 --Iowa 1.0 6.3 2.1 4.2 1.3Kansas 1.0 7.5 2.2 -- 1.0Kentucky 1.0 6.2 1.1 -- --Louisiana 1.0 2.6 0.3 -- 0.6Maine 1.0 -- -- -- --Maryland 1.0 3.1 4.8 7.6 0.3Massachusetts 1.0 9.1 4.3 -- 2.6Michigan 1.0 5.3 2.5 2.1 --Minnesota 1.0 9.6 2.6 15.6 3.1Mississippi 1.0 3.3 -- -- --Missouri 1.0 7.8 2.5 -- --Montana 1.0 -- -- 4.4 --Nebraska 1.0 11.5 1.7 3.6 1.6Nevada 1.0 3.5 1.2 0.7 0.4New Hampshire 1.0 10.4 -- -- --New Jersey 1.0 14.9 4.2 -- 0.2New Mexico 1.0 5.8 1.6 0.3 --New York 1.0 6.8 1.8 3.9 1.0North Carolina 1.0 4.4 1.0 1.9 0.8North Dakota 1.0 21.2 11.5 2.6 --Ohio 1.0 4.5 1.3 -- 0.3Oklahoma 1.0 3.6 1.2 1.7 --Oregon 1.0 5.9 1.0 4.7 1.2Pennsylvania 1.0 6.9 4.8 -- 1.0Rhode Island -- -- -- -- --South Carolina 1.0 2.4 5.5 2.8 2.2South Dakota 1.0 47.0 10.4 3.9 9.0Tennessee 1.0 4.2 3.3 -- --Texas 1.0 3.6 2.0 -- 0.2Utah 1.0 6.5 3.9 3.1 2.9Vermont 1.0 -- 8.3 -- --Virginia 1.0 5.5 2.4 -- 1.0Washington 1.0 3.4 1.0 2.8 0.9West Virginia 1.0 5.9 2.5 -- --Wisconsin 1.0 18.4 3.9 -- 1.8Wyoming 1.0 12.0 2.4 2.0 --
Table 5: Indices of Overrepresentation of Youth in Detention by Race/Ethnicity as Compared to White Youth, 2003
Note: The custody rate is the number of juvenile offenders in detention on October 22, 2003, per 100,000 juveniles age 10 through the upper age of jurisdiction in each state. U.S. totals include 1,398 youth in private facilities for whom state of offense was not reported and 124 youth in tribal facilities. “–” indicates that the state reported too few youth in the category to calculate a reliable rate. Persons of Latino origin may be of any race. Racial categories (e.g. White youth) do not include youth of Latino origin.Source: Census of Juveniles in Residential Placement 1997, 1999, 2001, and 2003 [machine-readable data files]. OJJDP (2005). Easy Access to Juvenile Populations [Online analysis package] OJJDP (2006).

And Justice for Some 25
The National Perspective
According to the Census of Juveniles in ResidentialPlacement, as of October 22, 2003, there were 96,655youth in juvenile facilities prior to adjudication orcommitted to state juvenile correctional facilities fol-lowing adjudication. In 2003, White youth represent-ed 62% of youth in the general population, compared
to 39% of youth in the detained population. In con-trast, African American youth represented 16% ofyouth in the population, and 38% of youth in resi-dential placement. African American, Latino, andNative American youth all had higher residential custody rates than White youth in 2003 (Figure 12).
INCARCERATION IN JUVENILE CORRECTIONS
Figure 12: U.S. Residential Custody Rates by Sex and Race/Ethnicity, 2003
Sources: Easy Access to Juvenile Court Statistics, 1985-2003 [Online analysis package] OJJDP (2006).
Custody rate (per 100,000)
600
83
774
209190
32
305
68
1278
214
0
200
400
600
800
1000
1200
1400
1600
Male Female
White African American Latino Native American Asian and Pacific Islander
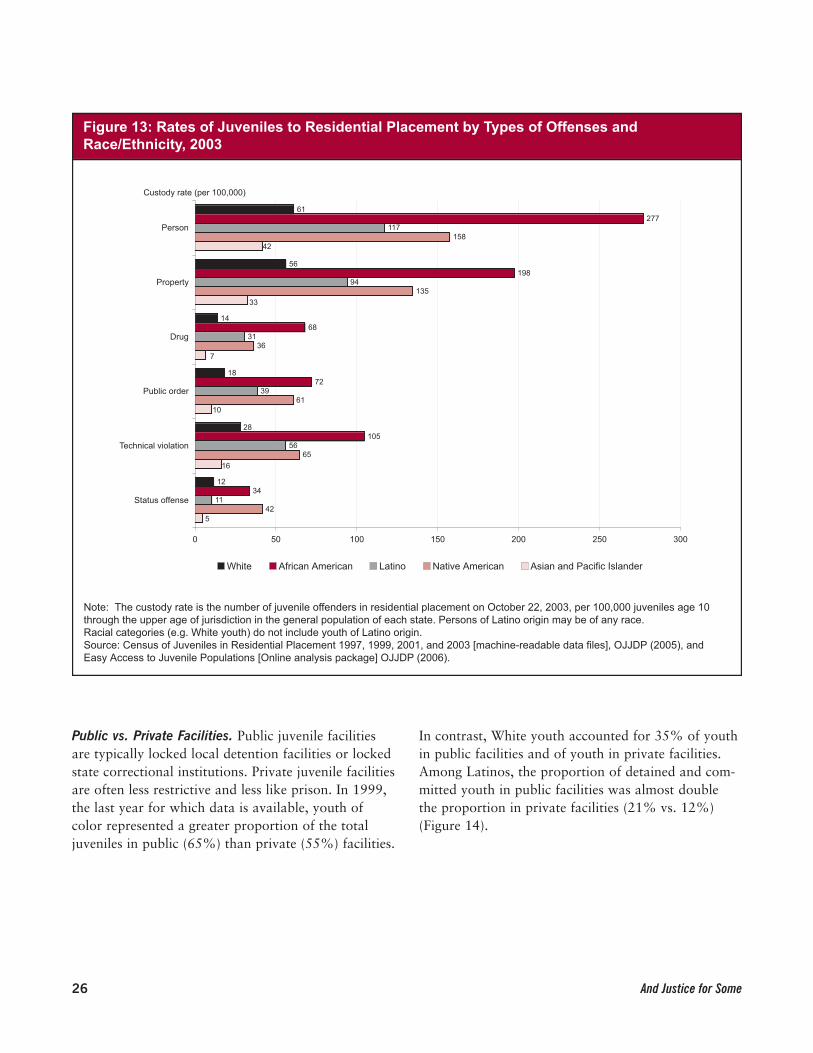
The rates for African American, Latino, and NativeAmerican youth remained higher than those for White youth in custody when offense type was
taken into account, with the exception of Latinos instatus offense (Figure 13).
26 And Justice for Some
Figure 13: Rates of Juveniles to Residential Placement by Types of Offenses and Race/Ethnicity, 2003
Custody rate (per 100,000)
61
56
14
18
28
12
277
198
68
72
105
34
117
94
31
39
56
11
158
135
36
61
65
425
16
10
7
33
42
0 50 100 150 200 250 300
Person
Property
Drug
Public order
Technical violation
Status offense
White African American Latino Native American Asian and Pacific Islander
Note: The custody rate is the number of juvenile offenders in residential placement on October 22, 2003, per 100,000 juveniles age 10 through the upper age of jurisdiction in the general population of each state. Persons of Latino origin may be of any race. Racial categories (e.g. White youth) do not include youth of Latino origin. Source: Census of Juveniles in Residential Placement 1997, 1999, 2001, and 2003 [machine-readable data files], OJJDP (2005), and Easy Access to Juvenile Populations [Online analysis package] OJJDP (2006).
Public vs. Private Facilities. Public juvenile facilitiesare typically locked local detention facilities or lockedstate correctional institutions. Private juvenile facilitiesare often less restrictive and less like prison. In 1999,the last year for which data is available, youth ofcolor represented a greater proportion of the totaljuveniles in public (65%) than private (55%) facilities.
In contrast, White youth accounted for 35% of youthin public facilities and of youth in private facilities.Among Latinos, the proportion of detained and com-mitted youth in public facilities was almost double the proportion in private facilities (21% vs. 12%)(Figure 14).

And Justice for Some 27
Figure 14: Racial Proportions of Juveniles in Public and Private Residential Placement, 1999
Note: Persons of Latino origin may be of any race. Racial categories (e.g. White youth) do not include youth of Latino origin.Source: Sickmund, M. Juveniles in Corrections. OJJDP (2004).
2%
21%
40%
35%
2%2%
12%
38%
45%
2%
0%
5%
10%
15%
20%
25%
30%
35%
40%
45%
50%
White African American Latino Native American Asian and PacificIslander
Public
Private
Incarceration Characteristics. A 1995 study by theNational Council on Crime and Delinquency foundthat admission rates to state public facilities weremuch higher for African American youth and Latinoyouth with no prior admissions than for comparableWhite youth (Krisberg, DeComo, Rudenstine, & Del Rosario, 1995). This was also true for youth with one or two prior admissions, in all offense categories. The data required to update this study are not avail-able. Overall, the admissions rate to state public
facilities for youth with no prior admissions was sixtimes higher for African American than White youth(373 and 59) and 3 times higher among Latino thanWhite youth (166 and 59) in 1993 (Figure 15).Among youth with one or two prior admissions, theoverall admissions rate for African American youthexceeded the White rate by a factor of 7 (96 and 14)and the admissions rate for Latino youth was twicethe rate of White youth (28 and 14).

28 And Justice for Some
Youth With No Prior Admissions
15
32
1
8
59
137
119
48
57
373
62
13
11
166
36
31
2
9
80
78
0 50 100 150 200 250 300 350 400
Person
Property
Drug
Public Order
Total
Rate (per 100,000)
Youth With One or Two Prior Admissions
3
8
0
2
14
21
39
14
17
96
15
2
4
28
4
10
0
3
19
7
0 20 40 60 80 100 120
Person
Property
Drug
Public Order
Total
Rate (per 100,000)
Figure 15: 1993 Admission Rates of Juveniles to State Public Facilities
White African American Latino Other
White African American Latino Other
Note: Rates are calculated per 100,000 youth age 10 to the upper age of juvenile court jurisdiction in the general population of each state. States include AK, AZ, AR, CA, DE, GA, ID, IL, IL, IN, IA, KY, LA, ME, MD, MA, MN, MS, MO, NE, NH, NJ, NY, ND, OH, OK, OR, SC, SD, TN, TX, UT, VT, VA, WV, WI. Persons of Latino origin may be of any race. Racial categories (e.g. White youth) do not include youth of Latino origin.Source: The Juveniles Taken Into Custody Research Program (1995). OJJDP.

And Justice for Some 29
In 1993, Latino youth were in custody on average112 days more than White youth. African Americanyouth were in custody on average 61 days more thanWhite youth. While the average lengths of stay inpublic facilities were higher for youth of color thanWhite youth across all offenses, it was particularly
dramatic for drug offenses. On average, the length ofstay for Latino youth admitted for a drug offense wasdouble the length of stay of White youth (306 daysvs. 144 days) (Figure 16). Similarly, African Americanyouth admitted for a drug offense were held longerthan White youth, on average 235 days vs. 144.
Figure 16: 1993 Youth Mean Lengths of Stay in State Public Facilities
Note: States include AK, AZ, AR, CA, DE, GA, ID, IL, IL, IN, IA, KY, LA, ME, MD, MA, MN, MS, MO, NE, NH, NJ, NY, ND, OH, OK, OR, SC, SD, TN, TX, UT, VT, VA, WV, WI. Total contains offenses not shown. Persons of Latino origin may be of any race. Racial categories (e.g. White youth) do not include youth of Latino origin. Source: The Juveniles Taken Into Custody Research Program (1995). OJJDP.
Rate (per 100,000)
277
177
144
147
193
362
200
235
181
254
222
306
220
305
360
215
266
200
260
420
0 50 100 150 200 250 300 350 400 450
Violent
Property
Drug
Public Order
Total
White African American Latino Other
In addition, the range in the length of stay above themedian was also greater for non-Whites than Whites(Krisberg, DeComo, Rudenstine, & Del Rosario,1995). For example, among the top 25th percentile ofcases involving a violent offense and no prior admis-sions, the length of stay for Latino youth ranged from
625 to over 1,400 days compared to between 400 and 900 days for White youth. Among the top 25th percentile of cases involving a drug offense and noprior admissions, the length of stay for Latino youthwas between 500 and 1,100 days compared tobetween 200 and 400 days for White youth.
30 And Justice for Some
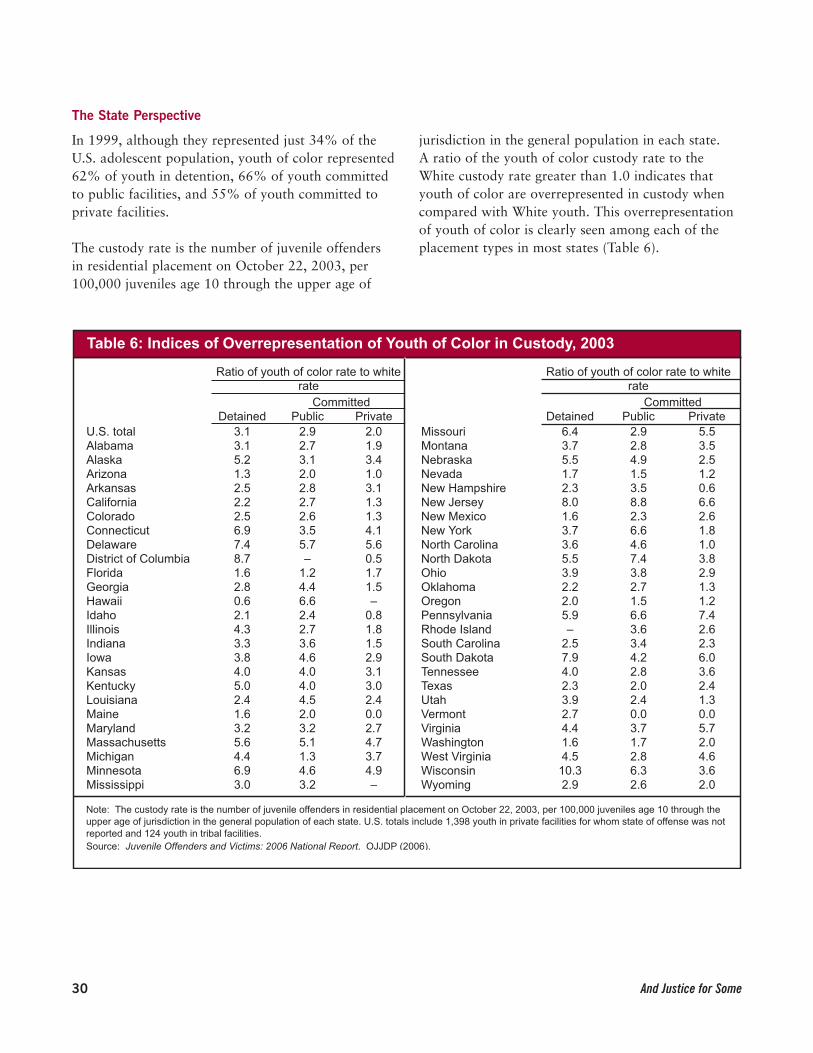
The State Perspective
In 1999, although they represented just 34% of theU.S. adolescent population, youth of color represented62% of youth in detention, 66% of youth committedto public facilities, and 55% of youth committed toprivate facilities.
The custody rate is the number of juvenile offendersin residential placement on October 22, 2003, per100,000 juveniles age 10 through the upper age of
jurisdiction in the general population in each state. A ratio of the youth of color custody rate to theWhite custody rate greater than 1.0 indicates thatyouth of color are overrepresented in custody whencompared with White youth. This overrepresentationof youth of color is clearly seen among each of theplacement types in most states (Table 6).
Detained Public Private Detained Public PrivateU.S. total 3.1 2.9 2.0 Missouri 6.4 2.9 5.5Alabama 3.1 2.7 1.9 Montana 3.7 2.8 3.5Alaska 5.2 3.1 3.4 Nebraska 5.5 4.9 2.5Arizona 1.3 2.0 1.0 Nevada 1.7 1.5 1.2Arkansas 2.5 2.8 3.1 New Hampshire 2.3 3.5 0.6California 2.2 2.7 1.3 New Jersey 8.0 8.8 6.6Colorado 2.5 2.6 1.3 New Mexico 1.6 2.3 2.6Connecticut 6.9 3.5 4.1 New York 3.7 6.6 1.8Delaware 7.4 5.7 5.6 North Carolina 3.6 4.6 1.0District of Columbia 8.7 – 0.5 North Dakota 5.5 7.4 3.8Florida 1.6 1.2 1.7 Ohio 3.9 3.8 2.9Georgia 2.8 4.4 1.5 Oklahoma 2.2 2.7 1.3Hawaii 0.6 6.6 – Oregon 2.0 1.5 1.2Idaho 2.1 2.4 0.8 Pennsylvania 5.9 6.6 7.4Illinois 4.3 2.7 1.8 Rhode Island – 3.6 2.6Indiana 3.3 3.6 1.5 South Carolina 2.5 3.4 2.3Iowa 3.8 4.6 2.9 South Dakota 7.9 4.2 6.0Kansas 4.0 4.0 3.1 Tennessee 4.0 2.8 3.6Kentucky 5.0 4.0 3.0 Texas 2.3 2.0 2.4Louisiana 2.4 4.5 2.4 Utah 3.9 2.4 1.3Maine 1.6 2.0 0.0 Vermont 2.7 0.0 0.0Maryland 3.2 3.2 2.7 Virginia 4.4 3.7 5.7Massachusetts 5.6 5.1 4.7 Washington 1.6 1.7 2.0Michigan 4.4 1.3 3.7 West Virginia 4.5 2.8 4.6Minnesota 6.9 4.6 4.9 Wisconsin 10.3 6.3 3.6Mississippi 3.0 3.2 – Wyoming 2.9 2.6 2.0
Note: The custody rate is the number of juvenile offenders in residential placement on October 22, 2003, per 100,000 juveniles age 10 through the upper age of jurisdiction in the general population of each state. U.S. totals include 1,398 youth in private facilities for whom state of offense was not reported and 124 youth in tribal facilities.Source: Juvenile Offenders and Victims: 2006 National Report. OJJDP (2006).
Table 6: Indices of Overrepresentation of Youth of Color in Custody, 2003
Ratio of youth of color rate to white rate
Ratio of youth of color rate to white rate
Committed Committed

And Justice for Some 31
Ratios for detained placements of over 5.0 werefound in Alaska, Connecticut, Delaware, District of Columbia, Kentucky, Massachusetts, Minnesota,Missouri, Nebraska, New Jersey, North Dakota,Pennsylvania, South Dakota, and Wisconsin. Ratiosfor public commitments of over 5.0 were found inDelaware, Hawaii, Massachusetts, New Jersey, New York, North Dakota, Pennsylvania, andWisconsin. For private commitments, ratios of over 5.0 were found in Delaware, New Jersey,Pennsylvania, South Dakota, and Virginia.
Among states with the highest number of Latinoyouth in the general population—Arizona, California,New Mexico, and Texas—youth of color were over-represented in both detained and committed popula-tions (Figure 17). The youth of color to White youthratio for detained youth in custody ranged from 1.3to 2.3, while commitments to public facilities rangedfrom 2.0 to 2.7.
Figure 17: Indices of Overrepresentation of Youth of Color in Custody in Arizona, California, New Mexico, and Texas, 2003
Ratio of the Youth of Color Custody Rate to the White Custody Rate
Note: In 2003, Latino youth represented 35% of youth ages 10-17 in Arizona, 43% in California, 50% in New Mexico, and 40% in Texas. The custody rate is the number of juvenile offenders in residential placement on October 22, 2003, per 100,000 juveniles age 10 through the upper age of jurisdiction in each state. Source: Adapted from Juvenile Offenders and Victims: 2006 National Report. OJJDP (2006).
2.3
1.6
2.2
1.3
2.0
2.3
2.7
2.0
0
0.5
1
1.5
2
2.5
3
Arizona California New Mexico Texas
Detained Commitment to Public Facility
32 And Justice for Some
State WhiteAfrican
American LatinoNative
American
Asian and Pacific
Islander
U.S. total 190 754 348 496 113Alabama 235 586 368 0 73Alaska 177 339 0 896 206Arizona 223 579 363 199 72Arkansas 142 468 200 0 108California 217 1,246 448 425 140Colorado 268 1,150 396 646 112Connecticut 105 669 316 672 36Delaware 128 1,029 413 0 0District of Columbia 347 683 698 0 0Florida 355 973 186 195 81Georgia 142 500 237 127 59Hawaii 62 199 44 0 111Idaho 250 725 463 747 328Illinois 120 589 144 113 14Indiana 316 1,188 381 417 0Iowa 242 1,337 520 1,025 117Kansas 213 1,320 364 318 187Kentucky 133 653 113 0 76Louisiana 202 663 151 269 90Maine 149 182 188 492 0Maryland 98 319 326 450 22Massachusetts 111 811 522 172 160Michigan 169 602 231 287 27Minnesota 156 1,149 400 1,712 280Mississippi 75 246 60 155 0Missouri 159 690 287 93 87Montana 188 418 482 588 0Nebraska 214 1,529 447 1,682 194Nevada 289 958 332 405 152New Hampshire 144 579 197 0 0New Jersey 51 795 203 153 15New Mexico 153 823 105 212 0New York 138 712 261 205 45North Carolina 106 332 77 195 45North Dakota 235 1,384 747 1,240 0Ohio 207 916 296 87 71Oklahoma 196 673 239 343 48Oregon 291 1,075 314 870 181Pennsylvania 139 1,207 639 246 329Rhode Island 192 1,425 188 735 409South Carolina 201 567 453 193 143South Dakota 310 3,199 1,449 1,575 873Tennessee 143 507 251 0 79Texas 194 771 327 139 18Utah 258 951 564 558 324Vermont 71 0 341 0 0Virginia 143 715 273 0 71Washington 200 770 207 607 155West Virginia 229 953 567 775 0Wisconsin 143 1,389 226 580 282Wyoming 507 3,035 947 1,285 0
Table 7: Residential Custody Rates by State and Race/Ethnicity, 2003
Custody rate (per 100,000)
Note: The custody rate is the number of juvenile offenders in residential placement on October 22, 2003, per 100,000 juveniles age 10 through the upper age of jurisdiction in the general population of each state. U.S. totals include 1,398 youth in private facilities for whom state of offense was not reported and 124 youth in tribal facilities. Persons of Latino origin may be of any race. Racial categories (e.g. White youth) do not include youth of Latino origin.Source: Census of Juveniles in Residential Placement 1997, 1999, 2001, and 2003 [machine- readable data files]. OJJDP (2005). Easy Access to Juvenile Populations [Online analysis package] OJJDP (2006).

And Justice for Some 33
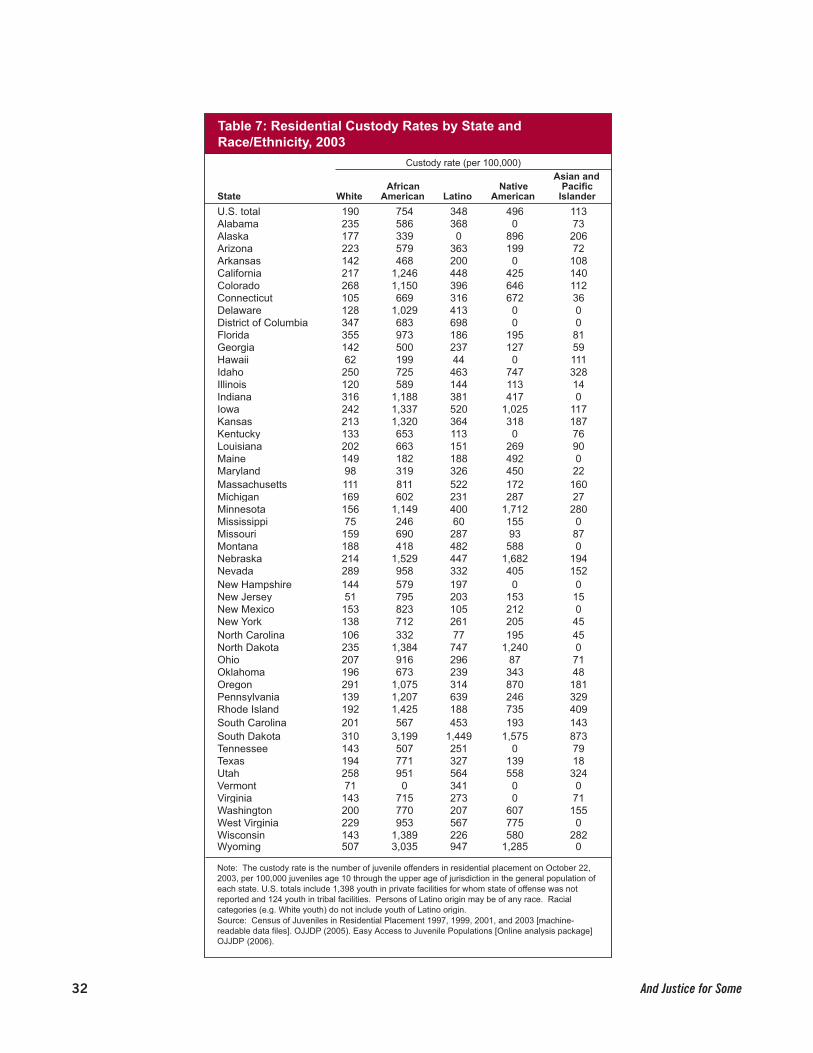
Across the nation, 190 White youth were in residen-tial placement on October 22, 2003, for every100,000 youth in the population compared to 754African American youth, 348 Latino youth, 496Native American youth, and 113 Asian and PacificIslander youth (Table 7).
The most notable differences between the custody rateof White youth and others is seen in New Jersey,where custody rates for youth of color are over 8times, and custody rates for African Americans areover 15 times, the rate for White youth. The custodyrates of African Americans in Wisconsin and SouthDakota are both about ten times that of White youth.
State All WhiteAfrican
American Latino OtherOhio 1.55 0.83 6.53 1.2 0.26Virginia 1.2 0.57 3.51 0.38 0.35Missouri 1.08 0.74 3.32 na 0.39Tennessee 1.07 0.7 2.6 na 0.24Wisconsin 1.07 0.46 7.66 2.78 2.86Louisiana 0.87 0.25 1.91 0 0.2North Dakota 0.85 0.64 2.13 4.1 3.44Texas 0.85 0.72 2.52 0.93 0.03Utah 0.79 0.73 8.32 2.4 1.03Iowa 0.73 0.62 4.54 1.85 1.17Illinois 0.67 0.37 2.04 0.81 0.06California 0.69 0.69 2.66 0.88 0.18New Jersey 0.69 0.23 2.98 0.86 0.12New York 0.69 0.35 2.2 1.18 0.11New Hampshire 0.65 0.62 4.91 2.41 0.44Massachusetts 0.56 0.28 2.73 1.68 1.95
Table 8: Likelihood of Commitment to State Public Facilities by Age 18
Note: Latino youth are also counted in the White and African American race groups in this analysis. The other race category is a composite of youth identified as Native American, Asian American, other, or unknown racial background.Source: The Juveniles Taken Into Custody Research Program: Estimating the Prevalence of Juvenile Custody Rates by Race and Gender. National Council on Crime and Delinquency (1993).
According to a 1993 study by the National Councilon Crime and Delinquency, in states for which datawas available, African American youth were almostalways more likely than White or Latino youth to betaken into state juvenile corrections custody by age 18 (Table 8). More specifically, the State JuvenileCorrections System Reporting Program (SJCSRP)identifies these prevalence rates as the estimated pro-portion of the at-risk population of youth who are
likely to be committed to the custody of state juvenilecorrections systems by age 18. Latino youth were gen-erally more likely than White youth to be taken intostate custody by age 18. Among reporting states,prevalence rates were estimated to be highest forAfrican American youth in Utah (8.32), Wisconsin(7.66), and Ohio (6.53). The data required to updatethis study are not available.

34 And Justice for Some
Legislative changes in the past twenty years haveenabled prosecutors and juvenile court judgesto send more youth into the adult criminal jus-
tice system or to automatically exclude youth chargedwith certain offenses from the jurisdiction of the juve-nile court. As a result, a significant number of youthare being sentenced to adult correctional facilities,such as state and federal prisons and county jails.While the “sight and sound separation” provisions ofthe Juvenile Justice and Delinquency Prevention Actprohibit youth under juvenile court jurisdiction frombeing within “sight or sound” of adult inmates, it doesnot cover youth under the jurisdiction of adult crimi-nal court. Therefore, youth prosecuted as adults canbe incarcerated with adult inmates in jails and prisons.
The National Perspective
Nearly three out of four youth admitted to adult stateprisons in 2002 were youth of color.
An estimated 4,100 youth under the age of 18 wereadmitted to the nation’s state prisons in 2002. Themajority (73%) of these new commitments wereyouth of color; 58% were African American, 10%were Latino, and 5% were youth of other races. Assuch, African American, Latino, and Native Americanyouth had significantly higher prison admissions ratesthan White youth (Figure 18).
INCARCERATION OF YOUTH IN ADULT CORRECTIONS
White African American Latino Native American Asian and Pacific Islander
Figure 18: Youth in Adult Prison: Rates of New Commitments to Prison by Sex and Race/Ethnicity, 2002
Note: Rates are calculated per 100,000 youth age 10 to 17 years of age in the general population. Persons of Latino origin may be of any race. Racial categories (e.g. White youth) do not include youth of Latino origin. Source: National Corrections Reporting Program, 2002. Bureau of Justice Statistics. Easy Access to Juvenile Populations [Online analysis package] OJJDP (2006).
Custody rate (per 100,000)
14
1
13
25
0
9
1
84
3
0
10
20
30
40
50
60
70
80
90
100
Male Female
And Justice for Some 35
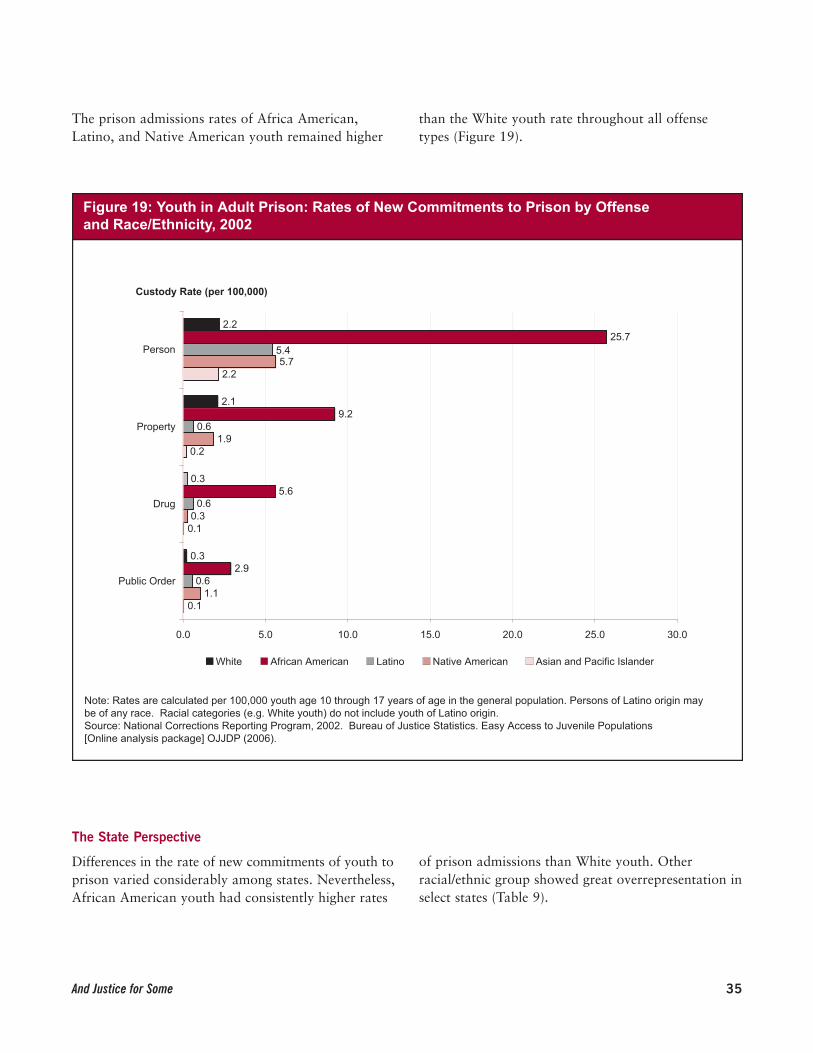
The prison admissions rates of Africa American,Latino, and Native American youth remained higher
than the White youth rate throughout all offensetypes (Figure 19).
Figure 19: Youth in Adult Prison: Rates of New Commitments to Prison by Offense and Race/Ethnicity, 2002
Note: Rates are calculated per 100,000 youth age 10 through 17 years of age in the general population. Persons of Latino origin may be of any race. Racial categories (e.g. White youth) do not include youth of Latino origin. Source: National Corrections Reporting Program, 2002. Bureau of Justice Statistics. Easy Access to Juvenile Populations [Online analysis package] OJJDP (2006).
Custody Rate (per 100,000)
2.2
2.1
0.3
0.3
25.7
9.2
5.6
2.9
0.6
0.6
0.6
5.7
1.9
0.3
1.1
2.2
0.2
0.1
0.1
5.4
0.0 5.0 10.0 15.0 20.0 25.0 30.0
Person
Property
Drug
Public Order
White African American Latino Native American Asian and Pacific Islander
The State Perspective
Differences in the rate of new commitments of youth toprison varied considerably among states. Nevertheless,African American youth had consistently higher rates
of prison admissions than White youth. Otherracial/ethnic group showed great overrepresentation inselect states (Table 9).

36 And Justice for Some
WhiteAfrican
American LatinoNative
American
Asian and Pacific
Islander TotalUnited States 5 44.1 7.4 9.2 2.5 11.8Alabama 8.5 41.5 0 0 0 18.9Alaska 15.5 73 0 20 0 17.5Arizona 0 0 0 0 0 0Arkansas 11.4 59.9 0 0 0 20.8California 1.5 19.3 7.1 3.3 1.9 5.4California Youth Authority 0.4 6.4 2.1 0 1.5 1.7Colorado 3.6 46.1 17.6 21.3 7.9 9.1Connecticut 0 0 0 0 0 0Delaware 0 0 0 0 0 0District of Columbia 0 0 0 0 0 0Florida 8 67.6 8.6 0 0 20.9Georgia 7.6 32.5 10.8 37.2 0 16.7Hawaii 0 0 0 0 1.2 0.8Idaho 0 0 0 0 0 0Illinois 7.6 74.7 15.5 0 0 21.4Indiana 0 0 0 0 0 0Iowa 13 81 0 0 0 14.5Kansas 0 0 0 0 0 0Kentucky 0 2.3 0 0 0 0.2Louisiana 5.6 33.2 0 0 0 16.4Maine 0.7 0 0 0 0 0.7Maryland 3.6 53.7 0 0 0 20.1Massachusetts 0 0 0 0 0 0Michigan 6.7 46.8 5.8 0 4.2 13.8Minnesota 1.6 20.4 9 28.9 7.2 3.7Mississippi 18.1 59.6 19.4 0 0 36.5Missouri 14.5 40.3 11 0 0 18Montana 0 0 0 0 0 0Nebraska 5.2 49.7 12.9 75.5 0 9.2Nevada 6.4 8.5 22.7 0 0 10.6New Hampshire 2.1 0 28 0 0 2.7New Jersey 0.5 14.5 5.3 0 0 3.5New Mexico 0 0 0 0 0 0New York 2.2 41.2 13.4 0 0 11.7North Carolina 16.5 100.5 33.1 36 12.1 40.7North Dakota 0 0 0 16.7 0 1.4Ohio 4.9 42.1 3 0 0 10.7Oklahoma 4 14.5 6.7 8.3 0 5.7Oregon 16.3 142.6 11.3 26.8 14 19.2Pennsylvania 1 19.6 8.9 0 3.7 3.9Rhode Island 0 0 0 0 0 0South Carolina 30 100.7 33 0 0 56.4South Dakota 2.6 96.5 0 7.5 0 4.3Tennessee 2.7 17.3 0 0 0 5.8Texas 4.2 29.3 0 0 0 9.7Utah 3.4 0 0 0 0 2.9Vermont 0 0 0 0 0 0Virginia 1.3 25.6 6.7 0 0 7.5Washington 5.8 60.7 15 0 10.8 9.8West Virginia 0 0 0 0 0 0Wisconsin 8.1 154.6 50.8 109.6 16.4 24.4Wyoming 0 0 0 0 0 0
Table 9: Youth in Adult Prison: Rates of New Prison Commitments by State and Race/Ethnicity, 2002 (per 100,000 youth)
Note: Rates are calculated per 100,000 youth age 10 to 17 years of age in the general population. This table reflects the racial/ethnic proportions of youth in adult prisons when race/ethnicity is known. Data was missing for admissions in California (1%), Georgia (1%), Maryland (1%), New York (2%), and Ohio (3%). Persons of Latino origin may be of any race. Racial categories (e.g. White youth) do not include youth of Latino origin.Source: National Corrections Reporting Program, 2002. Bureau of Justice Statistics. Easy Access to Juvenile Populations [Online analysis package] OJJDP (2006).
And Justice for Some 37
Historically, the most punitive and restrictivesanction facing youth charged with a crimi-nal offense involved court-ordered place-
ment in a residential facility, particularly public train-ing schools. These facilities emphasized rehabilitativeprogramming. The recent past, however, has revealedgrowing movement away from the early juvenilecourt’s original goals of diversion and treatmenttowards punishment, accountability, and (presumed)public safety. In addition, state legislatures areincreasingly moving away from case-specific decisionsto transfer juveniles to criminal court in favor of
transfer decisions based on the offender’s age oroffense seriousness.
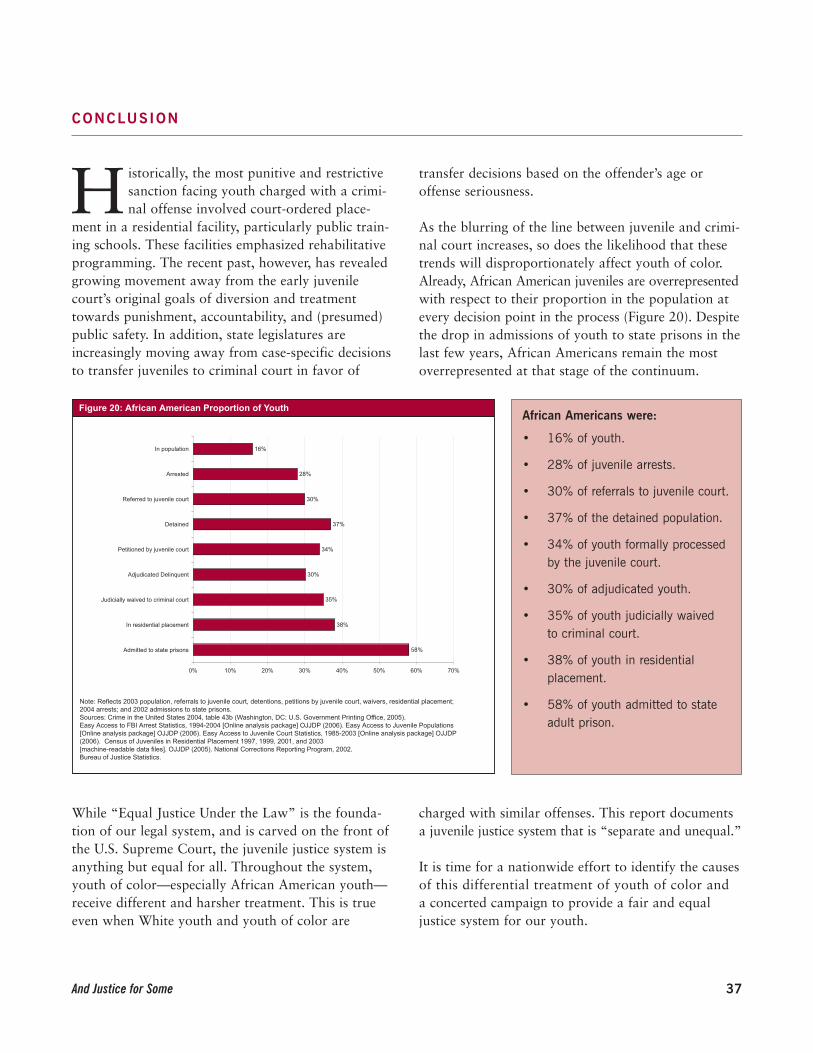
As the blurring of the line between juvenile and crimi-nal court increases, so does the likelihood that thesetrends will disproportionately affect youth of color.Already, African American juveniles are overrepresentedwith respect to their proportion in the population atevery decision point in the process (Figure 20). Despitethe drop in admissions of youth to state prisons in thelast few years, African Americans remain the mostoverrepresented at that stage of the continuum.
CONCLUSION
Figure 20: African American Proportion of Youth
16%
28%
30%
37%
34%
30%
35%
38%
58%
0% 10% 20% 30% 40% 50% 60% 70%
In population
Arrested
Referred to juvenile court
Detained
Petitioned by juvenile court
Adjudicated Delinquent
Judicially waived to criminal court
In residential placement
Admitted to state prisons
Note: Reflects 2003 population, referrals to juvenile court, detentions, petitions by juvenile court, waivers, residential placement; 2004 arrests; and 2002 admissions to state prisons.Sources: Crime in the United States 2004, table 43b (Washington, DC: U.S. Government Printing Office, 2005). Easy Access to FBI Arrest Statistics, 1994-2004 [Online analysis package] OJJDP (2006). Easy Access to Juvenile Populations [Online analysis package] OJJDP (2006). Easy Access to Juvenile Court Statistics, 1985-2003 [Online analysis package] OJJDP (2006). Census of Juveniles in Residential Placement 1997, 1999, 2001, and 2003 [machine-readable data files]. OJJDP (2005). National Corrections Reporting Program, 2002. Bureau of Justice Statistics.
While “Equal Justice Under the Law” is the founda-tion of our legal system, and is carved on the front ofthe U.S. Supreme Court, the juvenile justice system isanything but equal for all. Throughout the system,youth of color—especially African American youth—receive different and harsher treatment. This is trueeven when White youth and youth of color are
charged with similar offenses. This report documentsa juvenile justice system that is “separate and unequal.”
It is time for a nationwide effort to identify the causesof this differential treatment of youth of color and a concerted campaign to provide a fair and equal justice system for our youth.
African Americans were:
• 16% of youth.
• 28% of juvenile arrests.
• 30% of referrals to juvenile court.
• 37% of the detained population.
• 34% of youth formally processed by the juvenile court.
• 30% of adjudicated youth.
• 35% of youth judicially waived to criminal court.
• 38% of youth in residential placement.
• 58% of youth admitted to state adult prison.
38 And Justice for Some
Census of Juveniles in Residential Placement, 1997-2003 (see Sickmund, Sladky, & Kang, 2005).
Crime in the United States 2004 (see U.S. Dept. of Justice,2006a).
DeComo, R. (1993). The juveniles taken into custody researchprogram: Estimating the prevalence of juvenile custody rates by race and gender. NCCD Focus. San Francisco, CA: NationalCouncil on Crime and Delinquency.
Easy Access to FBI Arrest Statistics, 1994-2004 (see Puzzanchera, Adams, Snyder, & Kang, 2006).
Easy Access to Juvenile Court Statistics, 1985-2003 (see Stahl, Finnegan, & Kang, 2006).
Easy Access to Juvenile Populations. (see Puzzanchera,Finnegan, & Kang, 2006).
Hamparian, D., & Leiber, M. (1997). Disproportionate con-finement of minority juveniles in secure facilities: 1996 nationalreport. Champaign, IL: Community Research Associates.
Hsia, H.M., Bridges, G.S., & McHale, R. (2004).Disproportionate minority confinement: Year 2002 update.Washington, DC: Office of Juvenile Justice and DelinquencyPrevention. Last accessed October 24, 2006 athttp://www.ncjrs.gov/pdffiles1/ojjdp/201240.pdf.
Juvenile Offenders and Victims: 2006 National Report (see Snyder & Sickmund, 2006).
The Juveniles Taken Into Custody Research Program, 1993 (see DeComo, 1993).
The Juveniles Taken Into Custody Research Program, 1995 (see Krisberg, DeComo, Rudenstine, & Del Rosario, 1995).
Krisberg, B., DeComo, R., Rudenstine, S., & Del Rosario, D.(1995). Juveniles taken into custody research program: FY1994 annual report. Washington, DC: Office of Juvenile Justiceand Delinquency Prevention.
National Corrections Reporting Program, 2002 (see U.S. Dept.of Justice, 2006b).
Poe-Yamagata, E., & M.A. Jones. (2000). And justice for some:Differential treatment of minority youth in the justice system.Washington, DC: Building Blocks for Youth.
Pope, C.E., Lovell, R., & Hsia, H.M. (2002). DisproportionateMinority Confinement: A Review of the research literaturefrom 1989 through 2001. Washington, DC: Office of JuvenileJustice and Delinquency Prevention. Last accessed October 24,2006 at http://ojjdp.ncjrs.org/dmc/pdf/dmc89_01.pdf
Puzzanchera, C., Adams, B., Snyder, H., & Kang, W. (2006).Easy access to FBI arrest statistics 1994-2004. Pittsburgh, PA:National Center for Juvenile Justice. Online. Available:http://ojjdp.ncjrs.gov/ojstatbb/ezaucr/
Puzzanchera, C., Finnegan, T. & Kang, W. (2006). Easy access to juvenile populations. Pittsburgh, PA: NationalCenter for Juvenile Justice.Online. Available: http://www.ojjdp.ncjrs.org/ojstatbb/ezapop/
Sickmund, M. (2004). Juveniles in corrections. Washington,DC: Office of Juvenile Justice and Delinquency Prevention.
Short, J., & Sharp, C. (2005). Disproportionate minority contact in the juvenile justice system. Child Welfare League ofAmerica: Washington, DC. Available: http://www.cwla.org/programs/juvenilejustice/disproportionate.pdf
Sickmund, M., Sladky, T.J., & Kang, W. (2005) Census of juveniles in residential placement databook. Pittsburgh, PA:National Center for Juvenile Justice. Online. Available:http://www.ojjdp.ncjrs.org/ojstatbb/cjrp/
Snyder, H.& Sickmund, M. (1999). Juvenile offenders and vic-tims: 1999 national report. Washington, DC: Office of JuvenileJustice and Delinquency Prevention.
Snyder, H.N. & Sickmund, M. (2006). Juvenile offenders andvictims: 2006 national report. Office of Juvenile Justice andDelinquency Prevention. Washington, D.C. Last accessedOctober 24, 2006 athttp://www.ojjdp.ncjrs.gov/ojstatbb/nr2006/downloads/NR2006.pdf.
Stahl, A., Finnegan, T., & Kang, W. (2006). Easy access tojuvenile court statistics: 1985-2003. National Center forJuvenile Justice. Pittsburgh, PA. Online. Available:http://ojjdp.ncjrs.gov/ojstatbb/ezajcs/
Strom, Kevin J. (2000). Profile of state prisoners under age 18,1985-1997. Washington, DC: US Department of Justice,Bureau of Justice Statistics.
U.S. Dept. of Justice, Bureau of Justice Statistics. (2006a). Crime in the United States, 2004. Washington, DC.
U.S. Dept. of Justice, Bureau of Justice Statistics. (2006b).National corrections reporting program, 2002: [Computer file].Conducted by U.S. Dept. of Commerce, Bureau of the Census.ICPSR04345-v1. Ann Arbor, MI: Inter-university Consortiumfor Political and Social Research [producer and distributor].
REFERENCES

NATIONAL COUNCIL ON CRIME AND DELINQUENCY
1970 Broadway, Suite 500Oakland, CA 94612
510/208-0500nccd-crc.org