and, now take you into a world of……………... portfolio ……??? …… a set of securities...
TRANSCRIPT

And, now take you into a WORLD of……………..


PORTFOLIO ……???
•…… …… A set of securities A set of securities
combined in some proportioncombined in some proportion
is called portfolio.is called portfolio.

Revisiting basic issues of…
PORTFOLIO THEORY…
Basic Assumption of the Portfolio Theory…
• Portfolio reduces risk through diversification
where diversification is understood as
a process of accumulating various
securities to reduce the risk.
BASIC OBJECTIVEOBJECTIVE BEHIND EVERY PORTFOLIO IS…...
to improve upon
the RISK - RISK -
RETURN profileRETURN profile of
one’s investment.
• What should be the security set from which
securities are to be selected?
• In what proportion the securities are to be
combined?
• How to evaluate a portfolio?
• How to select the optimum portfolio?
BASIC ISSUES IN CONSTRUCTION OF A PORTFOLIO

Our efforts to resolve these Our efforts to resolve these issues about portfolio takes us issues about portfolio takes us to the portfolio theories……to the portfolio theories……

THE VERY FIRST SCIENTIFIC ATTEMPT TO ANSWER THESE QUESTIONS WAS MADE BY
HARRY MARKOWITZ
and
Therefore, we start our Portfolio Theory with
MARKOWITZ MODEL...
MARKOWITZ MODEL• Markowitz is called father of Modern Portfolio Markowitz is called father of Modern Portfolio
Theory.Theory.
• He gave for the very first time a quantitative He gave for the very first time a quantitative measurement of risk and return of a security measurement of risk and return of a security as well as of a portfolio.as well as of a portfolio.
• He also suggested a methodology for He also suggested a methodology for constructing an optimum portfolio.constructing an optimum portfolio.
• He changed the whole character and the He changed the whole character and the nature of the theory of Finance.nature of the theory of Finance.

•Markowitz said that since a security
is evaluated in terms of Risk and
Return parameters, a portfolio should
also be evaluated in terms of Risk and
Return.

Return and Risk of a Portfolio
j i
),()(
)()(
n
i
n
i
n
jjijiiiP
n
iiiP
RRCovR
RERE
1 1 1
22
1
Where
E(RP) = Expected Return of the Portfolio
(RP) = Standard Deviation of return on a portfolio
= Proportion of ith security in the portfolio
i2 = Variance of ith security
E(Ri) = Return on ith security
Cov(Ri,Rj) = Covariance between the return of ith security and the
return of the jth security

Portfolio DIVERSIFY AWAY Risk ………????!!!!!• Markowitz questioned NAÏVE
DIVERSIFICATION - a diversification that is obtained by just adding a number of different securities into a portfolio.
• Can we really conclude that adding too many securities simply into a portfolio reduce risk?
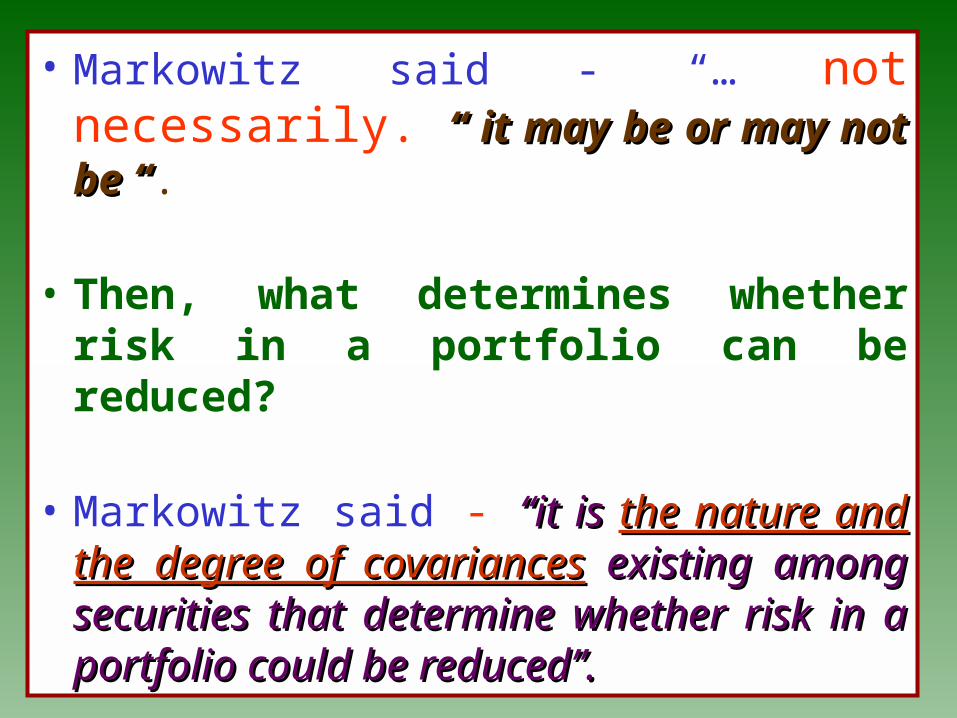
• Markowitz said - “… not necessarily. “ it may be or may not be ““ it may be or may not be “.
• Then, what determines whether risk in a portfolio can be reduced?
• Markowitz said - “it is “it is the nature and the nature and the degree of covariancesthe degree of covariances existing existing among securities that determine among securities that determine whether risk in a portfolio could be whether risk in a portfolio could be reduced”.reduced”.

Diversification pays when the securities are having less degree of correlation and negative correlation.
Standard Deviation
Exp
ected R
eturn
r = 1
r = -1
Be clear about the diversification gains!!!
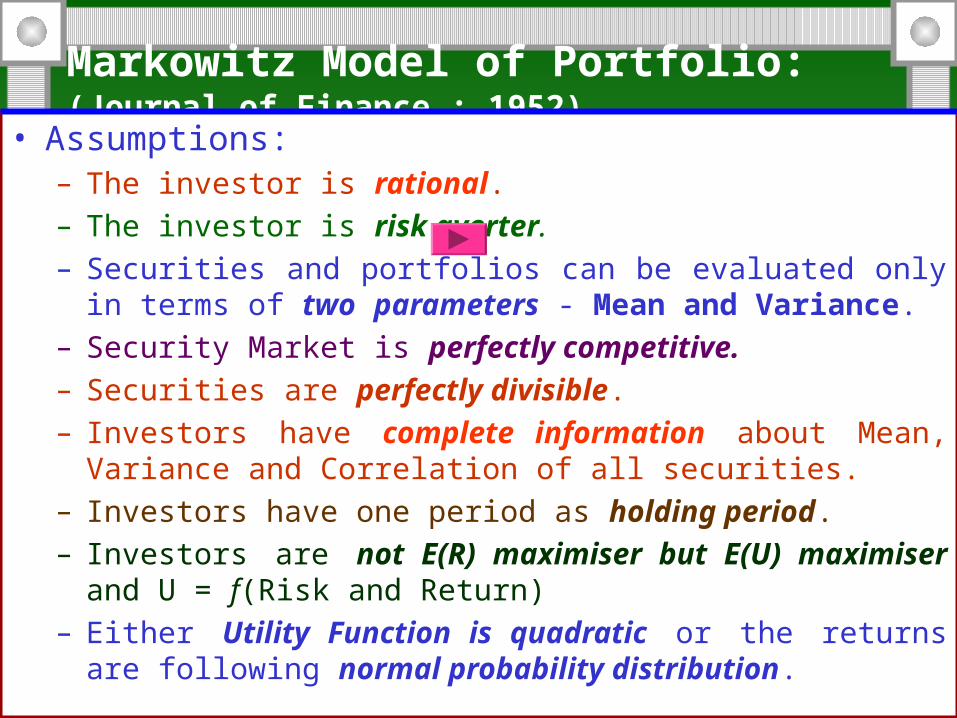
Markowitz Model of Portfolio: (Journal of Finance : 1952)
• Assumptions:– The investor is rational.– The investor is risk averter.– Securities and portfolios can be evaluated only in terms of two parameters -
Mean and Variance.– Security Market is perfectly competitive.– Securities are perfectly divisible.– Investors have complete information about Mean, Variance and Correlation
of all securities.– Investors have one period as holding period.– Investors are not E(R) maximiser but E(U) maximiser and U = f(Risk and
Return)– Either Utility Function is quadratic or the returns are following normal
probability distribution.
Are you searching for an OPTIMUM PORTFOLIO ……???
Are you searching for an OPTIMUM PORTFOLIO ……???
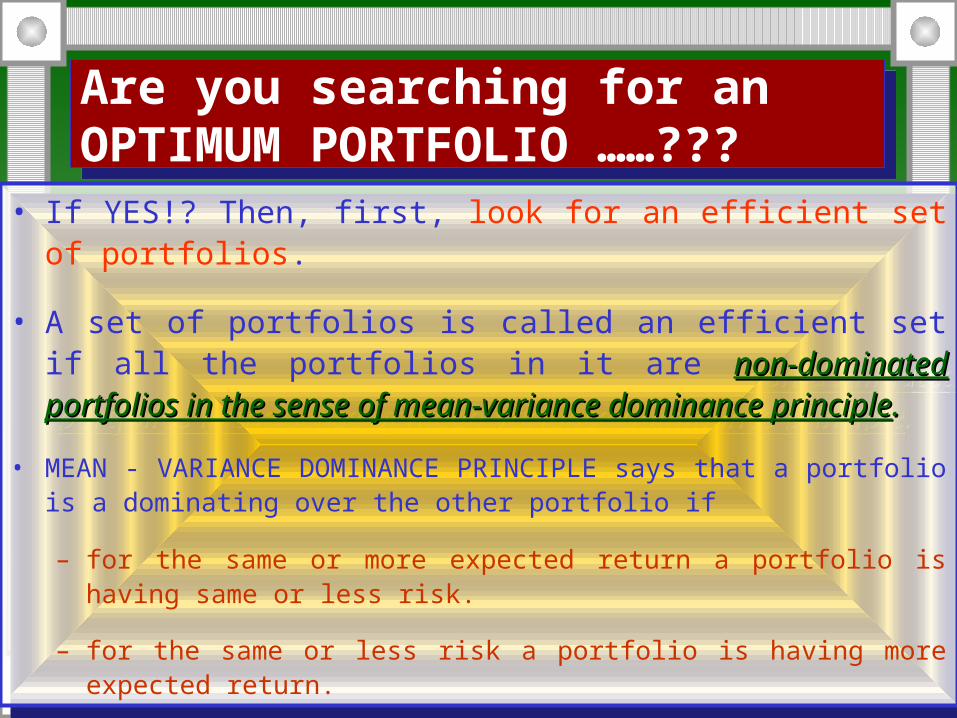
• If YES!? Then, first, look for an efficient set of portfolios.
• A set of portfolios is called an efficient set if all the portfolios in it are non-dominated portfolios in the sense non-dominated portfolios in the sense of mean-variance dominance principleof mean-variance dominance principle..
• MEAN - VARIANCE DOMINANCE PRINCIPLE says that a portfolio is a dominating over the other portfolio if
– for the same or more expected return a portfolio is having same or less risk.
– for the same or less risk a portfolio is having more expected return.
Can we have a zero risk portfolio???
Can we have a zero risk portfolio???
• Yes! We can have it if we can find
two securities having between
them perfectly negative
correlation.
• Yes! We can have it if we can find
two securities having between
them perfectly negative
correlation.
MINIMUM VARIANCE SET OF PORTFOLIOS?
MINIMUM VARIANCE SET OF PORTFOLIOS?
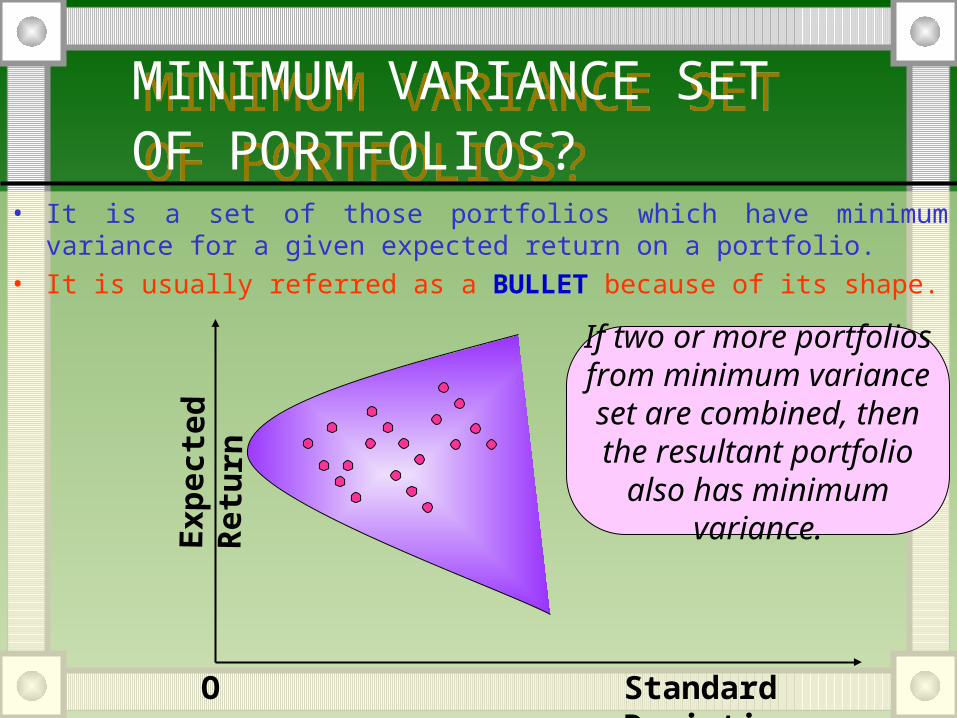
• It is a set of those portfolios which have minimum variance for a given expected return on a portfolio.
• It is usually referred as a BULLET because of its shape.
Standard Deviation
Exp
ecte
d R
etu
rn
O
If two or more portfolios from minimum variance
set are combined, then the resultant portfolio also has
minimum variance.
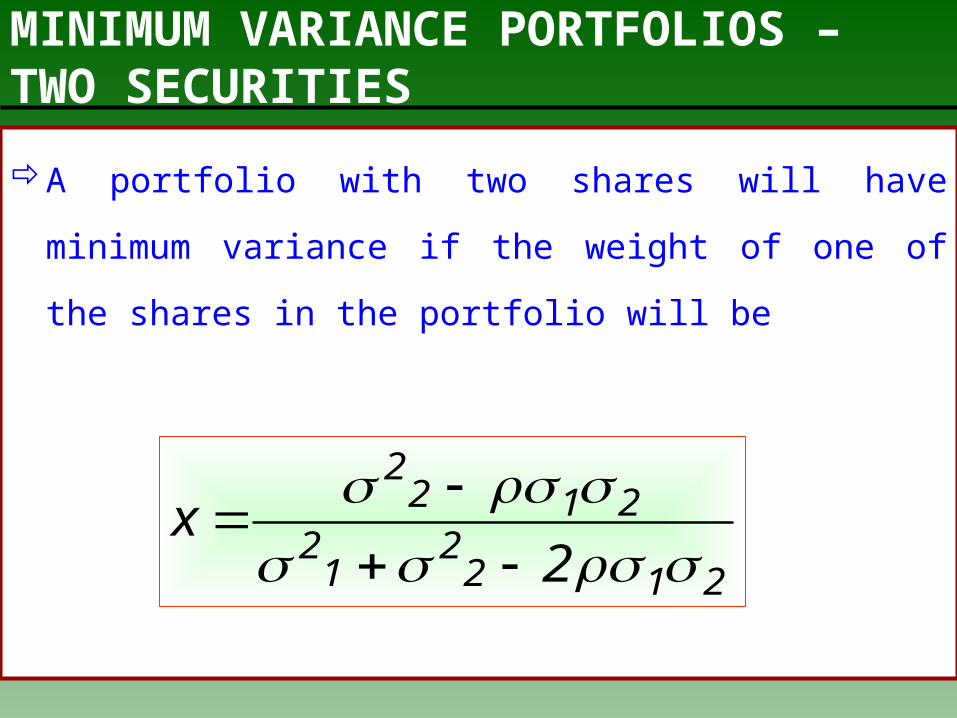
MINIMUM VARIANCE PORTFOLIOS – TWO SECURITIES
A portfolio with two shares will have minimum
variance if the weight of one of the shares in the
portfolio will be
2122
12
2122
2x
EFFICIENT FRONTIER ……???
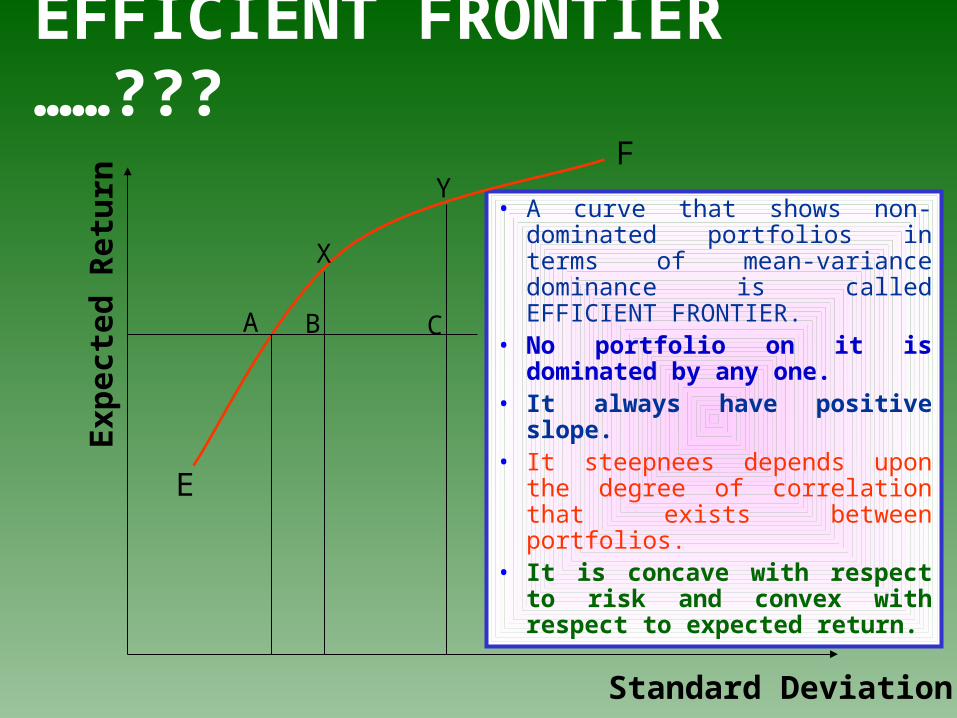
• A curve that shows non-dominated portfolios in terms of mean-variance dominance is called EFFICIENT FRONTIER.
• No portfolio on it is dominated by any one.
• It always have positive slope.• It steepnees depends upon the
degree of correlation that exists between portfolios.
• It is concave with respect to risk and convex with respect to expected return.
Standard Deviation
Exp
ecte
d R
etu
rn
F
E
A B C
X
Y
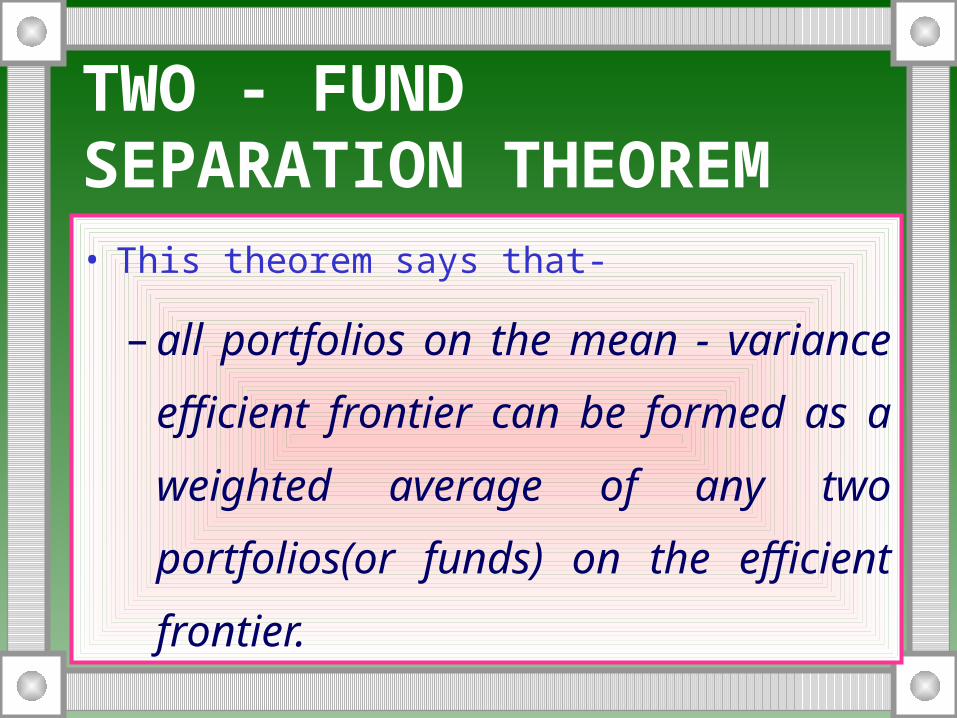
TWO - FUND SEPARATION THEOREM • This theorem says that-
– all portfolios on the mean -
variance efficient frontier can be
formed as a weighted average of
any two portfolios(or funds) on
the efficient frontier.

OPTIMUM SELECTION OF A PORTFOLIO DEPENDS UPON RISK - RETURN TRADE - OFF!!!
Standard Deviation
Exp
ecte
d R
etu
rn
F
E
OPTIMUM PORTFOLIO
P

What are the most important contributions of Markowitz model?
It has two important contributions:
FIRST, it has provided tools of
‘quantification of ‘Risk and Return ’!!!

What are the most important contributions of Markowitz model?
Second is the concept of
‘Efficient Portfolio’!!!
What are the most important contributions of Markowitz model?
Third is the way through which
‘Optimum Portfolio’ is selected!!!

Is there
anything in the
Markowitz
Model at which
you would like
to ‘ATTACK’?

ONE...

Large Volume of
data required.
I would become I would become mad!!! I really do mad!!! I really do
not know how not know how many pieces of many pieces of
input data I need input data I need to generate my to generate my best portfolio?best portfolio?

Too much information required!!!• This model requirement of information
is huge and it increases exponentially with increase in the number of securities.
• Markowitz model requires (n (n+3))/2 pieces of input data.

TWO...

Have you ever wondered why returns of shares of companies from various industries are correlated?
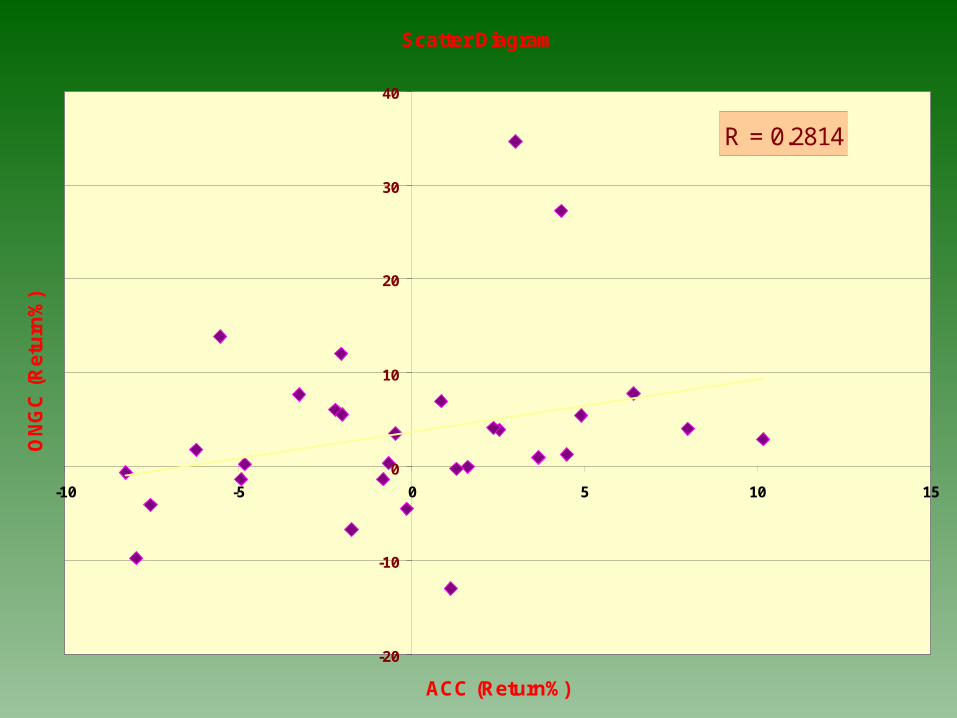
Scatter Diagram
R = 0.2814
-20
-10
0
10
20
30
40
-10 -5 0 5 10 15
ACC (Return%)
ON
GC
(R
etu
rn%
)

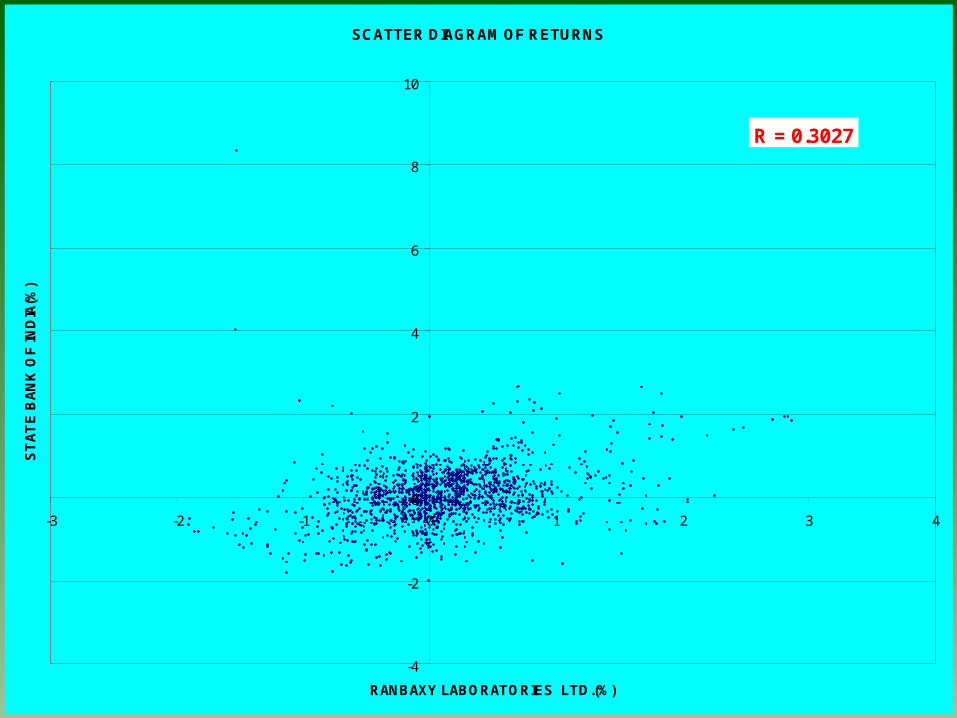
SCATTER DIAGRAM OF RETURNS
-3
-2
-1
0
1
2
3
4
-3 -2 -1 0 1 2 3 4
INFOSYS TECHNOLOGIES LTD.(%)
RA
NB
AX
Y L
AB
OR
AT
OR
IES
LT
D.(
%)
R = 0.2674
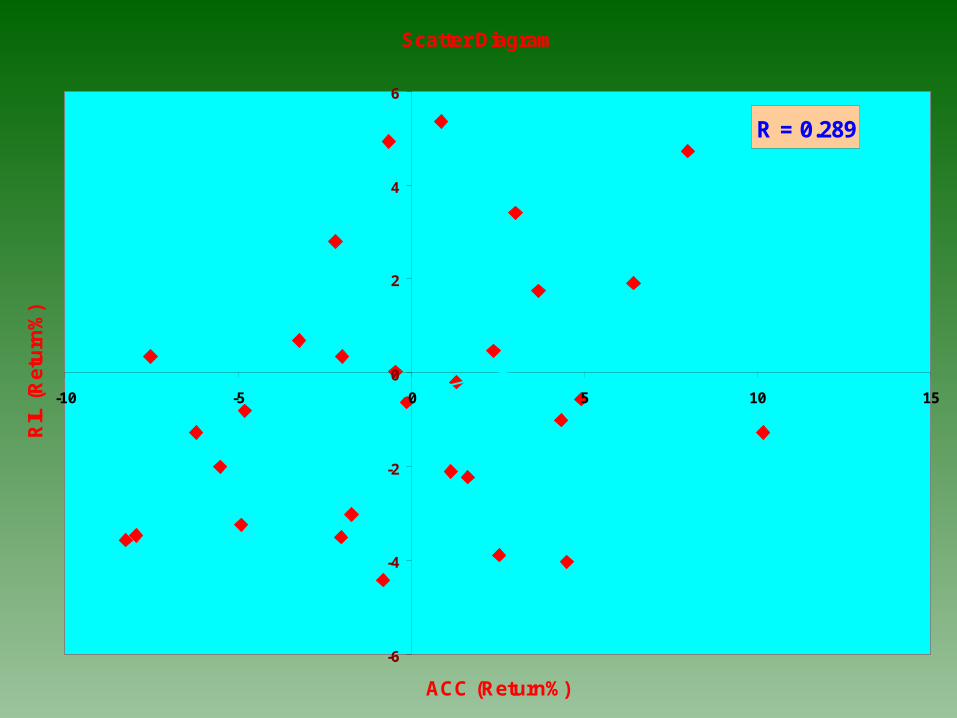
Scatter Diagram
R = 0.289
-6
-4
-2
0
2
4
6
-10 -5 0 5 10 15
ACC (Return%)
RIL
(R
etu
rn%
)
SCATTER DIAGRAM OF RETURNS
-4
-2
0
2
4
6
8
10
-3 -2 -1 0 1 2 3 4
RANBAXY LABORATORIES LTD.(%)
ST
AT
E B
AN
K O
F IN
DIA
(%)
R = 0.3027

What makes shares’ return to have correlation across the companies from the different industries?
THINK!!!

Is there some
underlying
FACTOR which
makes these
correlations to
exist?

If that factor exists, then your
data requirement will also be
considerably reduced!!!!
If that factor exists, then your
data requirement will also be
considerably reduced!!!!
But, are we in a position to identify that factor?

Yes!!!! We can identify that factor...
And, this takes us to ...
RmRi RmRi

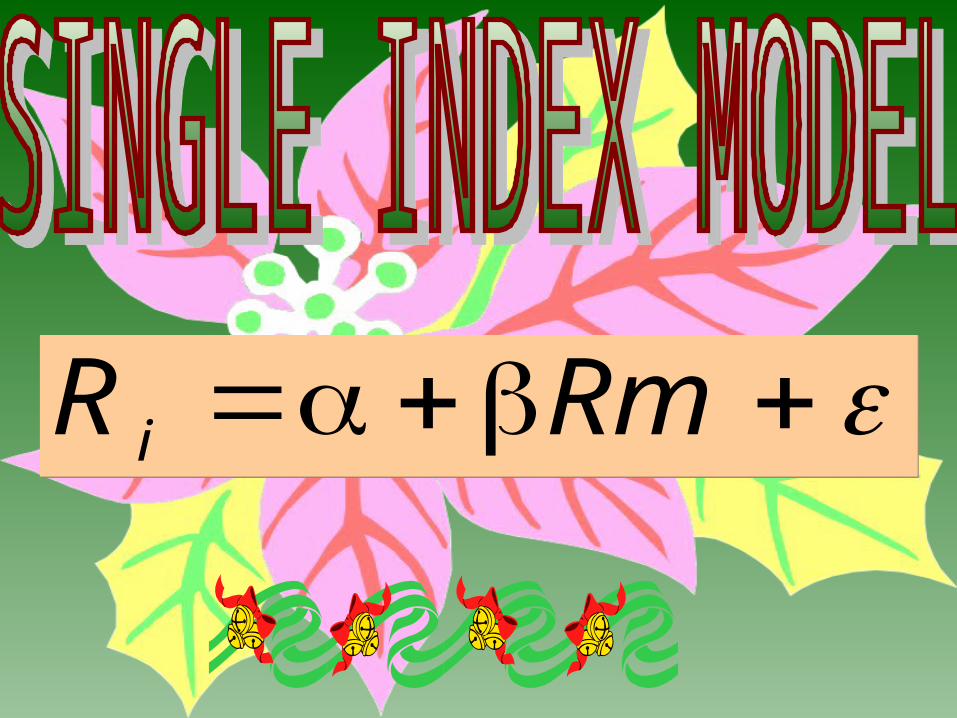
SHARPE’S SINGLE FACTOR/INDEX MODELSHARPE’S SINGLE FACTOR/INDEX MODEL
• It is ex-post relationship.
• It shows how a factor leads to generation of returns in a security.
• Its intercept represents unique return of a security which is independent of Market Index.
• The slope of the Single Index Model represents which is a measure of SYSTEMATIC RISK.
RmRi
It is a linear relation between the return of a security and the underlying factor which is the MARKET INDEX.

Systematic Risk Vs. Unsystematic
Risk • Systematic Risk: Return on an asset is systemically
influenced by return on market portfolio; hence if any variation in the return of an asset is explained by the variation in the market return, then such a variation is called SYSTEMATIC RISK.
Such a risk is caused mainly by the macro factors; and
it is non-diversifiable risk.
• Unsystematic Risk: Any variation in the return of an asset that is not explained by the variation in the market return and is independent of the market risk, or that resides within the asset itself is called UNSYSTEMATIC RISK.
Such a risk is caused mainly by the micro factors; andit is diversifiable risk.
• Systematic Risk: Return on an asset is systemically influenced by return on market portfolio; hence if any variation in the return of an asset is explained by the variation in the market return, then such a variation is called SYSTEMATIC RISK.
Such a risk is caused mainly by the macro factors; and
it is non-diversifiable risk.
• Unsystematic Risk: Any variation in the return of an asset that is not explained by the variation in the market return and is independent of the market risk, or that resides within the asset itself is called UNSYSTEMATIC RISK.
Such a risk is caused mainly by the micro factors; andit is diversifiable risk.
CHARACTERISTIC LINE• A regression line fitted to the scatter plot of returns
from the market portfolio and a security is called CHARACTERISTIC LINE.
• This is also a line that gives us the estimates of the parameters of the Single Factor Model.
• The slope of the characteristic line is called that represents SYSTEMATIC RISK.
• It is called a characteristic line as its slope showing the risk characteristics of a security which is different for different securities.
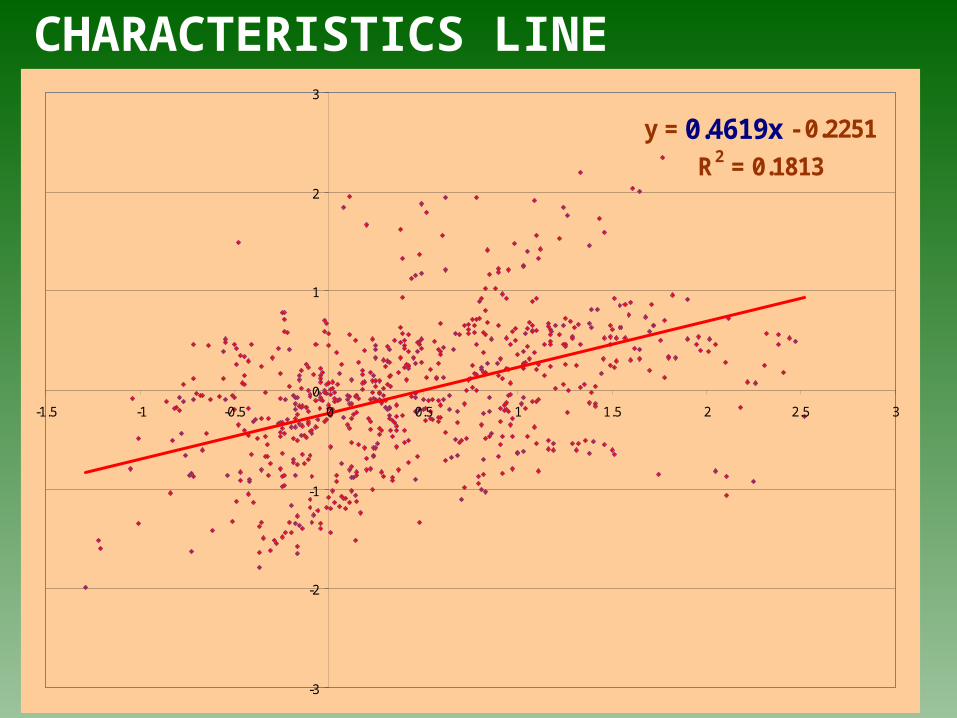
CHARACTERISTICS LINE
y = 0.4619x - 0.2251
R2 = 0.1813
-3
-2
-1
0
1
2
3
-1.5 -1 -0.5 0 0.5 1 1.5 2 2.5 3
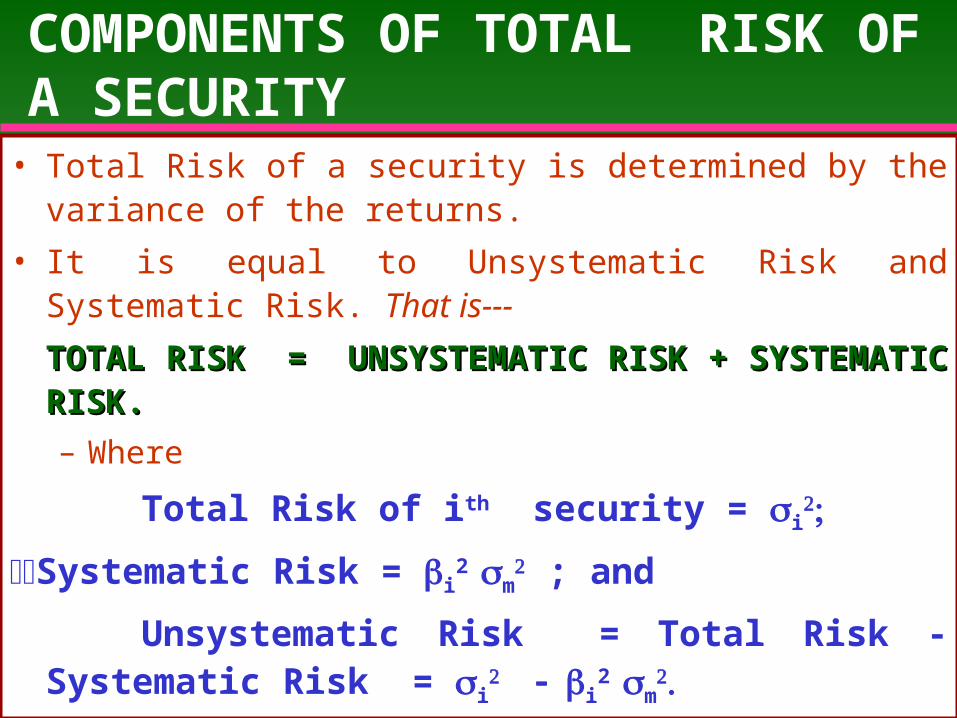
COMPONENTS OF TOTAL RISK OF A SECURITY
• Total Risk of a security is determined by the variance of the returns.
• It is equal to Unsystematic Risk and Systematic Risk. That is---
TOTAL RISK = UNSYSTEMATIC RISK + TOTAL RISK = UNSYSTEMATIC RISK + SYSTEMATIC RISK.SYSTEMATIC RISK.
– Where
Total Risk of ith security = i
Systematic Risk = i2 m
; and
Unsystematic Risk = Total Risk - Systematic Risk = i
i2 m

Is there any statistical measure that can tell us - out of total variation, how much per cent variation is due to systematic part and how much is due to unsystematic part?
• YES!!!
• It is R2. It represents proportion of total risk which is SYSTEMATIC.
• In what way, the information of R2 is useful for an investment manager?

ESTIMATION OF • The estimation of of a security needs the
following steps:
– First, identify a suitable MARKET INDEX.
– Collect information about the prices of the security
and the Index.
– Fit the regression equation on the returns of the
security and the Index where the security return will
be taken as a dependent variable and the return on
the Index will be taken as an independent variable.

ESTIMATION [EXCEL output]SUMMARY OUTPUT
Regression StatisticsMultiple R 0.423823119R Square 0.179626036Adjusted R Square 0.178161082Standard Error 6.876151354Observations 562
ANOVAdf SS MS F Significance F
Regression 1 5797.440487 5797.440487 122.6155199 6.61196E-26Residual 560 26477.61617 47.28145745Total 561 32275.05666
Coefficients Standard Error t Stat P-valueIntercept 0.841961864 0.290330094 2.900015814 0.003877893X Variable 1 0.753268111 0.068026302 11.07318924 6.61196E-26
Dr. Reddy'S Laboratories Ltd.

ESTIMATION [EXCEL output]SUMMARY OUTPUT
Regression StatisticsMultiple R 0.339940172R Square 0.11555932Adjusted R Square 0.113237954Standard Error 7.369805289Observations 383
ANOVAdf SS MS F Significance F
Regression 1 2703.791967 2703.791967 49.78072823 8.16384E-12Residual 381 20693.64543 54.31403Total 382 23397.4374
Coefficients Standard Error t Stat P-valueIntercept 0.275169466 0.376636098 0.730597698 0.465473937X Variable 1 0.696256196 0.098682115 7.05554592 8.16384E-12
Oil & Natural Gas Corpn. Ltd.

ESTIMATION [EXCEL output]SUMMARY OUTPUT
Regression StatisticsMultiple R 0.714636907R Square 0.510705909Adjusted R Square 0.509833727Standard Error 5.35907977Observations 563
ANOVAdf SS MS F Significance F
Regression 1 16816.83319 16816.83319 585.5497139 3.95203E-89Residual 561 16111.77189 28.71973599
Total 562 32928.60508
Coefficients Standard Error t Stat P-valueIntercept 0.214380529 0.226065807 0.94831028 0.343379833X Variable 1 1.282653728 0.053006306 24.19813451 3.95203E-89
Reliance Industries Ltd.

What next…?

INVESTORS’ ATTITUDE INVESTORS’ ATTITUDE TOWARDS RISK ...TOWARDS RISK ...
Depending upon the attitude of
investors towards risk, investors
are classified as -
RISK AVERSE
RISK NEUTRAL
RISK SEEKER
Depending upon the attitude of
investors towards risk, investors
are classified as -
RISK AVERSE
RISK NEUTRAL
RISK SEEKER

UTILITY CURVES…UTILITY CURVES…
RISK
RETU
RN
Risk Averte
r
Risk Neutra
l
Risk Lover
Are investors really Are investors really risk - averters risk - averters …???…???Are investors really Are investors really risk - averters risk - averters …???…???
Yes, they are !!!
It is indicated by the following facts observed
by the researchers:Investors go for diversification.
Investors buy insurance.
Empirical relation between Risk and Return is found to be - high
returns are found to be associated with high risk.
Yes, they are !!!
It is indicated by the following facts observed
by the researchers:Investors go for diversification.
Investors buy insurance.
Empirical relation between Risk and Return is found to be - high
returns are found to be associated with high risk.