and structures geometry optimization in buckling of a...
TRANSCRIPT

Article
Journal of Intelligent Material Systemsand Structures23(1) 65–76� The Author(s) 2011Reprints and permissions:sagepub.co.uk/journalsPermissions.navDOI: 10.1177/1045389X11430730jim.sagepub.com
Geometry optimization in buckling ofa shape memory alloy column due toconstrained recovery
Kunavar Janez, Kosel Franc, Puksic Andrej and Videnic Tomaz
AbstractConstrained recovery of a compressively prestrained shape memory alloy (SMA) is experimentally and theoreticallyinvestigated. Thermomechanical properties of the SMA during the process of constrained recovery are experimentallyobtained. Optimization of geometry in buckling of an ideally straight, simply supported column with a nonconstant crosssection due to constrained recovery is theoretically investigated. Using the experimentally obtained thermomechanicalproperties, the critical buckling force and temperature of the optimized column are calculated. Various experimentswere conducted in order to verify the calculated results. The calculated critical load and predicted buckling tempera-tures show good agreement with buckling experiments reported in this article.
Keywordsshape memory alloy, constrained recovery, optimization of geometry in buckling of columns
Introduction
Intelligent material is, etymologically speaking, everymaterial that inherits some hidden information, whilethe engineer is trying to uncover and understand asmuch of this information and use it for his innovativedesign. An important branch of materials that is exten-sively investigated is shape memory alloy (SMA). Theshape memory effect is a unique property of somealloys, which, after being deformed at lower tempera-ture, recover their original shape when heated to ahigher temperature. The so-called memory is a result ofthe reversible martensitic transformation, which is asolid–solid, diffusionless transition between a crystallo-graphically less ordered, low-temperature productphase (martensite) and a crystallographically moreordered, high-temperature parent phase (austenite).The return to the original shape starts at the austenitestart temperature As and completes at the austenite fin-ish temperature Af (Brinson, 1993). On the other hand,if the SMA is cooled from the austenitic phase, it startsto transform back to martensite at a temperature calledmartensite start temperature Ms and ends at the mar-tensite finish temperature Mf (Brinson, 1993). In thisway, large strains of up to 8% (Duerig et al., 1990) canbe recovered during heating from martensite to auste-nite, and the process is often referred to as reverse mar-tensitic transformation or free recovery. If free recoveryis hampered by an external obstacle before temperature,
Af is reached, large recovery stresses up to 800 MPa(Duerig et al., 1990) can be generated during heating,and the process is called constrained recovery (Sittner etal., 2000; Stalmans et al., 1997). This property makesSMAs ideally suited for use as fasteners, clamps, andmedical elements since it ensures constant load at vari-ous changes of strain during usage (Duerig et al., 1990,1999). Of particular importance for such applications isan understanding of the generation of recovery stresseswith respect to temperature (Kosel and Videnic, 2007;Videnic et al., 2008). Another property of SMA is theso-called pseudoelastic effect, where austenite in theSMA during loading can transform to martensite. Thistransformation is performed at constant load and con-siderable strain, where during unloading, SMA trans-forms to austenite and returns to original shape.
Buckling of columns is a stability problem, exten-sively researched for many years (Bazant and Cedolin,1991; Shanley, 1957; Timoshenko, 1961). However,buckling of structural elements produced from SMAsis a relatively new topic. Among the authors who have
Faculty of Mechanical Engineering, University of Ljubljana, Ljubljana,
Slovenia
Corresponding author:
Kunavar Janez, Faculty of Mechanical Engineering, University of Ljubljana,
Askerceva 6, 1000 Ljubljana, Slovenia
Email: [email protected]
at Narodna Univ Knjiznica on October 2, 2015jim.sagepub.comDownloaded from

dealt with this problem, we can mention Lee and Jung(1999), who numerically solved buckling of a compositeshell reinforced with SMA wires, where SMA contrac-tion under shape memory effect causes a compressiveforce to its composite surrounding. Rahman et al.(2001, 2005) experimentally and numerically researchedbuckling of a SMA column where buckling appearsdue to the effect of superelasticity, which is anotherproperty of SMAs. Movchan and Sil’chenko (2003)report an analytical and experimental study of thebuckling of SMA columns during transformation fromaustenite to martensite.
The mechanism of buckling due to thermal expan-sion is used for activation in more complex temperatureswitch systems in electromechanical devices. Motivatedby the possibility of this kind of application, we hereexplore the process of constrained recovery of a SMAcolumn, which could perform such a task. To ourknowledge, research on buckling of SMA columns dueto constrained recovery has not been reported so far inthe available literature.
In the present article, a particular case of constrainedrecovery is observed, such that the generated stress iscompressive. At a certain temperature, the generatedcompressive stress can induce loss of the column’s sta-bility if the column is too slender. Research was con-ducted to understand the process of buckling due toconstrained recovery for a column with nonconstantcross section. The experimental part of the researchconsists of measuring the thermomechanical properties,followed by experiments of constrained recovery. Thetheoretical part consists of obtaining equations for elas-tic modulus and compressive force as functions of tem-perature during constrained recovery. Buckling ofcolumns in the elastic domain is used to obtain the opti-mal shape of the SMA column and to calculate thebuckling force and temperature for various shapes ofan ideally straight SMA column. A set of experimentswas made to verify the correctness of the calculatedbuckling forces and temperatures.
Problem Definition
To achieve a process of constrained recovery, prestrainmust be applied to a specimen, which can be performedby different methods (Sittner et al., 2000). Compressionprestrain of a 100% martensite phase was chosen in ourcase as the most practical, also in view of potential use.After the prestrain is applied, the specimen (ideally astraight SMA column with circular cross section) is putbetween simple supports, with zero axial travel. Duringheating up to As, compressive stress appears due tothermal expansion of the SMA specimen. Heating totemperatures above As triggers the process of con-strained recovery, which causes additional compressivestress. The observed specimen is supposed to buckle at
some temperature in the temperature range between As
and Af, where compressive stress is rising with the high-est rate during heating. Our goal is to obtain the opti-mal shape of the column with circular cross section,such that it will have maximum buckling force at thesame volume and length compared with nonoptimizedshape.
In order to calculate the buckling force Fb, we mustfirst determine the compressive force and mechanicalproperties (both as function of temperature during pro-cess of constrained recovery of SMA column). Therecovery force for columns with nonconstant cross sec-tion can be calculated, using physical models whereconstrained recovery is solved (Kato et al., 2004; Koseland Videnic, 2007) or obtained experimentally. Themechanical property that is observed before resolvingthe buckling problem is the stress–strain diagram atbuckling temperature. Linear elastic, nonlinear elastic,and elastoplastic type of stress–strain diagram could bepossible. However, there is no particular information inthe literature as to what type of diagram should beused; therefore, without employing adequate experi-ments, this diagram cannot be precisely predicted (Katoet al., 2004; Movchan and Sil’chenko, 2003; Stalmans etal., 1997).
If it turns out that the stress–strain diagram at buck-ling temperature shows an elastic relation, it is enoughto know the compressive stress and elastic modulus ofthe phase mixture at buckling temperature to describeboth the external load and stress–strain diagram of thespecimen at buckling temperature.
It is a well-known fact that the elastic modulus of theaustenite phase Ea is higher (in the range of 2–3 times)than the elastic modulus of the martensite phase Em,depending on type of SMA (Brinson, 1993). Duringheating above As, the reverse martensitic transforma-tion is in progress and the volume fraction of martensiteis diminishing. The volume fraction of martensite isdenoted by j and defined as j = Vm=(Va + Vm), where Vm
is the volume of martensitic and Va the volume of auste-nitic phase present in the SMA column (Brinson, 1993).Since, during the transformation progress, both phasescoexist (j is between 1 and 0), the elastic modulus of thephase mixture E is neither Ea nor Em. It can be assumedthat E is a function of j. The volume fraction j is afunction of temperature, as well as a function of theapplied stress on the column. However, during the pro-cess of constrained recovery, the applied stress is also afunction of temperature. Therefore, the relation j(T)should be obtained in order to determine the depen-dence of the elastic modulus of the phase mixture ontemperature. There are models available in the litera-ture where j(T) and recovery stress s(T) can be calcu-lated during the process of constrained recovery (Koseland Videnic, 2007; Videnic et al., 2008).
Obtaining j(T) is sufficient only for the case of lin-ear elastic type of the stress–strain diagram at buckling
66 Journal of Intelligent Material Systems and Structures 23(1)
at Narodna Univ Knjiznica on October 2, 2015jim.sagepub.comDownloaded from

temperature; therefore, an experimental way to definethe stress–strain diagram at predicted buckling tem-perature is proposed. The experimental results will alsoshow the type of aforementioned stress–strain relationof the specimen at different temperatures.
For better understanding, consider that compressivetests with a loading up to 0.5% of compressive strainfollowed by an unloading at constant temperature T .
As are to be made in order to get the stress–strain dia-gram. Such tests are to be made at different tempera-tures in order to get stress–strain diagrams at differentpossible buckling temperatures. The most importantinformation is if the specimen is hampered during heat-ing from room temperature T0 to T. Usual method forobtaining stress–strain diagram is normally understoodas a compressive test at constant temperature T . As,where the SMA specimen is not hampered while heatingto T. While heating the specimen to the testing tempera-ture, the process of reverse martensitic transformationoccurs, and at the start of test at T .As, the specimenhas some phase mixture, described by j1. However, inthis article a different method was used, which moreprecisely resembles the problem of buckling due to con-strained recovery. By this method, the specimen is pre-strained when it is in the martensitic phase at atemperature lower than Mf and then hampered whileheating to temperature T . As. The process of con-strained reverse martensite transformation occurs witha resulting phase mixture j2 at the start of the compres-sive test, when it is different from j1.
Experimental Setup
Experiments were designed in order to obtain two mainsets of results. The first set of experiments was made toobtain thermomechanical characteristics of SMA speci-mens during the process of constrained recovery, andthe second set of experiments was made to obtain thecritical buckling temperature of SMA specimens. Abrief description of each component of the testing appa-ratus is given in the following.
Loading and Measuring System
Tests were conducted on a Zwick Z050/TH3A testingmachine, with a maximum tensile/compression force of50 kN, within a precision range of 60.5 N. The forcewas supplied by an electrically driven spindle placed inthe frame of the testing machine and measured by astrain gauge measuring cell.
The strain of the specimen was measured by anextensometer travel measuring. Zwick extensometerssuited to maximum measurement temperature of 250�Cwith precision range within 60.2 mm were used.
The control unit of the testing machine was inter-faced with an Intel PC/Pentium computer, with
TextXpert II software used for collecting and storingdata and data analysis.
Heating and Cooling System
Tests were carried out in a ventilated temperaturechamber, produced by Zwick. The temperature rangeof the chamber is between 270�C and 250�C, with abil-ity to keep constant preset temperature in the range of60.1�C. Heating of air was provided by an electric hea-ter and air ventilating system to ensure homogenous airtemperature in the temperature chamber. The tempera-ture chamber was controlled via TestXpert II software.
Factory-fitted thermometers in the temperaturechamber measure air temperature in the temperaturechamber. Some experiments require the temperature ofthe specimen to be measured more accurately. In suchcases, the temperature of air may not be the same asthe temperature of the specimen; therefore, an extra K-type thermocouple was used to measure the specimentemperature.
Specimen Properties
The specimens used for tests were produced from Ni–Ti 50% alloy. The manufacturer, Memry� Gmbh, esti-mated the transformation temperature Af = 65�C. Theexact details on thermomechanical history of theobtained SMA material are not given. Therefore, trans-formation temperatures were obtained by standardexperimental method (Duerig et al., 1990) with thermalcycle (heating from 20�C to 100�C and cooling down to20�C at a rate of 1�C/min) of the specimen under con-stant uniaxial tensile stress, while measuring displace-ment of the specimen. After one thermal cycle,transformation temperatures were obtained from thediagram of temperature–displacement. Experimentswere conducted on three different levels of tensilestress, in order to obtain the diagram of transformationtemperatures–tensile stress. From this diagram, it isobserved that Mf = 27�C, Ms = 30.5�C, As = 57�C,and Af = 67�C. Stability of shape memory effect isassured by the manufacturer, and it is also presentedvia experiments (Figure 3). The specimens had theshape of straight bars of circular cross section with adiameter of 3.12 mm and length of 200 mm. For latertests, different lengths of specimens were prepared.
Experimental Determination ofThermomechanical Properties duringConstrained Recovery
Test Procedure
Specimens for experiments in this article were cut to alength of 40 mm. Testing procedure consists of fourmain stages: in the first stage, the specimen is prepared
Janez K et al. 67
at Narodna Univ Knjiznica on October 2, 2015jim.sagepub.comDownloaded from

to reset any previous deformations and to reach a100% martensitic phase. This stage consists of heatingthe specimen on an electric heating plate to 150�C for2 min, slowly cooling it down and leaving it in a freezerat 28�C for 5 min.
In the second stage, compressive prestrain of thespecimen in the martensitic phase is applied.Transformation temperatures obtained in the experi-ments indicate that the room temperature (around25�C) is under Mf. Therefore, martensite prestrain canbe obtained at room temperature. To achieve this, thespecimen is put between the clamping jaws of the test-ing machine, into a specially designed gripping device,as shown in Figure 1. The gripping device prevents pos-sible buckling of the specimen under compressivestress, and after the specimen is put inside this device,there is an axial distance Da of approximately 3 mmbetween the facing planes of the gripping device. The dia-meter of the borehole in the gripping device, where thespecimen is fit, ensures a loose tolerance between theborehole and specimen. At room temperature, the speci-men is compressed at a clamping jaw rate of 0.5 mm/min, until compressive strain reaches 2.5%, and then thespecimen is unloaded to zero stress. After unloading,there is approximately 2% of compressive strain presentin the specimen, and this is called prestrain es0.
In the third stage, the specimen remains in the grip-ping device, and the software keeps the distancebetween the extensometer constant during the follow-ing test. The extensometers are put on the specimenbody between clamping jaws. Then the air temperaturein the temperature chamber starts to rise at a rate of1�C/min, and it keeps rising until it reaches the presettarget temperature, higher than As, where it is kept con-stant for 1 min. During this heating process, there is anincrease in the compressive stress in the specimen, thatis, below As due to thermal expansion, while at tem-peratures above As additional stress appears because ofconstrained recovery.
The fourth stage starts by keeping the air temperaturein the chamber at constant target temperature for 1 min.Additional compressive strain is applied to the specimen
by moving the jaws together at a rate of 0.5 mm/min,and then the jaws are moved apart until compressivestress is zeroed. During all the phases of this test, thetemperature of the specimen is measured with a K-typethermocouple placed inside the gripping device.
Results
As described earlier in section ‘Test Procedure’, experi-ments are conducted on the same specimen, until thetarget temperature is reached and additional stressapplied. Six target temperatures were examined: 60�C,68�C, 72�C, 77�C, 80�C, and 90�C, respectively. Figure2 presents the second stage of the experiment, namelycompressive prestrain and unloading until an approxi-mate 2% compressive strain is reached at a room tem-perature of 25�C. Three different results of this stage ofexperiment are presented in Figure 2, where a goodagreement between each value of prestrain after defor-mation is observed.
The third stage of the experiment described in sec-tion ‘Test Procedure’ is constrained recovery of the spe-cimen. A graph of compression stress versustemperature of this experimental stage is shown inFigure 3 for three experiments of the same specimen.From Figure 3, some oscillation in compressive stressduring heating can be noticed. This problem is presentat all tests, where the testing machine during heatinghad to ensure constant zero strain, measured via extens-ometers. Such control cycle is particularly demandingduring reverse martensite transformation, where thetesting machine must keep zero strain at a higher stressrate due to constrained recovery. In Figure 3, addi-tional compressive strain in the first experiment (greenline) is 0.15%, while the next two experiments are madewith 0.3% additional compressive strain.
The fourth stage of experiment consists of additionalcompressive strain at constant target temperature, asshown in compressive stress–strain diagram.
Figure 2. Obtaining compressive prestrain at roomtemperature.
Figure 1. Specimen fits between upper and lower jaw of testingmachine.
68 Journal of Intelligent Material Systems and Structures 23(1)
at Narodna Univ Knjiznica on October 2, 2015jim.sagepub.comDownloaded from
In Figure 4, this stage is presented for the target tem-perature of 72�C, with the main part of martensite inthe phase mixture, as can be seen by the value of slope.It is shown that after additional compressive strain isapplied, there is a linear relationship between additionalcompressive stress and compressive strain. Therefore, itcan be assumed that the slope of the aforementionedlinear relationship in Figure 4 is the elastic modulus ofphase mixture in the specimen at different target tem-peratures. During unloading, the stress–strain relationcan also be linearized (Figure 4, lower line), where itsslope, that is, elastic modulus, is the same in the case ofloading and unloading. Some difference in the pathbetween loading and unloading is noticed, but it can beexplained as a problem of the testing machine in keep-ing a constant rate of strain, particularly at the start ofunloading. Therefore, this difference will be neglected,and the path at loading will be considered the same as
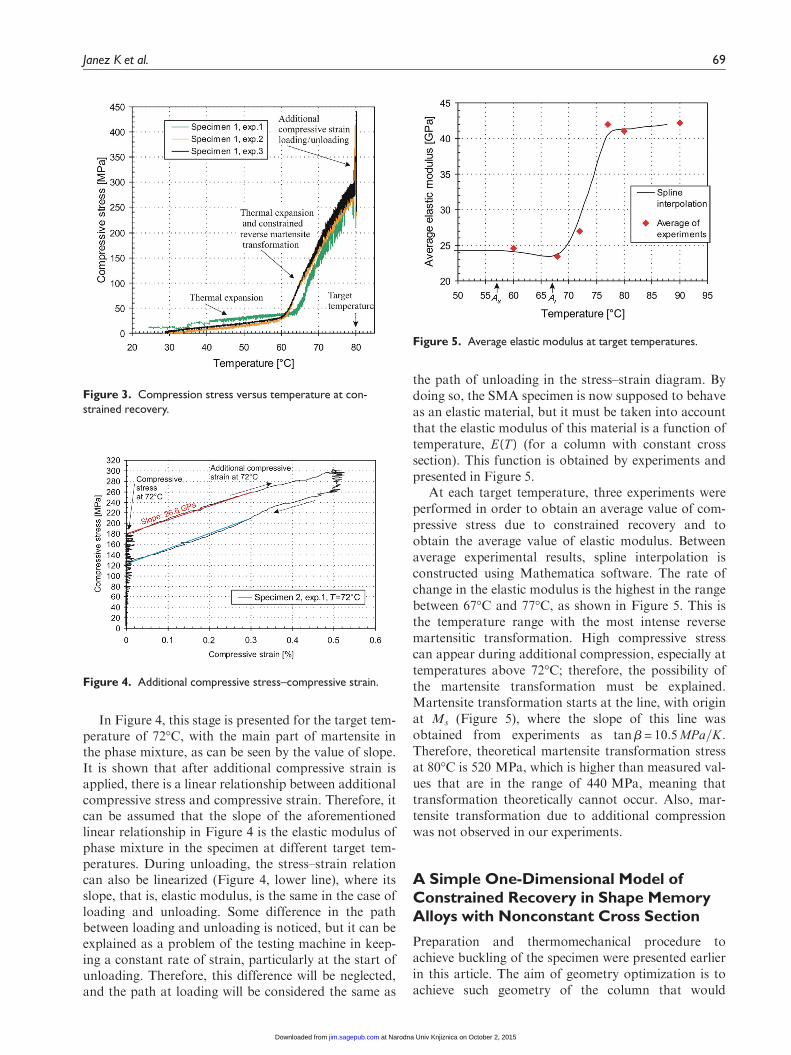
the path of unloading in the stress–strain diagram. Bydoing so, the SMA specimen is now supposed to behaveas an elastic material, but it must be taken into accountthat the elastic modulus of this material is a function oftemperature, E(T) (for a column with constant crosssection). This function is obtained by experiments andpresented in Figure 5.
At each target temperature, three experiments wereperformed in order to obtain an average value of com-pressive stress due to constrained recovery and toobtain the average value of elastic modulus. Betweenaverage experimental results, spline interpolation isconstructed using Mathematica software. The rate ofchange in the elastic modulus is the highest in the rangebetween 67�C and 77�C, as shown in Figure 5. This isthe temperature range with the most intense reversemartensitic transformation. High compressive stresscan appear during additional compression, especially attemperatures above 72�C; therefore, the possibility ofthe martensite transformation must be explained.Martensite transformation starts at the line, with originat Ms (Figure 5), where the slope of this line wasobtained from experiments as tanb = 10:5 MPa=K.Therefore, theoretical martensite transformation stressat 80�C is 520 MPa, which is higher than measured val-ues that are in the range of 440 MPa, meaning thattransformation theoretically cannot occur. Also, mar-tensite transformation due to additional compressionwas not observed in our experiments.
A Simple One-Dimensional Model ofConstrained Recovery in Shape MemoryAlloys with Nonconstant Cross Section
Preparation and thermomechanical procedure toachieve buckling of the specimen were presented earlierin this article. The aim of geometry optimization is toachieve such geometry of the column that would
Figure 3. Compression stress versus temperature at con-strained recovery.
Figure 5. Average elastic modulus at target temperatures.
Figure 4. Additional compressive stress–compressive strain.
Janez K et al. 69
at Narodna Univ Knjiznica on October 2, 2015jim.sagepub.comDownloaded from

withstand maximum load capacity at its minimummass. One of the design criteria of slender structuralmembers is to consider a possible nonstable stage atmaximum load. This can be accomplished by rearran-ging the material so that a maximal cross section is pre-scribed for the structural member in regions withhigher stress.
In our case, the buckling of columns with circularcross section is dealt with where the optimization criter-ion is for a slender column with cross section Q(x) andlength L0, such Q(x) must be defined where the buck-ling load Fb is maximal, Fb = Fb,max, under the condi-tion that the volume of the optimized column is thesame as the volume of the nonoptimized column,Vopt = Vconst. Prestrain of the martensite phase is thesame in both cases. It must be mentioned that L0 islength of the column before prestrain es0 is applied tothe column in the martensite phase, and Ls0 is thelength of the column after prestrain es0 is applied.
The aim of our observation is a column with non-constant cross section, which is prestrained in the mar-tensite temperature region, then simply supported(supports are axially fixed), and heated above As. Dueto obstructed temperature dilatation and constrainedrecovery, there is compressive load in the column, andthe column reaches a labile state and eventuallybuckles. The elastic modulus also changes during theprocess of constrained recovery above As.
Heating of SMA column must be divided into threeregions:
1. First temperature region: T0 < T < Tc
2. Second temperature region: Tc < T < Tc,max
3. Third temperature region: Tc,max < T
where the particular temperature regions will beexplained in the following. Constrained recovery issolved using a physical model named generalized plasti-city (Auricchio and Lubliner, 1996); the model that hasbeen previously used by the authors (Kosel andVidenic, 2007; Videnic et al., 2008). From the staticequilibrium of column in axial direction, it is assumedthat compressive force is constant over the column’slength. Therefore, reverse martensite transformation islocated in the greatest area of column, where compres-sive stress is minimal (Figure 6).
First Temperature Region: T0 < T < Tc
The variable T0 is the room temperature and Tc is thestart of reverse martensite transformation, shown inFigures 6 and 7, where it is clear that reverse martensitetransformation starts in the column’s maximal crosssection (cross section 2).
In this temperature region, there is no reverse mar-tensite transformation; however, there is obstructedtemperature dilatation, since Ls(T) is constant during
heating, as a result of simple supports fixed in axialdirection.
Displacement u(T0<T<Tc) of the column can bewritten as
u Tð Þ= es0
ðL0
0
dx + as T � T0ð ÞðL0
0
dx�ðL0
0
F dx
Q xð ÞEm
ð1Þ
where es0 = (Ls0 � L0)=L0 is the prestrain of the columnin martensite phase (T \ Mf), as is coefficient of tem-perature dilatation, F is compressive force in the col-umn during heating, Q(x) = p (d (x))2=4 is the crosssection of the column, while Em is elastic modulus ofthe column. In this temperature region, it is same aselastic modulus of the martensite phase of SMA.
Displacement can be also written as
u = Ls Tð Þ � L0 ð2Þ
Equating (1) and (2), expression for F can beobtained as
F =EmL0 1 + es0 + as T � T0ð Þð ÞÐL0
0
dxQ xð Þ
ð3Þ
Figure 7. Column of nonconstant cross section at differenttemperatures.
Figure 6. Column of nonconstant cross section, stress–tem-perature relation along the span of SMA column.
70 Journal of Intelligent Material Systems and Structures 23(1)
at Narodna Univ Knjiznica on October 2, 2015jim.sagepub.comDownloaded from

On the other hand, F can be written as
F = s x, Tð ÞQ xð Þ ð4Þ
In order to obtain Tc, we use the condition for thestart of reverse martensite transformation. The modelof generalized plasticity (Auricchio and Lubliner, 1996)defines this condition as F=Q(x) = C(Tc � As), where Cis stress rate, experimentally obtained property and pre-sented as C = tana (Figure 6). Equation (4) is checkedfor this condition and used in Equation (3)
C Tc � Asð ÞQ xð Þ=EmL0 1 + es0 + as Tc � T0ð Þð ÞÐL0
0
dxQ xð Þ
ð5Þ
where Tc is expressed as
Tc xð Þ=
EmL0
Q xð ÞÐL0
0
dxQ xð Þ
T0 � CAs
EmL0
Q xð ÞÐL0
0
dxQ xð Þ
1 + es0 + asð Þ � Cð6Þ
Compressive force in this temperature range is calcu-lated from Equation (3), whereas compressive stress canbe calculated using Equations (3) and (4) as
s x, Tð Þ=EmL0 1 + es0 + as T � T0ð Þð Þ
Q xð ÞÐL0
0
dxQ xð Þ
ð7Þ
Second Temperature Region: Tc < T < Tc,max
Tc,max is the minimum temperature where the reversemartensite transformation for the whole column spanoccurs (Figure 6).
Compressive axial force in the column is caused bytwo components. The first component is due toobstructed temperature dilatation of the SMA column,and the second is constrained recovery of the SMA col-umn. The total compressive axial force is a function oftemperature F = N = N(T), and at some tempera-ture, it is constant through the column length,N 6¼ N(x). Due to nonconstant cross section Q = Q(x),the compressive stress s(x, T) = N(T)=Q(x) is a functionof the cross section and temperature. The part of thecolumn with lowest compressive stress is the first toachieve the condition for the start of reverse martensitetransformation (Figure 8). This part of the column hasa length 2Dx.
The rest of the column at this temperature remainsin martensite phase. The situation for the nondeformedcolumn is presented in Figure 9, and for this situation,we can write the equation for displacement as follows:
u1 + u2 = Ls Tð Þ � L0 ð8Þ
where
u1 is the displacement of region with reverse marten-site transformation (M + A)u2 is the displacement of region without reverse mar-tensite transformation (M)
u1 Tð Þ= 2 es0
ðL02
L02�Dx
j x, Tð Þdx + as T � T0ð ÞðL02
L02�Dx
dx
2664
�ðL02
L02�Dx
F dx
Q xð ÞE x, Tð Þ� ð9Þ
u2 Tð Þ= 2 es0
ðL02�Dx
0
dx + as T � T0ð ÞðL0
2�Dx
0
dx�ðL0
2�Dx
0
F dx
Q xð ÞEm
264
375ð10Þ
In Equations (9) and (10), the j(x, T) is volume frac-tion of martensite in the SMA, which can be calculatedby the equation used in the model of generalized plasti-city (Auricchio and Lubliner, 1996):
j x, Tð Þ=F Tð Þ
C Af � As
� �Q xð Þ
+Af � T
Af � As
ð11Þ
Figure 9. Column with nonconstant cross section withexposed region of reverse martensite transformation.
Figure 8. Tensile stress versus temperature for various valuesof span x of SMA column.
Janez K et al. 71
at Narodna Univ Knjiznica on October 2, 2015jim.sagepub.comDownloaded from

The elastic modulus for SMA during the phasetransformation, E(x,T), is calculated by the equationpresented by Brinson and Huang (1996):
E x, Tð Þ= Em � Eað Þj x, Tð Þ+ Ea ð12Þ
Equations (9) and (10) can be rearranged and putinto Equation (8):
L0ð1þ asðT � T0ÞÞ
þ es0 L0 � 2 Dxþ 2 F
CðAf � AsÞ
ðL02
L02�Dx
dx
QðxÞ þ 2Af � T
Af � As
Dx
2664
3775
� 2 F
Em
ðL02�Dx
0
dx
QðxÞ
0B@
1CA� 2FCðAf � AsÞ
ðL02
L02�Dx
dx
C EaðAf � AsÞ � ðEa � EmÞðAf � TÞ� �
QðxÞ � ðEa � EmÞF
¼ Ls0
ð13Þ
There are three unknowns in Equation (13): Dx, T ,and F. Therefore, we use the condition for the start ofreverse martensite transformation (Figure 9):
F Tð ÞQ L0
2� Dx
� �� C T � Asð Þ = 0
and express temperature T
T = As +F Tð Þ
CQ L0
2� Dx
� � ð14Þ
Now we can write F from Equation (13) as
F Tð Þ=�as As � T0ð ÞL0
asL0
CQL0
2�Dx
� � + 2es0B1
C Af�Asð ÞQ L0
2�Dx
� �� 2B2
Em� 2C Af � As
� �B3
ð15Þ
where
B1 =
ðL02
L02�Dx
dx
Q xð Þ ð16Þ
B2 =
ðL02�Dx
0
dx
Q xð Þ ð17Þ
B3 =ðL02
L02�Dx
dx
C Ea Af � As
� �� Ea � Emð Þ Af � T
� �� �Q xð Þ � Ea � Emð ÞF
ð18Þ
Third Temperature Region: T ˜ Tc,max
When T ˜ Tc,max, the reverse martensitic trans-formation takes place in all parts of the SMAcolumn. The condition for this region is thereforess(Dx = L0=2, Tc, max) � C(Tc, max � As). In this tempera-ture region, equations from the second temperatureregion are used, where Dx = L0=2. Temperature T in thisregion is taken as variable, and we use Equation (12) toexpress F as
F =
Ls0 + es0L0
Af � T
Af � As
� L0 1 + as T � T0ð Þð Þ
2B1es0
C Af � As
� � + 2CB3 Af � As
� � ð19Þ
where it is considered B2(L0=2) = 0,
Calculation of Buckling Force andTemperature for the Optimized SMAColumn
Obtaining the Function of Cross Section Q(x) for SMAColumn
In the previous section, equations for obtaining thecompressive force as a function of temperature duringconstrained recovery were obtained for an arbitraryfunction of column cross section Q(x) and for anyform of cross section. Due to some limitations inexperiments, we chose a particular shape of the opti-mized column (Figure 10). Three distinct regions of theoptimized column can be noticed: two regions L1/2with diameter d1, and region L2 with diameter d2, whereL1 + L2 = L0.
Let us first calculate d2, such that the volume ofthe optimized column equals the volume of nonopti-mized column of same length, Vopt = Vconst, and we canexpress d2
d2 =
ffiffiffiffiffiffiffiffiffiffiffiffiffiffiffiffiffiffiffiffiffiffiffiffiffiffiffiffiffiffiffiffiffiffiffiffiffiffiffiffiffiffiffiffiffiffiD2
const L1 + L2ð Þ � d12L1
L2
sð20Þ
where Dconst is the diameter of the nonoptimized column.
Calculation of Function F(T) and E(x,T)
In order to calculate the compressive force in the mem-ber during heating, we must obtain integrals inEquations (16)–(19). We must obtain two sets of solu-tions, which depend on the length Dx.
For each region of the column, the cross section iswritten as
Q1 =pd1
2
4and Q2 =
pd22
4ð21Þ
72 Journal of Intelligent Material Systems and Structures 23(1)
at Narodna Univ Knjiznica on October 2, 2015jim.sagepub.comDownloaded from

Calculation of B1 :
1. For Dx\L2=2 :
B1 =Dx
Q2
ð22Þ
2. For Dx.L2=2:
B1 =L2 � L0
4Q2
+Dx� L2
2
Q1
ð23Þ
Calculation of B2 :
1. For Dx\L2=2 :
B2 =L1
2Q1
+L0 � L1 + L2
4Q2
ð24Þ
2. For Dx.L2=2 :
I2 =1
4
L0 � L2
Q1
ð25Þ
Calculation of B3:
1. For Dx\L2=2 :
B3 =Dx
C Ea Af � As
� �� Ea � Emð Þ Af � T
� �� �Q2 � Ea � Emð ÞF
ð26Þ
2. For Dx.L2
2:
B3 =L2
2C Ea Af � As
� �� Ea � Emð Þ Af � T
� �� �Q2 � Ea � Emð ÞF
+Dx� L2
2
C Ea Af � As
� �� Ea � Emð Þ Af � T
� �� �Q1 � Ea � Emð ÞF
ð27Þ
Obtaining Critical Buckling Force and CriticalBuckling Temperature
From the results of additional compressive loading, wehave already shown that it is correct to deal with buck-ling of the column by considering that for SMA atbuckling temperature Tb, the additional compressivestress is linear function of compressive strain (Figure4). Therefore, we can use the known method for obtain-ing the buckling force of the elastic column with smalldeflection theory.
For simply supported column with three differentregions (Figure 10), the buckling force Fb is calculatedfrom the transcendent equation, presented byTimoshenko (1961):
ffiffiffiffiffiffiffiffiffiffiffiffiffiEd2Id2
Ed1Id1
r= tan
v2L2
2
� �tan
v2L1
2
ffiffiffiffiffiffiffiffiffiffiffiffiffiEd2Id2
Ed1Id1
r� �ð28Þ
where
v22 =
Fb
Ed2Id2
ð29Þ
where Ed1 and Id1 are elastic modulus and minimumsecond moment of area for cross section in region withd1; Ed2 and Id2 are elastic modulus and minimum sec-ond moment of area in region with d2.
The procedure for obtaining the buckling force andbuckling temperature is as follows: we have to solve thesystem of three nonlinear equations with three unknowns(buckling force Fb, buckling temperature Tb, and elasticmodulus E during buckling). First equation in this systemis selected among Equations (3), (14), or (18). Selection ismade with respect to the temperature region in which thecolumn is presented at the observed temperature. Secondin the system is Equation (12), the equation for obtainingelastic modulus E(x, T). Third equation in the system isEquation (27). In this system of equations, it is assumedthat F(Tb) = Fb(Tb), namely, the compressive force Fin the column at buckling temperature Tb equals bucklingforce Fb at buckling temperature Tb.
Experimental Verification of CalculatedBuckling Temperatures
Introduction
Verification of the calculated buckling forces and tem-peratures for various shapes of columns was performed
Figure 10. Simply supported column with nonconstant circularcross section.
Janez K et al. 73
at Narodna Univ Knjiznica on October 2, 2015jim.sagepub.comDownloaded from

by experiments described in the following. A specialgripping plate, which provided a simple support, wasmade for the experiment—a shallow hole was drilledinto the plate to ensure the hinge between the specimenand plate. The specimen had both end surfaces groundin spherical shape. Oil was put in the hole to reducefriction between the specimen and plate.
The testing procedure consists of three main stages:The first and second stages are identical to the first twostages presented in section ‘Test Procedure’. In thethird stage, the specimen was put between the afore-mentioned gripping plate, as shown in Figure 11. Thesoftware kept the distance between the extensometersconstant during the test. Extensometers were put onthe specimen body between the clamping jaws. Air tem-perature in the temperature chamber started to rise at arate of 1�C/min. The temperature was rising until buck-ling of the specimen occurred, as shown in Figure 11,and then the temperature was left to rise by a fewdegrees Celsius more. The rise of the temperature wasconducted with one purpose alone—to evidence thebuckling temperature from the sudden change in dia-gram ‘temperature–tensile force’; however, buckling ofthe specimen was also observed by naked eye.
The geometry of the optimized column is presentedin Figure 10, whereas the nonoptimized column is ofthe same length and constant diameter Dconst. Let usexplain that searching of the optimal column amongthe optimized samples was specific, since not all sam-ples had the same volume. Samples were compared inpairs of one optimized column and one nonoptimizedcolumn (both columns have the same volume,Vopt = Vconst), as shown in Table 1. The reason fornot making all the samples with the same volume isdue to difficulty of experiments and due to limited dia-meter, which could not exceed 3 mm. Therefore, wecannot compare the absolute value of the bucklingforce for all samples. On the other hand, we can
observe the effect of length L1/2 on the buckling forceand temperature for each pair, and by doing this, wecan still obtain optimal length L1/2, namely the shapeof optimized column. Six groups of experiments weredesigned, each group consisted of three experiments forone sample. In one of the groups, only two experimentswere designed. Additional sample is the one with L1/2 = 8 mm, and for this sample, three buckling experi-ments were performed.
Results
Physical properties were obtained in experiments, theirvalues are as follows: Em = 24 GPa, Ea = 43 GPa,As = 57�C, Af = 67�C, C = 5.6 MPa/�C, es0 = 2%(compressive prestrain), as = 4:4310�5 1=K, Ls0 =40 mm, d1 = 2.5 mm, and d2 = 3 mm.
Figures 12 and 13 shows the calculated and averagedexperimental results. From Figure 14, it is clear thatmaximum ratio between the buckling force of the opti-mized and nonoptimized column appears at L1/2 = 6 mm, and this length is the same for the calcu-lated and experimental results. The experimentallyobtained buckling force for the optimal column is only5.7% higher than that of the nonoptimized column,while from calculated results it is expected as 19%.Figure 15 shows that the ratio between the bucklingtemperature of the optimized and nonoptimized col-umn is also maximal at L1/2 = 6 mm, but in this case
Figure 11. Buckled specimen in the testing machine.
Figure 12. Calculated and measured buckling force Fb as func-tion of L1/2 for optimized and nonoptimized column.
Table 1. Diameter of nonoptimized column for different lengthsL1/2.
L1/2 (mm) Dconst (mm) Volume (mm3)
First pair 4 2.907 265.5Second pair 6 2.859 256.8Third pair 10 2.77 241.1
For every column the total length is the same, Ls0 = 40 mm.
74 Journal of Intelligent Material Systems and Structures 23(1)
at Narodna Univ Knjiznica on October 2, 2015jim.sagepub.comDownloaded from

we observe a small increase (4% and 1.8%) in thebuckling temperature at experiments and calculation,respectively.
In general, experimental measures and numericalresults of buckling temperature show good agreement,which was the main goal of this research. This isbecause, it is most important to predict the precise tem-perature of buckling for the potential use of the SMAcolumn in the thermoswitch. Moreover, it was proventhat in circumstances where constant temperature ofbuckling is requested even if the shape of the column isnot precisely constant over the length, the phenomenonof buckling of SMA column could be used.
However, there is discrepancy between experimentalmeasures and numerical results of buckling force foroptimized column, and we see two possible reasons forthis. First, prestrain over the length of the SMA col-umn is not precisely known; however, in the model, itis assumed to be constant. Obviously, it is impossibleto experimentally achieve that prestrain is constant forthe whole SMA column, since the SMA column hadnonconstant area. More precise numerical results couldbe expected if this fact was assumed in the model, butin this case, new sets of experiments would be neededto obtain values of elastic modulus, which is also afunction of the prestrain. Second, there were few diffi-culties with keeping the optimized column in ideallystraight shape during the prestraining; therefore, thereis a chance that initial nonzero curvature could be pres-ent in the SMA column, but it was not assumed in themodel.
Conclusion
This article reports on research work in the field ofcompression properties of SMAs during constrainedrecovery. Compressive force in an SMA column duringconstrained recovery is calculated as function of tem-perature for an arbitrary function of cross sectionalong the span of the SMA column with arbitraryshape of column’s cross section. The elastic modulus asfunction of temperature is calculated for the wholespan of the column with nonconstant cross section.Optimization of geometry is made for the columnwith a circular cross section and by choosing particu-lar shape of column (Figure 10), where our goal wasto obtain optimal length L1/2 Considering experimen-tal results, the equation for elastic buckling for thecolumn with nonconstant cross section was proposedand used to calculate the buckling force and tempera-ture. The calculated buckling force and temperatureshow good agreement with buckling experiments;however, possible modifications of the model are amatter of the work in future. The experimental buck-ling force of the optimal column is not much higherthan the buckling force of the constant column; there-fore, searching for an even more optimal shape of thecolumn is a matter of future work.
Figure 15. Ratio between buckling temperature of optimizedand nonoptimized column as function of L1/2 for experimentaland calculated results, respectively.
Figure 14. Ratio between buckling force Fb of optimized andnonoptimized column as function of L1/2 for experimental andcalculated results, respectively.
Figure 13. Calculated and measured buckling temperature Tb
as function of L1/2 for optimized and nonoptimized column.
Janez K et al. 75
at Narodna Univ Knjiznica on October 2, 2015jim.sagepub.comDownloaded from

References
Auricchio F and Lubliner J (1996) A generalized plasticityand shape-memory alloys. International Journal of Solidsand Structures 33: 991–1003.
Bazant Z and Cedolin L (1991) Stability of Structures. NewYork: Oxford University Press.
Brinson LC (1993) One-dimensional constitutive behavior ofshape memory alloys: Thermomechanic derivation withnon-constant material functions and redefined martensiteinternal variable. Journal of Intelligent Material Systems
and Structures 4: 229–242.Brinson LC and Huang MS (1996) Simplifications and com-
parisons of shape memory alloy constitutive models. Jour-nal of Intelligent Material Systems and Structures 7: 108–114.
Duerig TW, Melton KN, Stockel D, and Wayman CM (1990)Engineering Aspects of Shape Memory Alloys. London:Butterworth–Heinemann.
Duerig T, Pelton A and Stockel D (1999) An overview of niti-nol medical applications. Materials Science and Engineer-
ing: A 273–275: 149–160.Kato H, Inagaki N and Sasaki K (2004) A one-dimensional
modelling of constrained shape memory effect. Acta Mate-
rialia 52: 3375–3382.Kosel F and Videnic T (2007) Generalized plasticity and uniax-
ial constrained recovery in shape memory alloys. Mechanics
of Advanced Materials and Structures 14(1): 3–12.Lee HY and Jung JL (1999) A simulation study on the ther-
mal buckling behavior of laminated composite shells with
embedded shape memory alloy (SMA) wires. Composite
Structures 47: 463–469.Movchan AA and Sil’chenko LG (2003) Buckling of a rod
undergoing direct or reverse martensite transformation
under compressive stresses. Journal of Applied Mechanics
and Technical Physics 44(3): 442–449.Rahman MA, Qiu J and Tani J (2001) Buckling and post-
buckling characteristics of the superelastic SMA columns.
International Journal of Solids and Structures 38: 9253–
9265.Rahman MA, Qiu J and Tani J (2005) Buckling and post-
buckling characteristics of the superelastic SMA col-
umns—Numerical simulation. Journal of Intelligent
Material Systems and Structures 16: 691–702.Shanley FR (1957) Strength of Materials. New York:
McGraw-Hill.Sittner P, Vokoun D, Dayananda GN, Stalmans R (2000)
Recovery stress generation in shape memory Ti50Ni45Cu5thin wires. Metal Science and Engineering A 286: 298–311.
Stalmans R, Van Humbeeck J and Delaey L (1997) Genera-
tion of recovery stresses: Thermodynamic modelling and
experimental verification. Journal de Physique IV C5:
47–52.Timoshenko SP (1961) Theory of Elastic Stability. New York:
McGraw-Hill.Videnic T, Franc K, Viktor S and Miha B (2008) Biaxial
constrained recovery in shape memory alloy rings. Journal
of Intelligent Materials System and Structures 19(8):
861–874.
76 Journal of Intelligent Material Systems and Structures 23(1)
at Narodna Univ Knjiznica on October 2, 2015jim.sagepub.comDownloaded from