and surface ption characteristics eta1 oxi h temperature/67531/metadc780756/m2/1/high... ·...
TRANSCRIPT
LM=Ol KO54 May 4,2001
solubility and Surface ption Characteristics eta1 Oxi h Temperature
D.J. Wesotowski, M.L. Machesky, S.E. Ziemniak, C. Xiao, D.A. Palmer, L.M. Anovitz, P. Benezeth
E NOTICE This report was prepared as an account of work sponsored by the United States Government. Neither the United States, nor the United States Department of Energy, nor any of their employees, nor any of their contractors, subcontractors, or their employees, makes any warranty, express or implied, or assumes any legal liability or responsibility for the accuracy, completeness or usefulness of any information, apparatus, product or process disclosed, or represents that its use would not infringe privately owned rights.
SOLUBILITY AND SURFACE ADSORPTION CHARACTERISTICS OF METAL OXIDES TO HIGH TEMPERATURE. D.J. Wesolowski', M.L.MacheskyZ, S.E. Ziemniak3, C. Xiao4, D.A. Palmer', L.M. Anovitz' and P. Bhezeth', '(Oak Ridge National Laboratory, P.O. Box 2008, Oak Ridge, TN 37831-61 10, [email protected]), 2(Illinois State Water Survey, 2204 Griffith Dr, Champaign, IL 61820-7495), 3(Lockheed Martin Corp., P.O. Box 1072, Schenectady, NY), 4(BetzDearborn Div., Hercules, Inc., P.O. Box 3002, Trevose, PA 19053).
Introduction: The interaction of high temperature aqueous solutions with mineral surfaces plays a key role in many aspects of fossil, geothermal and nuclear energy production. This is an area of study in whiLh the subsurface geochemical processes that determind brine composition, porosity and permeability changes, reservoir integrity, and fluid flow rates overlap with the in- dustrial processes associated with corrosion of metal parts and deposition of solids in pipes and on heat exchanger surfaces. The sorption of ions on mineral surfaces is also of great interest in both the subsurface and "above ground" regimes of power production, playing a key role in sub- surface migration of contaminants (nuclear waste disposal, geothermal brine re-injection, etc.) and in plant operations (corrosion mitigation, migration of radioactive metals from reactor core to heat exchanger, etc.). In this paper, results of the solubility and surface chemistry of metal oxides relevant to both regimes are summarized.
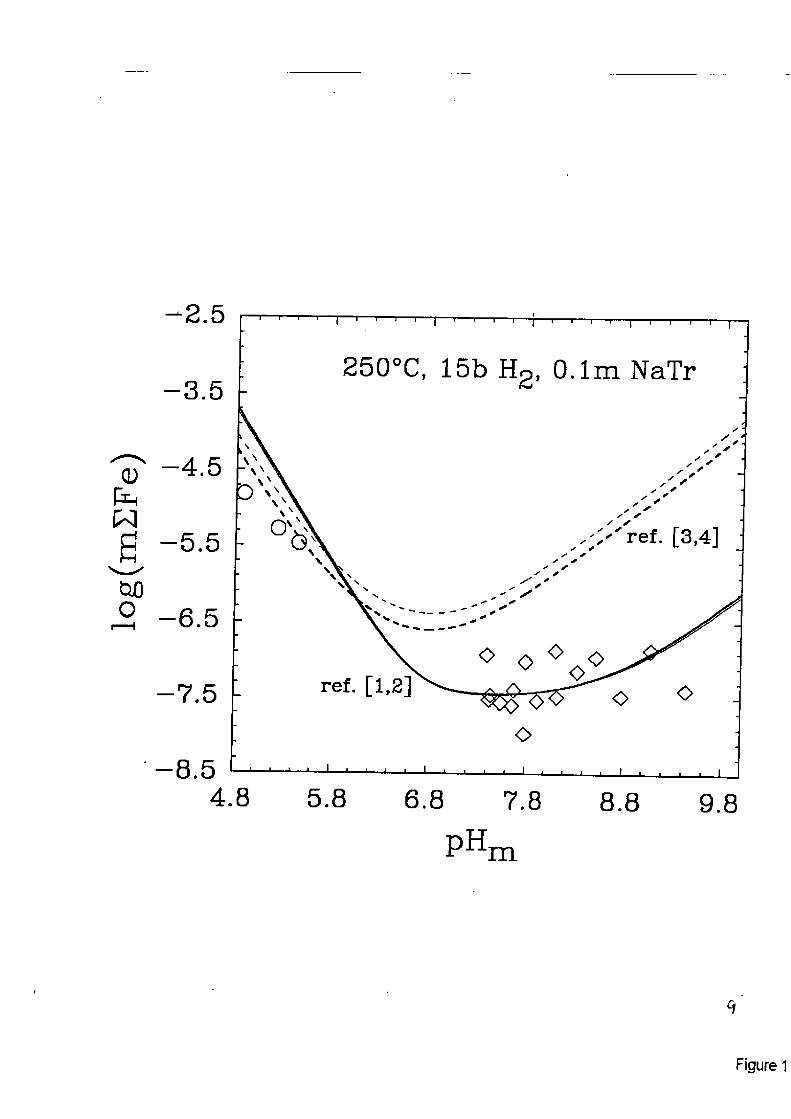
Solubility Studies: The equilibrium solubilities and dissolution mechanisms of magnetite and the Fe-Zn-Co chromite spinels have been investigated from room temperature to 300°C at pres- sures near vapor saturation and over a wide range of pH's. The total metaI content of aqueous solutions in equilibrium with these solids is rigorously related to the hydrolysis speciation of the metals in solution. Figure (1) shows the solubility of magnetite, Fe,O,, as determined by equili- brating powdered magnetite with an aqueous solution of sodium trifluoromethanesulfonate (NaTr, 0.1 molal ionic strength) at 25OOC under 15 bars of H, gas pressure, in one of OWL'S hydrogen-electrode concentration cells. These cells permit direct measurement of the hydrogen ion concentration (pH, = -Iog[H']) of the solution during a titration, which can last up to several weeks in duration. As can be seen, excellent agreement is obtained with the recent experimental studies of Trernaine and LeBlanc [l] and Ziemniak et al [2] near the solubility minimum, whereas the earlier experimental studies of Sweeton and Baes [3 J and the recent modeIing efforts of Shock et a1 [4] indicate anomalously high dissolved iron concentrations under neutral and high pH conditions. The shapes of the solubility profiles in Fig. (1) are dictated by the congru- ent, equilibrium dissolution of magnetite according to the reaction
1/3Fe,0,,3 + 2H', + 1!3H,,, w Fe2+aq + 4/3H,O
together with the hydrolysis of ferrous iron in solution via the stepwise reactions (y = 1-3)
Fe2+Bq + yH,O G Fe(OH),2-Y,q f. yH',,
Ferric iron species we insignificant in soIution at this hydrogen gas pressure. At lower pH and temperature, magnetite appears to dissolve by &I incongruent dissolution mechanism
1
Fe30,,$ + 2Waq Fe203,s + Fe2’,,, + H,O (3 )
producing well-crystallized hematite (Fe,O,) as a solid phase, in addition to magnetite (Figure 2). This has been confirmed by X-ray diffraction analysis of the m products. The closed symbols in Fig. (2) represent samples collected during “forward” titrations, in which an NaOH + NaTr solution is titrated into a more alkaline NaTr + HTr solution. The open symbols represent the results of the associated “reverse” titration, in which the pH was shifted back to a more acidic condition by the addition of an NaTr I- HTr titrant. The heavy solid curve in Fig. (2) is the equi- librium concentration of iron predicted by reactions (2,3) above, using the aqueous iron specia-
‘ tion model of [2], and neglecting the fact that hematitk is thermodynamically unstable relative to magnetite under such strongly reducing conditions. Clearly, these results indicate that reaction (3) is metastably reversible under these conditions, in experiments lasting up to several weeks.
For the chromite spinels, Ziemniak et a2 [SI have observed that total iron concentrations in aqueous solutions in apparent equilibrium with Fe(II)Cr(III),O, exceeded the total dissolved chromium by several orders of magnitude, dictating that a residual, Cr-rich phase is left on the surface of the starting material. These authors argued that y-CrOOH ‘is the residual phase formed, and presented equations describing the free energies, as a function of temperature (25- 290”C), for the reactions
CrOOH, $. B20 e Cr(0H)3,, (4)
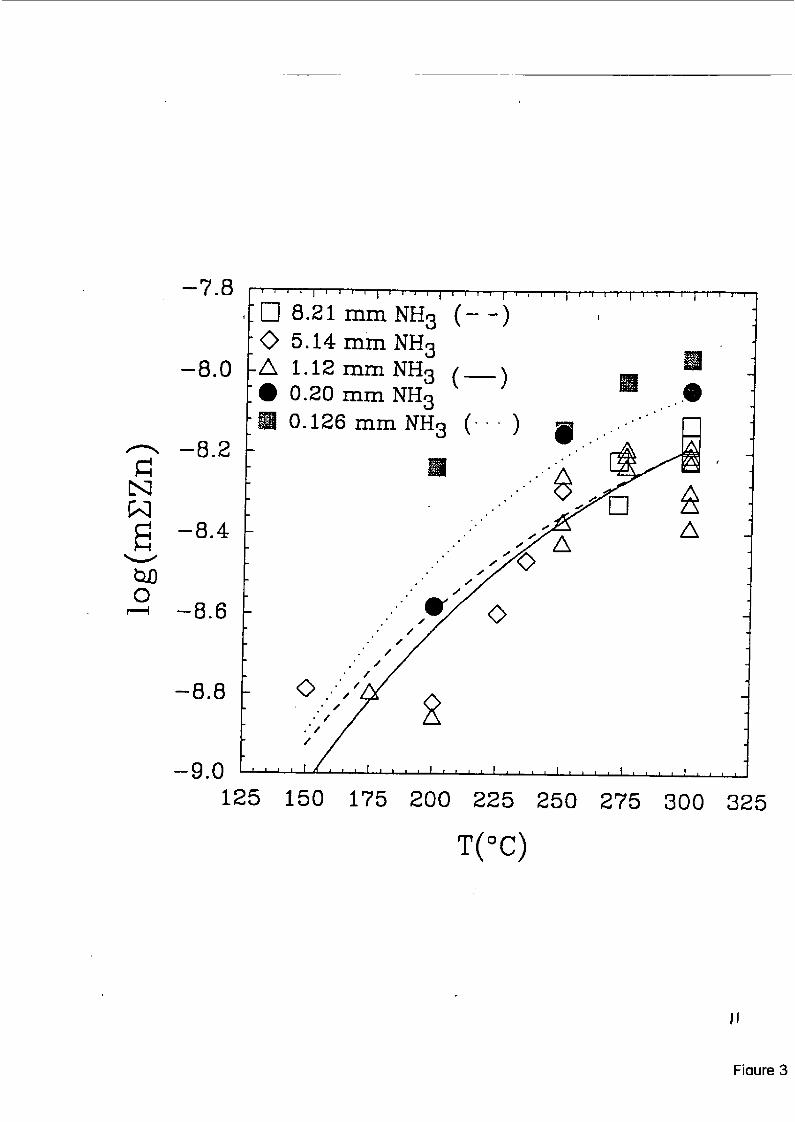
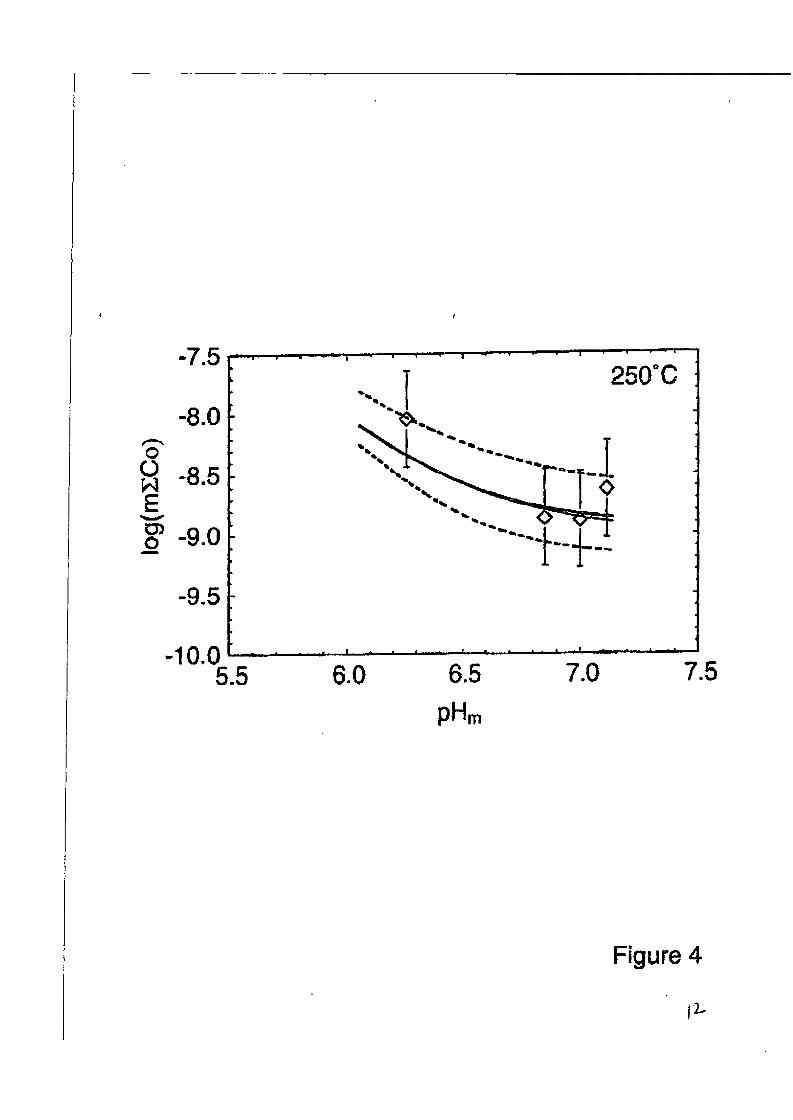
At near-neutral to basic pH’s, these are the only two aqueous chrornium(II1) species needed to describe the solubility of y-CrOOH [5]. Studies at ORNL have now been completed on the solu- biIities of ZnCr,O, and CoCr,O, over a similar pH and temperature range, and representative re- sults are shown in Figures (3,4). These studies utilized a flow-through, packed-column celI, con- ceptually similar to that used by Ziemniak et al [5], but with much lower flow rates, 1ength:diameter ratios, and longer solution residence times than in the earlier study. In these studies, it was found that equations (4,5), using the free energy functions of [ 5 ] , accurately pre- dicted the total chromium concentrations in solution in equilibrium &th both phases, with chro- mium levels in the sub-nanomoial range and only weakly-dependent on pH or temperature. Furthermore, as was found in the case of FeCr,O, [5], the’total divalent metal concentration in solution greatly exceeded that of the totd chromium. The divalent metal concentrations could be accurately predicted from the reactions
Me(II)Cr20,,s + 2H”, e Me2’, + 2CrOOH, (6)
and the metal hydrolysis reactions
+ yH,O e Me(OH)tbY aq +- yH’ (7)
where Me stands for Zn or Co and y ranges fiom 1 to 3. Data for the Zn” hydrolysis reactions were taken from BknCzeth et al. [6] and for Co2’ from Ziemniak et al 171. There is substantial
2
scatter in the observed total Zn and Co concentrations solubilities of these metals are in the parts-per-trillion
shown in Figures (3,4), but note that the range (ppt) in equilibrium with their re-
spective chromites, Thus, analytical uncertainty becomes a major factor, due to contamination as well as detection limits. Magnetic-sector ICP-MS proved to be the most reliable method of analysis of Zn and Co at these levels, although multiple-injection graphite-furnace AA (Zeeman focus) and evaporative preconcentration techniques couId also be used. For chromium analyses at the picomolal levels predicted from reactions ( 4 3 , a new chemiluminescence technique was developed [8], which proved equivalent to graphite furnace and ICP-MS methods, but which used much less expensive equipment. Even sub-ppt levels of Cr could be detected with 10-30% reproducibility by chemiluminedcence. I
Surface Charge and Ion Adsorption Studies: Terminal oxygen atoms at metal oxide surfaces react with water, forming hydroxylated sites that impart a pH-dependent surface charge. The as- sociation of solution counterions with this modified surface results in. a complex structure, termed the Electrical Double Layer (EDL). Surface charge influences colloid transport and floc- culation, adsorption of ions from solution, mineral dissolutiordprecipitation rates, growth mor- phologies, and other interfacial phenomena. Hydrogen-electrode concentration cells (HECC's) have been used at ORNL to conduct potentiometric titrations of H' (or OH") adsorption and de- sorption on rutile (TiO,) and magnetite (Fe,O,) powder surfaces in 0.01 to 1.0 molal NaCl, tet- ramethylammonium chloride (TMAC1) and NaTr media from 25 to 290°C at pH's of 3 to 10 [9- 111.. These are the first such direct potentiometric studies of the protonation of mineral surfaces ever performed at temperatures greater than 95°C.
Because H' (andor OR) binding with terminal oxygen atoms is considered the surface- charge-determining reaction for oxide particles in aqueous solutions, potentiometric titrations of powdered minerals under conditions of known solution and solid masses and surface areas, known titrant compositions and masses, and continuously-monitored pH,,, allow determination of the proton-induced surface charge. The difference between the measured pH, and that calculated soleIy from a mixture of the starting and titrant solutions, is computed in terms of micromoles o f exces$ H' in solution per square meter of mineral surface exposed to the solution. This is then converted to surface charge density via the relationship
CT,, = oH = -F(pmoles excess H+)/m2
where F is the Faraday constant (0.0965 Coulombdpequivalent). The negative sign indicates that a positive value of excess H' in solution corresponds to net proton release from the surface, whereas a deficit of H' in solution results from proton uptake by the solid, resulting in positive surface charge. Because this proton-induced surface charge is confined to a fixed plane, positive or negative surface charge buildup is inhibited by electrostatic repulsion between adjacent, like- charged sites on the surface. Counterions of opposite charge in the aqueous phase partially shield this surface charge build-up, resulting in the EDL. This effect gives rise to the typical re- lationship of oxide surface titrations at constant temperature, but for various concentrations of an electrolyte, such as NaCI, KNO,, etc., as shown for rutile at 100°C in NaCl and tetramethylam- monium (TMA) chloride solutions in Figure (5). The pH plotted in this and subsequent figures is converted to the activity scale using the activity coefficient model discussed in [lo]. The
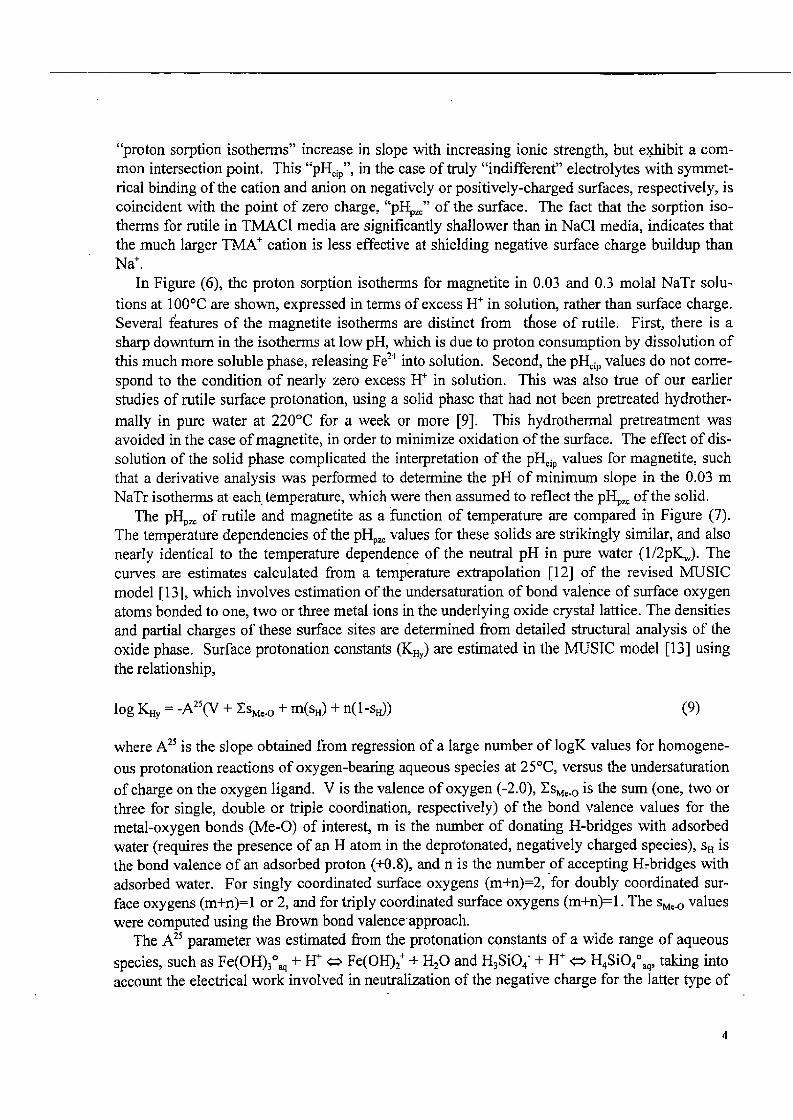
‘proton sorption isotherms’’ increase in slope with increasing ionic strength, but exhibit a com- mon intersection point. This “pHCip”, in the case of truly “indifferent” electrolytes with symmet- rical binding of the cation and anion on negatively or positively-charged surfaces, respectively, is coincident with the point of zero charge, “p%zc” of the surface. The fact that the sorption iso- therms for rutile in TMACl media are significantly shallower than in NaCl media, indicates that the much larger TMA’ cation is less effective at shielding negative surface charge buildup than Na’.
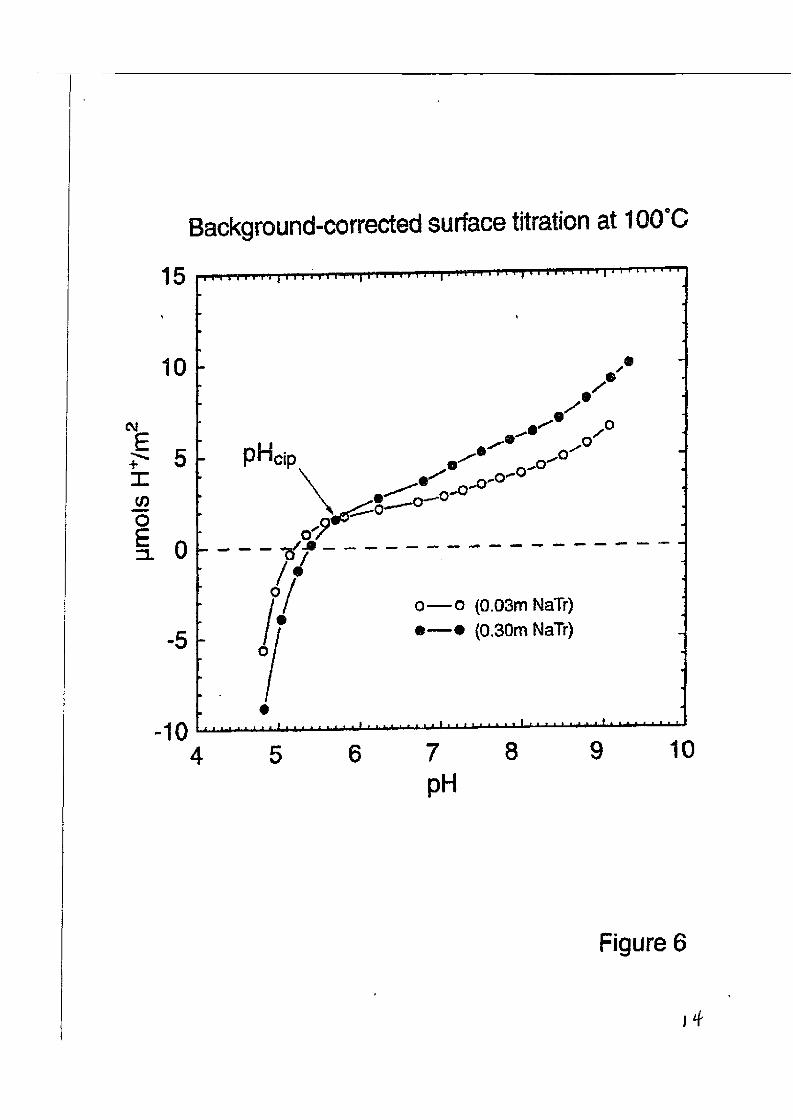
In Figure (6), the proton sorption isotherms for magnetite in 0.03 and 0.3 mold NaTr soh- tions at 100°C are shown, expressed in terms of excess €4’ in solution, rather than surface charge. Several features of the magnetite isotherms are distinct from those of rutile. First, there is a sharp downturn in the isotherms at low pH, which is due to proton consumption by dissolution of this much more soluble phase, releasing Fe2’ into soIution. Second, the pHci, vaIues do not corre- spond to the condition of nearly zero excess H’ in solution. This was also true of our earlier studies of rutile surface protonation, using a solid phase that had not been pretreated hydrother- mally in pure water at 220°C for a week or more [9], This hydrothermal pretreatment was avoided in the case of magnetite, in order to minimize oxidation of the surface. The effect of dis- solution of the solid phase complicated the interpretation of the pHcjp values for magnetite, such that a derivative analysis was performed to determine the pH of minimum slope in the 0.03 m NaTr isotherms at each. temperature, which were then assumed to reflect the pH,, of the solid.
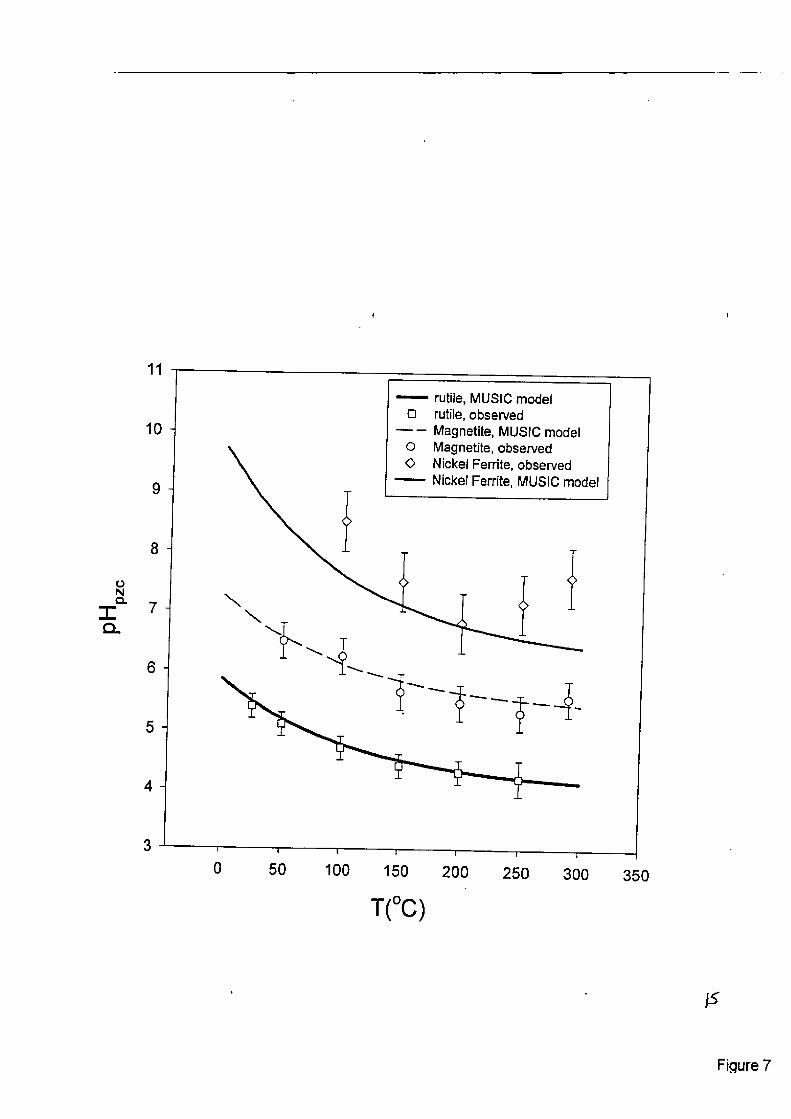
The p%,, of rutile and magnetite as a ‘function of temperature are compared in Figure (7). The temperature dependencies of the p€$= values for these solids are strikingly similar, and also nearly identica1 to the temperature dependence of the neutral pH in pure water (1/2pL). The curves are estimates calculated from a temperature extrapolation [12] of the revised MUSIC model [13], which involves estimation of the undersaturation of bond valence of surface oxygen atoms bonded to one, two or three metal ions in the underlying oxide crystal lattice. The densities and partial charges of these surface sites are determined from detailed structural analysis of the oxide phase. Surface protonation constants (KHJ are estimated in the MUSIC model [13] using the relationship,
log KHy = -A25(V + + m(sH) + n(l-sJ)
where A2’ is the slope obtained from regression of a large number of logK values for homogene- ous protonation reactions of oxygen-bearing aqueous species at 25”C, versus the undersaturation of charge on the oxygen ligand. V is the valence of oxygen (-2+0), Cs,,, is the sum (one, two or three for single, double or triple coordination, respectively) of the bond valence values for the metal-oxygen bonds (Me-0) of interest, m is the number of donating H-bridges with adsorbed water (requires the presence of an H atom in the deprotonated, negatively charged species), s, is the bond valence of an adsorbed proton (+0.8), and n is the number of accepting H:bridges with adsorbed water, For singly coordinated surface oxygens (m+n)=2, ‘for doubly coordinated sur- face oxygens (m+n)=l or 2, and for triply coordinated surface oxygens (m+n)=l , The s , , ~ values were computed using the Brown bond valence.approach.
The A25 parameter was estimated from the protonation constants of a wide range of aqueous species, such as Fe(OH),O, + P e Fe(OH),’ + H 2 0 and €€$io4’ + H’ a H4Si040aq, taking into account the electrical work involved in neutralization of the negative charge for the latter type of
4
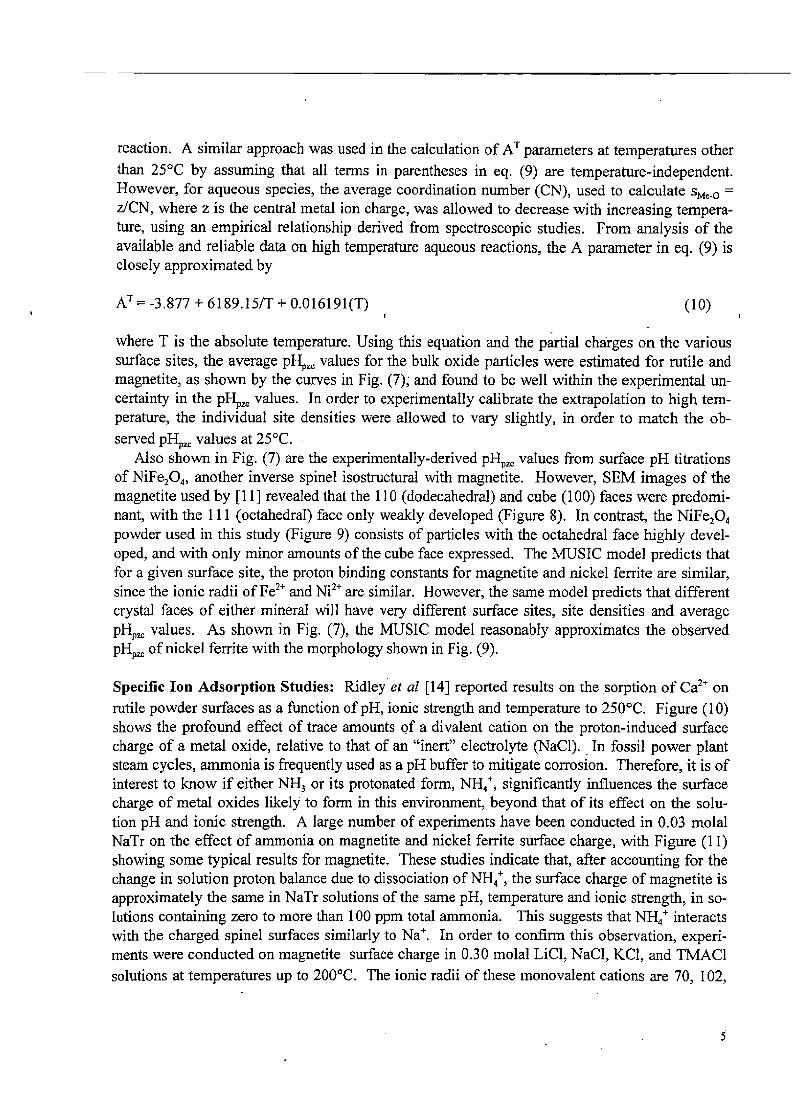
reaction. A similar approach was used in the calculation of AT parameters at temperatures other than 25°C by assuming that all terms in parentheses in eq. (9) are ternperature-independent. However, for aqueous species, the average coordination number (CN), used to calculate sMc-o = dCN, where z is the central metal ion charge, was allowed to decrease with increasing tempera- ture, using an empirical relationship derived from spectroscopic studies. From analysis of the available and reliable data on high temperature aqueous reactions, the A parameter in eq. (9) is closeIy approximated by
AT = -3.877 + 6189.15m + 0.016191(T) I
where T is the absolute temperature. Using this equation and the p h i a l charges on the various surface sites, the average p€$, values for the bulk oxide particles were estimated for rutile and magnetite, as shown by the curves in Fig. (7); and found to be well within the experimental un- certainty in the p q x values. In order to experimentally calibrate the extrapolation to high tem- perature, the individual site densities were allowed to vary slightly, in order to match the ob- served pH,, values at 25°C.
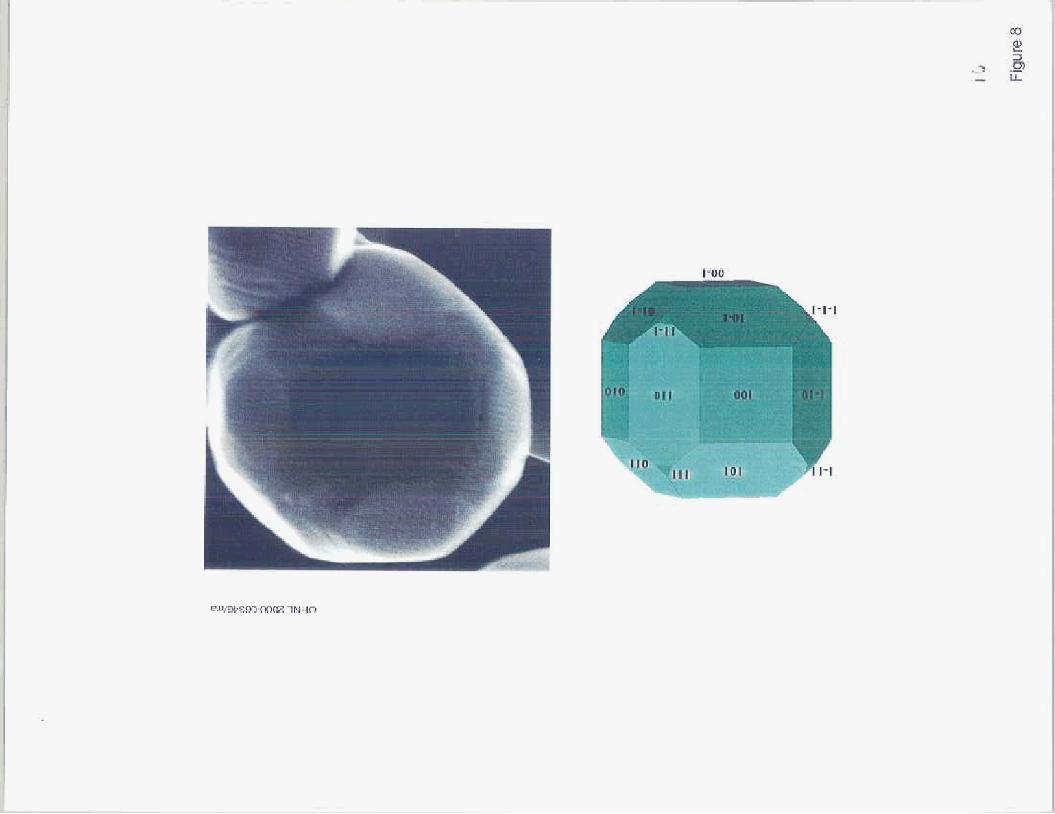
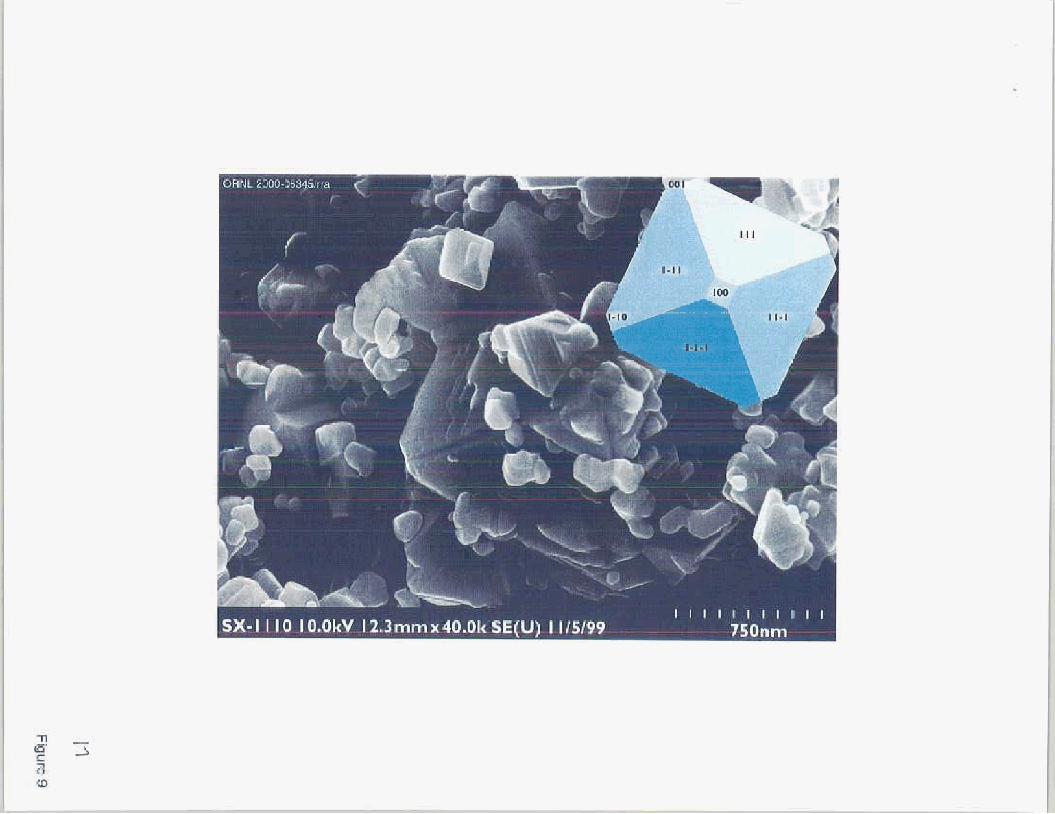
Also shown in Fig. (7) are the experimentalIy-derived pH,,= values from surface pH titrations of NiFe,O,, another inverse spinel isostructural with magnetite. However, SEM images of the magnetite used by [l 11 revealed that the 1 IO (dodecahedral) and cube (100) faces were predomi- nant, with the 1 11 (octahedral) face only weakly developed (Figure 8). In contrast, the NiFe,O, powder used in this study (Figure 9) consists of particles with the octahedral face highly devel- oped, and with only minor amounts of the cube face expressed. The MUSIC model predicts that for a given surface site, the proton binding constants for magnetite and nickel ferrite are similar, since the ionic radii of Fe2’ and Ni2+ are simiIar. However, the same model predicts that different crystal faces of either mineral will have very different surface sites, site densities and average pH,, values. As shown in Fig. (7), the MUSIC model reasonably approximates the observed pH, of nickel ferrite with the morphology shown in Fig. (9).
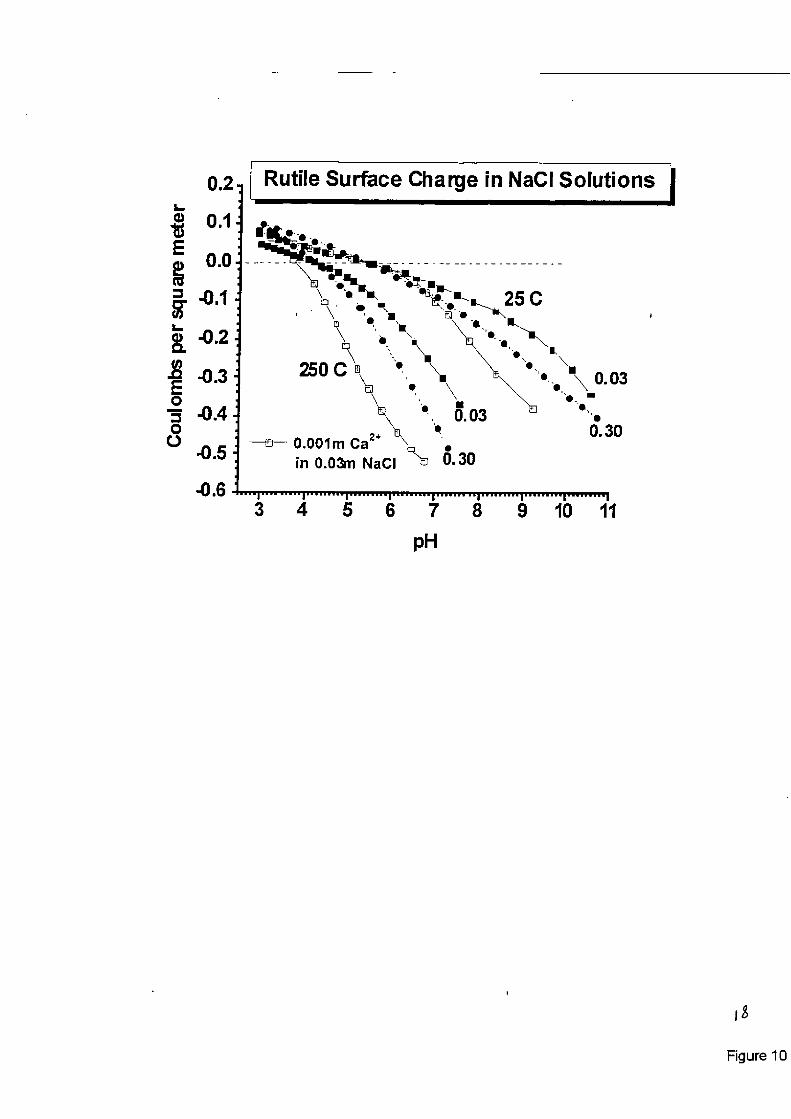
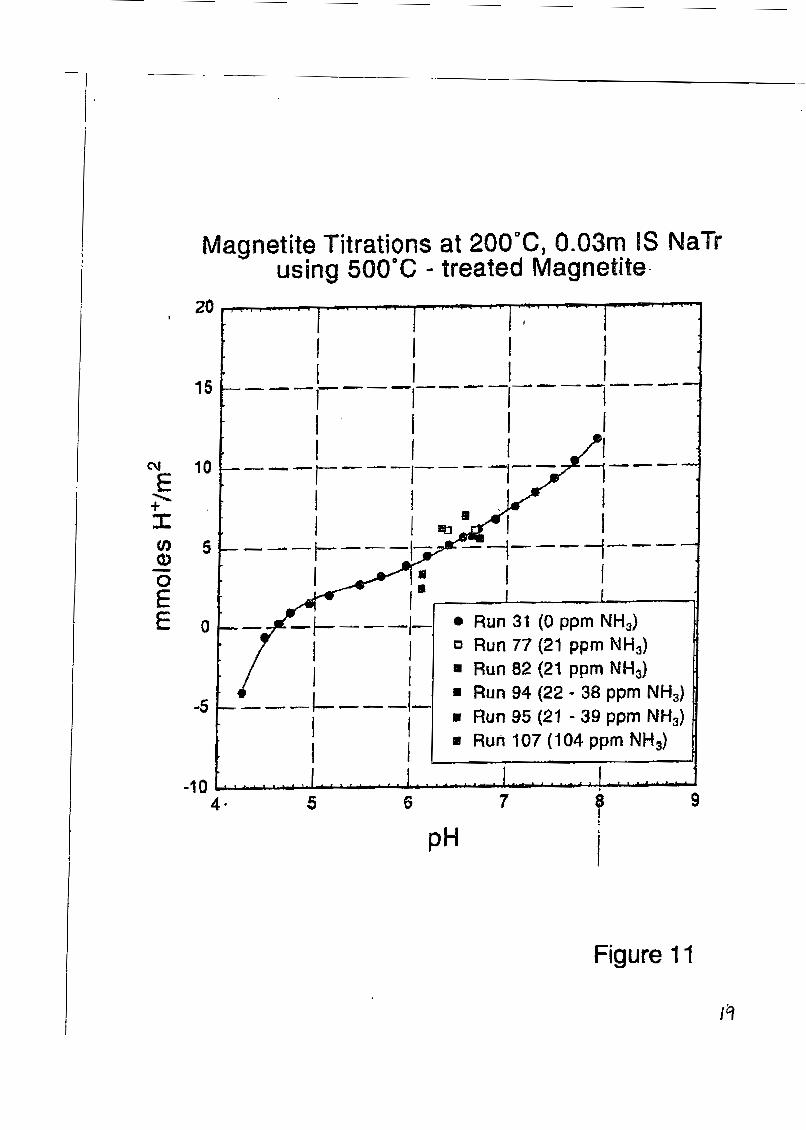
Specific Ion Adsorption Studies: Ridley et a1 [14] reported results on the sorption of Ca2+ on rutile powder surfaces as a function of pH, ionic strength and temperature to 250°C. Figure (1 0) shows the profound effect of trace amounts of a divalent cation on the proton-induced surface charge of a metal oxide, relative to that of an ‘‘inert” eIectrolyte (NaC1). In fossil power plant steam cycles, ammonia is frequently used as a pH buffer to mitigate corrosion. Therefore, it is of interest to know if either NH, or its protonated form, NH;, significantly influences the surface charge of metal oxides likely to form in this environment, beyond that of its effect on the solu- tion pH and ionic strength. A large number of experiments have been conducted in 0.03 molal NaTr on the effect of ammonia on magnetite and nickel ferrite surface charge, with Figure (1 I) showing some typical results for magnetite. These studies indicate that, after accounting for the change in solution proton balance due to dissociation of NH;, the surface charge of magnetite is approximately the same in NaTr solutions of the same pH, temperature and ionic strength, in so- lutions containing zero to more than 100 ppm total ammonia. This suggests that NH,+ interacts with the charged spinel surfaces similarly to Na’. In order to confirm this observation, experi- ments were conducted on magnetite surface charge in 0.30 molal LiC1, NaC1, KCI, and TMACl solutions at temperatures up to 200°C. The ionic radii of these monovalent cations are 70, 102,
5
138 and 280 pkometers, respectively, whereas NH; has an ionic radius of 148 pm. These re- suIts indicated that negative surface charge density on magnetite increases strongly for a given pH, temperature and ionic strength in LiCl solutions and decreases moderately in TMACl solu- tions, relative to NaCl and KC1 solutions which exhibited nearly identical surface charge. Since NH,‘ is much closer in radius to IS+ than TMA’, these results tend to confirm the observation that NH,’ interaction with spinel surfaces can be modeled by Na’ or K’ interactions. It is not practi- cal to conduct surface titrations at very high concentrations of ammonia, since proton balance calculations become intractably uncertain.
Conclusions: These studies demonstrate the complexity of mixed-metal bxide solubility and surface charge characteristics in natural and industria1 hydrothermal solutions. The temperature- extrapolated MUSIC model [12] provides a powerful approach for estimating the surface charge of individual crystal faces of metal oxides at high temperature, but more studies are needed on a variety of metal oxides with different atomic structures and crystal morphologies. Also, the in- congruent dissolution and precipitation mechanisms of mixed-metal oxides must be further in- vestigated in order to develop a reliable predictive capability of elemental transport, permeability changes and phase transformations in hydrothermal regimes.
Acknowledgment: This research was sponsored by the US, Department of Energy, under con- tract DE-AC05-000R22725, Oak Ridge National Laboratory, managed by and operated by UT- Battelle, LLC.
References: [I] P.R. Tremahe and Jacques C. LeBlanc, “The solubiIity of magnetite and the hydrolysis and
oxidation of Fez+ in water to 3OO0C”, .l Sol. Chem., Vol. 9, pp. 415442, 1980. [Z] S.E. Ziemniak, M.E. Jones and K.E.S. Combs, “Magnetite soIubility and phase stability in
alkaline media at elevated temperatures”, J. Sol. Chem., Vol. 24, pp. 837-887, 1995. [3] F.H. Sweeton and C.F. Baes, Jr., “The solubiIity of magnetite and hydrolysis of ferrous ion in
aqueous solutions at elevated temperatures”, J Chem. Therm., Vol. 2, pp. 479-500, 1970, [43 E.L. Shock, D.C. Sassani, M. Willis, and D.A. Sverjensky, “Inorganic species in geologic
fluids: CorreIations among standard molal thermodynamic properties of aqueous ions and hydroxide complexes” Geochim. Cosmochim. Acta, Vol. 61, pp. 907-950, 1997.
[5j S.E. Ziemniak, M.E. Jones and K.E.S. Combs, “Solubility and phase behavior of Cr(II1) oxides in alkaline media at elevated temperatures”, J. Sol. Chem., Vol. 27, pp. 33-66, 1998.
[ 6 ] P. BBnkzeth, D.A. Paher, and D.J. Wesolowski, “The solubility of zinc oxide in 0.03 m NaTr as a hnction of temperature, with in situ pH measurement”, Geochim. Cosmochim. Acta, v. 63, pp 1571-1586, 1999.
[7] S.E. Ziemniak, M.A. Goyette and K.E.S. Combs, “Cobalt(I1) oxide solubility arid phase stability in alkaline rne- dia at elevated temperatures”, J. Sol. Chem., v. 28, pp. 809-835, 1999.
[SI C. Xiao, D.W. King, D.A. Palmer and D.J. Wesolowski, “Study of enhancement effects in the chemilumines- cence method for Cr(II1) in the ng 1-I range”, Anal. Chim. Ada, v. 415, pp. 209-2 19,2000.
[93 M.L. Machesky, D.A. Palmer and D.J. Wesolowski, “Hydrogen ion adsorption at the rutile-water interface to 250aC”, Geochim. Cosmochim. Acta, v. 58, pp. 5627-5632, 1994.
[IO] M.L. Machesky, D.J. Wesolowski and D.A. Palmer, “Potentiometric titrations of rutile suspensions to 250aC”, J. Colloid Interface Sci., v. 200, pp, 298-309, 1998.
[ l I ] D.J. Wesolowski, M.L. Machesky, D.A. Palmer and Lawrence M. Anovitz, “Magnetite surface charge studies to 290°C from in situ pH titrations”, Chem. Geology, v. 167, pp. 193-229,2000.
[12] M.L. Machesky, D.J. Wesolowski, D.A. Palmer and M.K. RidIey, “On the temperature dependence of intrinsic surface protonation equilibrium constants: an extension of the revised MUSIC modeI”, J. Coiioid hteerface Sci. (in press).
6

[13] T. Wiemstra, P. Venema and W.H. Van Riemsdijk, “Intrinsic proton affinity of reactive surface groups of metal (hydr)oxides: n e bond valence principle”, J. ColloidInter-ice Sci., v. 184, pp. 680-692, 1996.
[ 141 M.K. Ridley, M.L. Machesky, D.J. Wesolowski and D.A. Palmer,”Ca(II) adsorption at the rutile-water inter- face: A potentiometric study in NaCl media to 250”C”, Geochim. Cosmochim. Actu, v. 63, pp. 3087-3096, 1999.
7
Figure Captions:
Figure 1. Experimental measurements of the solubility of magnetite in O.lm NaTr at 250T (open symboIs), compared with solubilities calculated from the results of [ 1-41.
Figure 2. Experimental measurements of the solubility of magnetite in 0. lm NaTr at 1 5OoC, compared with solubilities calculated fiom the results of [ 1-41, FilIed symbols represent samples taken during forward titration to higher pH values. Open symbols represent samples taken during the back titration to lower pH values.
Figure 3. Total zinc in solution sampled downstream fiom a packed column of ZnCr,O, at 100 bars pressure and ternpeiatures ranging fiom 150 to 3OO0C+ Solution pH was buffered by addition of NH,, as indicated. Solid curves were computed fiom equations (6,7) as dis- cussed in the text.
Figure 4. Total cobalt in solution in equilibrium with CoCr,O, at 100 bars and 25OoC, with pH, controlled by ammonia addition. Open symbols and error bars represent sample analyses and their uncertainties. The solid curves represent solubilities calculated from equations (6,7) and dashed curves indicate uncertainty range in the thermodynamic quantities used to calculate the solubilities.
Figure 5, Experimentally-determined surface charge of rutile in NaCl and TMAC1,media at the ionic strengths indicated, and 100°C. Smooth curves represent model fits to the data, as discussed by [lo].
Figure 6. Magnetite surface protonation isotherms at 100°C in 0.03 and 0.30 molal NaTr soh- tions as a function of pH.
Figure 7. Observed p€-$= values of rutiIe, magnetite and nickel ferrite (open symbols), compared with calcuIated values fiom a temperature extrapolation of the revised MUSIC mode1 [ 12,13 3 .
Figure 8. SEM image of a magnetite particle used in the study of [ll], compared with the ex- pected form of a magnetite crystal with the dodecahedral (1 lo), cube (100) and octahe- dral (1 1 1) faces present in the proportions 50:40: 10.
Figure 9. SEM image of nickel ferrite particles used in this study, compared with the expected form of a nickel ferrite crystal with the dodecahedral (1 lo), cube (100) and octahedral ( I 1 1) faces present in the proportions 0: 10:90.
Figure 10. Surface charge of rutile in 0,03 and 0.3 molal NaC1, and in solutions at 0.03 molal ionic strength (NaCl) containing 0.001 molal CaCl,, at 25 and 25OoC, showing the com- bined effects of temperature, ionic strength arid specific ion binding on the surface charge development. as a function of pH. Intersections of the isotherms in pure NaCl media mark the p€&, values at 25 and 25OOC.
Figure 11, Proton sorption isotherm of magnetite in 0.03 molal NaTr (black circles and solid curve), compared with identical solutions containing 21-104 ppm total ammonia at the same ionic strength.
.
-2.5
-3.5
-4.5 n
F.( O -6.5
-7.5
' -8.5 4.8 5.8 6.8 7.8 8.8 9.8
4
Figure 1

-1
-2
-3 -4
-5
-6
-7
-8
-9
-1 0
h
4.5 5.5 6.5 7.5 8.5 9.5
Figure 2
G N W
hD E u
-7.8
-8.0
-8.2
-8.4
-8.8
-8*6 I -9.0 ~ ~ ' ' ' r ~ ~ ' " ' ' ' ' ' ' ' ' ' ' ' ' ' " ' ~ ' ' ~ ' ' ' ' ~ ' ' ' "
125 150 175 200 225 250 275 300 325
I I
Fiaure 3
n
8 w E W
01 0 -
-7.5
-8.0
-8.5
-9.0
-9.5
-1 0.0 5.5 6.0 6.5 7.0 7.5
Figure 4
IL

I I
1
P fl
Figure 5
15 4
IO
5
0
-5
Background-corrected surface titration at 1 OO'C
-1 8 4
0-0 (0.03m NaTr) @-e (0.30m NaTr)
5 6 7 8 PH
9 IO
Figure 6
I C
E
8
6
5
4
3 0
I I
\ - rutile, MUSIC model D rutile, observed
-- Magnetite, MUSE model 0 Magnetite, observed 0 Nickel Ferrite, observed
Nickel Ferrite, MUSIC model - T
I 1 1 I I I i
50 100 150 200 250 300 350
I
Figure 7
,A . .. .
.. ,
I
I
I
0.2- I
Rutile Surface Charge in NaCI Solutions
0.30
L
18
Figure t O
0.1
0.0;-
u.1
4.2
4.3 1 4.4
-0.5
4.6 '
Magnetite Titrations at 280°C, 0.03m IS NaTr using 500°C - treated Magnetite-
---
---
a Run 31 (0 ppm NHJ Run 77 (21 ppm NH3) Run 82 (21 ppm NH,) ' Run 94 (22 - 38 PPITI NHJ II Run 95 (21 - 39 pprn NH3)
!
PH i
Figure I 1