and the photochemistry of non-polar interstellar ice … · 2 abstract the infrared spectra of co...
TRANSCRIPT
The 2140 cm-1 (4.673 _tm) Solid CO Band: The Case for Interstellar 02 and N2
and the Photochemistry of Non-Polar Interstellar Ice Analogs
Jamie Elsila 1, Louis J. Allamandola 2, and Scott A. Sandford
NASA-Ames Research Center, MS 245-6
Moffett Field, CA 94035
Submitted to : The Astrophysical Journal, June 3, 1996
Suggested Running Title: Interstellar CO, N2, 02, and CO2 Ices
Keywords: interstellar CO
interstellar N2
interstellar 02
interstellar chemistry
interstellar ices
cometary ices
spectroscopy, infrared
photochemistry
1.- Current Address: 1411 Three Mile, Grosse Pointe Park, MI, 48230
2 - Author to whom correspondence should be addressed.
https://ntrs.nasa.gov/search.jsp?R=20020039165 2018-07-17T19:34:40+00:00Z
2
ABSTRACT
The infrared spectra of CO frozen in non-polar ices containing N2, CO2, 02, and H20, and
the UV photochemistry of these interstellar/precometary ice analogs are reported. The spectra are
used to test the hypothesis that the narrow 2140 cm-1 (4.673 I.tm) interstellar absorption feature
attributed to solid CO might be produced by CO frozen in ices containing non-polar species such as
N2 and 02. It is shown that mixed molecular ices containing CO, N2, 02, and CO2 provide a very
good match to the interstellar band at all temperatures between 12 and 30 K both before and after
photolysis. The optical constants (real and imaginary parts of the index of refraction) in the region
of the solid CO feature are reported for several of these ices.
The best matches between the narrow interstellar band and the feature in the laboratory
spectra of non-polar ices are for samples which contain comparable amounts of N2, 02, CO2, and
CO. Coadding the CO band from an N2:O2:CO2:CO = 1:5:1/2:1 ice with that of an H20:CO = 20:1
ice provides an excellent fit across the entire interstellar CO feature. The four component, non-
polar ice accounts for the narrow 2140 cm -1 portion of the feature which is associated with
quiescent regions of dense molecular clouds. Using this mixture, and applying the most recent
cosmic abundance values, we derive that between 15-70% of the available interstellar N is in the
form of frozen N2 along several lines of sight towards background stars. This is reduced to a
range of 1-30% for embedded objects with lines of sight more dominated by warmer grains. The
cosmic abundance of O tied up in frozen 02 lies in the 10-45% range toward background sources,
and it is between 1 and 20% towards embedded objects. The amount of oxygen tied up in frozen
CO and CO2 can be as much as 2-10% toward background sources and on the order of 0.2-5% for
embedded objects. Similarly, 3 to 13% of the carbon is tied up in frozen CO and CO2 toward field
stars, and 0.2 to 6% toward embedded objects. These numbers imply that most of the N is in N2,
and a significant fraction of the available O is in 02 in the most quiescent regions of dense clouds.
As is well known, very weak infrared activity of the N2 and 02 stretching fundamental is
induced in these types of ices. N2 produces an absorption feature at 2328 cm-I (4.296 pm) and 02
produces an absorption feature near 1549 cm-I (6.456 pm).
Ultraviolet photolysis of these ices produces a variety of photoproducts including CO2, N20,
03, CO3, HCO, H2CO, and possibly NO and NO2. XCN is not produced in these experiments,
placing important constraints on the origin of the enigmatic interstellar XCN feature. N20 and
CO3 have not been previously considered as interstellar ice components, but can be searched for
using their strongest fundamental bands which fall near 2235 and 2041 cm -1 (4.474 and 4.900
_m) respectively. These bands fall at frequencies that are inaccessible to ground-based
observatories but which are currently being explored by the ISO satellite.
1. INTRODUCTION
CO is the most abundant diatomic interstellar molecule after H2. Following its discovery in
the interstellar gas by Wilson, Jefferts, and Penzias in 1971, CO quickly became the most studied
of gas phase interstellar molecules. Indeed, it has proven to be a very powerful diagnostic of
conditions in a wide variety of astronomical environments and has given great insight into structure
on a galactic scale (Latter et al. 1996). Although the possibility that CO might also be frozen on
interstellar grains and in comets had been postulated for some time (c.f. Herzberg 1955; Ewing,
Thompson, & Pimentel 1960), the serious study of interstellar solid state CO had a slow start.
The discovery of infrared absorption in the vicinity of the feature now attributed to CO frozen
on grains was made by Soifer et al. (1979) in the spectrum of the embedded protostar W33A. Due
to insufficient resolution, and the fact (then unknown) that this region of the spectrum of W33A is
dominated by the XCN band centered at 2165 cm-I (4.619 I.tm), the authors reasoned that the
absorption probably arose from CO, either in the gas or solid state, but they could not account for
the apparent peak shift with respect to the expected position of about 2140 cm-1 (4.673 !am). The
first comparison between this spectrum (and the spectra of other embedded objects) with the
spectrum of an interstellar ice analog containing CO was made by Hagen, Allamandola, and
Greenberg (1980). In discussing the interstellar spectra, they pointed out that, "The very important
null gap (missing Q branch) region between 2135 and 2140 cm -1 is not yet available at very high
resolution. It is difficult to overemphasize the importance of this region because the mid-infrared
4
spectrumof aheterodiatomicmoleculesuchasCOis verydifferentdependingonwhetheror not the
moleculeis in thegasor solidphase."Thisultimatelyledto thefirst highresolutionobservations
of W33A in thisspectralregionandtheclear-cutdetectionof COfrozenon interstellargrainsby
Lacyetal. (1984). Theobservationsshowedthatthelow resolutionfeatureinW33A detectedby
Soiferet al. consistedof threebands:astrong,verybroadabsorptionat2165cm-l (4.619p.m,
FWHM = 28cm-l), aweak,narrowbandat 2140cm-1(4.673Bm,FWHM = 5 cm-1),andaneven
weaker,broadfeatureat 2135cm-1(4.684ktm,FWHM = 12cm-1). [TheseFWHM arethefull
width at halfmaximumof thebandswhenplottedin absorbance,oropticaldepth.] Basedon
comparisonswith thespectraof laboratoryanalogs,Lacyet al.showedthatthe2135and2140cm°1
bandsarisefrom solidCO,andthatthe2165cm-1bandwasdueto theCN stretchin an
unidentifiedspeciesdesignatedXCN.
Followingthiswork, thestudyof solidstateinterstellarCObeganin earnest.Overthenext
fewyearstheCOfeaturewasdetectedalongseverallinesof sightthroughtheTaurusdarkcloud
(Whittet,Longmore,& McFadzean1985;Whittetet al. 1989)andtowarda numberof protostellar
objectsembeddedin denseclouds(Geballe1986).Takentogether,theseobservationsshowed
that:(i) the2135and2140cm-1bandswerebothevidentin thespectraof manyclouds,(ii) the
amountof solidCO variedwith respectto otherinterstellaricecomponentssuchasH20, and(iii)
thespectraof someembeddedobjectsdid notshowanysolidstateCO absorption.
During thissameperiod,laboratoryspectralanalysisof CO-containingices(Sandfordetal.
1988)ledto thefollowingconclusions:(i) thebroad2135cm-1bandis mostlikely dueto COfrozen
in anH20-rich icewith an H20:CO ratio greater than 5, (ii) the narrower 2140 cm-1 band could not
be due to CO intimately mixed with H20 or any other polar ice species likely to be important in
molecular clouds, and (iii) the narrower band could be matched by CO frozen in certain non-polar
ices. Of the ices studied by Sandford et al., those dominated by CO2 provided the best fits to the
interstellar 2140 cm -1 feature. That some of the interstellar CO was frozen in a non-polar ice came as
something of a surprise since the 3250 cm- 1 (3.08 _tm) H20 ice feature dominated the infrared
spectra of dense clouds, leading to the belief that H20 was the major component of interstellar ices.
5
By 1989,however,evidencewasstartingto mountthatmoreCOwasfrozenin non-polarices
thanin polar,H20 rich ices. The2140cm-1CObandtowardSVS20 (CK 20)in theSerpens
molecularcloudmeasuredby EiroaandHodapp(1989)wasmuchstrongerthanthebroader2135
cm-l featurecorrespondingto COfrozenin H20. BanddepthanalysisimpliedanH20/COcolumn
densityratioof 2.86,makingCOthesecondmostabundantmantlematerialalongthis lineof sight.
Thiswasalsothefirst casein whichthepeakopticaldepthof the2140cm-1CObandexceededthe
depthof theverystrong3250cm-1H20 icefeature.Very thoroughsubsequentobservationsand
analysisof thefrozenCOfeaturealongmanylinesof sightby Tielens et al. (1991 ) and Chiar et al.
(1994, 1995) now make it clear that the 2140 cm -1 band is dominant along most lines of sight
through quiescent regions of dense clouds. Based on the laboratory data of Sandford et al. (1988),
Chiar et al. (1994, 1995) showed that a significant fraction (-40 %) of the total CO abundance is
found frozen in the non-polar ices, with the solid CO column density typically being -30% that of
H20 along these same lines of sight. In contrast, no more than a few percent of the available CO is
frozen onto the grains along the lines of sight toward embedded protostars such as W33A (6%;
Mitchell, Allen, & Maillard 1988, Mitchell et al. 1990) where most of the frozen CO is in the polar,
H20-rich ices that produce the 2135 cm -1 band.
Recent reviews of these observations in the context of a general overview of interstellar
molecular ices have been given by Whittet (1993) and Sandford (1996a, b). Other laboratory
studies which provide data that is of relevance for interstellar CO ice include a study of the binding
energies and vaporization properties of frozen CO (Sandford & Allamandola 1990a), the
temperature behavior of the 2135 cm- ! band due to CO in H20 ice (Schmitt, Greenberg, & Grim
1989), the behavior of the infrared band for frozen CO as a function of ion irradiation and
temperature (Palumbo & Strazzulla 1993), the optical constants for CO frozen in a number of
mixtures (Hudgins et al. 1993, 1994), and band strengths refined to an accuracy of a few percent
for the solid CO band of pure CO and CO frozen in a number of mixtures (Gerakines et al. 1995).
Despite the great amount of lab work and the ever increasing number of astronomical spectra,
the exact identity of the solid ice matrix that produces the narrow CO absorption at 2140 cm -1 has
. 6
remaineduncertain.Sandfordet a1.(1988)showedthat,of thenon-polariceconstituents
consideredin their extensive laboratory study, CO frozen in a CO2-rich ice came closest to
matching the interstellar band position. Using this laboratory data, Eiroa and Hodapp (1989),
Tielens et al. (1991), Kerr, Adamson, and Whittet (1991), and Chiar et al. (1994, 1995) have
shown that most of the interstellar features could be matched by coadding the profiles of CO2:CO,
H20:CO, and O2:CO ices, with the best fits requiring coadding different amounts of ices with
differing ratios for different objects.
While the matches to the 2140 cm -! band are reasonably good, they are not perfect and several
doubts remain. For example, invoking varying amounts of three different binary ices seems
somewhat contrived. Furthermore, the laboratory spectra do not reproduce the interstellar band
profile in detail, especially on the high-frequency side. In addition, comparisons of laboratory
spectra of CO in CO2 with astronomical observations are satisfactory only over a limited
temperature range (Tielens et al. 1991 ) and at high concentrations of CO2 (CO2/CO = 20). It is
difficult to understand how so much CO2 could be present. Models of interstellar chemistry cannot
account for the large amount needed (Tielens & Hagen 1982; d'Hendecourt, Allamandola, &
Greenberg 1985). The limited observations which are available for CO2 also suggest that the
abundance of frozen CO2 is roughly equal to that of solid CO along those lines of sight which have
some contribution from quiescent regions (d'Hendecourt and Jourdain de Muizon 1989). Orbital
infrared telescopes equipped with spectrometers capable of resolving the CO2 bands such as the
recently launched Infrared Space Observatory (ISO) will certainly place important further
constraints on the amount of CO2 frozen on interstellar grains.
Since there are some doubts regarding CO2-rich ices, other suggestions for possible origins of
this feature have been considered. These include pure frozen CO, and CO-rich ices containing H20
at a H20/CO ratio of about 1/10 (Tielens et al. 1991), and ion irradiated pure CO and mixed
molecular ices (Palumbo & Strazzulla 1993). While the suggestion of pure CO ices seems unlikely
due to the amount of other species available in the interstellar medium, CO-rich mixtures, ion
irradiated or not, are plausible. Indeed, our studies of UV irradiated H20-rich mixed molecular ices
7
alsoshift thefrozenCO feature into close agreement to the 2140 cm -1 position. However, these
radiation processes should be less important in the quiescent regions of clouds characterized by the
2140 cm-I band than toward protostellar regions where the 2135 cm -1 band is more important.
In view of these questions, we have studied the CO band in ices containing various mixtures
of CO, N2, 02, CO2, and H20 in an attempt to understand the origin of the narrow 2140 cm -1
interstellar absorption band. The three non-polar species N2, 02, and CO2 have been chosen
because theoretical models of interstellar ice grain chemistry have long predicted that these species
are important in certain dense cloud environments (Tielens & Hagen 1982; d'Hendecourt et al.
1985). We have also investigated the photolysis of these ices, as photochemical studies of non-
polar interstellar ice analogs are quite scarce.
In the following section (§2), we briefly discuss the experimental techniques used in this
study. The spectroscopic data and photochemical results are presented in §3 along with the optical
constants (real and imaginary parts of the index of refraction - n's and k's) across the solid CO
band for several relevant interstellar ice analogs. In §4 we compare these results to astronomical
data and conclude that interstellar ices made up of N2, 02, and CO2 are plausible. The
astrophysical implications of these results are discussed in §5, including the implied N2 and 02
interstellar abundances and depletions, and the new interstellar grain species suggested by the
photolysis experiments. The main conclusions are summarized in §6.
2. EXPERIMENTAL METHODS
Only a brief summary will be given here, since the general procedures used have been
described elsewhere (Allamandola, Sandford, & Valero, 1988; Sandford et al. 1988),. Glass
bulbs containing the gas mixtures to be studied were prepared in a greaseless, glass vacuum
system. Gas samples tCO, Matheson C.P., 99.5% purity; CO2, Matheson Bone Dry, 99.8%
purity; O2, Matheson Extra Dry, 99.6% purity) were introduced into the glass vacuum line directly
from lecture bottles without further purification. N2 (Airco Dry, 99.9% purity) was introduced
into the sample preparation line only after passage through a liquid nitrogen cooled trap. H20

8
(triply distilled)wasfurtherpurifiedbythreefreeze-pump-thawcyclesbeforeuse. Onceprepared,
eachmixturewasallowedto equilibrateovernight.
After transferringthebulbto thecryogenicsamplepreparationsystem,themixturewasthen
depositedundervacuumontoacold(-12 K) CsIsubstrate.Thedepositionratewastypically
between10-2and 10-1moles/hr.Depositiontimesfor theseexperimentsrangedfrom 2 secondsto
30minutes.Theinfraredspectrumof theresultingamorphousicewasthenrecordedusinga
Fouriertransforminfraredspectrometer.All spectraarepresentedherein percenttransmittance
andtheFWHM listedin theTablescorrespondto percenttransmittance,notopticaldepthor
absorbance.Subsequently,the icewaswarmedin stepsto highertemperatures,andtheinfrared
spectrumrecordedat eachtemperature.
Ultravioletphotolysisof severalmixtureswascarriedoutusingamicrowave-poweredhydrogen
flow lamp. An H2:He= 1:9 gas mixture was used in the photolysis lamp. This enhances the 1216
,_ Lyman t_ line emission relative to general continuum emission. The ices were kept at 12 K during
the irradiation periods, which were typically about three hours. In cases where the samples were
photolyzed, the spectrum was recorded before and after irradiation as well as during warm-up.
3. EXPERIMENTAL RESULTS
Table 1 presents a summary of all the mixtures examined as part of this study. Entries in
parentheses indicate the mixtures which were photolyzed. The results are presented as follows.
First, the frozen CO band profile dependence on concentration in binary N2:CO mixtures is
described in §3.1.1. Second, the influence of H20 on the CO peak position and profile in
N2:H20:CO ices is discussed in §3.1.2. Third, the effects of the presence of other molecules such
as CO2 and 02 on the solid CO feature with and without N2 are considered in §3.1.3. Lastly, four
component ices comprised of N2:O2:CO2:CO are described in §3.1.4. In all cases, the CO band
temperature dependence was also studied. The photochemistry of a few of the ices is described in
§3.2., and the optical constants of a number of the ice mixtures studied here are presented in §3.3.
Finally, the bands produced by solid N2 and 02 are discussed briefly in §3.4.
All measurementsof peakpositionsandwidthspresentedin theTablesweremadefrom the
originalspectra.However,thebaselineswereflattenedfor theFiguresin thosecaseswherethe
spectrashowedsignificanttilts orcurvature,or containedstronginterferencefringes. All spectra
arepresentedin percenttransmittanceandtheFWHM listedin theTablescorrespondto percent
transmittanceplots,notopticaldepthor absorbance.Thedataareplottedin thiswaysincethis
permitsabetterassessmentof thefit acrosstheentirefeature.
3.1. The Frozen CO Feature in Non-Polar Ices
3.1, I. N2:CO Ices
A series of mixed-molecular ices having different N2:CO concentrations were studied. The
N2 to CO ratios were chosen to bracket plausible interstellar ratios associated with a range of
possible environments. The spectra of these ices were measured at 12 K and at several
temperatures up to 35 K. The profiles of the CO bands are shown in Figure 1 and peak positions
and widths are listed in Table 2. Values are only given in the table at those temperatures where a
measurable, reproducible change occurred in position or width during warm up. Figure 2 shows
the change in the CO profile that occurs upon warm-up of the N2:CO = 1:20 ice. Solid nitrogen
starts to sublime between 30 and 35 K under these high-vacuum conditions. The sudden shift in
position, increase in width, and decrease in strength above - 30 K listed in Table 2 for the N2:CO
= 25:1 and 2:1 ices corresponds to the temperatures at which the nitrogen softens and begins to
sublime, releasing much of the trapped CO. The profile of the CO band is broader because it is in
a much less rigid, more irregular cage.
3.1.2. N2:H20:CO Ices
Since H20 is an abundant interstellar ice constituent, a series of ices containing N2, CO, and
H20 were also prepared and studied. The relative amounts of each component were varied in
order to be able to bracket a wide range of H20 concentrations in the ices. Ices dominated by H20
were not considered here since they have been discussed elsewhere (cf. Sandford et al. 1988).
The CO bands produced by these ices are shown in Figure 3, with band positions and FWHM
listedin Table3. In manyof theseicesasecondbandappearednear2148cm-1(seealsoSandford
etal. 1988;Schmittet al. 1989;Palumbo& Strazzulla1993).This featurehasbeenattributedto a
secondCOtrappingsitein amorphousH20 ices(Sandfordet al. 1988). Thesedatasuggestthat
thesecondsiteis characterizedby adanglingOH bondwhichformsaweakcomplexwith theCO.
Positionsandwidthsfor thissecondbandarelistedin parenthesisin Table3. Sandfordet al.
(1988)andSchmitt,Greenberg,andGrim (1989)havestudiedthetemperaturebehaviorof the
2148and2135cm-1bands.
3.1.3. 02:C0, C02:C0, N2:02:C0, and N2:C02:C0 Ices
As the 2140 cm-1 feature is indicative of CO in a non-polar ice, binary mixtures of CO in 02
and CO2 were studied to compare with the N2-containing ices since these species are also likely to
be abundant in quiescent regions of dense molecular clouds (Tielens & Hagen 1982; d'Hendecourt
et al. 1985). Several trinary mixtures containing CO with N2 and 02, or N2 and CO2 were also
investigated. The results of these experiments are listed in Table 4 and shown in Figures 4 and 5.
10
3.1.4. N2:02:C02:C0 Ices
Comparison of the spectra presented in §3.1.1. to §3.1.3. with interstellar spectra shows that
combinations of binary and trinary ices containing CO with N2, 02, and CO2 are required to
produce a band consistent with the interstellar feature. Consequently, a few four component ices
containing N2, 02, CO2, and CO were also studied. The results of these experiments are listed in
Table 4 and shown in Figure 6.
3.2. Photochemistry
The UV photochemistry of the seven ice mixtures listed in parentheses in Table 1 was also
studied. The infrared spectra of the mixtures taken after UV photolysis were compared with
preirradiation spectra to identify photoproducts and to monitor the effect of photolysis on the solid
CO feature. As an example, the 2000 to 500 cm -1 (5 to 20 l.tm) spectrum of the N2:O2:CO = 1:1:1
ice is shown both before and after photolysis in Figure 7. Photolysis for periods longer than three

11
hours did not produce further significant spectral changes. Four types of ices were irradiated:
N2:CO mixtures, N2:H20:CO mixtures, an N2:O2:CO mixture, and an N2:O2:CO2:CO mixture. The
photoproducts and their relative abundances varied, depending on the initial ice composition. The
bands due to the photoproducts from two different ices are shown in Figures 8 and 9. Identifications
of the new features appearing upon photolysis are listed in Table 5. Table 6 compares the peak
positions and FWHM of the CO feature before and after photolysis for all seven mixtures.
Most of the photochemistry is driven by reactions with "hot" O atoms liberated by photolysis of
02, H20, or CO (Figures 8 and 9). The principle species produced from O atom reactions are CO2,
N20, 03, and CO3. CO2 is detected in all cases, and N20 in most. As the concentration of CO
decreases (especially in the N2:CO series of ices), N20 production is favored over CO2 production.
Conversely, an increase in CO concentration in the N2:CO series of experiments does not favor the
appearance of any other new photoproducts except CO2. Ozone appears as a photoproduct in all the
mixtures, although the amount produced is highly variable. Relatively little 03 is produced in the
N2:CO and N2:H20:CO ices, probably due to the lower availability of photolytic oxygen atoms
present in the starting mixtures. The N2:O2:CO and N2:O2:CO2:CO ices show the strongest ozone
production as measured by the strength of the 1037 cm-1 (9.643 _tm) ozone band. Here, enough
ozone is produced that even the weaker 2108, 1104, and 704 cm -1 (4.744, 9.058, and 14.20 lam) 03
bands are evident. Again, this result is expected as copious "hot" O atoms are produced by the
photolysis of 02 under these conditions. The "hot" O atoms readily combine with undissociated 02
molecules to produce 03. Photolysis of the molecular oxygen-containing ices also produced carbon
trioxide (CO3), presumably by the addition of O to CO2.
The liberation of hydrogen in the H20-containing mixtures produces the formyl radical
(HCO), which appeared in low concentration in both H20 mixtures, and formaldehyde (H2CO),
which was detected only in the more H-rich N2:CO:H20 = 2:1:1 ice. Since formaldehyde requires
the addition of one more hydrogen atom than the formyl radical, it is not surprising that it appears
only when the H20 concentration is high. Several other very weak features appeared between

12
1900 and 1750 cm -I (5.26 and 5.71 gm) in the H20 containing ices. These presumably arise from
various hydrogenated forms of CO and CO2 such as HOCO (Milligan & Jacox 1971).
There is some evidence for the production on NO2 and NO, but it is inconclusive. NO2
absorbs at 1610 cm -1 in an argon matrix, at 1612 cm -1 in an 02 matrix (St. Louis & Crawford
1965), and at 1617 cm -1 in a N2 matrix (Lucas & Pimentel 1979). Thus, the band which appears
near 1607 cm -1 after photolysis of several ices may arise from NO2, but one would expect it to fall
closer to the 1612 or 1617 cm-I positions since the mixed molecular ice environment is closer to
that of solid 02 or N2 rather than solid At'. Similarly, NO absorbs at 1875 cm -l in Ar and at 1883
cm -1 in CO2 matrices, respectively (Fateley, Bent, & Crawford 1959). Sharp, very, very weak
absorptions appear at 1875 and 1860 cm -1 upon photolysis of the N2:CO = 100:1 and 2:1 ices,
respectively, and a sharp, weak absorption appears near 1860 cm -I in the N2:H20:CO = 2:1: I ice.
Again, the new band falls more than 20 cm-1 lower than the position expected based on the
published matrix isolation studies. Furthermore, if the 1607 cm -1 band is due to NO and the 1875
or 1860 cm -1 absorptions are due to NO2, some correlation between these two features would be
expected. However, none is seen in this limited set of data. Thus, while the spectra are suggestive
of NO2 and NO production, doubts remain.
3.3. Optical Constants (n +ik)
The real and imaginary parts of the indices of refraction (n and k) were determined for a
number of the ices studied using a Kramers-Kronig analysis (Bergmen et al. 1978) of the
transmission spectra. The procedure was essentially that used by Hudgins et al. (1993) to
determine the optical constants of a wide variety of mixed molecular ices of astrophysical interest
(see also Hudgins et al. 1994). Readers interested in the details of the calculation of the optical
constants should see Hudgins et al. (1993).
Briefly, the computational procedure used to determine the complex index of refraction was as
follows. Assuming a starting value for n [= no = n(Na D)] at all frequencies, a Kramers-Kronig
analysis was used to calculate the absorption coefficient and the imaginary part of the refractive
index across the spectral region of interest. The real part of the refractive index was then
13
computed.Theresultantn and k values were used to compute a synthetic spectrum which was, in
turn, compared to the real spectrum. Differences between the real and computed spectrum were
then used to adjust the previously assumed n values. This iterative process was repeated, using
the new n values generated from the previous step, until the calculated transmission spectrum
differed nowhere from the measured value by more than 0.1%. The number of iterations required
to fulfill this requirement depended on the number, strength, and width of the absorption features
within the spectrum. For the spectra discussed here, the number of iterations required typically fell
between 10 and 30, although spectra dominated by strong, narrow bands like those produced by
CO2 occasionally required almost 100. The correct operation of the program was initially verified
by comparing our results against values already reported in the literature. Our technique gives
good agreement with those reported for H20 (Bertie et al. 1969; Hagen, Tielens, & Greenberg
1981; Leger et al. 1983), CO2 (Wood & Roux 1982; Warren 1986), CO (Roux et al. 1980), and
CH4 (Roux et al. 1980; Pearl et al. 1991).
For ices dominated by N2 and 02, where CO produced the only absorption band of any
significance, calculations were carried out only over the 2250-2050 cm-1 (4.44-4.88 txm) region
using all the data points in the experimental spectrum in this interval (corresponding to -1 point
every 0.5 cm-l). Ices containing CO2 and H20, however, produce additional absorption features
that must be accounted for. In these cases, the calculations were first made over the entire 4000-
500 cm -I (2.5 - 20 _tm) region using every fifth data point in the experimental spectrum
(corresponding to -1 point every 2.5 cm-1). The results of these calculations were then used to
select appropriate no values for all data calculations from the same experimental spectra over the
2250-2050 cm-1 region. The results of the higher resolution calculations were then adjusted to fit
the continuous portions of the lower resolution results.
The absolute accuracy of the resulting optical constants is limited mainly by uncertainty in the
assumed starting value of the visible refractive index (no) of the ice sample and uncertainty in the
measured sample thickness h. We have based our assumed no values on reported values for the
visible refractive index of similar sample ices at the D lines of atomic Na (_, = 589 nm). For ices
dominated by CO2, N2, and 02 we have used values of no = 1.22, 1.22, and 1.25, respectively
(Hallam & Scrimshaw 1973). We used a value of no = 1.32 for H20-rich ices (Hudgins et al.
1993) and no = 1.30 for ices dominated by CO (Jiang et al. 1975). In the cases of ices that were
not clearly dominated by a single component, the concentration weighted values of the different ice
components were used to estimate a value. Uncertainty in the adopted values for no is due to the
effect of the residual dispersion of the ultraviolet contributions to no between the visible and 4000
cm- 1 and the dependence of no on the temperature, composition, and crystal structure of the
sample. The effect of the above errors would largely be to impose a small global vertical shift on
the resultant n values. Given the limited range of no values of these ices, we expect that the
uncertainties associated with the values we have chosen are less than 5%.
The biggest difference between the techniques used by Hudgins et al. and those used here is
that a laser was not used to determine sample thickness in this study. Here sample thicknesses
were determined using two different methods. In many cases the samples were thick enough that a
measurable portion of the infrared light underwent multiple reflections within the sample. This
resulted in a sinusoidal interference pattern being superimposed on the overall spectrum. In these
cases the thickness of the ice could be determined from the equation
Nosc
d = (1)
2n (Vo - Vl)
where Vo and Vl are the limits (in cm -1) over which the oscillations due to interference are measured,
Nosc is the number of fringes or 'wavelengths' of the oscillation occurring between Vo and V1, and n
is the index of refraction of the sample. In these cases, the accuracy of the thickness determination is
largely limited by uncertainties in the value of n, uncertainties are probably less than 5%.
Absorption band strengths were used to estimate sample thicknesses in those cases for which
the ice samples were too thin to produce measurable interference fringes. In this situation, the
column density, N (in molecules cm-2), of different molecular species within the sample was
determined using the equation
14
15
J'_i(V)dvNi = (2)
Ai
where "l:i(v) is the frequency-dependent optical depth (in absorbance) of an absorption band and Ai
is the band's integrated absorbance (in cm molecule -1) as determined from laboratory studies (cf.
d'Hendecourt & Allamandola 1986; Hudgins et al. 1993). Column densities determined in this
manner could be used with the known concentrations of the different molecules in the sample and a
sample density based on matrix site sizes (Hallam & Scrimshaw 1973) to estimate a sample
thickness. This technique is inherently less accurate that the interference technique because the
actual densities and Ai values for these mixed molecular ices have not been measured and they can
only be estimated from values obtained from similar, but less complex ices. When this technique
was used on ice samples for which we had independent thickness determinations from interference
measurements, it was found that thicknesses based on absorption band strengths fell within 50%
of the values determined from fringe analysis.
A summary of the n and k values of the CO feature in a number of ices are listed in Table 7.
The values we assumed for n(NaD) and d for each sample are also in the Table. It can be seen that
the majority of our sample thicknesses fell within the 0.1 - 5.0 _tm range, although ices dominated
by strong absorbers like CO2 were occasionally thinner and ices dominated by weak absorbers
such as N2 and 02 were occasionally thicker. The expected absolute accuracies of these values
differ from ice to ice and depend largely on uncertainties in the sample thicknesses. For ices
whose thicknesses were determined from interference fringes produced by internal reflections
(N2:CO=2:1, O2:CO=20:1, N2:H20:CO=2:1:1), we estimate the absolute uncertainty of the
calculated optical constants to be about 5%. Uncertainties differ for ices where the thickness could
only be estimated from absorption band strengths. For the pure CO ice and the ices H20:CO=20:1
and CO2:CO=20:1, where A values have been measured for similar ices, absolute uncertainties are
probably less than 10%. The uncertainties associated with the other ices listed in Table 7

(N2:O2:CO2:CO=1:5:1/2:1,N2:CO2:CO=1:5:1,N2:H20:CO=5:1:5,N2:O2:CO=1:5:1)arelikely to
besimilar,butcouldbeaslargeas50%. Westress,however,thatthe relative errors between
adjacent n and k pairs in all the columns are less than 0.1%, the limiting difference between the
measured and calculated spectra at which we chose to terminate our iterative calculations.
3.4. The Fundamental Bands of Solid N2 and 02
Although neither N2 nor 02 have allowed infrared transitions, it has long been known that
infrared activity is induced when these species are condensed (Smith, Keller, & Johnston 1950).
Use of this effect has been proposed by Ehrenfreund et al. (1992) to search for frozen, interstellar
02, and was exploited by Sandford, Allamandola, & Geballe (1993) to detect frozen interstellar H2.
The N2 band falls at 2327.7 cm -1 (4.2961 lam) (Figure I0) in a spectral region obscured by
telluric CO2. The 2327.7 cm-1 band has been well studied and is readily attributable to N2 (Moil,
Clutter, & Thompson 1960; Lowen, Bier, & Jodl 1990; Grundy, Schmitt, & Quirico 1993; Bohn
et al. 1994; Tryka, Brown, & Anicich 1995). The assignment of the feature at 2347.4 cm -l (4.260
_tm) has been more problematic. This position is characteristic of the asymmetric stretching
vibration of CO2 in N2, but previous investigators of the spectrum of N2 ices who have noted this
feature have been unwilling to unequivocally assign it to contaminant CO2 (Tryka et al. 1995).
Indeed, many of our own spectra that contain this feature fail to show the characteristic O=C=O
bend mode band of CO2 near 660 cm- 1. However, recent unpublished data taken in our laboratory
have demonstrated that the well known 2327.7 cm -1 N2 band shifts to lower frequencies when
15N 2 is used, but the 2347.4 cm-l feature does not. Thus, we feel the 2347.4 cm-1 feature is due
to extremely small amounts of contaminant CO2.
As discussed by Ehrenfreund et al. (1992), 02 frozen in mixed-molecular ices also has weak
infrared activity. Figure 11 shows the 02 band in a N2:O2:CO = l : 1:1 ice before and after three
hours of UV irradiation. The feature falls near 1549 cm -1 (6.456 _m).
16

4.THE INTERSTELLARCOBAND AND NON-POLARICES
Thepreviousresultswill nowbediscussedin anastrophysicalcontext. ThespectrainTielens
et al. (1991)andChiaret al. (1994,1995)showthatthe2140cm-1componentusuallydominates
theinterstellarabsorptionfeatureassociatedwith frozenCO alongmostlinesof sight. In addition
to this feature,all linesof sightalsohavesomecontributionfrom the2135cm-1bandwhich is
associatedwith COin H20-rich ices. In thefollowing sectionswecomparetheinterstellarCO
feature,especiallythe2140cm-1component,with thoseof the laboratoryanalogsdescribedabove
andusethesecomparisonsto placeconstraintsontheinterstellaricecomposition.Figures12and
13showinterstellarCO bandsrepresentativeof thefeaturesthatmustbematched.The
astronomicalspectrain thesefiguresaretakenfrom Tielensetal. (1991). Comparisonsbetween
theastronomicalandlaboratoryspectraaremakein transmittance,notopticaldepthunitsasis
customery,inorderto facilitatecomparisonacrosstheentirefeature.
4.1. N2:CO Ices
The data in Table 2 and Figure 1 show that the position and width of the CO feature depends
upon the ratio of N2 Io CO in these ices. Comparison of the N2:CO ice spectra with the interstellar
CO features given in Figures 12 and 13 show that while the more dilute mixtures (N2:CO = 25:1 and
100:1) match the position of the interstellar peak reasonably well, they are far too narrow (1.0-1.3
cm -1 versus a more typical width of ~10 cm -1 for the interstellar band). In the N2:CO = 2:1 and 1:20
ices, the peak frequency is too low by about 1 cm -1 and the width is still too narrow (between 2-3
cm-l). This trend is consistent with the 0.18-0.013 cm-1 linewidths reported by Dubost, Charneau,
and Harig (1982) for CO in N2 matrices at mole fractions of 10-2 to 10 -5, respectively. The
mismatches in position and width are not improved by warming (Figure 2, Table 2) or photolysis
(Table 6). These experiments also demonstrate that in order for interstellar (and cometary) ices to
contain appreciable amounts of N2, they must remain well below 30 K (see Figure 2).
17
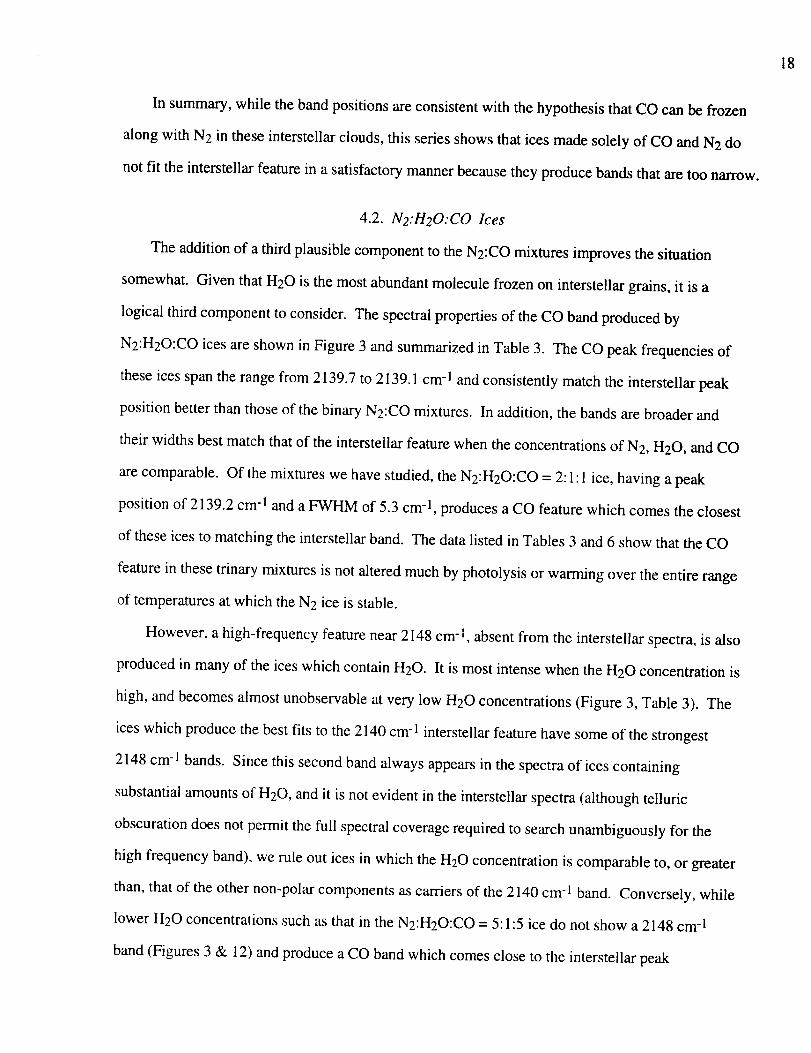
In summary, while the band positions are consistent with the hypothesis that CO can be frozen
along with N2 in these interstellar clouds, this series shows that ices made solely of CO and N2 do
not fit the interstellar feature in a satisfactory manner because they produce bands that are too narrow.
4.2. N2:H20:CO Ices
The addition of a third plausible component to the N2:CO mixtures improves the situation
somewhat. Given that H20 is the most abundant molecule frozen on interstellar grains, it is a
logical third component to consider. The spectral properties of the CO band produced by
N2:H20:CO ices are shown in Figure 3 and summarized in Table 3. The CO peak frequencies of
these ices span the range from 2139.7 to 2139.1 cm- 1 and consistently match the interstellar peak
position better than those of the binary N2:CO mixtures. In addition, the bands are broader and
their widths best match that of the interstellar feature when the concentrations of N2, H20, and CO
are comparable. Of the mixtures we have studied, the N2:H20:CO = 2:1:1 ice, having a peak
position of 2139.2 cm -1 and a FWHM of 5.3 cm -1, produces a CO feature which comes the closest
of these ices to matching the interstellar band. The data listed in Tables 3 and 6 show that the CO
feature in these trinary mixtures is not altered much by photolysis or warming over the entire range
of temperatures at which the N2 ice is stable.
However, a high-frequency feature near 2148 cm -1, absent from the interstellar spectra, is also
produced in many of the ices which contain H20. It is most intense when the H20 concentration is
high, and becomes almost unobservable at very low H20 concentrations (Figure 3, Table 3). The
ices which produce the best fits to the 2140 cm-1 interstellar feature have some of the strongest
2148 cm -1 bands. Since this second band always appears in the spectra of ices containing
substantial amounts of H20, and it is not evident in the interstellar spectra (although telluric
obscuration does not permit the full spectral coverage required to search unambiguously for the
high frequency band), we rule out ices in which the H20 concentration is comparable to, or greater
than, that of the other non-polar components as carriers of the 2140 cm -1 band. Conversely, while
lower H20 concentrations such as that in the N2:H20:CO = 5: 1:5 ice do not show a 2148 cm -1
band (Figures 3 & 12) and produce a CO band which comes close to the interstellar peak
18
19
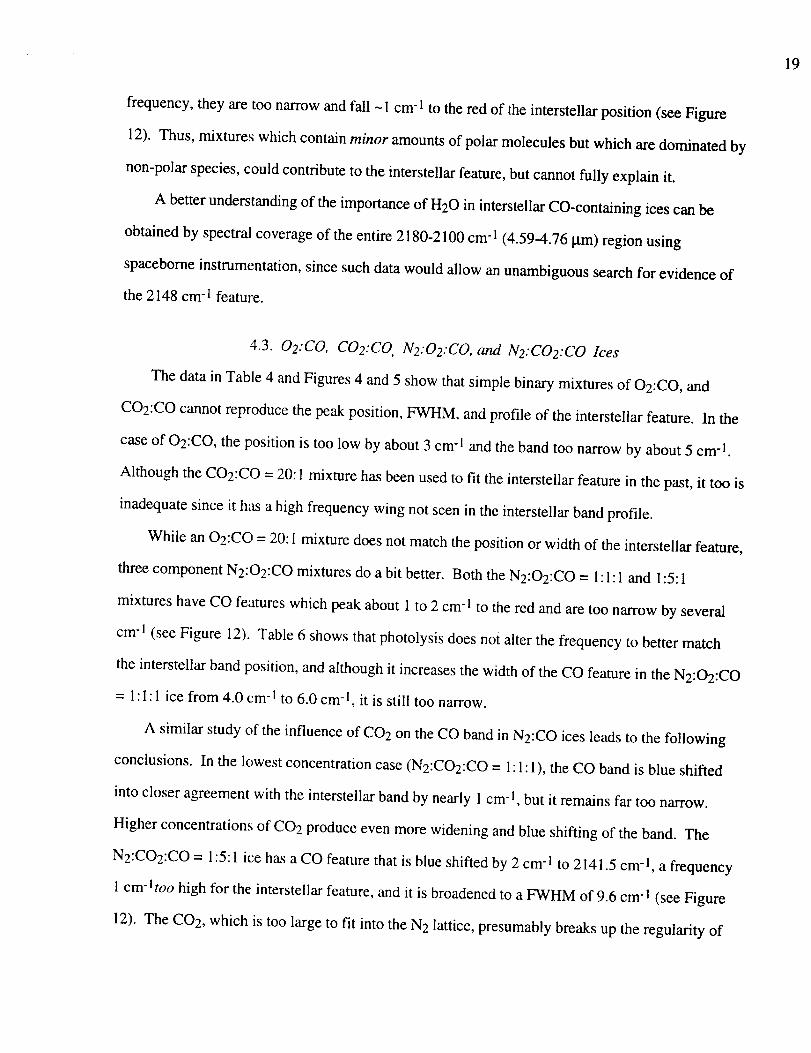
frequency,theyaretoo narrowandfall -I cm-1to theredof theinterstellarposition(seeFigure
12). Thus,mixtureswhichcontainminor amounts of polar molecules but which are dominated by
non-polar species, could contribute to the interstellar feature, but cannot fully explain it.
A better understanding of the importance of H20 in interstellar CO-containing ices can be
obtained by spectral coverage of the entire 2180-2100 cm-1 (4.59-4.76 l.tm) region using
spaceborne instrumentation, since such data would allow an unambiguous search for evidence of
the 2148 cm- I feature.
4.3. 02:C0, C02:C0 N2:02:C0, and N2:C02:C0 Ices
The data in Table 4 and Figures 4 and 5 show that simple binary mixtures of O2:CO, and
CO2:CO cannot reproduce the peak position, FWHM, and profile of the interstellar feature. In the
case of O2:CO, the position is too low by about 3 cm -1 and the band too narrow by about 5 cm -1.
Although the CO2:CO = 20:1 mixture has been used to fit the interstellar feature in the past, it too is
inadequate since it has a high frequency wing not seen in the interstellar band profile.
While an O2:CO = 20:1 mixture does not match the position or width of the interstellar feature,
three component N2:O2:CO mixtures do a bit better. Both the N2:O2:CO = 1:1:1 and 1:5:1
mixtures have CO features which peak about 1 to 2 cm-1 to the red and are too narrow by several
cm -1 (see Figure 12). Table 6 shows that photolysis does not alter the frequency to better match
the interstellar band position, and although it increases the width of the CO feature in the N2:O2:CO
= 1: 1:1 ice from 4.0 cm- 1 to 6.0 cm -1, it is still too narrow.
A similar study of the influence of CO2 on the CO band in N2:CO ices leads to the following
conclusions. In the lowest concentration case (N2:CO2:CO = I: 1:1), the CO band is blue shifted
into closer agreement with the interstellar band by nearly 1 cm -1, but it remains far too narrow.
Higher concentrations of CO2 produce even more widening and blue shifting of the band. The
N2:CO2:CO = 1:5:1 ice has a CO feature that is blue shifted by 2 cm -1 to 2141.5 cm -1, a frequency
1 cm-ltoo high for the interstellar feature, and it is broadened to a FWHM of 9.6 cm -1 (see Figure
12). The CO2, which is too large to fit into the N2 lattice, presumably breaks up the regularity of

20
theN2matrix,causingthebandto shiftslightly to theblueandaddingextraabsorbanceto thehigh
frequencywing of thefeature.
Theprincipleconclusionsfrom thebestfits to the interstellarfeaturefoundin thisandthe
previoustwosectionscanbesummarizedby examiningFigure 12. Three-componentnon-polar
icessuchasN2:O2:CO= 1:5:1,or non-polariceswith a low concentrationof apolarspeciessuch
asH20 (N2:H20:CO= 5:1:5),producefeatureswhichpeaknear2139cm-1,approximately1cm-1
to theredof theinterstellarpeakposition. In bothcases,thebandsaretoo narrow,donot
reproducethepeakposition,andfail to accountfor theabsorptionon thehighfrequencysideof the
interstellarband.Of all thepossiblecomponentsstudiedhere,CO2is theonly one which can shift
the CO absorption to tYequencies up to and higher than the interstellar band peak position. This
behavior suggests that an improved fit to the interstellar feature might best be provided by adding
some CO2 to ices like N2:O2:CO = 1:5:1, or possibly N2:H20:CO = 5:1:5. This possibility is
discussed below.
4.4. N2:02:C02:C0 Ices
The spectra in Figure 6 and data in Table 4 show the CO feature in ices made up of N2, 02,
CO2, and CO. The results of these four component ice experiments show that the roles played by
the individual components in simpler ices are maintained, i.e. the N2 and 02 in the ices result in
CO absorption centered near 2139 cm -1, while the presence of CO2 produces absorption above
2140 cm -1. The best match to the interstellar feature is provided by N2:O2:CO2:CO = i:5:1/2:1.
Ices with higher CO2 concentrations produce too large a blue shift and too much absorption on the
high frequency side of the band.
Figure 13 compares the profile of the CO ice feature of several laboratory ices with the spectra
along four lines of sight through interstellar clouds. We have followed the common practice of
fitting the entire interstellar feature with the combined absorption resulting from two very different
ice components. The first component, H20:CO = 20:1, is added to account for the lower
frequency 2135 cm -1 band produced by CO frozen in highly polar matrices (Sandford et al. 1988).
This is only a minor component along most lines of sight (Tielens et al. 1991; Chiar et al. 1994,

21
1995).Thesecond,anddominant,componentis thatof CO in anon-polariceandit is addedto
providethedeeper,narrower2140cm-1feature. In Figure 13a,weshowthebestfit thatcanbe
obtainedto thespectrumof NGC7538IRS9usingH20:CO= 20:1asthepolarcomponentand
CO2:CO= 20:1asthenon-polarcomponent.While thesetwocomponentshavebeenusedto fit
interstellardatain thepast,it isclearthatthiscanbeimprovedupon. In Figures13band 13cwe
showcomparisonsto thespectraof NGC 7538IRS9, Elias 16,AFGL 961,andElias 18where
theCO2:CO= 20:1non-polarcomponentis replacedwith thatof theN2:O2:CO2:CO= 1:5:1/2:1ice
(seeFigure6). Thefits utilizing thefourcomponenticeareconsiderablybetteracrosstheentire
feature.Onthebasisof thesegreatlyimprovedfits we conclude that an interstellar ice composition
which best reproduces the 2140 cm -1 CO band characteristic of the quiescent regions of dense
molecular clouds is one in which 02 is important (comparable to or a few times more abundant
than CO), the N2 concentration is comparable to that of the CO, and the C02 concentration is less
than that of the CO.
5. ASTROPHYSICAL IMPLICATIONS
The results and analysis of the experiments described above will now be used to draw
conclusions regarding the composition of interstellar ices in quiescent regions of dense molecular
clouds. As pointed out by Tielens et al. (1991) and Chiar et al. (1994, 1995), the solid CO
spectral characteristics of the lines of sight which probe the quiescent portions of molecular clouds
can be quite distinct from those closely associated with embedded protostars. For example, the
2140 cm -1 component of the CO feature which is associated with non-polar ices is dominant
toward field stars behind the Taurus molecular cloud and many other embedded objects, whereas it
is almost negligible compared to the 2135 cm -I component associated with CO trapped in H20-rich
ices toward the embedded protostellar object W33 A. This suggests that the 2135 cm -1 band, and
other unique characteristics of the spectrum toward W33A such as the prominent XCN and
CH3OH bands, are to be associated more with the environment of the protostar than with the
molecular cloud itself. Perhaps in those cases in which the 2135 cm-I component is more
22
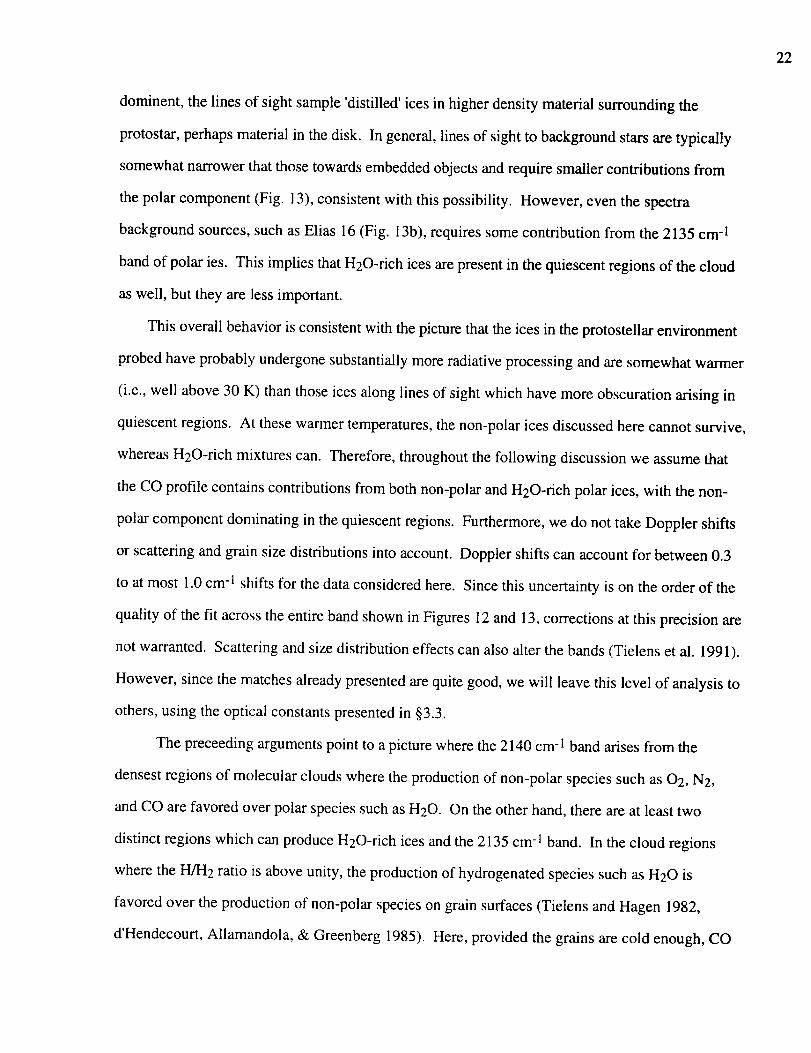
dominent,the linesof sightsample'distilled'icesin higherdensitymaterialsurroundingthe
protostar,perhapsmaterialin thedisk. In general,linesof sightto backgroundstarsaretypically
somewhatnarrowerthatthosetowardsembeddedobjectsandrequiresmallercontributionsfrom
thepolarcomponent(Fig. 13),consistentwith thispossibility. However,eventhespectra
backgroundsources,suchasElias 16(Fig. 13b),requiressomecontributionfrom the2135cm-I
bandof polar ies. This impliesthatH20-rich icesarepresentin thequiescentregionsof thecloud
aswell, but theyarelessimportant.
Thisoverallbehavioris consistentwith thepicturethattheicesin theprotostellarenvironment
probedhaveprobablyundergonesubstantiallymoreradiativeprocessingandaresomewhatwarmer
(i.e.,well above30K) thanthoseicesalonglinesof sightwhichhavemoreobscurationarisingin
quiescentregions.At these warmer temperatures, the non-polar ices discussed here cannot survive,
whereas H20-rich mixtures can. Therefore, throughout the following discussion we assume that
the CO profile contains contributions from both non-polar and H20-rich polar ices, with the non-
polar component dominating in the quiescent regions. Furthermore, we do not take Doppler shifts
or scattering and grain size distributions into account. Doppler shifts can account for between 0.3
to at most 1.0 cm- 1 shifts for the data considered here. Since this uncertainty is on the order of the
quality of the fit across the entire band shown in Figures 12 and 13, corrections at this precision are
not warranted. Scattering and size distribution effects can also alter the bands (Tielens et al. 1991).
However, since the matches already presented are quite good, we will leave this level of analysis to
others, using the optical constants presented in §3.3.
The preceeding arguments point to a picture where the 2140 cm -1 band arises from the
densest regions of molecular clouds where the production of non-polar species such as 02, N2,
and CO are favored over polar species such as H20. On the other hand, there are at least two
distinct regions which can produce H20-rich ices and the 2135 cm -1 band. In the cloud regions
where the H/H2 ratio is above unity, the production of hydrogenated species such as H20 is
favored over the production of non-polar species on grain surfaces (Tielens and Hagen 1982,
d'Hendecourt, Allamandola, & Greenberg 1985). Here, provided the grains are cold enough, CO
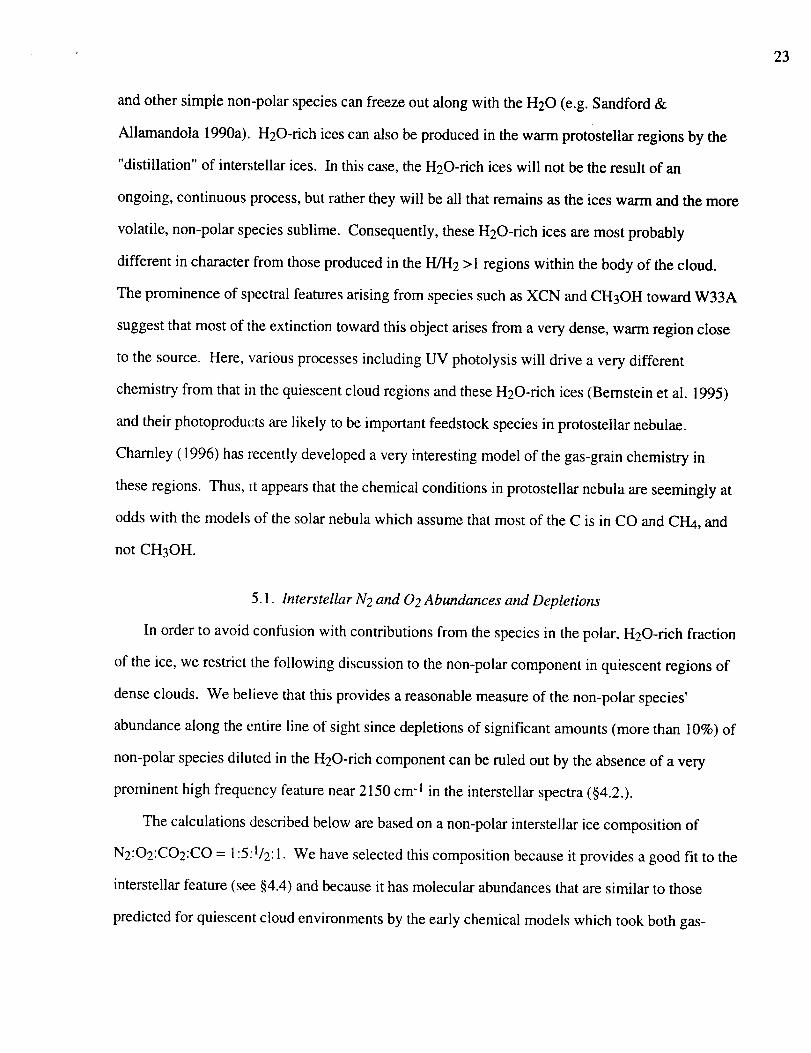
andothersimplenon-polarspeciescanfreezeout along with the H20 (e.g. Sandford &
Allamandola 1990a). H20-rich ices can also be produced in the warm protostellar regions by the
"distillation" of interstellar ices. In this case, the H20-rich ices will not be the result of an
ongoing, continuous process, but rather they will be all that remains as the ices warm and the more
volatile, non-polar species sublime. Consequently, these H20-rich ices are most probably
different in character from those produced in the H/H 2 > 1 regions within the body of the cloud.
The prominence of spectral features arising from species such as XCN and CH3OH toward W33A
suggest that most of the extinction toward this object arises from a very dense, warm region close
to the source. Here, various processes including UV photolysis will drive a very different
chemistry from that in the quiescent cloud regions and these H20-rich ices (Bernstein et al. 1995)
and their photoproducts are likely to be important feedstock species in protostellar nebulae.
Chamley (1996) has recently developed a very interesting model of the gas-grain chemistry in
these regions. Thus, it appears that the chemical conditions in protostellar nebula are seemingly at
odds with the models of the solar nebula which assume that most of the C is in CO and CH4, and
not CH3OH.
5.1. Interstellar N2 and 02 Abundances and Depletions
In order to avoid confusion with contributions from the species in the polar, H20-rich fraction
of the ice, we restrict the following discussion to the non-polar component in quiescent regions of
dense clouds. We believe that this provides a reasonable measure of the non-polar species'
abundance along the entire line of sight since depletions of significant amounts (more than 10%) of
non-polar species diluted in the H20-rich component can be ruled out by the absence of a very
prominent high frequency feature near 2150 cm -I in the interstellar spectra (§4.2.).
The calculations described below are based on a non-polar interstellar ice composition of
N2:O2:CO2:CO = 1:5:1/2:1. We have selected this composition because it provides a good fit to the
interstellar feature (see §4.4) and because it has molecular abundances that are similar to those
predicted for quiescent cloud environments by the early chemical models which took both gas-
23
24
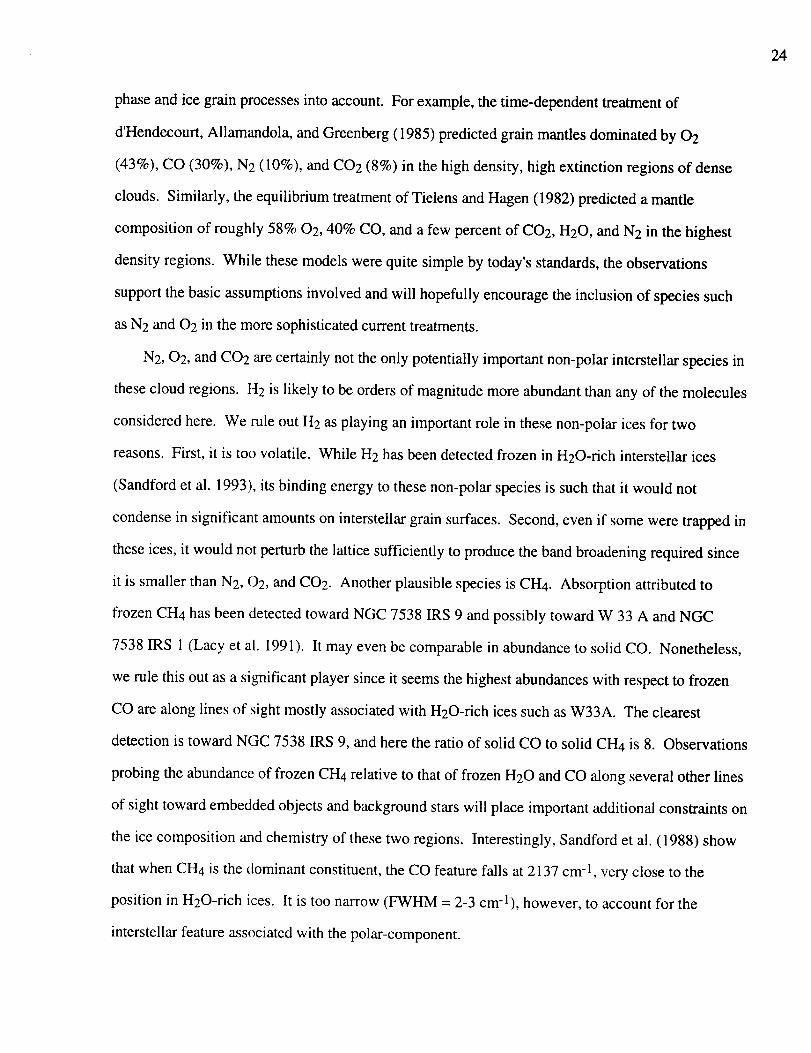
phaseandicegrainprocessesintoaccount.For example,thetime-dependenttreatmentof
d'Hendecourt,Allamandola,andGreenberg(1985)predictedgrainmantlesdominatedby 02
(43%),CO (30%),N2 (I0%), andCO2(8%) in thehighdensity,high extinctionregionsof dense
clouds. Similarly,theequilibriumtreatmentof TielensandHagen(1982)predictedamantle
compositionof roughly58%02, 40%CO,andafew percentof CO2,H20, andN2 in thehighest
densityregions.While thesemodelswerequite simpleby today'sstandards,theobservations
supportthebasicassumptionsinvolvedandwill hopefullyencouragetheinclusionof speciessuch
asN2and02 in themoresophisticatedcurrenttreatments.
N2,02, andCO2arecertainlynottheonly potentiallyimportantnon-polarinterstellarspeciesin
thesecloudregions, t-I2is likely to beordersof magnitudemoreabundantthananyof themolecules
consideredhere. We ruleoutH2asplayinganimportantrolein thesenon-polaricesfor two
reasons.First, it is too volatile. While H2hasbeendetectedfrozenin H20-rich interstellarices
(Sandfordet al. 1993),its bindingenergyto thesenon-polarspeciesis suchthatit wouldnot
condensein significantamountson interstellargrainsurfaces.Second,evenif someweretrappedin
theseices,it wouldnotperturbthelatticesufficientlyto producethebandbroadeningrequiredsince
it is smallerthanN2,02, andCO2. Another plausible species is CH4. Absorption attributed to
frozen CH4 has been detected toward NGC 7538 IRS 9 and possibly toward W 33 A and NGC
7538 IRS 1 (Lacy et al. 1991). It may even be comparable in abundance to solid CO. Nonetheless,
we rule this out as a significant player since it seems the highest abundances with respect to frozen
CO are along lines of sight mostly associated with H20-rich ices such as W33A. The clearest
detection is toward NGC 7538 IRS 9, and here the ratio of solid CO to solid CH4 is 8. Observations
probing the abundance of frozen CH4 relative to that of frozen H20 and CO along several other lines
of sight toward embedded objects and background stars will place important additional constraints on
the ice composition and chemistry of these two regions. Interestingly, Sandford et al. (1988) show
that when CH4 is the dominant constituent, the CO feature falls at 2137 cm -1, very close to the
position in H20-rich ices. It is too narrow (FWHM = 2-3 cm-1), however, to account for the
interstellar feature associated with the polar-component.
25
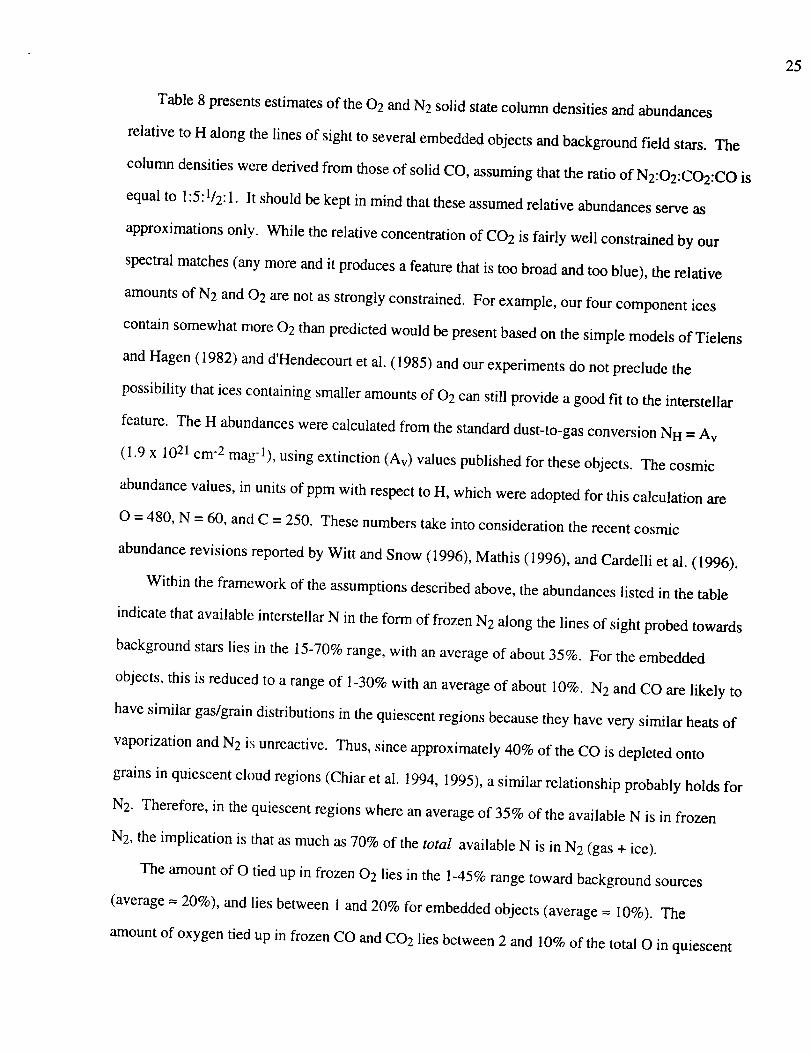
Table8presentsestimatesof the02 andN2solidstatecolumndensitiesandabundances
relativeto H alongthelinesof sightto severalembeddedobjectsandbackgroundfield stars.The
columndensitieswerederivedfrom thoseof solidCO,assumingthattheratioof N2:O2:CO2:COis
equalto 1:5:112:1.It shouldbekeptin mindthattheseassumedrelativeabundancesserveas
approximationsonly. Whiletherelativeconcentrationof CO2is fairly well constrainedby our
spectralmatches(anymoreandit producesafeaturethatis toobroadandtooblue),therelative
amountsof N2and02 arenotasstronglyconstrained.For example,our four componentices
containsomewhatmore02 thanpredictedwouldbepresentbasedon thesimplemodelsof Tielens
andHagen(1982)andd'Hendecourtet al. (1985)andourexperimentsdonotprecludethe
possibilitythaticescontainingsmalleramountsof 02 canstill provideagoodfit to theinterstellar
feature.TheH abundanceswerecalculatedfrom thestandarddust-to-gasconversionNH= Av
(I .9 x 1021cm-2mag-1),usingextinction(Av) valuespublishedfor theseobjects.Thecosmic
abundancevalues,in unitsof ppmwith respecttoH, whichwereadoptedfor thiscalculationare
O= 480,N = 60,andC = 250. Thesenumberstakeintoconsiderationtherecentcosmic
abundancerevisionsreportedby Witt andSnow(1996),Mathis(1996),andCardelliet al. (1996).
Within theframeworkof theassumptionsdescribedabove,theabundanceslistedin thetable
indicatethatavailableinterstellarN in theform of frozenN2alongthelinesof sightprobedtowards
backgroundstarslies in the15-70%range,with anaverageof about35%. For theembedded
objects,this is reducedto arangeof 1-30%withanaverageof about10%.N2andCOarelikely to
havesimilargas/graindistributionsin thequiescentregionsbecausetheyhaveverysimilarheatsof
vaporizationandN2 is unreactive. Thus, since approximately 40% of the CO is depleted onto
grains in quiescent cloud regions (Chiar et al. 1994, 1995), a similar relationship probably holds for
N2. Therefore, in the quiescent regions where an average of 35% of the available N is in frozen
N2, the implication is that as much as 70% of the total available N is in N2 (gas + ice).
The amount of O tied up in frozen 02 lies in the 1-45% range toward background sources
(average _- 20%), and lies between 1 and 20% for embedded objects (average = 10%). The
amount of oxygen tied up in frozen CO and CO2 lies between 2 and 10% of the total O in quiescent
26
regions,andon theorderof 0.2-5%for linesof sighttowardembeddedobjects.Sincenearly40%
of thetotalamountof Oavailableis thoughtto betiedup in refractorygrainmaterialssuchas
silicates(Cardelliet al. 1996),this impliesthatnearlyhalf of theO availablein thegascouldbetied
up in 02 alongsomelinesof sight[althoughweremindthereaderthattheestimatesfor 02 are
likely to beupperlimits (seeabove)].
Lastly,thesecalculationsimply thatthefractionof carbontiedup in frozenCOandCO2liesin
the3 to 13%rangetowardfield starsandbetween0.2-6%towardembeddedobjects.
Wewouldremindthereaderthatourassumednon-polarcompositionof N2:O2:CO2:CO=
1:5:1/2:1isprobablynotuniquewith regardsto its ability to fit theinterstellarCO feature.Similar
qualityfits to the interstellarfeaturecanprobablybemadewith arangeof non-polarcompositions.
For example,thefeaturesproducedby N2:O2:CO= 1:5:1andN2:H20:CO= 5:1:5 ices(seeFigure
12)suggestthatit ispossiblethatminoramountsof H20 maycarryout thesamespectralfunction
aslargeramountsof O2. Thus,it mightbepossibleto obtainacomparablygoodfit to the
interstellarfeatureby replacingtheN2:O2:CO2:CO= l:5:1/2:1non-polarcomponentwith aniceof
theform N2:H20:CO2:CO.Thus,thecosmicabundancessummarizedin Table8 shouldnotbe
takenasexact,butshouldserveasaguideonly. Furthermore,we remindthereaderthatthe
previousdiscussionrelatesonly to thecosmicabundancecontributionsmadeby thenon-polar
fraction of the CO-bearing ices. The polar, H20-rich ice component will also provide significant
contributions to the cosmic inventory. As shown in Figure 13, the contribution of C and O due to
the polar ices can be comparable to those from the non-polar ices, especially along lines of sight
towards embedded objects.
In summary, based on the assumption that the 2140 cm-1 CO band is produced by a non-polar
ice having a composition of N2:O2:CO2:CO = 1:5:1/2:1, it appears that most of the interstellar N and
a significant fraction of the interstellar O in the quiescent regions of dense molecular clouds are in the
form of N2 and 02. These two molecular components appear to be far more important in quiescent
regions of the cloud than along lines of sight to embedded objects. Given that the spectra of
embedded objects also contain variable, but significant, spectral contributions from foreground

quiescentcloudmaterial,butstill showsubstantialreductionsin impliedN2and02, suggeststhatthe
icesin thevicinity of embeddedobjectsaresignificantlydifferentfrom thosein moretypicalregions
in denseclouds.
This mayalsohavesomeimplicationsfor ourunderstandingof theconditionsin thesolar
nebulaandthecompositionof icy bodiesatlargedistancesfrom theprotostar.For example,if these
objectswereformedat largeenoughdistancesthatthetemperaturesneverrosemuchabove30K,
theseicy planetessimalswouldmightwell containsignificantamountsof N2and02. Cometary
outburstsatlargeheliocentricdistancessuchasthatrecentlyreportedfor CometHale-Boppare
oftenattributedto thereleaseof volatilessuchasCO. If cometscontainsomeof the interstellarices
thatwerepresentprior to theformationof thesolarsystem,O2andN2shouldcertainlybepresent.
Thesetooshouldbeconsidered,astheywill alsodrive releasesat low temperatures.
5.2. Photoproducts of Non-Polar Ices
Since N2, 02, and CO2 are likely to be important interstellar ice components, the products
formed by the energetic processing of these ices are of interest. The results presented in §3.2
show that N20, 03, and CO3 might also be important interstellar ice components in cold (T < 30
K) regions exposed to radiation. Figures 8 and 9 show that the strongest N20 bands fall near
2235 and 1291 cm -l (4.474 and 7.746 ktm) in these non-polar ices. Similarly, the strongest 03
and CO3 bands are at about 1039 and 2041 cm -1 (9.625 and 4.900 gm), respectively. NO and
NO2 might also be important as well. The strongest absorptions associated with these two species
fall between 1620 to 1610 cm -1 (6.17 to 6.21 _tm) and near 1860 cm -1 (5.38 ktm), respectively.
Searching for these absorptions in appropriate ISO spectra will be important for understanding the
chemistry in those regions and will provide important insight into the disposition of interstellar N
and O. For example, the detection of these species along lines of sight probing quiescent regions
of dense molecular clouds will support the hypothesis that photochemistry is important even in the
densest regions of molecular clouds, while the non-detection would argue against this. It will also
be important to probe lines of sight that are dominated by the protostellar environment such as
21

28
representedby W33A. SincetheCOprofile isnotdominatedby thenon-polarcomponentin the
spectrumonW33A, onewouldanticipatethatspeciessuchasN20, 03, andCO3wouldnotbeas
abundantwith respectto theice featuresassociatedwith morepolar,lessvolatilespeciessuchas
H20, XCN, CH3OH,andsoon towardthisobject. Of course,N20, 03, andCO3,if presentin
thegas,canfreezeontograinsattemperaturesabove30K. Thus,bandpositionsandprofileswill
bevery importantdiagnostictoolsin sortingout thesubtletiesof thechemicalprocessesat playin
theseverydifferentenvironments.Further studies of of non-polar ice photochemistry will be
warranted if ISO detects any of these photoproduct bands.
Other very important results of our photolysis studies are that: (i) XCN was not formed in any
of our experiments, and (ii) there are serious reservations concerning the detection of
photoproducts that contain a single nitrogen atom. These are especially significant in light of the
questions surrounding the identity and formation of the species designated XCN, a common
photoproduct in laboratory ices containing a photolytic source of free N-atoms such as NH3 (cf.
d'Hendecourt et al. 1986; Bernstein et al. 1995). XCN is thought to be responsible for the
interstellar 2165 cm-J band (Lacy et al. 1984). These experiments rule out the suggestion made in
Tegler et al. (1995) that interstellar XCN is produced by the photolysis of N2-rich ices. Taken
together, these results support the hypothesis made by Lacy et al.(1984) and Teglar et ai. (1995)
that XCN is somehow associated with the protostellar environment, and is not a general
characteristic of dense clouds. If this proves to be the case, careful characterization of the types of
ices along lines of sight dominated by the protostellar environment versus those associated with
more quiescent regions may well provide important constraints into the conditions prevalent in the
early protosolar nebula.
6. SUMMARY
This paper presents the results of laboratory work in which the infrared spectral properties of
CO frozen in mixed molecular ices containing 02, N2, CO2, and H20 were studied. The precise
position, FWHM, and profile of the CO stretching fundamental near 2140 cm -I depends

29
sensitivelyon thecompositionof the ice,theconditionsunderwhich it formed,andits subsequent
thermalandradiationhistory. Theopticalconstants(realandimaginarypartsof theindexof
refraction)in theregionof thesolidCOfeaturearereportedfor severalof theicesstudied.
Thisprojectwasundertakentogain insightinto thenatureof theicesresponsiblefor the2140
cm-1interstellar,frozenCOfeaturewhich ischaracteristicof linesof sightthroughquiescent
regionsof densemolecularclouds. Comparisonof the laboratorydatawith astronomicalspectra
showthatCOfrozenin 02 andN2icesalonecannotaccountfor the2140cm-1component.For
N2andO2-richices,thefeatureis toonarrow,theprofile doesn'tmatch,andthebandfalls attoo
low afrequency.Althoughmixturescontainingcomparableamountsof 02, N2,andCO do an
excellent job of accounting for the low frequency portion of the interstellar feature, they cannot
reproduce the peak position or high frequency side. The band is far too narrow if there is more
than two to three times as much N2 or 02 as CO. The band position and width in the N2:O2:CO =
1:1:I and 1:5:1 ices both produce narrow CO bandwidths, and peak about 1 cm-I to the red of the
interstellar feature. Thus, while N2 and 02 mixtures containing CO can contribute to the
interstellar feature, an additional component is required to provide the high frequency absorption.
Of the non-polar materials studied, CO2 is the only one that produces the necessary high frequency
absorption. Concentration studies on four component mixtures containing N2,O2,CO2, and CO
show that the amount of CO2 in the ice cannot exceed the amount of CO if a good fit to the
interstellar 2140 cm-I CO feature is to a obtained. Of the ices we have studied, a composition of
N2:O2:CO2:CO = 1:5:1/2:1 provided the best fit to the 2140 cm -1 interstellar feature. This match is
good both before and after UV photolysis and at all temperatures between 12 and 30 K.
While our experiments do not fully constrain the 02 concentration needed in four component
non-polar ices to provide a good match to the interstellar 2140 cm-1 feature, the good fit provided
by our N2:O2:CO2:CO = 1:5:1/2:1 ice allows us to make an estimate of how much material is tied
up in the non-polar ice component. Applying cosmic abundance constraints and assumed relative
abundances of N2:O2:CO2:CO = 1:5:1/2:1, we find that between 15-70% (average = 35%) of the
available interstellar N could be in the form of frozen N2 along the lines of sight towards
30
backgroundstars,i.e.in thequiescentregionsin clouds.This is reducedto about1-30%(average
---10%)for linesof sighttowardsembeddedobjects.Oxygenin theform of 02 lies in the 1-45%
range(average= 20%)towardbackgroundsourcesandbetween1and20%(average= 10%)
towardembeddedobjects.Theamountof oxygentiedup in frozenCO andCO2 would then lie in
the 2-10% range towards background stars and between about 0.2-5% towards protostars.
Similarly, between 3 to 13% of the carbon would then be tied up in frozen CO and CO2 toward
field stars, and 0.2 to 6% toward embedded objects. These numbers imply that (i) most of the
cosmic N is in the form of N2, (ii) in quiescent regions of dense clouds a significant fraction of the
available O in the gas is in 02, and (iii) the ices surrounding embedded objects have a very
different character from those found in quiescent regions.
The infrared activity of the N2 stretching vibration is induced in these ices, producing a band
at 2328 cm -1 (4.296 btm) which corresponds to that previously observed in frozen N2. Similarly,
the 02 stretching vibration is also induced in these ices and it produces an absorption feature near
1549 cm -1 (6.456 ktm).
Photolysis of a number of the ices produced a variety of new species including CO2, N20,
03, CO3, HCO, H2CO, and possibly NO and NO2. The UV photolysis of N2-rich ices appears to
be very inefficient at breaking N-N bond and photolysis of these mixtures did not produce XCN.
The suggestion of Tegler et al. (1995) that XCN is produced by the photolysis of CO in N2-rich
ices is therefore incorrect. The identification of N20, CO3, and 03 among the common products
of photolysis of ices containing 02, N2, CO2, and CO is important. It provides observers with
new absorption bands to search for, bands whose presence or absence will place constraints on the
conditions and chemistry occurring in dense clouds. Detection of interstellar solid N20 bands
would indicate the presence of N2, while the strength of the 03 bands would give an indication of
the importance of 02.
We conclude this paper by repeating a quote from Allamandola and Sandford (1988)
concerning the interstellar solid state CO feature, a quote which is as pertinent today as it was
nearly a decade ago when it was written: "It is important to realize that being able to determine peak

31
positionto anaccuracyof about0.2cm-1at afrequencyof 2140cm-1impliesthatanobservational
resolutionof 1partof 104isrequiredto fully extractthe informationcarriedby thisband. No
otherinterstellaricefeaturewearepresentlyawareof requiressuchresolutionfor analysis.In
mostcases1part in 103issufficient.Theuniquecombinationof theability to measurethe
interstellarCOfeaturewith suchprecision,in conjunctionwith thehighsensitivityof thesolidstate
CObandpositionandprofileon thenatureof thesolid,providesfar moreinsightinto thenatureof
thecloud(solidstatepropertiesaswell asgas-phasechemistry)thaneventhemostoptimistic
analogaficionadosanticipatedafewyearsago."
ACKNOWLEDGMENTS
We verygratefullyacknowledgeMax Bemsteinfor manyhelpfulscientificdiscussions,help
with laboratoryprocedures,andgenerouslymeasuringall of thefour componenticesreportedhere.
We arealsoespeciallygratefulto Dr. S.Laursen,Professorof Chemistryat KalamazooCollege,
for hersuggestionthatJamieElsilacarryout herSeniorResearchprojectwithusatNASA-Ames,
andfor herencouragementthroughoutthisproject.As always,wealsoacknowledgeBobWalker
for hisexcellenttechnicalsupport. This work was supported by NASA grants 185-52-12-04
(Exobiology Program) and 452-33-93-03 (Origins of the Solar Systems Program).
REFERENCES
Allamandola,L. J.,& Sandford,S.A. 1988in Dust in the Universe; eds. M. E. Bailey, & D. E.
Williams, (Cambridge: Cambridge University Press), 229.
AUamandola, L. J., Sandford, S. A., & Valero, G. J. 1988, Icarus, 76, 225
Allamandola, L. J., Sandford, S. A., Bernstein, M. B., & Elsila, J. 1996, in preparation
Bergmen, M. S., Schuh, D., Sceats, M. G., & Rice, S. A. 1978, J. Chem. Phys., 69, 3477.
Bernstein, M. P., Sandford, S. A., Allamandola, L. J., Chang, S., & Scharberg, M. A. 1995,
ApJ, 454, 327
Bertie, J. E., Labbe, H. J., & Whalley, E. 1969, J. Chem. Phys., 50, 4501.
Bohn, R. 1993, Astrochemistry Laboratory, NASA Ames Research Center, unpublished results.
Bohn, R. B., Sandford, S. A., Allamandola, L. J., & Cruikshank, D. P. 1994, Icarus, 111, 151
Cardelli, J. A., Meyer, D. M., Jura, M., & Savage, B. D. 1996, preprint
Charnley, S. 1996, preprint
Chiar, J. E., Adamson, A. J., Kerr, T. H., & Whittet, D. C. B. 1994, ApJ, 426, 240
Chiar, J. E., Adamson, A. J., Kerr, T. H., & Whittet, D. C. B. 1995, ApJ, 455,234
d'Hendecourt, L. B., Allamandola, L. J., & Greenberg, J. M., 1985, A&A, 152, 130
d'Hendecourt, L. B., Allamandola, L. J., Grim, R. J. A., & Greenberg, J. M. 1986 A&A, 158,
119
d'Hendecourt, L. B., & Allamandola, L. J. 1986, A&ASS, 64,453.
Dows, D. A. 1957, J. Chem. Phys., 26, 745
Dubost, H., Charneau, R., & Harig, M. 1982, Chem. Phys., 69, 389
Ehrenfreund, P., Breukers, R., d'Hendecourt L., & Greenberg, J. M. 1992, A&A, 260, 431
Eiroa, C., & Hodapp, K. W., 1989, A&A, 210, 345
32
Ewing, G. E., Thompson,W. E., & Pimentel,G. C. 1960,J. Chem.Phys,32, 927
Fately,W. G., Bent, H. A., & Crawford,B., 1959,J.Chem.Phys.31,204
Geballe,T. R. 1986,A&A, 162,248
Gerakines,P.A., Schutte,W. A., Greenberg,J.M., & vanDishoek,E. F., 1995,A&A 296,810
Grundy,W. M., Schmitt,B. & Quirico,E. 1993,Icarus,105,254
Hagen,W., Allamandola,L. J.,& Greenberg,J.M. 1980,A&A, 86, L3
Hagen,W., Tielens, A. G. G. M., & Greenberg,J.M. 1981,Chem.Phys.,56, 367.
Hallam,H. E., & Scrimshaw,G. F. 1973,in VibrationalSpectroscopyof TrappedSpecies,
Hallam,H. E. (ed.),(JohnWiley andSons,New York), p. 11.
Herzberg,G. H. 1955,Mere. Soc.Roy. Liege, 15,291
Hudgins,D. M., Sandford,S.A., Allamandola,L. J., & Tielens,A. G. G. M. 1993,ApJSS,86,713
Hudgins,D. M., Sandford,S. A., Allamandola,L. J., & Tielens,A. G. G. M. 1994,The AAS
CD-ROM Series, Volume 1, (expanded version of the tables in ApJSS, 86, 713
Jiang, G. J., Person, W. B., & Brown, K. G. 1975, J. Chem. Phys., 62, 1201
Kerr, T. H., Adamson, A. J., & Whittet, D. C. B. 1991, MNRAS, 251, 60p
Lacy, J. H., Baas, F., Allamandola, L. J., Persson, S. E., McGregor, P. J., Lonsdale, Carol J.,
Geballe, T. R., & van de Bult, C. E. P. M. 1984, ApJ., 276, 533
Lacy, J. H., Carr, J., Evans, N., Baas, F., Achterman, J., & Arens, J. 1991 ApJ, 376, 556
Latter, W. B., Radford, S. J. E., Jewell, P. R., Mangum, J., & Bally, J. 1996, eds. CO: Twenty-
Five Years of Millimeter Wave Spectroscopy (Dordrecht: Kluwer)
Leger, A., Gauthier, S., DSfourneau, D., & Rouan, D. 1983, A&A, 117, 164.
Leung, C. M. 1976, ApJ, 209, 75
33
. 34
L6wen, H. W., Bier, K. D., & Jodl,H. J. 1990,J. Chem.Phys.,93, 8565
Mathis,J. S., 1996,preprint
Milligan, D. E. & Jacox,M. E. 1971,J.Chem.Phys,,54, 927
Mitchell, G. F., Allen, M., & Maillard, J. P. 1988,ApJ, 333,L55
Mitchell, G. F., Maillard, J. P.,Allen, M., Beer,R., & Belcourt,K. 1990,ApJ, 363,554
Moll, N. G., Clutter,D. R.,& Thompson,W. E. 1960,J.Chem.Phys.,45,4469
Palumbo,M. E., & Strazzulla,G. 1993,A&A, 269,568
Pearl,J., Ngoh, M., Ospina,M., & Khanna,R. 1991,J. Geophys.Res.,96, 17477.
Roux,J. A., Wood,B. E., Smith, A. M., & Plyler,R. R. 1980,AEDC-TR-79-81(AD-
A088269).
Sandford,S. A., & Allamandola, L. J. 1990a, Icarus, 87, 188
Sandford, S. A., & Allamandola, L. J. 1990b, ApJ, 355, 357
Sandford, S. A., & Allamandola, L. J. 1993, ApJ, 417, 815
Sandford, S. A., Allamandola, L. J., Tielens, A. G. G. M. & Valero, G. J. 1988, ApJ, 329, 498
Sandford, S. A., Allamandola, L. J., & Geballe, T. R. 1993, Science, 262, 400
Sandford, S. A. 1996a, Meteoritics & Planetary Sci., in press, July issue
Sandford, S, A., 1996b, in Polarimetry of the Interstellar Medium, eds. W. Roberge & D. C. B.
Whittet, in press
Schmitt, B., Greenberg, J. M., & Grim, R. J. A. 1989, ApJ, 340, L33
Schutte, W. A., Allamandola, L. J., & Sandford, S.A. 1993, Icarus, 104, 114
Smith, A. L., Keller, W. E., & Johnston, H. L. 1950, Phys. Rev., 79, 728
Snow, T. P., & Witt, A. N. 1995, Science, 270, 1455
Soifer,B. T., Puetter,R. C., Russell,R. W., Willner, S. P.,Harvey,P.M., & Gillett, F. C.
1979,ApJ, 232,L53
St. Louis, R. V. & Crawford,B. 1965,J.Chem.Phys.,42, 857
Tegler,S.C.,Weintraub,D. A., Rettig,T. W., Pendleton,.J.,Whittet, D. B., & Kulesa,C. A.
1995,ApJ, 439, 279
Tielens,A. G. G. M, & Hagen,W. 1982,A&A, 114,245
Tielens,A. G. G. M., Tokunaga,A. T., Geballe,T. R., & Baas, F. A. 1991, ApJ, 381, 181
Tryka, K. A., Brown, R. H., & Anicich, V. 1995, Icarus, 116, 409
Warren, S. G. 1986, App. Optics, 25, 2650.
Whittet, D. C. B., 1993, in Dust and Chemistry in Astronomy, eds. T. J. Millar & D. A.
Williams, (Cambridge: Cambridge Univ. Press), 9
Whittet, D. C. B., Longmore, A. J., & McFadzean, A. D. 1985, MNRAS, 216, 45p
Whittet, D. C. B., Adamson, A. J., Duley, W. W., Geballe, T. R., & McFadzean, A. D. 1989,
MNRAS, 241,707
Whittet, D. C. B_, Smith, R. G., Adamson, A. J., Aitken, D. K., Chiar, J. E., Kerr, T. H.,
Roche, P. F., Smith, C. H., & Wright, C. M. 1996, ApJ, 458, 363
Wilson, R. W., Jefferts, K. B., & Penzias, A. A. 1971, ApJ, 161, L43.
Wood, B. E., & Roux, J. A. 1982, J. Opt. Soc. Am., 72, 720.
35

•- 36
TABLE 1 - Mixed-Molecular CO-Containing Ices Considered in this Study a
N2:CO
(100:I)
25:1
(2:1)
(1:20)
O2:CO
20:1
CO2:CO
20:1
N2:H20:CO
100:1:1
(19:1:1)
10:1:1
5:1:1
(2:1:1)
5:1:5
10:1:10
N2:O2:CO
(1:1:1)
1:5:1
N2:CO2:CO
I:1:1
1:5:1
N2:O2:CO2:CO
1:3:5:1
1:5:3/2:1
(1:5:1/2:1)
(a) Mixtures in parentheses were also photolyzed.
TABLE 2 - Peak Positions and FWHM of the CO Feature in N2:CO
Mixed-Molecular Ices as a Function of Temperature a
Ice Compositionand Temperature CO Position (cm- 1) _ (cm-1)
N2:CO = 100:112 K 2139.6 1.125 K 2139.6 1.032 K 2139.6 1.1
N2:CO = 25:112 K 2139.7 1.230 K 2139.7 1.333 K 2137.8 -8
N2:CO = 2:112 K 2138.7 2.630 K 2138.7 2.532 K 2138.7 2.334 K 2140.1 -8
N2:CO = 1:2012 K 2138.2 2.625 K 2138.2 2.332K 2138.7 2.034 K 2139.2 7.0
(a) All ices deposited at 12 K and then warmed to the indicated temperatures.

37
TABLE 3 - Peak Positions and FWHM of the CO Feature in N2- and H20-Containing Mixed-Molecular Ice sa'b
Composition CO Position (cm- 1) FWHM (cm- 1)and Temperature
N2:H20:CO = 100:1:112 K 2139.6 (2148.4) 1.2 (1.2)25 K 2139.7 (2146.9) 0.9 (1.4)
30 K 2139.6 (2146.9) 1.1 (1.3)35 K 2141.1 (2152.5) 10.0 (8.3)
N2:H20:CO = 19:1:112 K 2139.6 (2147.4) 1.6 (2.3)25 K 2139.6 (2149.7) 1.4 (4.0)
30 K 2139.6 (2150.7) 1.4 (5.3)35 K 2139.6 (2150.7) 1.3 (6.7)40 K 2136.2 (2151.8) 11.0 (15.0)
N2:H20:CO = 10:1:112 K 2139.7 (2147.3) 3.0 (7.0)25 K 2139.7 (2147.4) 2.4 (7.4)30 K 2139.5 (2147.3) 2.4 (7.8)35 K 2138.8 (2150.1) 10.0 (7.0)
N2:H20:CO = 5:1:112 K 2139.6 (2148.4) 3.6 (7.2)25 K 2139.6 (2148.8) 3.5 (7.2)30 K 2139.2 (2149.8) 3.4 (8.0)35 K 2138.3 (2149.7) 7.4 (>I0)
N2:H20:CO = 2:1:112 K 2139.2 (2148.4) 5.3 (7.2)25 K 2139.2 (2148.8) 5.3 (7.2)30 K 2139.2 (2149.2) 4.8 (7.0)35 K 2138.2 (2149.3) 8.5 (8.0)
N2:H20:CO = 5:1:512 K 2139.1 (2148.8) 4.7 (5.4)25 K 2139.1 (2148.8) 4.0 (5.4)30 K 2138.7 (2148.8) 4.0 (5.4)
35 K 2139.1 (2150.0) 9.0 (4.7)
N2:H20:CO = 10:1:1012 K 2139.1 2.825 K 2138.7 2.830 K 2138.7 2.735 K 2138.6 -10
(a) Numbers in parenthesis correspond to the weaker feature on the highfrequency side of the main feature (see Figure 3).
(b) All ices deposited at 12 K and then warmed to the indicated temperatures.
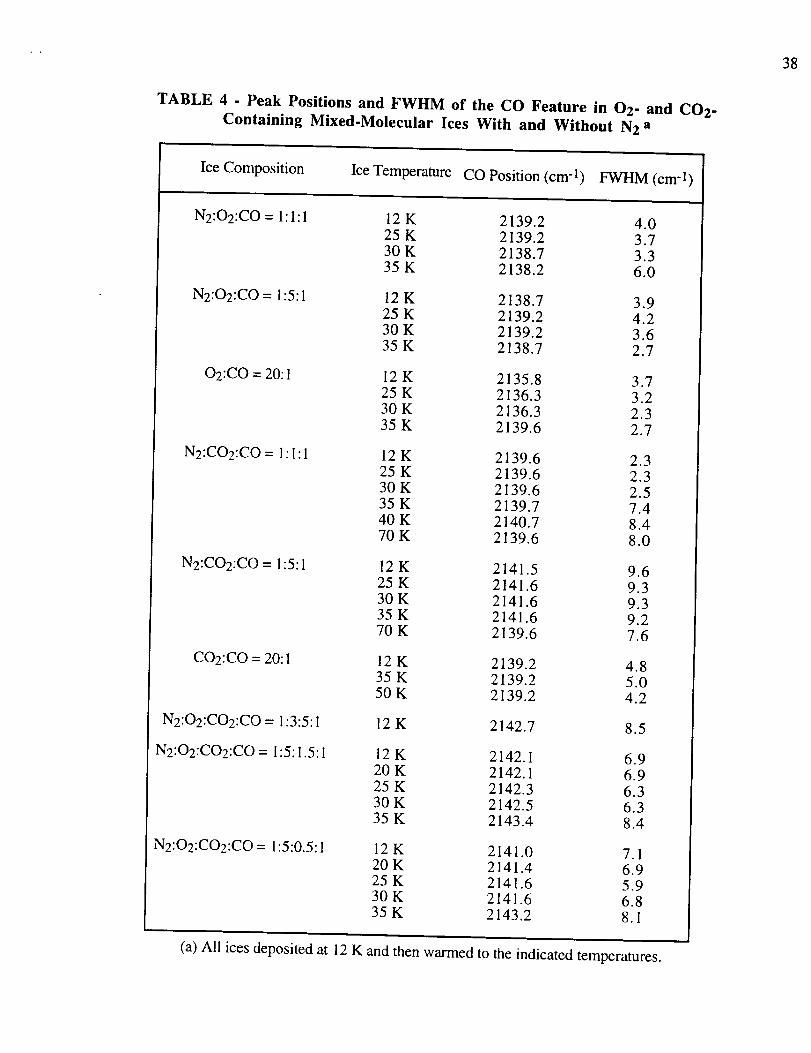
38
TABLE 4 - Peak Positions and FWHM of the CO Feature in 02- and CO2-
Containing Mixed-Molecular Ices With and Without N2 a
Ice Composition Ice Temperature CO Position (cm-1) FWHM (cm-1)
N2:O2:CO = 1:1:I
N2:O2:CO = 1:5:1
O2:CO = 20:1
N2:CO2:C0 = 1 : 1 : 1
N2:CO2:CO = 1:5:1
CO2:CO = 20:1
N2:O2:CO2:CO = 1:3:5:1
N2:O2:CO2:CO = 1:5:1.5:1
N2:O2:CO2:CO = 1:5:0.5:1
12 K 2139.2 4.025 K 2139.2 3.730 K 2138.7 3.335 K 2138.2 6.0
12 K 2138.7 3.925 K 2139.2 4.230 K 2139.2 3.635 K 2138.7 2.7
12 K 2135.8 3.725 K 2136.3 3.2
30 K 2136.3 2.335 K 2139.6 2.7
12 K 2139.6 2.325 K 2139.6 2.330 K 2139.6 2.535 K 2139.7 7.440 K 2140.7 8.470 K 2139.6 8.0
12K 2141.5 9.625 K 2141.6 9.330 K 2141.6 9.335 K 2141.6 9.270 K 2139.6 7.6
12 K 2139.2 4.835 K 2139.2 5.050 K 2139.2 4.2
12 K 2142.7 8.5
12 K 2142.1 6.920 K 2142.1 6.925 K 2142.3 6.330 K 2142.5 6.335 K 2143.4 8.4
12 K 2141.0 7.120 K 2141.4 6.925 K 2141.6 5.930 K 2141.6 6.835 K 2143.2 8.1
(a) All ices deposited at 12 K and then warmed to the indicated temperatures.

3q
0
0
0
t_
m0
0
e_
z_
|
.a
o
o_..o..o.
O_o°cq
0
_._ 00
0.---o o v-.-_
Z
0
d.-.
0 o
0
Z
"&oZ--
0o_
t_q Cq Cxl
00 o'1,J_0
o_
I_ _00 0o e_
Cq '--
_" oo oh
0 0 O0kO
0 0l"_ _0 _ O_
,._ ,._ _ _1_
o'1
oO --O00l
O0
oO
0_0
0
0
O0
oO0,1
on o o_
,-- ¢xl o_l
d
_q
0O_ol
E
d
0 0
o-1 _ o'_ 04
H
e _
'_e.. _
_ •
a_s _Nm_
_o= o•n -n
x_NO
©
E _esI
e¢3 t---i
_ t--,i
0
0
0o
d
0
0 0 0r...; _ rj _r_
0 "_ 0 0 _'0 0_-. c7 _ _ _ _-.
O r¢ _

40
TABLE 6 - CO Peak Position and FWHM at 12 K Before and After UV Photolysis
Ice Composition Prephotolysis COPosition (FWHM)
(cm-1)
Postphotolysis COPosition (FWHM)
(cm-1)
N2:CO = 100:1
N2:CO = 2:1
N2:CO = 1:20
N2:H20:CO = 19:1:1
N2:H20:CO = 2:1:1
N2:O2:CO = 1:1:1
N2:O2:CO2:CO = 1:5:0.5:1
2139.6 (1.1)
2138.7 (2.6)
2138.2 (2.6)
2139.6 (1.6)
2139.2 (5.3)
2139.2 (4.0)
2141.0 (7.1)
2139.6 (1.1)
2139.2 (3.0)
2139.7 (2.6)
2139.6 (1.6)
2139.2 (5.3)
2139.2 (6.0)
2141.1 (7.7)
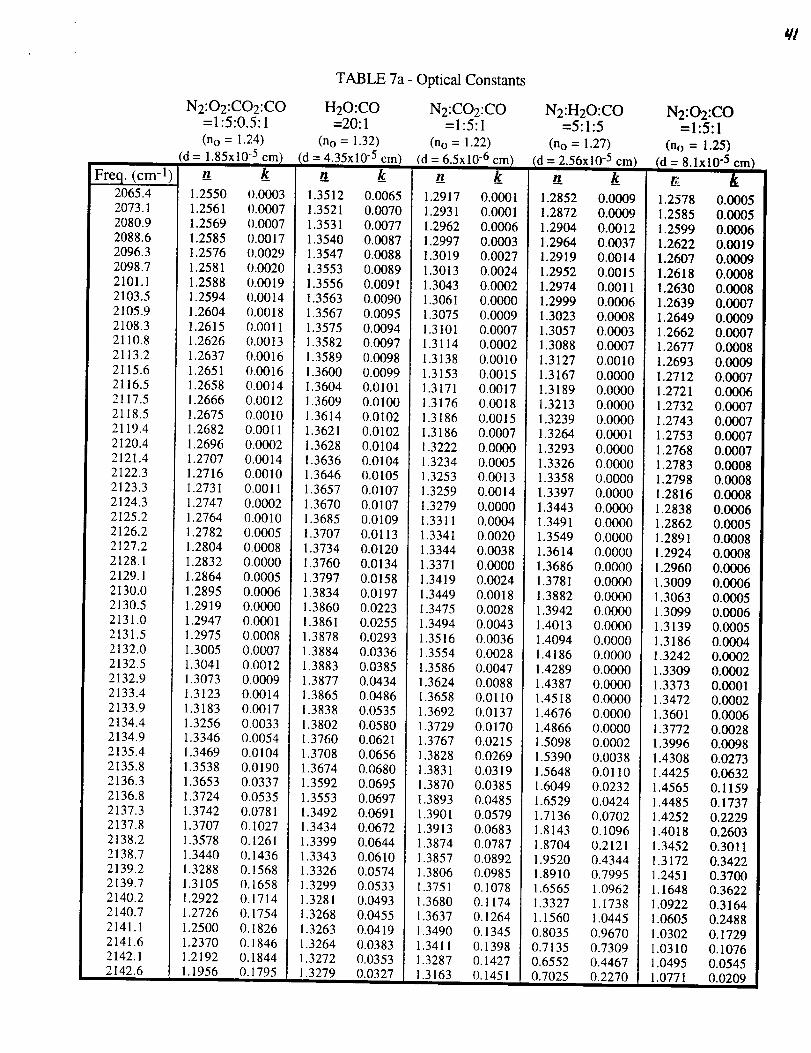
q/
Freq. (cm- 1) i2065.42073.12080.92088.62096.32098.72101.12103.52105.92108.32110.8
2113.22115.62116.52117.52118.52119.42120.42121.42122.32123,32124.32125.22126.22127.22128.12129.12130.02130.5
2131.02131.52132.02132.52132.92133.4
2133.92134.42134.92135.42135.82136.3
2136.82137.32137.82138.22138.72139.2
2139.72140.22140.7
2141.12141.62142.12142.6
N2:O2:CO2:CO=1:5:0.5:1
(n o = 1.24)
d= 1.85x10 "5 cm t
1.2550 0.00031.2561 11).00071.2569 0.00071.2585 0.00171.2576 0.00291.2581 0.00201.2588 0.00191.2594 0.00141.2604 0.00181.2615 0.00111.2626 0.00131.2637 0.0016
1.2651 (I.00161.2658 0.00141.2666 0.0012
1.2675 0.00101.2682 0.00111.2696 0.00021.2707 0.00141.2716 0.00101.2731 0.00111.2747 0.00021.2764 0.00101.2782 0.00051.2804 0.00081.2832 0.00001.2864 0,00051.2895 0.00061.2919 0.00001.2947 0.00011.2975 0.0008
1.3005 0.00071.3041 0.00121.3073 0.00091.3123 0,0014
1.3183 0.00171.3256 0.00331.3346 0.00541,3469 0.01041.3538 0.01901.3653 0.0337
1.3724 0.05351.3742 0.07811.3707 0.10271.3578 0.12611.3440 0.14361.3288 0.15681.3105 0.16581.2922 0.17141.2726 0.17541.2500 0.18261.2370 0.18461.2192 0.18441.1956 0.1795
TABLE 7a - Optical Constants
H20:CO=20:1
(no = 1.32)d = 4.35x10 "5 cm)
1.3512 0.0065
1.3521 0.00701.3531 0.00771.3540 0.00871.3547 0,00881.3553 0.00891.3556 0.00911.3563 0.00901.3567 0.00951.3575 0.00941.3582 0.0097!.3589 0.0098
1.3600 0.00991.3604 0.01011.3609 0.0100
1.3614 0.01021.3621 0.01021.3628 0.0104!.3636 0.01041.3646 0.01051.3657 0.01071.3670 0.01071.3685 0.01091.3707 0.01131.3734 0.01201.3760 0.01341.3797 0,01581.3834 0.01971.3860 0.0223
1.3861 0.02551.3878 0.02931.3884 0.03361.3883 0.03851.3877 0.04341.3865 0.0486
1.3838 0.05351.3802 0.05801.3760 0.06211.3708 0.06561.3674 0.0680
1.3592 0.06951.3553 0.06971.3492 0.06911.3434 0.06721.3399 0.06441.3343 0.06101.3326 0.05741.3299 0.05331.3281 0.04931.3268 0.04551.3263 0.0419
1.3264 0.03831.3272 0.0353
1.3279 0.0327
N2:CO2:CO=1:5:1
(n o = 1.22)
(d = 6.5x10 -6 cm_
1.2917 0.0001
1.2931 0.00011.2962 0.00061.2997 0.00031.3019 0.00271.3013 0.00241.3043 0.00021.3061 0.00001.3075 0.00091.3101 0.00071.3114 0.0002
1.3138 0.00101.3153 0.00151.3171 0.00171.3176 0.00181.3186 0.00151.3186 0.00071.3222 0.00001.3234 0.00051.3253 0.00131.3259 0.00141.3279 0.00001.3311 0.00041.3341 0.00201.3344 0.00381.3371 0.00001,3419 0.0024
1.3449 0.00181.3475 0.0028
1.3494 0.00431.3516 0.00361.3554 0.00281.3586 0.00471.3624 0.00881.3658 0.0110
1.3692 0.01371.3729 0.01701.3767 0.02151.3828 0.02691.3831 0.03191.3870 0.03851.3893 0.04851.3901 0.05791.3913 0.06831.3874 0.07871.3857 0.08921.3806 0.0985
1.3751 0.10781.3680 0.11741.3637 0.1264
1.3490 0.13451.3411 0.13981.3287 0.1427
1.3163 0.1451
N2:H20:CO=5:1:5
(no = 1.27)
d = 2.56x10 "5 cm_
n__
1.2852 0.00091.2872 0.0009
1.2904 0,00121.2964 0.00371.2919 0.00141.2952 0.00151.2974 0.00111.2999 0.00061.3023 0.00081.3057 0.00031.3088 0.00071.3127 0.0010
1.3167 0.00001.3189 0.00001.3213 0.0000
1.3239 0.00001.3264 0.00011.3293 0.00001.3326 0.00001.3358 0.00001.3397 0.00001.3443 0.00001.3491 0.00001.3549 0.00001.3614 0.00001.3686 0.00001,3781 0,00001.3882 0.00001.3942 0.0000
1.4013 0.00001.4094 0.00001.4186 0.00001.4289 0.00001.4387 0.0000!.4518 0.0000
1.4676 0.00001.4866 0.00001.5098 0.00021,5390 0.00381.5648 0.01101.6049 0.02321.6529 0.04241.7136 0.07021.8143 0.10961.8704 0.21211.9520 0.4344!.8910 0.79951.6565 1.0962
1.3327 1.17381.1560 1.04450.8035 0.96700.7135 0.73090.6552 0.4467
0.7025 0.2270
N2:O2:CO=1:5:1
(no = 1.25)
/d = 8.1xlO -5 cm
__:. k
1.2578 0.0005
1.2585 0.00051.2599 0.00061.2622 0.00191.2607 0.00091.2618 0.00081.2630 0.00081.2639 0.00071.2649 0.00091.2662 0.00071.2677 0.0008
1.2693 0.00091.2712 0.00071.2721 0.00061.2732 0.00071.2743 0.00071.2753 0.00071.2768 0.00071.2783 0.00081.2798 0.00081.2816 0.00081.2838 0.00061.2862 0.00051.2891 0.00081.2924 0.00081.2960 0.00061,3009 0.OO061.3063 0.00051.3099 0.0006
1.3139 0.00051.3186 0.00041.3242 0.00021.3309 0.00021.3373 0.00011.3472 0.0002
1.3601 0.00061.3772 0.00281.3996 0.0098
1.4308 0.02731.4425 0.06321.4565 0.1159
1.4485 0.17371.4252 0.2229!.4018 0.26031.3452 0.30111.3172 0.34221.2451 0.37001.1648 0.36221.0922 0.31641.0605 0.2488
1.0302 0.17291.0310 0.10761.0495 0.05451.0771 0.0209
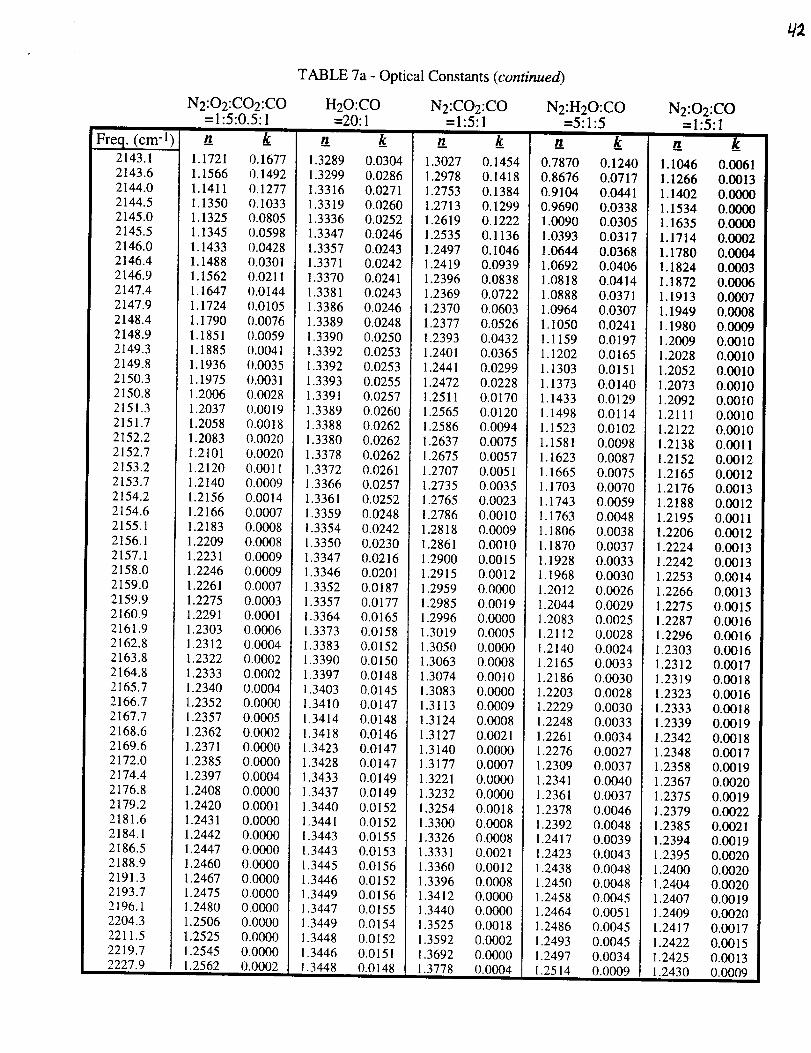
Freq. (cm- 1)2143.1
2143.62144.02144.52145.02145.5
2146.02146.42146.92147.42147.92148.42148.92149.32149.82150.32150.82151.32151.72152.2
2152.72153.22153.72154.22154.62155.12156.12157.12158.02159.02159.92160.92161.92162.82163.82164.82165.72166.72167.7
2168.62169.62172.02174.42176.82179.2
2181.62184.12186.52188.92191.32193.72196.12204.32211.52219.72227.9
N2:O2:CO2:CO=1:5:0.5:1
k1.1721 0.1677
1.1566 0.14921.1411 0.12771.1350 0.10331.1325 0.08051.1345 0.05981.1433 0.04281.1488 0.03011.1562 0.02111.1647 0.01441.1724 0.01051.1790 0.00761.1851 (i).00591.1885 0.00411.1936 0.00351.1975 0.00311.2006 0.00281.2037 0.00191.2058 0.00181.2083 0.0020
1.2101 0.00201,2120 0.00111.2140 0.00091.2156 0.00141.2166 0.00071.2183 0.00081.2209 0.00081.2231 0.00091.2246 0.00091.2261 0.00071.2275 0.00031.2291 O.O0011.2303 000061.2312 0.00041.2322 0.00021.2333 0.00021.2340 0.00041.2352 0.00001.2357 0.0005
1.2362 0.00021.2371 0.00001.2385 0.00001.2397 0.00041.2408 0,00001.2420 0.0001
1.2431 0.00001.2442 0.00001.2447 0.00001.2460 0.00001.2467 0.00001.2475 0.00001.2480 0.00001.2506 0.00001.2525 0.00001.2545 0.00001.2562 0.0002
TABLE 7a - Optical Constants (continued)
H20:CO=20:1
1.3289 0.0304
1.3299 0.02861.3316 0.02711.3319 0.02601.3336 0.0252
1.3347 0.02461.3357 0.02431.3371 0.02421.3370 0.02411.3381 0.02431.3386 0.02461.3389 0.02481.3390 0.02501.3392 0.02531.3392 0.0253
1.3393 0.02551.3391 0.0257
1.3389 0.02601.3388 0.02621.3380 0.02621.3378 0.02621.3372 0.02611.3366 0.02571.3361 0.02521.3359 0.02481.3354 0.02421.3350 0.02301.3347 0.02161.3346 0.02011.3352 0.0187
1.3357 0.01771.3364 0.01651.3373 0.01581.3383 0.01521.3390 0.01501.3397 0.01481.3403 0.01451.3410 0.01471.3414 0.0148
1.3418 0.01461.3423 0.01471.3428 0.0147
1.3433 0.01491.3437 0.01491.3440 0.01521.3441 0.01521.3443 0.01551.3443 0.01531.3445 0.01561.3446 0.01521.3449 0.01561.3447 0.01551.3449 0.01541.3448 0.01521.3446 0.01511.3448 0.0148
N2:CO2:CO=1:5:1
1.3027 0.1454
1.2978 0.14181.2753 0.13841.2713 0.12991.2619 0.1222
1.2535 0.11361.2497 0.10461.2419 0.09391.2396 0.08381.2369 0.07221.2370 0.06031.2377 0.05261.2393 0.04321.2401 0.03651.2441 0.0299
1.2472 0.02281.2511 0.01701.2565 0.01201.2586 0.00941.2637 0.00751.2675 0.00571.2707 0.00511.2735 0.00351.2765 0.00231.2786 0.00101.2818 0.00091.2861 0.00101.2900 0.00151.2915 0.00121.2959 0.0000
1.2985 0.00191.2996 0.00001.3019 0.0005
1.3050 0.00001.3063 0.00081.3074 0.0010!.3083 0.00001.3113 0.00091.3124 0.0008
1.3127 0.00211.3140 0.00001.3177 0.0007
1.3221 0.00001.3232 0.00001.3254 0.00181.3300 0.00081.3326 0.00081.3331 0.00211.3360 0.00121.3396 0.00081.3412 0.00001.3440 0.0000!.3525 0.00181.3592 0.0002
1.3692 0.00001.3778 0.0004
N2:H20:CO=5:1:5
0.7870 0.12400.8676 0.0717
0.9104 0.04410.9690 0.03381.0090 0.03051.0393 0.0317
1.0644 0.03681.0692 0.04061.0818 0.04141.0888 0.03711.0964 0.03071.1050 0.02411.1159 0.01971.1202 0.01651.1303 0.0151
1.1373 0.01401.1433 0.01291.1498 0.01141.1523 0.01021.1581 0.00981.1623 0.00871.1665 0.00751.1703 0.00701.1743 0.00591.1763 0.00481.1806 0.00381.1870 0.00371.1928 0.00331.1968 0.00301.2012 0.0026
1.2044 0.00291.2083 0.00251.2112 0.0028
1.2140 0.00241.2165 0.00331.2186 0.00301.2203 0.00281.2229 0.00301.2248 0.0033
1.2261 0.00341.2276 0.0027!.2309 0.0037
1.2341 0.00401.2361 0.00371.2378 0.00461.2392 0.00481.2417 0.00391.2423 0.00431.2438 0.00481.2450 0.00481.2458 0.00451.2464 0.0051
1.2486 0.00451.2493 0.00451.2497 0.00341.2514 0.0009
N2:O2:CO=1:5:1
1.1046 0.0061
1.1266 0.00131.1402 0.00001.1534 0.00001.1635 0.00001.1714 0.00021.1780 0.00041.1824 0.00031.1872 0.00061.1913 0.00071.1949 0.00081.1980 0.0009!.2009 0.00101.2028 0.0010
1.2052 0.00101.2073 0.00101.2092 0.00101.2111 0.00101.2122 0.00101.2138 0.00111.2152 0.00121.2165 0.00121.2176 0.00131.2188 0.00121.2195 0.00111.2206 0.00121.2224 0.0013
1.2242 0.00131.2253 0.0014
1.2266 0.00131.2275 0.00151.2287 0.00161.2296 0.0016
1.2303 0.00161.2312 0.0017!.2319 0.00181.2323 0.00161.2333 0.00181.2339 0.0019
1.2342 0.00181.2348 0.00171.2358 0.0019
1.2367 0.00201.2375 0.00191.2379 0.00221.2385 0.00211.2394 0.00191.2395 0.00201.2400 0.00201.2404 0.00201.2407 0.0019
1.2409 0.00201.2417 0.00171.2422 0.00151.2425 0.00131.2430 0.0009

Pure CO
(n o = 1.30)= 8.0x10⁻⁶,
2057.7 1.3371 0.00102065.5 1.3395 0.0017
2073.2 1.3457 0.00302080.9 1.3538 0.00302088.6 1.3614 0.01112096.3 1.3525 0.00382098.7 1.3594 0.00252101.1 1.3651 0.00352103.6 1.3710 0.00282106.0 1.3766 0.00242108.4 1.3829 0.00192110.8 1.3883 0.00232113.2 1.3956 0.00242115.6 1.4061 0.00152116.6 1.4105 0.00082117.5 1.4154 0.00032118.5 1.4210 0.00002119.5 1.4289 0.00002120.4 1.4346 0.00172121.4 1.4404 I).0008
2122.4 1.4491 I).00002123.3 1.4582 0.00002124.3 1.4687 0.00022125.2 1.4795 0.00002126.2 1.4921 0.00052127.2 1.5080 0.00002128.1 1.5263 0.00002129.1 1.5485 0.00002130.1 1.5757 0.00002130.6 1.5929 I).00002131.0 1.6093 0.00002131.5 1.6308 0.00002132.0 1.6558 0.00002132.5 1.6848 0.00002133.0 1.7197 0.00132133.4 1.7527 0.00462133.9 1.8025 0.01452134.4 1.8597 0.03542134.9 1.9218 0.07022135.4 1.9869 0.11532135.9 2.0850 0.15592136.3 2.1355 0.22022136.8 2.2776 0.32112137.3 2.4159 0.54102137.8 2.4569 0.98432138.3 2.4082 1.47142138.7 1.8141 2.05912139.2 1.3942 1.96812139.7 0.9789 1.73072140.2 0.8075 1.41792140.7 0.7100 1.16132141.2 0.6186 0.87242141.6 0.5781 0.79562142.1 0.5384 0.65292142.6 0.5228 0.5934
TABLE 7b - Optical Constants
N2:CO=2:1 O2:CO=20:1(no = 1.25) (no = 1.25)
d = 5.87x10⁻⁵ cm = 1.15x10 -4 cm
1.2571 0.0007 1.2529 0.00001.2577 0.0007 1.2532 0.00001.2585 0.0007 1.2536 0.00001.2597 0.0009 1.2542 0.00001.2623 0.0023 1.2558 0.00081.2604 0.0009 .2549 0.00001.2616 0.0009 1.2554 0.00001.2628 0.0008 1.2558 0.00001.2638 0.0008 1.2563 0.0000
1.2649 0.0012 1.2568 0.00001.2660 0.0010 1.2574 0.0000
1.2673 0.0013 1.2580 0.00011.2690 0.0017 1.2588 0.00011.2706 0.0016 .2598 0.00001.2716 0.0014 1.2603 0.0000
1.2725 0.0017 1.2608 0.00001.2735 0.0017 1.2614 0.00001.2745 0.0019 1.2620 0.00001.2758 0.0017 1.2627 0.00001.2772 0.0020 1.2635 0.00001.2786 0.0020 .2643 0.0000.2802 0.0022 1.2653 0.0000
1.2821 0.0020 1.2666 0.00001.2843 0.0025 1.2677 0.0000
1.2864 0.0026 1.2694 0.00001.2894 0.0025 1.2713 0.00011.2926 0.0026 .2734 0.00001.2965 0.0029 1.2763 0.0001
.3013 0.0031 1.2796 0.00021.3040 0.0031 1.2818 0.00031.3071 0.0034 1.2845 0.00021.3106 0.0034 1.2877 0.00041.3145 0.0035 1.2915 0.00041.3191 0.0037 .2963 0.00061.3244 0.0040 .3009 0.0007.3306 0.0042 1.3087 0.0012
1.3384 0.0049 1.3195 0.00221.3475 0.0056 1.3348 0.00591.3588 0.0072 1.3564 0.01651.3727 0.0103 1.3887 0.04741.3900 0.0164 1.3788 0.11971.4099 0.0254 .3359 0.21331.4351 0.0376 1.2594 0.20771.4705 0.0549 1.2300 0.14921.5190 0.0951 1.2143 0.12761.5643 0.2098 1.2000 0.11681.5250 0.4303 1.1882 0.10571.3614 0.6073 1771 0.08891.1538 0.5721 .1708 0.06941.0286 0.4149 1.1694 0.05000.9820 0.2683 1.1745 0.03480.9872 0.1690 1.1785 0.02191.0087 0.1061 1.1842 0.01221.0328 0.0635 1.1919 0.00601.0597 0.0306 988 0.0027
CO2:CO =20:1
(no = 1.22)
d = 1.65xi0-6
1.3035 0.00001.3051 0.00011.3059 0.00011.3074 0.00031.3097 0.00001.3118 0.00001.3126 0.00001.3136 0.00001.3144 0.00001.3153 0.00001.3163 0.00001.3174 0.0002
1.3185 0.00051.3194 0.00101.3197 0.00031.3205 0.00001.3214 0.00051.3216 0.00071.3221 0.00041.3228 0.00051.3234 0.0003! .3243 0.00021.3252 0.00021.3261 0.00021.3271 0.0002
1.3284 0.00041.3295 0.00031.3311 0.00071.3326 0.00091.3337 0.00091.3344 0.00111.3356 0.0015.3367 0.0020
1.3379 0.00241.3394 0.00301.3399 0.00351.3417 0.00411.3434 0.00511.3451 0.0063.3470 0.0078
1.3497 0.00961.3505 0.01251.3525 0.01561.3539 0.01941.3549 0.02431.3558 0.02911.3541 0.0385.3503 0.0453
1.3435 0.05101.3359 0.05291.3286 0.05211.3254 0.04641.3200 0.04971.3179 0.0455.3149 0.0436
N2:H20:CO=2:1:1
(no = 1.27)
= 1.0xl0 "4 cm'
1.2799 0.00011.2808 0.00011.2819 0.00031.2836 0.00021.2862 0.00141.2858 0.00101.2872 0.00111.2879 0.0015
1.2887 0.00111.2899 0.00041.2916 0.00021.2937 0.00021.2958 0.00031.2983 0.00021.2993 0.00021.3006 0.00011.3020 0.00021.3033 0.00021.3050 0.00021.3067
1.3085 0.0002
1.3108 0.00031.3132 0.00021.3158 0.00011.3191 0.00021.3229 0.0002.3269 0.0002
1.3323 0.00031.3381 0.00041.3420 0.00041.3464 0.00071.3513 0.00101.3571 0.0014.3642 0.0020
1.3700 0.00321.3793 0.00521.3898 0.00851.4021 0.01351.4163 0.02161.4344 0.03371.4419 0.05231.4586 0.07801.4669 0.11261.4670 0.15521.4626 0.20151.4253 0.24891.4018 0.2893.3492 0.3251
1.2836 0.34351.2140 0.32631.1812 0.28041.1287 0.22261.1267 0.16801.1307 0.1224
1438 0.0891
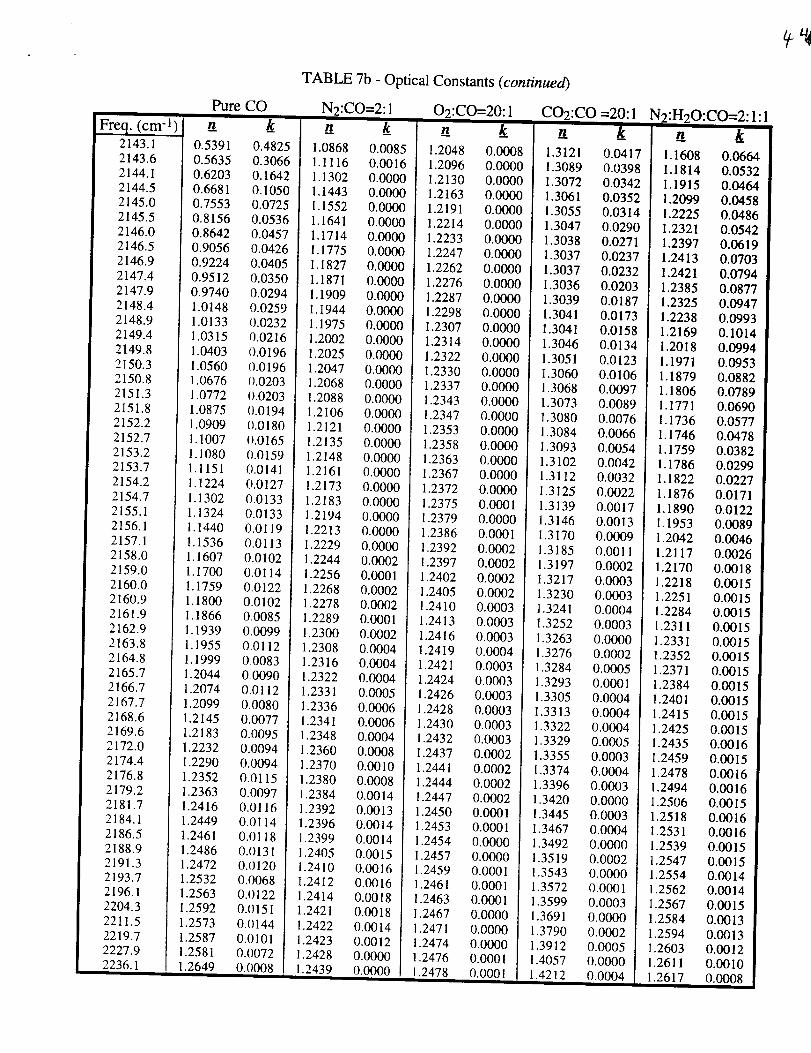
/_L I"
Freq. (cm- I)2143.12143.62144.12144.52145.02145.52146.02146.52146.92147.42147.9
2148.42148.92149.4
2149.82150.32150.82151.32151.82152.22152.72153.22153.72154.22154.72155.12156.1
2157.12158.0
2159.02160.02160.92161.9
2162.92163.82164.82165.72166.72167.72168.62169.62172.02174.42176.82179.22181.72184.12186.52188.92191.32193.72196.12204.3
2211.52219.72227.92236.1
TABLE 7b - Optical
Pure CO N2:CO=2:1
0.5391 0.48250.5635 0.30660.6203 0.16420.6681 0.10500.7553 0.07250.8156 0.05360.8642 0.04570.9056 0.04260.9224 0.04050.9512 0.0350
0.9740 0.02941.0148 0.02591.0133 /).02321.0315 0.0216
1.0403 0.01961.0560 0.01961.0676 I).02031.0772 t).02031.0875 I).01941.0909 0.01801.1007 0.01651.1080 11.01591.1151 0.01411.1224 0.01271.1302 0,01331,1324 0.01331.1440 0.0119
1.1536 0,01131.1607 0.0102
1.1700 0.01141.1759 0.01221.1800 0.01021.1866 0.0085
1.1939 0.00991.1955 0.01121.1999 0.00831.2044 0.00901.2074 0.01121.2099 0.00801.2145 0.00771.2183 0.00951.2232 0.00941.2290 0.00941.2352 0.01151.2363 0.00971.2416 0.01161.2449 0.01141.2461 0.01181.2486 0.01311.2472 0.01201.2532 0.00681.2563 0.111221.2592 0.111511.2573 0.01441.2587 0.01011.2581 0.00721.2649 0.0008
1.0868 0.00851.1116 0.00161.1302 0.00001.1443 0.00_1.1552 0.00001.1641 0.001301.1714 0.00001.1775 0.00001.1827 0.0000
1.1871 0.00001.1909 0.00001.1944 0.00001.1975 0.00001.2002 0.00001.2025 0.00001.2047 0.00001.2068 0.00001.2088 0.00001.2106 0.00001.2121 0.00001.2135 0.00001.2148 0.00001.2161 0.00001.2173 0.0000
1.2183 0.00001.2194 0.00001.2213 0.00001.2229 0.00001.2244 0.00021.2256 0.00011.2268 0.00021.2278 0.00021.2289 0.00011.2300 0.00021.2308 0.00041.2316 0.00041.2322 0.00041.2331 0.00051.2336 0.00061.2341 0.00061.2348 0.00041.2360 0.00081.2370 0.00101.2380 0.00081.2384 0.00141.2392 0.00131.2396 0.00141,2399 0.00141.2405 0.00151.2410 0.00161.2412 0.00161.2414 0.00181.2421 0.00181.2422 0.00141.2423 0.00121.2428 0.00001.2439 0.0000
O2:CO=20:1
n__ k_1.2048 0.00081.2096 0.00001.2130 0.00001.2163 0.00001.2191 0.00001.2214 0.00001.2233 0.00001.2247 0.0000
1.2262 0.00001.2276 0.00001.2287 0.00001.2298 0.00001.2307 0.00001.2314 0.00001.2322 0.00001.2330 0.00001.2337 0.00001.2343 0.00001.2347 0.00001.2353 0.00001.2358 0.0000
1.2363 0.00001.2367 0.0000
1.2372 0.00001.2375 0.00011.2379 0.00001.2386 0.00011.2392 0.00021.2397 0.00021.2402 0.00021.2405 0.00021.2410 0.00031.2413 0.00031.2416 0.00031.2419 0.00041.2421 0.00031.2424 0.00031.2426 0.00031.2428 0.00031.2430 0.00031.2432 0.00031.2437 0.00021.2441 0.00021.2444 0.00021.2447 0.00021.2450 0.00011.2453 0.0001
1.2454 0.00001.2457 0.00001.2459 0.00011.2461 0.00011.2463 0.00011.2467 0.00001.2471 0.00001.2474 0.00001.2476 0.00011.2478 0.0001
Constants (continued)
CO2:CO =20:1
1.3121 0.04171.3089 0.03981.3072 0.03421.3061 0.03521.3055 0.03141.3047 0.02901.3038 0.02711.3037 0.0237
1.3037 0.02321.3036 0.02031.3039 0.01871.3041 0.01731.3041 0.01581.3046 0.01341.3051 0.01231.3060 0.01061.3068 0.00971.3073 0.00891.3080 0.00761.3084 0.00661.3093 0.0054
1.3102 0.00421.3112 0.00321.3125 0.00221.3139 0.00171.3146 0.00131.3170 0.00091.3185 0.00111.3197 0.00021.3217 0.00031.3230 0.00031.3241 0.00041.3252 0.00031.3263 0.00001.3276 0.00021.3284 0.00051.3293 0.00011.3305 0.00041.3313 0.00041.3322 0.00041.3329 0.00051.3355 0.0003
1.3374 0.00041.3396 0.00031.3420 0.00001.3445 0.0003
1.3467 0.00041.3492 0.00001.3519 0.00021.3543 0.00001.3572 0.00011.3599 0.00031.3691 0.0000
1.3790 0.00021.3912 0.00051.4057 0.00001.4212 0.0004
N2:H20:CO=2:1:1
1.1608 0.06641.1814 0.0532
1.1915 0.04641.2099 0.0458!.2225 0.04861.2321 0.05421.2397 0.06191.2413 0.07031.2421 0.07941.2385 0.08771.2325 0.09471.2238 0.09931.2169 0.10141.2018 0.09941.1971 0.0953
1.1879 0.08821.1806 0.07891.1771 0.06901.1736 0.05771.1746 0.04781.1759 0.03821.1786 0.02991.1822 0.02271.1876 0.01711.1890 0.01221.1953 0.00891.2042 0,00461.2117 0.00261.2170 0.0018
1.2218 0.00151.2251 0.00151.2284 0.00151.2311 0.0015!.2331 0.00151.2352 0.0015
1.2371 0.00151.2384 0.00151.2401 0.0015
1.2415 0.00151.2425 0.00151.2435 0.0016
1.2459 0.00151.2478 0.00161.2494 0.00161.2506 0.00151.2518 0.00161.2531 0.00161.2539 0.00151.2547 0.00151.2554 0.00141.2562 0.00141.2567 0.0015
1.2584 0.00131.2594 0.00131.2603 0.00121.2611 0.00101.2617 0.0008

q5
TABLE 8 - Column Densities of Solid CO in Non-Polar Interstellar Ices and
the Percent of Cosmic Nitrogen and Oxygen in the form of Frozen N2 and 02in the Quiescent Regions of Dense Molecular Clouds
Object N(H)
(xl022 cm-2)N(CO)non-polar %N in Solid N2 %0 in Solid 02
(x 1017 cm -2)
Taurus a (b) (a)
Elias 1 (em) 1.7 0.5 9.7 6
Elias 3 (bkgd) 1.6 1.7 37 23Elias 13 (bkgd) 2.0 0.9 15 9.5Elias 16 (bkgd) 4.2 5.6 43 27Elias 18 (era) 3.5 1.6 15 9.5
Tamura 8 (bkgd) 3.5 4.7 43 27
Serpens c (b)
CK 1 (bkgd?) 2.9 6.5 d 73 46
CK 2 (bkgd) 8.7 10 40 25CK 3 (bkgd?) 1.8 0.87 16 10SVS 4 (bkgd?) 4.8 2.3 16 10SVS 9 (bkgd?) 2.8 <2.6 30 19
Miscellaneous e (e) (e)
NGC 7538 IRS9 (era) 16L1551 IRS 5 (era) 2.3W33A (era) 2.8AFGL 961 (em) 7.4NGC 2024 IRS2 (era) 6.0
6.4 13 8.52.3 33 211.1 1.3 11.5 6.7 41.2 6.7 4
(em) _ object is embedded in the molecular cloud; (bkgd) _ object is behind the molecular cloud.
(a) From Chiar et al. (1995)
(b) Calculated from Av as described in §5.1
(c) From Chiar et al. (1994)
(d) Assumes all CO is in a non-polar ice; see Eiroa & Hodapp (1989)
(e) From Tielens et al. (1991 )

q_
FIGURE CAPTIONS
Figure 1. The concentration dependence of the CO band in N2:CO ices at 12 K. All spectra are
plotted on the scale indicated by the bar in the lower right side of the figure. The spectra are
offset vertically from each other for clarity.
Figure 2. The temperature dependence of the CO band in a N2:CO = 1:20 ice. All spectra are
plotted on the scale indicated by the bar in the lower right side of the figure. The spectra are
offset vertically from each other for clarity.
Figure 3. The concentration dependence of the CO band in N2:H20:CO ices at 12 K. All spectra
are plotted on the scale indicated by the bar in the lower left side of the figure. The spectra are
offset vertically from each other for clarity. The extra feature peaking near 2148 cm -1 in
several mixtures is induced by the presence of H20.
Figure 4. The CO band produced by several O2:CO and N2:O2:CO ices at 12 K. All spectra are
plotted on the scale indicated by the bar in the lower right side of the figure. The spectra are
offset vertically from each other for clarity.
Figure 5. The CO band produced by several CO2:CO and N2:CO2:CO ices at 12 K. All spectra
are plotted on the scale indicated by the bar in the lower left side of the figure. The spectra are
offset vertically from each other for clarity.
Figure 6. The CO band produced by several N2:O2:CO2:CO ices at 12 K. All spectra are plotted
on the scale indicated by the bar in the lower left side of the figure. The spectra are offset
vertically from each other for clarity.
Figure 7. The spectrum of an N2:O2:CO = i :1:1 ice at 12 K before (upper trace) and after (lower
trace) 3 hours of UV photolysis.
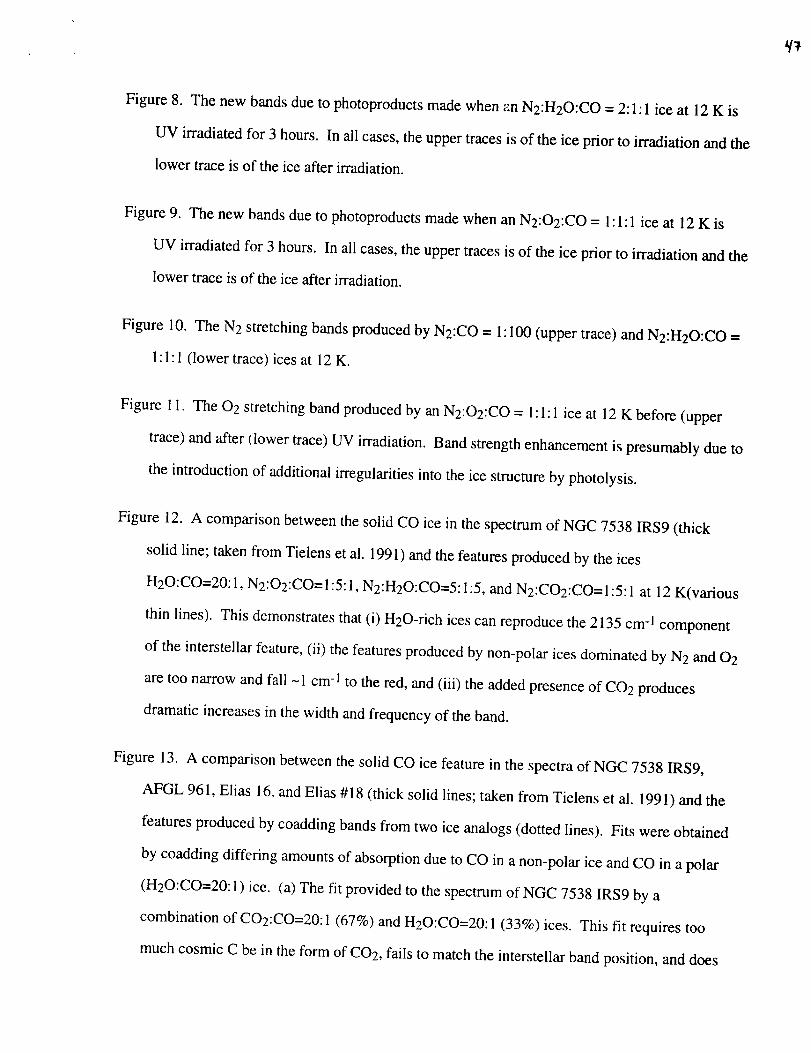
Figure8. Thenew bandsdueto photoproductsmadewhene,n N2:H20:CO = 2:1:1 ice at 12 K is
UV irradiated for 3 hours. In all cases, the upper traces is of the ice prior to irradiation and the
lower trace is of the ice after irradiation.
Figure 9. The new bands due to photoproducts made when an N2:O2:CO = 1:1:1 ice at 12 K is
UV irradiated for 3 hours. In all cases, the upper traces is of the ice prior to irradiation and the
lower trace is of the ice after irradiation.
Figure 10. The N2 stretching bands produced by N2:CO = I: I00 (upper trace) and N2:H20:CO =
1: I: 1 (lower trace) ices at 12 K.
Figure 11. The 02 stretching band produced by an N2:O2:CO = 1:1:1 ice at 12 K before (upper
trace) and after flower trace) UV irradiation. Band strength enhancement is presumably due to
the introduction of additional irregularities into the ice structure by photolysis.
Figure 12. A comparison between the solid CO ice in the spectrum of NGC 7538 IRS9 (thick
solid line; taken from Tielens et al. 1991) and the features produced by the ices
H20:CO=20:1, N2:O2:CO= 1:5:1, N2:H20:CO=5:1:5, and N2:CO2:CO= 1:5:1 at 12 K(various
thin lines). This demonstrates that (i) H20-rich ices can reproduce the 2135 cm-1 component
of the interstellar feature, (ii) the features produced by non-polar ices dominated by N2 and 02
are too narrow and fall -1 cm -1 to the red, and (iii) the added presence of CO2 produces
dramatic increases in the width and frequency of the band.
Figure 13. A comparison between the solid CO ice feature in the spectra of NGC 7538 IRS9,
AFGL 961, Elias 16, and Elias #18 (thick solid lines; taken from Tielens et al. 1991) and the
features produced by coadding bands from two ice analogs (dotted lines). Fits were obtained
by coadding differing amounts of absorption due to CO in a non-polar ice and CO in a polar
(H20:CO=20:1) ice. (a) The fit provided to the spectrum of NGC 7538 IRS9 by a
combination of CO2:CO=20:1 (67%) and H20:CO=20:1 (33%) ices. This fit requires too
much cosmic C be in the form of CO2, fails to match the interstellar band position, and does
notaccountfor thehighfrequencywing of the interstellar feature. (b) The fit provided to the
spectra of NGC 7538 IRS9 and Elias #16 by a combination of N2:O2:CO2:CO= 1:5:1/2:1
(67%) and H20:CO=20:1 (33%) ices. (c) The fit provided to the spectra of AFGL 961 and
Elias #18 by a combination of N2:O2:CO2:CO=1:5:1/2:1 (50%) and H20:CO=20:1 (50%)
ices. Coadds with the N2:O2:CO2:CO=1:5:1/2:1 ice produce a much better fit. Higher
proportions of the polar, H20-rich ice component are required for the embedded objects
AFGL 961 and Elias 18, suggesting that these lines of sight sample the vicinities of newly
forming stars where the interstellar ices may be partially 'distilled' of their more volatile, non-
polar components.
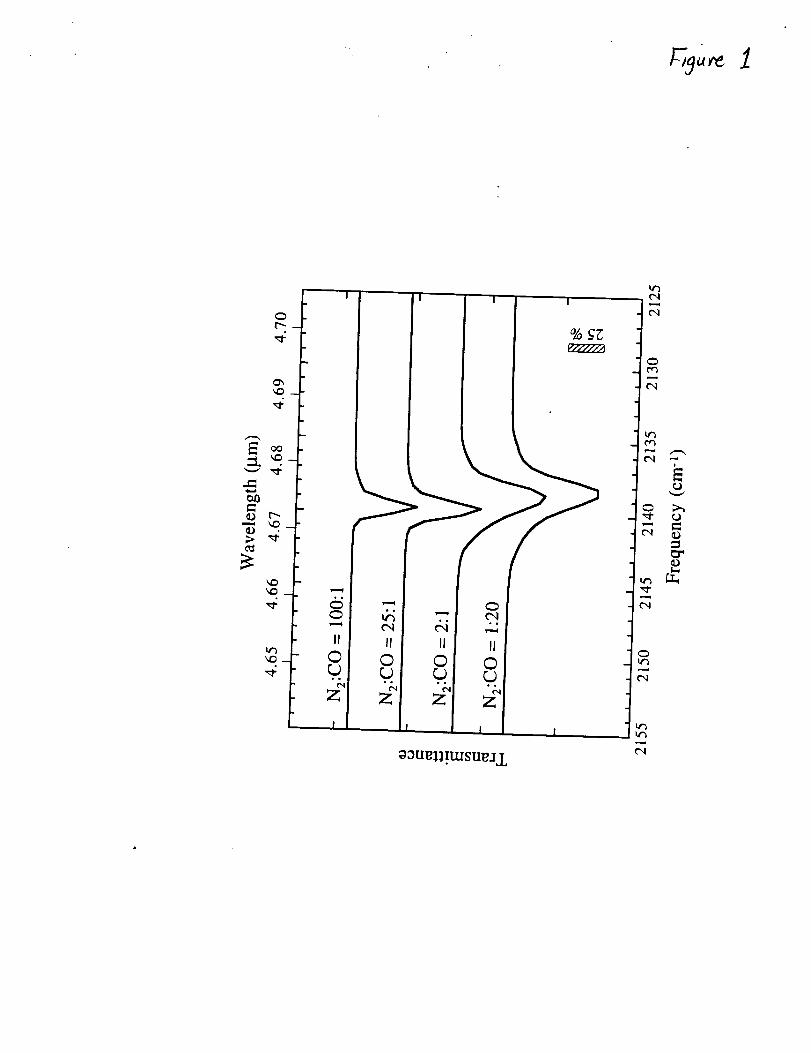
'1
C'q
II II
© ©
°° °°eql
Z Zl
I
o3uP,11.nusu_,.LL
!
% _
he3
c'q
¢s,3
C'q
0h_
C'q
It3

CD_2
.p,,_
[.-
Wavelength (gm)
4.65 4.66 4.67 4.68 4.69 4.70
.... I i _ t , ,t I , , , I i , , ,I, i , , i, , I , ,I, ,
N2:CO = 1:20 Ice
12 K
- 25 K
30 K
32 K (x2)
33 K (x.240) ,_A _ _ J
2155 2150 2145 2140 2135 2130 2125
Frequency (cm -I)
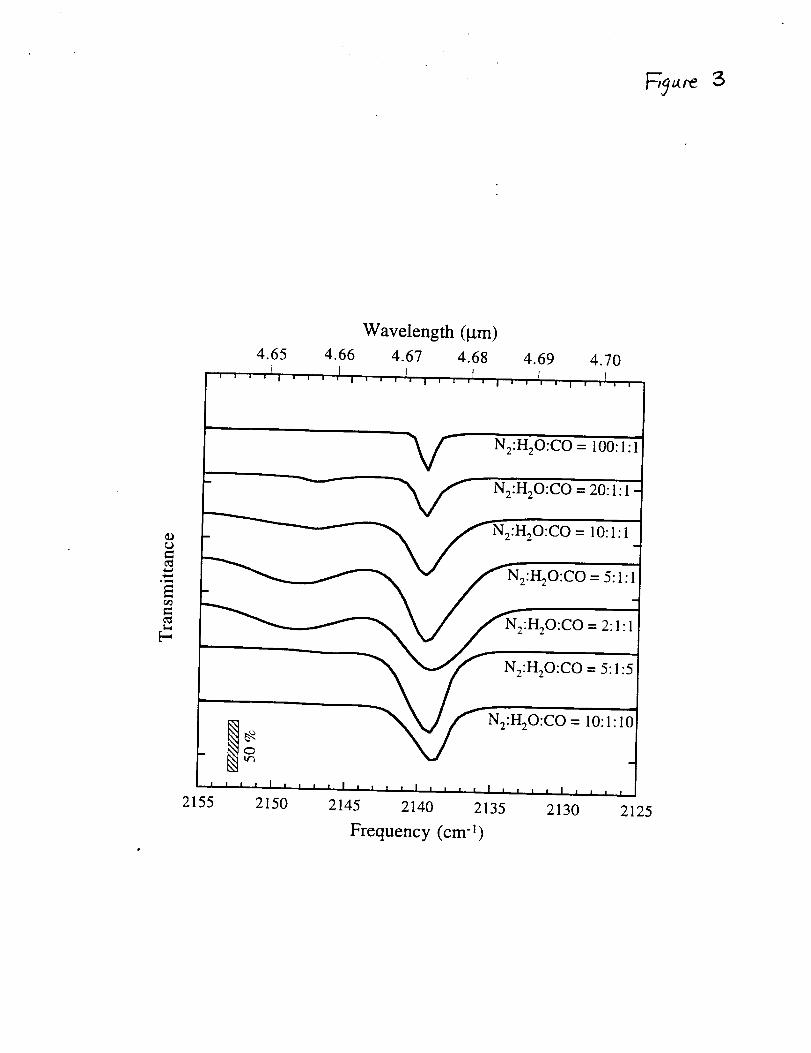
Wavelength (I.tm)4.65 4.66 4.67 4.68 4.69 4.70
f i J r I PI I _ 'I j I _ _ m I J i I I | l I I I I i I J I _ ! I i I I :
oo
i
N2:H20:CO = 100:1:1
i i
- _ _ N2:H20:CO = 20:1 : 1
fN2:H20:CO = 10:1:1
2:H2_ = 5:1:1.
I x_/fN2:H20:CO = 5:1:5
__'_-N2:H20:CO = I0:1" 10O
- tr_
2155 2150 2145 2140 2135 2130 2125
Frequency (cm -1)
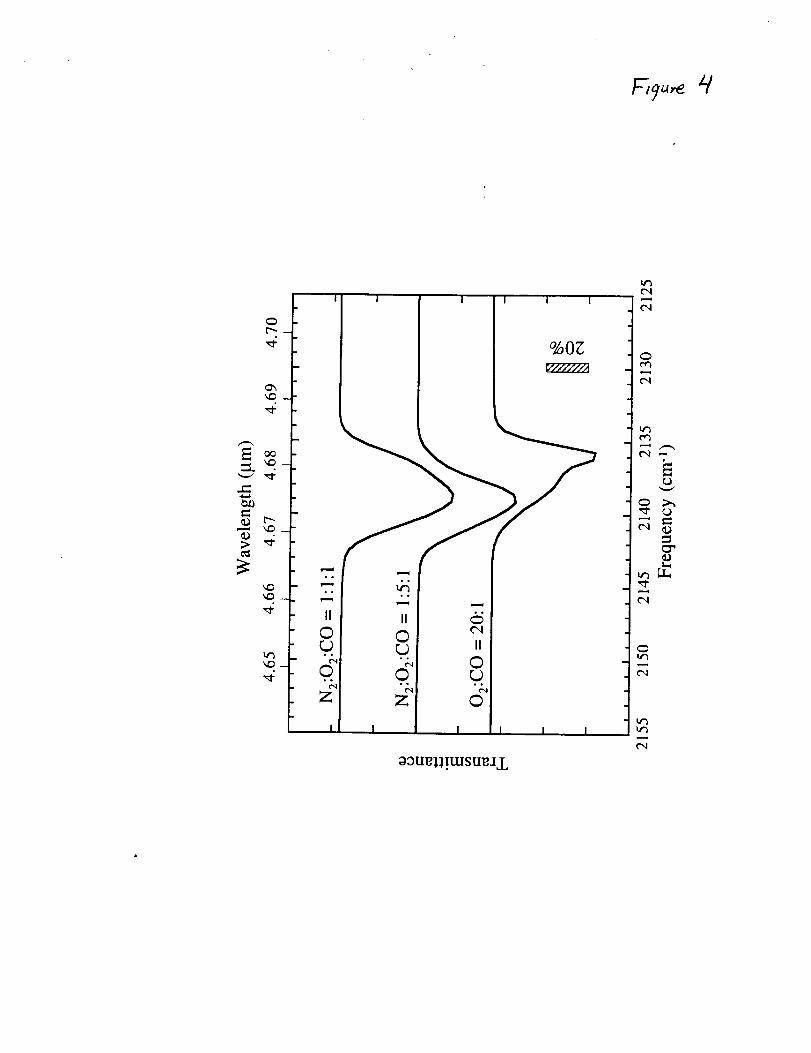
! I i i 1
%0g- _
• •
II "
©r..)
_o
Z
©r...)
• °
©
Z
H©
I
a_u_.n.usu_i I

z3uell.n.usueaI
-
cq
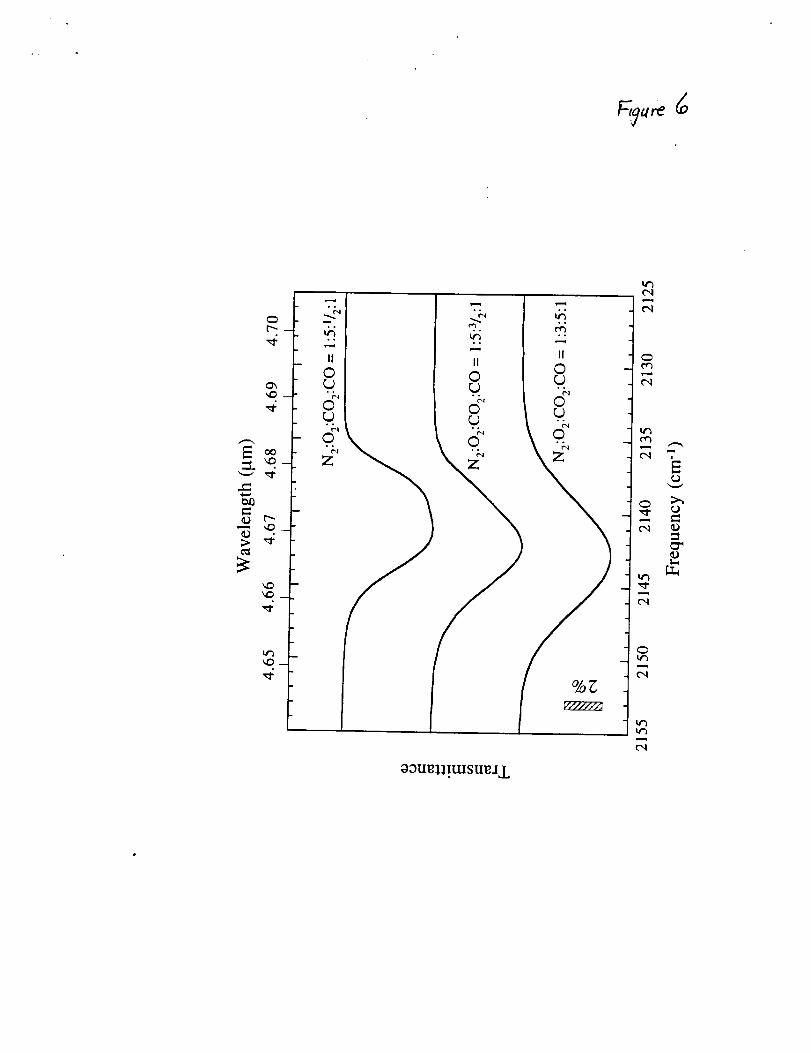
0r'--
¢m
02um,_!ulsu_.t I
O4
0'3
t",l
tt3
ttb
hr_tt_
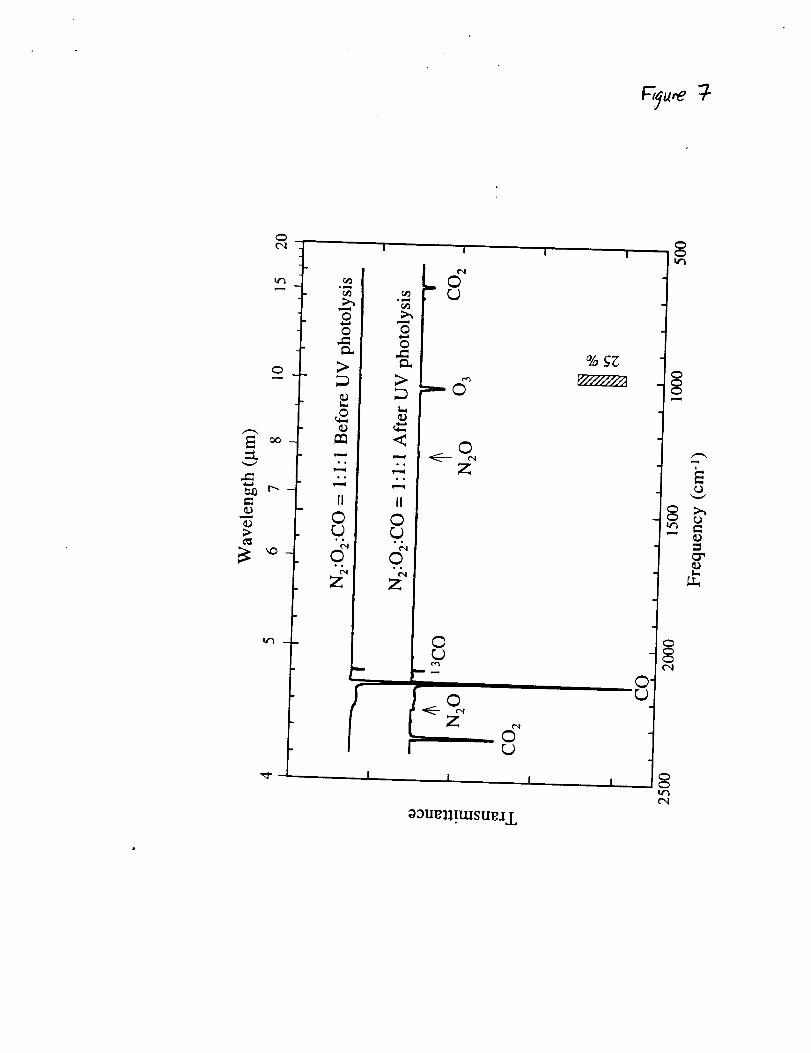
('4
0
m._J
_J
.
0
>,
0J
• °
_°
II
©
©• °
Z
0
0
,<
°o
II
©L)
©• °
¢'4
Z
©
©Z
©
_ouell!tusuuj L¢'4
i

t_
o0
II
0
z_
I J i i I
Z
x _ f I
r_
- -t_..
0
en
¢'I
II
©
..
0
"" Z
J _
i °II
8
i i i _ i
-5°._ Z_
0
et.
II II8 i 8 o_Z Z
r I J I I
o0
_o
It
©
©
.°
£
r_
II
8
5i ;_f-j
0
o

o_u_ll!wsue_C
I
0
0
II
0.o
0
z_
i
0
II
0
z_
I I I
0
_D
II
0.o
!
i i i
0
D.
<
il
0
z_
o_u_1!tusu_ L
I
I
° I¢'4
°=° _I
i7+_ " OI
• "al
<--, . z I- I
• e I8 ,
!!
L
f_-,--- 0
0
i <|
| .o
. II
• 0
0,z _
l
_au_ll!l.l.Ilu_,_J..
I1
ft
ft
0
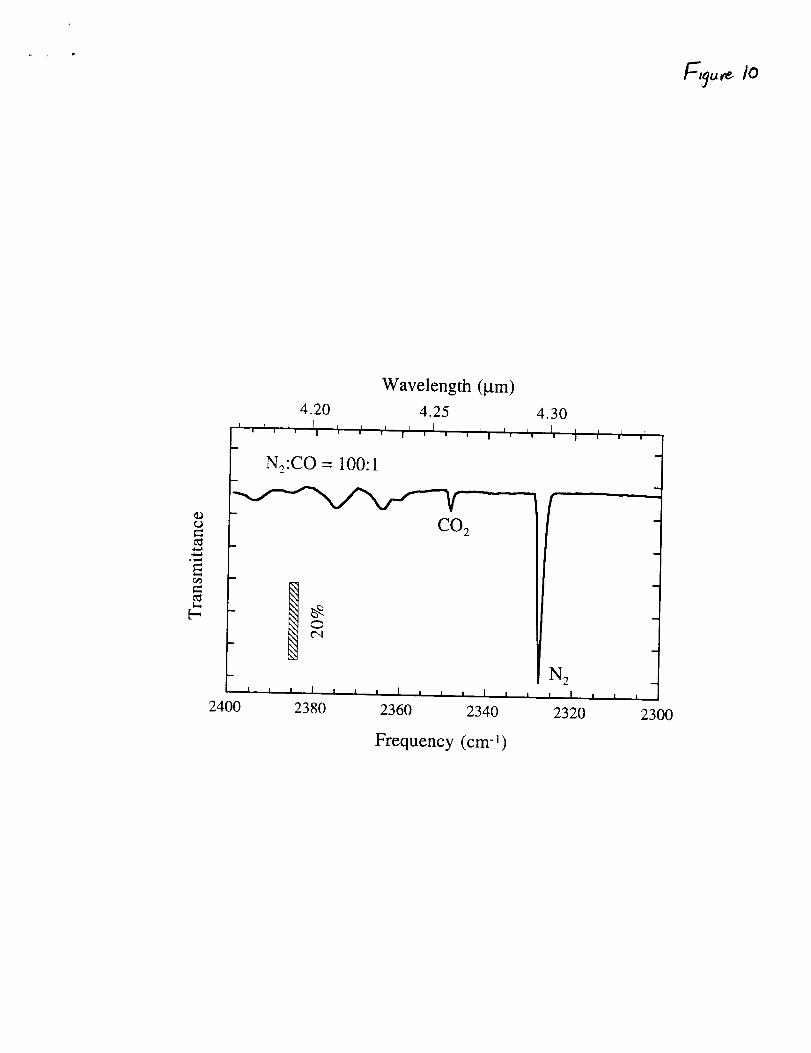
_J
r._
[-
Wavelength (lam)
4.20 4.25 4.30
K , I , _, [I i, ,i _L iJ , I , J , I I i, i, I, t i ,I ,;
- N2:CO = 100:1B
2400 2380 2360 2340 2320 2300
Frequency (cm -])
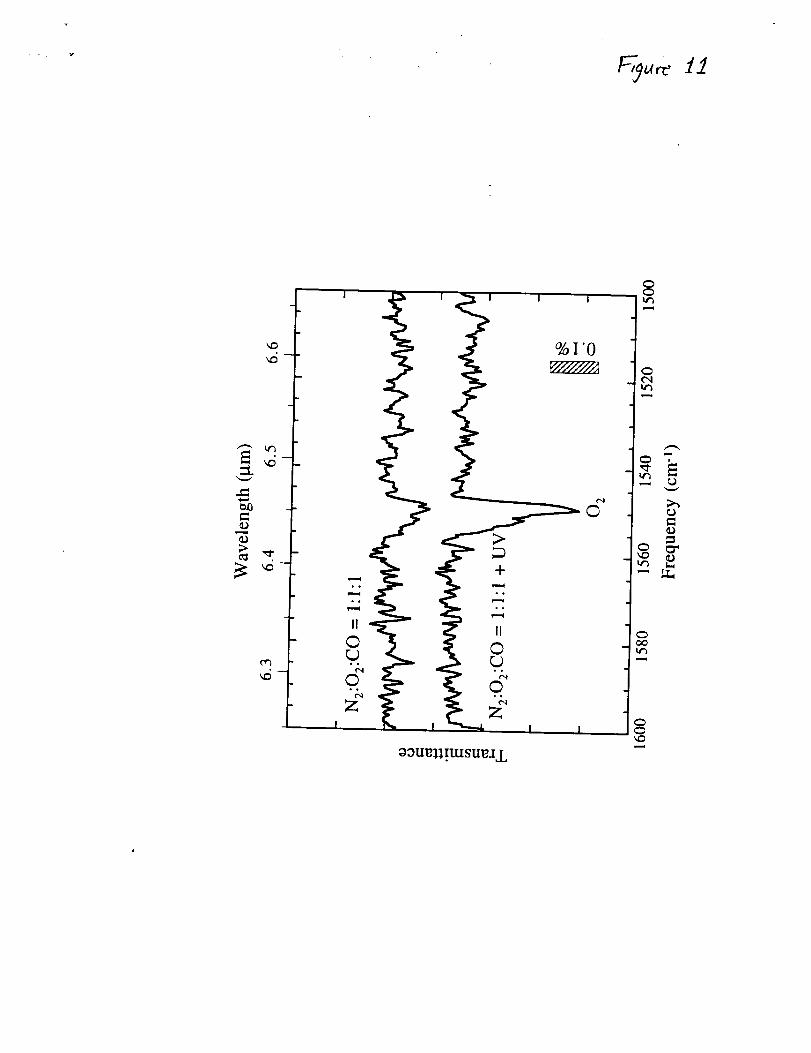
%1"0
:>

bT,y e/2
4.65
Wavelength (_tm)
4.66 4.67 4.68 4.69 4.70
op,,_
t_,
[..,
N2:H20:CO
(5:l:5)NN_ .-om °
NGC 7538
IRS9
/
Nz:O2:CO
(1:5:1)
HzO:CO
(20:1)
2155 2150 2145 2140 2135
Frequency (cm -l)
2130 2125

/3
la
°_,,_
b-,
Wavelength (gm)
4.65 4.70 4.75
(c)AFGL 961
2160 2150
Elias # 18
'_.. ......... { (5°%) H20:CO=20:1(50%) N2:O2:CO2:CO= 1:5: V2:1 _
2140 2130 2120
Frequency (cm -1)
2110 2100