and unaudited financial statements year report 2011.pdf · we are pleased to present kiwirail’s...
TRANSCRIPT

half year reportand unaudited financial statements
for the six months ended 31 December 2011

Napier
Tauranga
AUCKLAND
Whangarei
Palmerston North
Hamilton
New Plymouth
Ashburton
Blenheim
DUNEDIN
Timaru
CHRISTCHURCH
Invercargill
Whanganui
Gisborne
Masterton
Oamaru
Dargaville
KinleithTe Kuiti
Taumarunui
StratfordWaiouru
Dannevirke
Kaikoura
Picton
Westport
Reefton
Greymouth
Hokitika
Rolleston
Port Chalmers
Bluff
Wairio
Featherston
Otaki
Kawerau
WELLINGTON
> Further information
For assistance, publications or information concerning KiwiRail please visit our website
at www.kiwirail.co.nz or contact:KiwiRail Communications
PO Box 593, Wellington , 6140 Telephone: 0800 801 070
Email: [email protected]
THE KIWIRAIL BUSINESSKiwiRail is a State Owned Enterprise and the backbone of New Zealand’s integrated transport network. Our vision is to be a world class mover of freight and people by rail and ships, and to be the natural choice for our customers in the markets in which we operate.
We have five business units:
▪ KiwiRail Freight provides rail freight services and locomotives for passenger services
▪ KiwiRail Interislander operates the Cook Strait ferry passenger and freight services ▪ KiwiRail Infrastructure and Engineering maintains and improves the rail network and controls the operation of trains
on the network – it also operates the workshops which maintain our rolling stock ▪ KiwiRail Passenger provides urban passenger services in
Wellington under contract to the Greater Wellington Regional Council through the TranzMetro team, and the Tranz Scenic team operates the long distance passenger rail services.
> Operations
Each week, train control operations manage the movement of:
▪ 900 freight trains ▪ 52 inter-city passenger trains ▪ Approximately 2,200 suburban passenger services in Wellington ▪ Approximately 1,490 suburban passenger services in Auckland.
In a year, Interislander manages 4,600 sailings carrying:
▪ 947,000 passengers ▪ 59,000 rail wagons ▪ 48,000 trucks ▪ 224,000 cars.
> Assets
▪ Approximately 4,100 staff ▪ 4,000 kms of track ▪ 1,656 bridges ▪ 144 tunnels ▪ 12,000 culverts ▪ Six million sleepers ▪ 18,000 ha of property managed ▪ 169 mainline locomotives ▪ 4,600 freight wagons ▪ 2 owned and 1 leased ferry

1KiwiRail - Half year report December 2011
CONTENTS
Chairman and Chief Executive’s Review 2
Key Financial Information 2
Business Performance 3
Business Improvements 4
Outlook 5
Key Performance Measures 7
Financial Statements 11

2
CHAIRMAN AND CHIEF EXECUTIVE’S REVIEW
John Spencer, Chairman
Jim Quinn, Chief Executive
KEY FINANCIAL INFORMATION
We are pleased to present KiwiRail’s report and unaudited financial statements for the six months ended 31 December 2011.
While the first half of this financial year has provided many challenges, as we continue to grow revenue and invest for the future we have still achieved an increase in revenue of almost five percent compared to the same time last year. These challenges have meant a reduction of 12 percent in our overall EBITDA result.
Direct comparison to the last half year is difficult as we received a revenue boost for Rail Freight and Interislander as a result of the September 2010 Christchurch earthquake.
December 2011Unaudited
December 2010Unaudited Variance Variance
$m $m $m %
Operating Revenue 349.0 332.2 16.8 5.1%
Operating Expenses (305.4) (282.7) (22.7) (8.0%)
Operating profit before depreciation and grant income (‘EBITDA’) 43.6 49.5 (5.9) (11.9%)
Depreciation and amortisation (155.4) (137.7) (17.7) (12.9%)
Net finance costs and foreign exchange losses (17.7) (21.6) 3.9 18.1%
Taxation (expense)/credit 11.1 (1.7) 12.8 752.9%
Net deficit after tax (118.4) (111.5) (6.9) (6.2%)
Grant Income 72.7 202.3 (129.6) (64.1%)
Net (deficit)/surplus after tax as per financial statements
(45.7) 90.8 (136.5) (150.3%)
Some of these challenges include the continued impact of the Christchurch earthquakes on the Tranz Scenic business, the increased costs associated with the construction and commissioning of the Aratere, and the reduced revenue for Tranz Metro due to the transfer of assets to Greater Wellington Regional Council. There have been further impacts on our revenue and costs due to events causing track damage such as ongoing earthquakes and slips, the extra resources needed for the Rugby World Cup and the slower than planned commissioning of new freight rolling stock.
Despite these issues and flat economic growth we have achieved an increase in freight revenue of $21.5 million, with Import-Export volumes up by 16 percent on the same period last year.
Our investment programme to improve our national
network continues. We have invested over $150 million
in the last six months and the Wellington and Auckland
upgrade projects are largely complete.
We are now focused on improving performance across
the entire business over the remainder of this financial
year and beyond in an effort to try and address this
shortfall in EBITDA. This focus includes a hard look
at our costs and investment priorities. As the current
challenging economic environment looks unlikely to
improve its important we are focused on maintaining a
tighter control on our costs to ensure we stay on track to
financial sustainability.

3KiwiRail - Half year report December 2011
As shown above our freight business, including the infrastructure it runs on, continues to perform well, with freight in particular increasing tonnages and revenue. But the freight result is still short of our Statement of Corporate Intent (SCI) EBITDA target by 9.5 percent or almost $10 million. This is due to the Aratere commissioning delay, slower than planned commissioning of new rolling stock and less demand for Domestic freight.
The rail freight business has continued its growth in all
three sectors in which it operates – Bulk, Import-Export
and Domestic* – and has achieved a revenue result of
over $220 million for the half year. This revenue increase
is due to both freight business growth and fuel price
recoveries. This result represents over 60 percent of
KiwiRail’s overall revenue.
Business Performance
REVENUE VOLUME
December 2011
December 2010 Variance Volume
measureDecember
2011December
2010 Variance
$m $m % $m $m %
Bulk 84.9 77.4 9.7% NTKs1 988.0 968.6 2.0%
Domestic 53.6 50.1 7.0% TEU Kms2 60.0 60.2 (0.3%)
IMEX 61.2 54.4 12.5% TEU Kms 59.9 51.8 15.6%
Total 199.7 181.9 9.8%
*IMEX (import, export manufactured goods), Bulk (coal, forestry, liquid milk), Domestic (full container loads transported internally in NZ).1 NTKs – Net Tonne Kilometres is the measure of freight weight multiplied by distance travelled.2 TEU Kms – The measure of 20 foot equivalent containers multiplied by the distance travelled.
SUMMARY – KIWIRAIL CORE FREIGHT REVENUE
The Import-Export volume growth of 16 percent is primarily due to strong export dairy demand. We were also tested and responded well to an increase in ship diversions to different ports. We expect the growth in this segment of the freight business to continue as we add more rolling stock capacity and customers.
The Bulk business, including forestry, increased
revenue by $7.5million and volumes by 5.3 percent.
This was again a result of the highly productive dairy
season and the continued demand from China for our
forestry products.
EBITDA External Revenue
December2011
December2010 Variance Variance December
2011December
2010 Variance Variance
$m $m $m % $m $m $m %
Freight 63.6 58.7 4.9 8.3% 221.3 199.8 21.5 10.8%
Infrastructure (27.6) (31.2) 3.6 11.5% 15.5 12.2 3.3 27.0%
Subtotal 36.0 27.5 8.5 30.9% 236.8 212.0 24.8 11.7%
Interislander 4.0 6.0 (2.0) (33.3%) 57.1 55.7 1.4 2.5%
Tranz Scenic (2.5) (0.1) (2.4) (2,400.0%) 9.9 11.8 (1.9) (16.1%)
Tranz Metro 2.0 5.1 (3.1) (60.8%) 23.7 32.5 (8.8) (27.1%)
Mechanical (1.9) 1.4 (3.3) (236.0%) 6.0 4.5 1.5 33.3%
Property & Corporate 6.0 9.6 (3.6) (37.5%) 15.5 15.7 (0.2) (1.3%)
Total 43.6 49.5 (5.9) (11.9%) 349.0 332.2 16.8 5.1%
SUMMARY – KIWIRAIL BUSINESS

4
Business ImprovementsDuring the first six months of this financial year KiwiRail has reached some major milestones in our strategy to provide our customers with better service, equipment and infrastructure.
To help ensure the continued growth of our freight business we have commissioned 20 new diesel electric locomotives, 535 wagons, 260 new intermodal containers and new log bolsters for 100 wagons. This new equipment has been essential in ensuring we could more effectively service our customers during the peak freight season. This increase in business was further challenged when the strikes affected Ports of
Auckland, but we still managed to provide the required resources when and where they were needed.
The extensive upgrades of the Auckland and Wellington networks are now 98 percent complete after a major closure over the Christmas/New Year period. Both these projects have been very well managed coming in within one percent of budget and delivered on time.
The next major rail project for that region, the Auckland Electrification Project, is now well underway and on schedule for completion in 2013 in time for the new commuter trains.
While Domestic did increase revenue by seven percent over the half year, volumes have remained static. Freight to Christchurch is lower which reflects the spike that followed the September 2010 earthquake and there has also been a flat peak this year. Fuel recovery was the main driver of the revenue increase which of course also increased costs.
During the half year an internal restructure has meant that the freight business has been enhanced to include direct management of the maintenance of the KiwiRail fleet. This is to ensure that this part of the business is even more closely aligned with the needs and priorities of our customers.
Infrastructure and Engineering have delivered a positive result with improved EBITDA of $3.6 million from the comparable period last year. This is due to lower operational costs with higher levels of capitalisation.
The declining and variable workload for our Workshops is challenging the viability of this business. Every effort is being made to address this issue including a programme to improve productivity and continuing to look for further work.
The other parts of our business, as detailed below, are experiencing different issues that have impacted on their expected revenue results. While some of these issues are outside our control, such as the effect of the Christchurch earthquakes on the Tranz Scenic business, it does mean we have to be proactive in developing mitigation strategies to deal with these.
While Interislander increased revenue by 2.5 percent in the half year, the reduction in its EBITDA result was primarily due to the planned increase in costs to replace the Aratere while she was away and also during commissioning. These costs included the hire of a
replacement ship to help ensure service continuity. While the cost of this project is still to be finalised we are disappointed we have exceeded the original budget by at least $10 million. Despite this, and following some initial commissioning challenges, the ship has performed well over the summer peak period.
Interislander passenger revenue has increased by $1.6 million in the last six months and non-rail freight revenue is in line with budget. Rail freight has been impacted by the Aratere delays, but we have already seen improvements in this segment now the ship is back in full service.
The long distance passenger service continues to be impacted by the Christchurch earthquakes and the associated reduction in tourism demand with EBITDA $2.5 million lower than the same period last year. We are monitoring the impact of the new passenger cars and associated marketing campaign for the Coastal Pacific service. Customer feedback has been positive. Partnership options for the Tranz Scenic services are still being pursued.
Passenger numbers on Wellington’s Tranz Metro services have increased slightly compared to the previous half year to almost 5.8 million. While slightly less than budgeted, we expect these numbers to continue to slowly increase as the new Matangi trains continue their commissioning programme.
Tranz Metro EBITDA changed as a result of the signed agreement between Greater Wellington Regional Council, Government and KiwiRail during the year when a large number of assets were transferred to the Council. Some of the revenue from this contract was subsequently transferred to our Infrastructure and Engineering business.

5KiwiRail - Half year report December 2011
In Wellington we have now commenced the eight-year programme of work worth almost $90 million to further improve this vital commuter and freight network.
The Aratere stretch project has provided KiwiRail with a much needed 30 percent increase in freight capacity and a 100 percent increase for passenger traffic. The benefit of this improvement is already being felt, particularly in the freight business, with full trains able to be loaded, saving time and money.
While the agreement with Greater Wellington Regional Council has had an impact on Tranz Metro’s revenue earnings, it has enabled this business to focus more on improving services. This has resulted in improved
on-time performance for the half year to 91 percent and an increase in passenger yield ($/passenger) by almost seven percent. Another achievement was the introduction of the new Matangi trains on the Waikanae line in August. There are now approximately half of the Matangi fleet in service in the Wellington network, with the full fleet scheduled to be in operation this year.
The Tranz Scenic business successfully launched new carriages on the renamed Coastal Pacific service in 2011. These carriages, constructed at KiwiRail’s Hillside Workshops, represent a large improvement for our rail tourism business and they have been very well received by customers.
Community and SafetyKiwiRail has continued its commitment to improving rail safety awareness and management both for staff and the greater community.
The instances of level crossing collisions continued its downward trend in the first half of this financial year. In total there were five level crossing collisions up to December 31, 2011, which is 50 percent less than the previous period.
KiwiRail, in conjunction with the Chris Cairns Foundation, has been running education and awareness programmes to increase the awareness of motorists and pedestrians about the dangers of the rail corridor. We are pleased that these ongoing campaigns seem to be making a real improvement in reducing the number of collisions.
Progress has also been made with our efforts to implement more sustainable business practices.
Last year, GPS units were installed in our road vehicles in a subsequently successful pilot to provide greater visibility of fuel consumption and vehicle utilisation. By the end of December, 50 percent of the vehicles operated by our Infrastructure and Engineering business had GPS units installed with the remainder of the rollout scheduled for completion this year.
Fuel monitoring technology is now installed on both
Interislander’s Arahura and Kaitaki ferries. Staff are now analysing the data in an effort to find ways to reduce fuel consumption.
Interislander and Tranz Scenic formally received their Qualmark Enviro endorsements during the half year. With a silver and bronze endorsement respectively, both businesses have developed action plans to progress towards the next level of endorsement.
And as part of our focus on alternative fuels we are continuing to use a biodiesel blend in the generators of the South Island passenger services. The extended trial has been progressing well and so far the business has not experienced any issues with the use of biodiesel.
KiwiRail uses a number of performance indicators to measure workplace health and safety, with the most important being Lost Time Injury Frequency Rate (LTIFR) and Medical Treatment Injury Frequency Rate (MTIFR).
While both figures have remained relatively static when compared to the previous period, they are still above the SCI targets. In particular the LTIFR of 6.2 is well above the target of 4.4. We are in the process of recruiting a General Manager of People and Safety with one of the madates of this new position to undertake a detailed review of health and safety practices to assess where further improvements need to be made and assist us in our commitment to Zero Harm.

6
Outlook
John Spencer Jim Quinn Chairman Chief Executive
We expect our operating revenue result to remain in line with SCI targets for the remainder of this financial year. But we expect our EBITDA result to be in the $105-$115 million range, compared to our SCI target of $139.5 million.
This reforecast is due to the expected continued soft demand in the Christchurch tourism market affecting our Tranz Scenic and Interislander businesses. We also expect less growth in the Domestic freight market as the economy remains soft.
Last year we announced a review of the company’s asset valuation system and structure. We have consulted with our shareholder who is supportive of this proposal. We are still working through the final details and expect completion at the end of this financial year.
The main focus for the rest of the year is to hold the business tight and gain the full benefit from last year’s investments in infrastructure and rolling stock improvements.
We will be reviewing our corporate support costs across
the entire business to ensure they are as tight and efficient as possible.
Further areas of focus for improvement or change will be bringing more control over costs and improving the productivity of the Workshops in the face of their declining workload, making a final decision on the minor lines review, reshaping the Overlander service to minimise its costs, working towards finalising a partnership agreement for the Tranz Scenic business, and continuing to challenge Interislander’s business model and how it contributes to the overall business. We will also continue to ensure we improve our yields where they are currently not sustainable and undertake regular review of major contracts.
We would like to thank our customers for their ongoing support and our team for their dedication in delivering the changes required in KiwiRail. We have a long way to go as we continue with our strategy to improve service capability with a stronger and more modern network, and the commissioning of new assets that are fit for purpose, but we are encouraged by our underlying revenue growth.

7KiwiRail - Half year report December 2011
Half Year Actual Half Year Target Full Year SCI Target
Financial Metrics
Total External Revenue 349.0 355.9 737.0
EBITDA 43.6 59.2 139.5
NPAT before grant income (118.4) (97.2) (178.8)
TAP Capital Expenditure 213.2 240.5 411.1
Metro Project Capital Expenditure1 51.8 180.0 327.1
Metro Renewals Capital Expenditure 7.2 10.6 21.3
Key Sales MetricFreight NTK (m) 2,222 2,341 4,601
Freight Average Yield (c/NTK) 8.1 7.9 8.3
Key Investment OutcomesRolling Stock Replacement
Wagons (no. of new units) - - -
Locomotives (no. of new units)2 14 - 20
Network Renewals New Sleepers Laid (000s) 54 56 124
New Rail Laid 17 15 50
Lines De-stressed 141 125 250
Bridges replaced (m) 362 428 716
Timber Piers Replaced 51 57 105
Culverts Replaced 27 35 100
Level Crossing Upgrades 8 8 8
Customer Service PerformanceFreight - Premium Train (%<30min)3 76% 90% 90%
Metro (%<5 min) 91% 90% 90%
Scenic (%<15 min) 78% 80% 80%
Interislander (%<15 min)4 67% 90% 90%
Productivity MeasuresTotal Labour Cost as % of Revenue 41% 42% 42%
Freight Opex to Revenue ratio 72% 68% 69%
Interislander Opex to revenue ratio 95% 93% 85%
Health and SafetyLITFR (per million manhours)5 6.2 4.4 4.4
MTIFR (per million manhours)5 46.1 42.0 42.0
Staff EngagementEngagement 69 79 79
KEY PERFORMANCE MEASURES
The key performance measures are those outlined in the Statement of Corporate Intent (SCI).
1 Metro Project capital expenditure was $128.2m lower than the half year target due to the transfer of the EMU project to Auckland Transport and delays in the other metro projects.
2 The 14 locomotives brought into service in the period are the remainder of the FY11 order. The SCI target is the second order of 20 locomotives.3 Premium Freight Train on time performance is 14 percent below the half year target. This has been significantly impacted by delays in the commissioning of the new
locomotives and delays in bringing the Aratere back into service.4 Interislander on time performance is 23 percent below target for the period due to various operational issues during the reintroduction of the Aratere.5 Lost time and medical time injury frequency rates are both significantly ahead of target for the period. Several initiatives are underway to reduce injury rates including
increased training.

8
Half Year Actual
Half Year Target
Full Year SCI Target
Business Unit Summary $m $m $m
(a) External Revenue
Freight 221.3 222.8 452.0
Interislander 57.1 57.5 130.1
Tranz Scenic 9.9 13.4 28.9
Tranz Metro 23.7 24.2 47.1
Mechanical 6.0 8.8 19.8
Network 15.5 13.4 26.8
Property and Corporate 15.5 15.8 32.3
Total 349.0 355.9 737.0
(b) EBITDA
Freight 63.6 73.1 152.3
Interislander 4.0 5.5 24.5
Tranz Scenic (2.5) 1.4 4.2
Tranz Metro 2.0 2.2 4.4
Mechanical (1.9) 0.8 0.4
Network (27.6) (29.3) (58.0)
Property and Corporate 6.0 5.5 11.7
Total 43.6 59.2 139.5
(c) TAP Capital Expenditure
Freight 65.9 89.2 121.9
Interislander 28.4 25.1 30.1
Tranz Scenic 8.0 17.5 20.8
Tranz Metro - - -
Mechanical 1.0 2.1 3.6
Network 97.1 92.6 207.1
Property and Corporate 12.9 14.0 27.6
Total 213.3 240.5 411.1
KEY PERFORMANCE MEASURES
The key performance measures are those outlined in the Statement of Corporate Intent (SCI).

9KiwiRail - Half year report December 2011
Half Year Actual
Half Year Target
Full Year SCI Target
Ratio of Shareholder's Funds to Total Assets
Shareholder's Funds to Total Assets 93.9% 93.3% 93.1%
The Crown's Investment in KiwiRail ($m)Total Shareholder's Funds (TSF) 12,856 12,869 13,051
Average Shareholder's Funds (ASF) 12,747 12,754 12,830
Financial Performance Measures for SOE PortfolioCrown Investment in KiwiRail
Total Shareholder's Return TBC TBC TBC
Dividend Yield nil nil nil
Dividend Payout nil nil nil
Return on Equity (1.0%) (0.8%) (1.4%)
Return on Equity Adjusted for IFRS fair valuation movements and asset revaluations (5.5%) (4.2%) (7.2%)
Profitability/Efficiency Measures
Return on Capital Employed (4.0%) (3.0%) (5.0%)
Operating Margin 12.5% 16.2% 18.9%
Leverage/Solvency Measures
Gearing Ratio (net) 0.03 0.04 0.04
Interest Cover 2.74 3.63 4.40
Solvency (current assets/current liabilities)1 1.40 0.72 0.81
1 Current DMO debt due has been excluded from current liabilities as this debt is due to be rolled-over during the coming year.
The performance ratios above are not typical of the SOE Government portfolio. Much of this is to do with the soft financial base of the business compounded by the valuation approach adopted in the balance sheet. We are working constructively with the shareholder to agree a more appropriate balance sheet structure going forward.
KEY PERFORMANCE MEASURES
The key performance measures are those outlined in the Statement of Corporate Intent (SCI).

Statement of Financial Performance 11
Statement of Comprehensive Income 12
Statement of Financial Position 13
Statement of Changes in Equity 14
Statement of Cash Flows 15
Statement of Accounting Policies 16
Notes to the Financial Statements 18
FINANCIAL STATEMENTSFor the six months ended 31 December 2011

The accompanying notes form part of these financial statements
11KiwiRail - Half year report December 2011
Note
6 months ended Dec
2011 (Unaudited)
6 months ended Dec
2010 (Unaudited)
Year ended June 2011 (Audited)
$m $m $m
Operating revenues 2 349.0 332.2 667.4
Operating expenses 3 (305.4) (282.7) (567.1)
Operating surplus before depreciation, amortisation and grant income 43.6 49.5 100.3
Grant income 4 72.7 202.3 344.6
Loss on transfer of assets to GWRC - - (107.6)
Gain on transfer of EMU FX contracts to Auckland Council Group 5 42.8 - -
Cumulative foreign exchange loss on EMU FX contracts 5 (40.2) - -
Depreciation and amortisation expense 7e (155.4) (137.7) (283.1)
Net (deficit)/surplus after depreciation and grant income (36.5) 114.1 54.2
Foreign exchange and commodity net gains and losses 5.0 (7.3) (15.9)
Finance income 6 0.8 1.7 4.4
Finance costs 6 (26.1) (16.0) (36.6)
Net (deficit)/surplus before taxation (56.8) 92.5 6.1
Taxation (expense)/credit 11.1 (1.7) 27.9
Net (deficit)/surplus after taxation (45.7) 90.8 34.0
NEW ZEALAND RAILWAYS CORPORATION
CONSOLIDATED STATEMENT OF FINANCIAL PERFORMANCEFor the six months ended 31 December 2011

The accompanying notes form part of these financial statements
12
Note
6 months ended Dec
2011 (Unaudited)
6 months ended Dec
2010 (Unaudited)
Year endedJune 2011 (Audited)
$m $m $m
Net (deficit)/surplus after taxation (45.7) 90.8 34.0
Other comprehensive income
Release of revaluation on asset disposals - - (1.8)
Net gains/(losses) from cash flow hedges 18.8 (36.5) (63.3)
Transfers to asset carrying value from cash flow hedge reserve 7c 4.4 - -
Transfer of EMU FX contracts to Auckland Council Group 5 40.2 - -
Total comprehensive income/(loss) 17.7 54.3 (31.1)
NEW ZEALAND RAILWAYS CORPORATION
STATEMENT OF COMPREHENSIVE INCOMEFor the six months ended 31 December 2011

The accompanying notes form part of these financial statements
13KiwiRail - Half year report December 2011
Note 31 Dec 2011 (Unaudited)
31 Dec 2010 (Unaudited)
30 June 2011 (Audited)
$m $m $m
Current assetsCash and cash equivalents 7d 75.8 207.9 81.1
Trade and other receivables 118.1 132.5 115.5
Inventories 87.3 75.4 73.4
Financial assets 1.8 2.0 1.2
283.0 417.8 271.2
Non-current assetsProperty, plant and equipment 13,398.1 13,178.4 13,284.3
Intangible assets 13.2 10.6 14.6
Financial assets 0.1 - -
Trade and other receivables - 4.0 -
13,411.4 13,193.0 13,298.9
Total Assets 13,694.4 13,610.8 13,570.1
Current liabilitiesTrade and other liabilities 181.7 189.4 198.1
Financial liabilities 332.6 57.8 329.1
Income taxes payable - 3.1 -
Provisions 14.4 6.6 12.7
528.7 256.9 539.9
Non-current liabilitiesTrade and other liabilities 35.5 37.5 35.5
Financial liabilities 225.1 503.3 292.2
Provisions - 2.7 4.0
Deferred taxation 49.1 86.7 60.2
309.7 630.2 391.9Total Liabilities 838.4 887.1 931.8
Net Assets 12,856.0 12,723.7 12,638.3
EquityEquity capital 7d 996.9 796.9 796.9
Retained earnings 1,406.1 1,337.3 1,364.2
Asset revaluation reserve 10,452.9 10,626.0 10,540.5
Cash flow hedge reserve 0.1 (36.5) (63.3)
Total Equity 12,856.0 12,723.7 12,638.3
NEW ZEALAND RAILWAYS CORPORATION
STATEMENT OF FINANCIAL POSITIONAs at 31 December 2011
John Spencer Paula RebstockChair Deputy Chair 24 February 2012 24 February 2012

The accompanying notes form part of these financial statements
14
Note Equity Capital
Retained Earnings
Asset Valuation Reserve
Cash Flow Hedge
ReserveTotal
$m $m $m $m $m
As at 1 July 2010 (Audited) 546.9 1,170.7 10,701.8 - 12,419.4
Net surplus for the period - 90.8 - - 90.8
Other comprehensive incomeRelease of revaluation reserve to retained earnings
- 75.8 (75.8) - -
Losses from cash flow hedges - - - (36.5) (36.5)
Total comprehensive income - 166.6 (75.8) (36.5) 54.3
Transactions with OwnersCapital Injection 7d 250.0 - - - 250.0
As at 31 December 2010 (Unaudited) 796.9 1,337.3 10,626.0 (36.5) 12,723.7
Net (deficit)/surplus for the period - (56.8) - - (56.8)
Other comprehensive incomeRelease of revaluation reserve to retained earnings
- 76.2 (76.2) - -
Release of revaluation reserve on transfer of Metro assets to GWRC
- 7.5 (7.5) - -
Release of revaluation reserve on disposal of other assets
- - (1.8) - (1.8)
Losses from cash flow hedges - - - (26.8) (26.8)
Total comprehensive income - 26.9 (85.5) (26.8) (85.4)
As at 30 June 2011 (Audited) 796.9 1,364.2 10,540.5 (63.3) 12,638.3
Net surplus for the period - (45.7) - - (45.7)
Other comprehensive incomeRelease of revaluation reserve to retained earnings
- 87.6 (87.6) - -
Net gains from cash flow hedges - - - 18.8 18.8
Transfers to asset carrying value from cash flow hedge reserve
- - - 4.4 4.4
Transfer of EMU FX contracts to Auckland Council Group
5 - - - 40.2 40.2
Total comprehensive income - 41.9 (87.9) 63.4 17.7
Transactions with OwnersCapital Injection 7d 200.0 - - - 200.0
As at 31 December 2011 (Unaudited) 996.9 1,406.1 10,452.9 0.1 12,856.0
NEW ZEALAND RAILWAYS CORPORATION
STATEMENT OF CHANGES IN EQUITYFor the six months ended 31 December 2011

The accompanying notes form part of these financial statements
15KiwiRail - Half year report December 2011
Note6 months ended
Dec 2011 (Unaudited)
6 months ended Dec 2010
(Unaudited)
Year ended June 2011 (Audited)
$m $m $m
Cash flows from operating activities
Proceeds from:
Receipts from customers 357.6 306.7 657.6
Interest received 0.8 1.7 4.3
Operating grant - 4.2 -
Proceeds utilised for:
Payments to suppliers and employees (344.3) (304.0) (585.4)
Interest expense (27.1) (15.1) (28.9)
Income tax paid - - -
Net cash from operating activities 10 (13.0) (6.5) 47.6
Cash flows from investing activities
Proceeds from:
Sale of property, plant and equipment 6.3 - 14.4
Capital grant receipts 72.7 204.2 344.6
Proceeds utilised for:
Purchase of property, plant and equipment (268.6) (290.7) (653.2)
Purchase of intangibles (1.5) - (7.4)
Net cash used in investing activities (191.1) (86.5) (301.6)
Cash flows from financing activities
Proceeds from:
Long term borrowings - 55.0 90.8
Crown capital injection 7d 200.0 250.0 250.0
Proceeds utilised for:
Repayment of finance lease liability - (35.9) (36.0)
Repayment of borrowings (1.2) (0.2) (1.7)
Net cash from financing activities 198.8 268.9 303.1
Net increase/(decrease) in cash and equivalents (5.3) 175.9 49.1
Cash and cash equivalents at the beginning of the period
81.1 32.0 32.0
Cash and cash equivalents at the end of the period 7d 75.8 207.9 81.1
NEW ZEALAND RAILWAYS CORPORATION
STATEMENT OF CASH FLOWSFor the six months ended 31 December 2011

16
NEW ZEALAND RAILWAYS CORPORATION
STATEMENT OF ACCOUNTING POLICIESFor the six months ended 31 December 2011
> REPORTING ENTITY
New Zealand Railways Corporation is a statutory corporation established pursuant to the New Zealand Railways Corporations Act 1981 and is included within the First Schedule of the State Owned Enterprises Act 1986. “The Group” comprises the New Zealand Railways Corporation and its subsidiaries and associate companies. The Group is domiciled in New Zealand. The Group is designated as a Public Benefit Entity.
The primary objective of the Group is to establish, maintain and operate, or otherwise arrange for, safe and efficient rail, road and ferry freight and passenger transport services within New Zealand in such a way that revenue exceeds costs, including interest and depreciation; and to provide for a return on capital as specified by the Minister of Finance from time to time.
The interim financial statements of the Group are for the six months ended 31 December 2011 and were authorised by the Board for issue on 24 February 2011.
> BASIS OF PREPARATION
Statement of compliance
The interim financial statements comply with the New Zealand Railways Corporations Act 1981, the State-Owned Enterprises Act of 1986 and New Zealand equivalents to International Financial Reporting Standards, New Zealand Generally Accepted Accounting Practice and other applicable financial reporting standards as appropriate for public benefit entities.
These unaudited, condensed Interim Financial Statements comply with NZ IAS-34 Interim Financial Statements.
Changes in accounting policies
There have been no material changes in accounting policies. All policies have been applied on a basis consistent with those used in previous periods. Where necessary certain comparative information has been reclassified for consistency with the current period. The interim report should be read in conjunction with the annual report for the year ended 30 June 2011.
> DERIVATIVE FINANCIAL INSTRUMENTS AND HEDGING ACTIVITIES
The Group uses derivative financial instruments within predetermined policies and limits in order to manage its exposure to fluctuations in foreign exchange, commodity and interest rate risks. The Group does not engage in speculative transactions or hold derivative financial instruments for trading purposes.
To manage this exposure the Group uses the following derivative financial instruments:
▪ Foreign exchange forward contracts and options ▪ Interest rate swaps ▪ Fuel commodity hedges
Derivative financial instruments are initially recognised at fair value on the date a derivative contract is entered into (the trade date). Any transaction costs are expensed immediately. The derivative financial instruments are subsequently re-measured to fair value. The method of recognising the resulting gain or loss depends on whether the derivative financial instrument is designated as a hedging instrument, and, the nature of the item being hedged.
Gains and losses, and movements in fair values of derivative financial instruments not in hedging relationships are recognised in the Statement of Financial Performance as follows:
▪ Foreign exchange forward contracts and options excluding contracts relating to fuel purchases– as part of ‘Foreign exchange net gains and losses’
▪ Interest rate swaps – as part of ‘Net finance costs’ ▪ Fuel related foreign exchange forward contracts, fuel commodity hedges and copper commodity hedges – as part
of ‘Operating expenses’
17KiwiRail - Half year report December 2011
The risk management objectives and strategy for undertaking various hedge transactions is covered by the Group Treasury Policy. The Group documents, at the inception of the transaction, the hedging relationship between hedging financial instruments and the hedged items. The Group also documents its assessment, both at hedge inception and on an ongoing basis, of whether the derivatives used in the hedging transaction are highly effective in offsetting changes in fair values or cash flows of hedged items.
The fair value of derivative financial instruments is classified as a non-current asset or liability when maturity of the hedged item exceeds 12 months. It is classified as a current asset or liability when the maturity of the hedged item is less than 12 months.
Cash flow hedges
Changes in the fair value of derivative financial instruments designated as cash flow hedges are recognised directly in the cash flow hedge reserve within equity to the extent that the hedges are deemed effective. To the extent that the hedges are ineffective for accounting, changes in fair value are recognised in the Statement of Financial Performance in Foreign exchange and commodity net gains and losses.
If a derivative financial instrument no longer meets the criteria for hedge accounting, expires or is sold, terminated or exercised, or the designation of the hedge relationship is revoked or changed, then hedge accounting is discontinued. The cumulative gain or loss previously recorded in the cash flow hedge reserve remains there until the forecast transaction occurs. If the underlying hedged transaction is no longer expected to occur, the cumulative, unrealised gain or loss recognised in the cash flow hedge reserve with respect to the derivative instrument is recognised immediately in the Statement of Financial Performance.
Where the hedge relationship continues throughout its designated term, the amount in the cash flow hedge reserve is transferred to the carrying value of the asset when it is recognised.
> NEW STANDARDS ADOPTED
The Group has adopted the following new and amended NZ IFRSs as of 1 July 2011:
▪ IFRIC 13 Customer Loyalty Programmes (amended 2010) is effective for reporting periods beginning on or after 1 January 2011. The revised standard clarifies that the fair value of award credits takes into account the amounts of discounts or incentives that otherwise would be offered to customers that have not earned the award credits. This change has not had a material impact of the consolidated financial results of the Group as award programmes are a relatively small part of the business of the Group.
▪ NZIAS 24 Related Party Disclosures (revised 2009) is effective for reporting periods beginning on or after 1 January 2011. The revised standard requires further disclosures of transactions with related parties. The additional disclosures do not have any impact on the consolidated financial results of the Group and are not required for these interim financial statements.
> NEW STANDARDS AND INTERPRETATIONS NOT YET ADOPTED
The following standards and amendments were available for early adoption but have not been applied by the Group in the preparation of these financial statements:
▪ NZIFRS 9 Financial Instruments (revised 2010) is the first standard issued as part of a wider project to replace NZIAS 39 and is effective for reporting periods beginning on or after 1 January 2013. The revised standard amends measurement categories for financial assets. It is not expected to have any impact on the consolidated financial results of the Group.
NEW ZEALAND RAILWAYS CORPORATIONSTATEMENT OF ACCOUNTING POLICIES FOR SIX MONTHS ENDED 31 DECEMBER 2011 (CONTINUED)

18
1. TOTAL INCOME
Note6 months ended
Dec 2011 (Unaudited)
6 months ended Dec 2010
(Unaudited)
Year ended June 2011 (Audited)
$m $m $m
Revenue 2 349.0 332.2 667.4
Grant income 4 72.7 202.3 344.6
Total income 421.7 534.5 1,012.0
2. REVENUENote
6 months ended Dec 2011
(Unaudited)
6 months ended Dec 2010
(Unaudited)
Year ended June 2011 (Audited)
$m $m $m
Freight 7a 221.3 199.8 396.7
Mechanical 6.0 4.5 9.0
Interislander 57.1 55.7 122.9
Tranz Metro 7a 23.7 32.5 65.5
Tranz Scenic 9.9 11.8 21.5
Property and Corporate 15.5 15.7 31.8
Network 15.5 12.2 20.0
Total revenue 349.0 332.2 667.4
3. OPERATING EXPENSES 6 months ended Dec 2011
(Unaudited)
6 months ended Dec 2010
(Unaudited)
Year ended June 2011 (Audited)
$m $m $m
Salaries and wages 122.1 112.3 249.8
Defined contribution plan employer contributions 4.4 4.1 8.3
Employee entitlements 8.1 9.1 13.9
Other employee expenses 1.7 2.3 4.2
Total staff costs 136.3 127.8 276.2
Materials and supplies 44.8 43.5 67.1
Fuel and traction electricity 60.0 48.6 105.3
Lease and rental costs 24.8 23.5 46.7
Incidents, casualties and insurance 7.6 6.8 13.9
Contractors’ expenses 7.6 7.7 14.2
Fees paid to auditors:
Audit fees 0.3 0.1 0.4
Impairment of receivables (0.2) (0.1) (0.5)
Directors’ fees 0.2 0.2 0.3
Loss on disposal of property, plant and equipment 0.3 0.8 1.3
Other expenses 23.7 23.8 42.2
Total operating expenses 305.4 282.7 567.1
NEW ZEALAND RAILWAYS CORPORATION
NOTES TO THE FINANCIAL STATEMENTSFor the six months ended 31 December 2011

19KiwiRail - Half year report December 2011
4. GRANT INCOME
Note6 months ended
Dec 2011 (Unaudited)
6 months ended Dec 2010
(Unaudited)
Year ended June 2011 (Audited)
$m $m $m
Capital grants for metro projects
Auckland rail development 7b 2.3 15.4 46.6
Wellington rail development 7b 1.7 62.6 79.9
Auckland electrification project 7b 49.7 60.5 125.0
Other capital grants
Rail upgrade and growth 7b 6.9 53.7 70.8
Other 12.1 10.1 21.8
Public policy grant - - 0.5
Total grant income 72.7 202.3 344.6
5. TRANSFER OF ELECTRICAL MULTIPLE UNITS (“EMU”) FOREIGN EXCHANGE CONTRACTS TO AUCKLAND COUNCIL GROUP
During the year an agreement was reached between the Crown and Auckland Council Group to transfer the procurement and ownership of the EMUs from NZRC to Auckland Transport.
During the initial phases of the procurement process NZRC entered into forward exchange contracts to mitigate the foreign currency exposure on the EMU units. These forward exchange contracts were being hedge accounted in NZRC’s financial statements. In October 2011 the hedge contracts were novated to Auckland Council Group and from this date, hedge accounting for these contracts was discontinued and the contracts derecognised in the financial statements.
This has resulted in the following:
▪ A gain in the Statement of Financial Performance of $42.8m being the value of the liability novated to Auckland Council Group for nil consideration. This profit on derecognition has been separately disclosed in the Statement of Financial Performance.
▪ An expense in the Statement of Financial Performance of $40.2m being the cumulative loss on the hedging instruments held in the cashflow hedge reserve. This expense has been separately disclosed in the Statement of Financial Performance.
The difference between the gain on derecognition and the cumulative loss on the hedging instrument is the ineffective portion of the hedge contract that was expensed in the 2011 financial year.
NEW ZEALAND RAILWAYS CORPORATIONNOTES TO FINANCIAL STATEMENTS FOR THE SIX MONTHS ENDED 31 DECEMBER 2011 (CONTINUED)

20
6. NET FINANCE COSTS
Note6 months ended
Dec 2011 (Unaudited)
6 months ended Dec 2010
(Unaudited)
Year ended June 2011 (Audited)
$m $m $m
Finance income
Interest income on bank deposits 0.8 1.7 4.4
0.8 1.7 4.4Less Finance costs
Interest expense on borrowings (15.9) (14.3) (28.9)
Interest expense on finance lease - - (0.7)
Interest expense – other - (0.8) (1.1)
Net change in fair value of derivatives 7f (10.2) (0.9) (5.9)
(26.1) (16.0) (36.6)
Net finance costs (25.3) (14.3) (32.2)
7. ACTUAL COMPARATIVE INFORMATION
a) Revenue
The 11% increase in Freight revenue from $199.8m to $221.3m over the comparable half year period was delivered across all major segments through increased volumes whilst maintaining yields.
The $8.8m reduction in Tranz Metro revenue compared to 31 December 2010 is due to the change in funding arrangements with Greater Wellington Regional Council following the transfer of Wellington metro assets to them on 30 June 2011. The reduction in revenue is offset by a reduction in costs borne by the Group.
b) Grant Income
KiwiRail receives grant income from the Crown and Regional Councils to complete specific rail projects. The most significant projects include the Wellington Regional Rail Plan (WRRP) and the Auckland metro rail developments (DART and AEP).
The reduction in grant income of $129.7m (-64.1%) for the period ended 31 December 2011 reflects the lower levels of activity as these projects draw to completion.
c) Cashflow hedge gains and losses
The cashflow hedge losses recorded in the Statement of Comprehensive Income represent unrealised foreign exchange losses on asset purchases where hedge accounting is applied and effective. The ineffective portion of these foreign exchange gains and losses is recorded in net finance costs in the Statement of Financial Performance. These gains and losses are of a non-cash nature.
During the period some asset purchases were completed for which hedged foreign exchange contracts had been taken out in the prior year. A total of $4.4m in cumulative losses on these contracts was transferred from the cash flow hedge reserve to the carrying value of the assets on purchase.
d) Turnaround plan funding & Cash balances
KiwiRail presented to the shareholder a Turnaround Plan business case which was in principal supported for $750m equity funding over 3 years. Each budget year KiwiRail presents to the Crown specific programmes for which the equity is invested in. At December 2011 three instalments ($200.0m) of the funding for the second year of the turnaround plan have been received.
NEW ZEALAND RAILWAYS CORPORATIONNOTES TO FINANCIAL STATEMENTS FOR THE SIX MONTHS ENDED 31 DECEMBER 2011 (CONTINUED)

21KiwiRail - Half year report December 2011
NEW ZEALAND RAILWAYS CORPORATIONNOTES TO FINANCIAL STATEMENTS FOR THE SIX MONTHS ENDED 31 DECEMBER 2011 (CONTINUED)
e) Depreciation
Depreciation is $17.7m higher than the six months ended 31 December 2010 primarily due to an increase in Railway Infrastructure deprecation resulting from adjustments to the remaining useful lives of structures to reflect the capital replacement programme.
In addition Rolling Stock depreciation increased by a net $3.3m over the comparable period last year. Freight rolling stock depreciation increased $5.3m following the purchase of new wagons and locomotives offset by a $2.0m decrease in Tranz Metro depreciation following the transfer of Wellington Metro rolling stock to Greater Wellington Regional Council.
f) Net change in fair value of interest rate derivatives
The change in the fair value of interest rate derivatives is due to a reduction in long term interest rate swap rates below the fixed rate of the hedging resulting in an unrealised loss being recognised.
8. OPERATING LEASE COMMITMENTS
The Group leases vessels and plant and equipment in the normal course of its business. Included in these lease commitments is the Group’s charter for the roll-on-roll-off ferry, Kaitaki. On 20 March 2009 the lease period of the Kaitaki vessel was extended by a non-cancellable term of three years and the lease expires on 30 June 2013. Motor vehicle leases generally have a non-cancellable term of three years.
Where lease payments are denominated in foreign currencies, they have been converted to New Zealand currency at the exchange rate ruling at balance date.
The future aggregate minimum lease payments payable under non-cancellable operating leases as follows:
31 Dec 2011 (Unaudited)
31 Dec 2010 (Unaudited)
30 June 2011 (Audited)
$m $m $m
Total minimum lease payments due:
Not later than one year 24.6 26.2 26.8
Later than one year but not later than five years 49.9 46.7 55.6
Later than five years 16.0 8.4 19.2
90.5 81.3 101.6
22
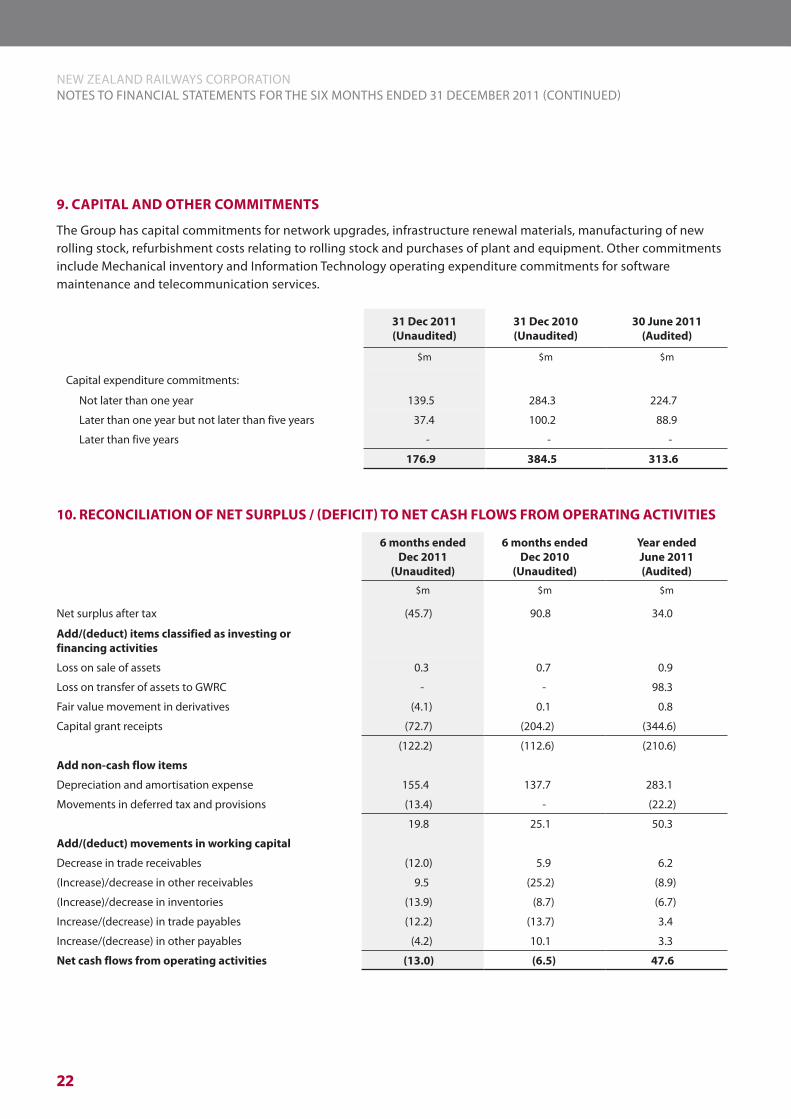
9. CAPITAL AND OTHER COMMITMENTS
The Group has capital commitments for network upgrades, infrastructure renewal materials, manufacturing of new rolling stock, refurbishment costs relating to rolling stock and purchases of plant and equipment. Other commitments include Mechanical inventory and Information Technology operating expenditure commitments for software maintenance and telecommunication services.
31 Dec 2011 (Unaudited)
31 Dec 2010 (Unaudited)
30 June 2011 (Audited)
$m $m $m
Capital expenditure commitments:
Not later than one year 139.5 284.3 224.7
Later than one year but not later than five years 37.4 100.2 88.9
Later than five years - - -
176.9 384.5 313.6
10. RECONCILIATION OF NET SURPLUS / (DEFICIT) TO NET CASH FLOWS FROM OPERATING ACTIVITIES
6 months ended Dec 2011
(Unaudited)
6 months ended Dec 2010
(Unaudited)
Year ended June 2011(Audited)
$m $m $m
Net surplus after tax (45.7) 90.8 34.0
Add/(deduct) items classified as investing or financing activities
Loss on sale of assets 0.3 0.7 0.9
Loss on transfer of assets to GWRC - - 98.3
Fair value movement in derivatives (4.1) 0.1 0.8
Capital grant receipts (72.7) (204.2) (344.6)
(122.2) (112.6) (210.6)
Add non-cash flow items
Depreciation and amortisation expense 155.4 137.7 283.1
Movements in deferred tax and provisions (13.4) - (22.2)
19.8 25.1 50.3
Add/(deduct) movements in working capital
Decrease in trade receivables (12.0) 5.9 6.2
(Increase)/decrease in other receivables 9.5 (25.2) (8.9)
(Increase)/decrease in inventories (13.9) (8.7) (6.7)
Increase/(decrease) in trade payables (12.2) (13.7) 3.4
Increase/(decrease) in other payables (4.2) 10.1 3.3
Net cash flows from operating activities (13.0) (6.5) 47.6
NEW ZEALAND RAILWAYS CORPORATIONNOTES TO FINANCIAL STATEMENTS FOR THE SIX MONTHS ENDED 31 DECEMBER 2011 (CONTINUED)

23KiwiRail - Half year report December 2011
11. CONTINGENT LIABILITIES
(a) Claims
The Group continues to manage residual activities relating to the previous operations of the organisation. Although the impact of such activities has diminished over time, a number of claims against the Group remain outstanding. In addition, the Group faces the continuing likelihood that liabilities not previously identified may arise in the future. No right of recourse exists for reimbursement of these claims. The outcome of these claims is uncertain at this stage and an estimate of financial effect is not practicable.
(b) Treaty of Waitangi claims
Claims lodged under the Treaty of Waitangi Act 1975, in respect of land and other assets currently or previously administered by the Group, have not been recognised in these financial statements. Since 1 July 1993 such claims are considered to be the responsibility of the Crown rather than that of the Group and administered by the Office of Treaty Settlements, Ministry of Justice. The outcome of these claims is uncertain at this stage and an estimate of financial effect is not practicable.
(c) Option to purchase Wellington Railway Station
Included in the Waitangi Treaty Settlement signed by the Crown dated 19 August 2008, Taranaki Whanui Ki Te Upoko O Te Ika and The Port Nicholson Block Settlement Trust, has an option to purchase the Wellington Railway Station and surrounding land. This option was exercised on 1st September 2011 and valuers have been appointed and the parties are currently working through the joint statutory valuation procedure to assess the price and terms of the sale and purchase of the Station.
(d) Removal of contaminated material
The Group may need to make provision for the removal of contaminated material from land previously used for rail operations. The cost of this remedial work is uncertain. An estimation of the likely cost is to be made at the time that an investigation is undertaken.
(e) Marsden Point rail corridor designation
The Group has recently confirmed it’s designation of the rail corridor from the North Auckland Line to Marsden Point but is still negotiating with the last appelants against the designation. The Northland Regional Council will purchase any land that may be required. The Group has an agreement with the Northland Regional Council that it will share the holding costs of such land with the Council.
NEW ZEALAND RAILWAYS CORPORATIONNOTES TO FINANCIAL STATEMENTS FOR THE SIX MONTHS ENDED 31 DECEMBER 2011 (CONTINUED)