andrade 2011 international journal of hydrogen energy
TRANSCRIPT

8/6/2019 Andrade 2011 International Journal of Hydrogen Energy
http://slidepdf.com/reader/full/andrade-2011-international-journal-of-hydrogen-energy 1/14
Transient phenomenological modeling of
photoelectrochemical cells for water splitting e Application to
undoped hematite electrodes
Luı sa Andrade, Tania Lopes, Helena Aguilar Ribeiro, Ade lio Mendes*
LEPAE e Departamento de Engenharia Quımica, Faculdade de Engenharia, Universidade do Porto, Rua Dr. Roberto Frias,
s/n 4200-465 Porto, Portugal
a r t i c l e i n f o
Article history:
Received 15 July 2010
Received in revised form
24 September 2010
Accepted 28 September 2010
Available online 28 October 2010
Keywords:
Photoelectrochemistry
Modeling
Water splitting Hydrogen
a b s t r a c t
A phenomenological model is proposed for a better understanding of the basic mecha-
nisms of photoelectrochemical (PEC) cells. The main assumptions of the one-dimensional
transient phenomenological model are: i) bulk recombination of the conduction band
electrons with holes in the valence band; ii) the mobile charge transport takes place via
diffusion, which arises from the concentration profiles, and migration, caused by
a macroscopic electric field; iii) negligible effects of microscopic electric fields in the cell
and screening effects, as well as negligible Helmholtz and diffuse layers. For modeling
purposes, the photoanode was assumed to be a homogeneous nanocrystalline hematite
structure, with thickness L, porosity 3 p and tortuosity s. The TCO/semiconductor interface
was modeled as an ideal ohmic contact, while the electrolyte/platinized TCO interface was
described by a ButlereVolmer approach. An alkaline electrolyte solution was used,allowing the transport of the ionic species from the counter-electrode to the photoanode.
The continuity and transport governing equations are defined for the mobile species
involved: electrons in the conduction band of the semiconductor, holes in the valence band
and hydroxyl ions in the electrolyte. Simulated IeV characteristics were computed and the
corresponding results compared with the experimental values. The simulated results were
in straight agreement with the experimental data.
ª 2010 Professor T. Nejat Veziroglu. Published by Elsevier Ltd. All rights reserved.
1. Introduction
It is known that world demand for energy is forecasted to
duplicate by 2050 and it is also widely recognized that the
existing energy networks are not adequate to supply this
demand in a sustainable way [1]. The increasing public
awareness concerning the carbon dioxide emissions and the
enhanced depletion of fossil fuels motivates the development
of alternative technologies based on non-polluting and clean
energy sources [2,3]. So far, the sun is our primary source of
clean and abundant energy, striking 120 PW of radiation onto
the surface of earth at any given moment and is the most
powerful resource able to cope with the world’s energy needs
[1]. However, the present technologies that take advantage of
solar energy have a limited ability to store energy due to the
variability of daily solar radiation and so an effective method
to store energy for later dispatch is therefore needed [4,5]. A
practical way to overcome this problem is using sunlight to
split water into hydrogen and oxygene photoelectrolysis [3]e
by means of a photoelectrochemical (PEC) cell. The water split
phenomenon was first reported by Fujishima and Honda in
1972, but it was only recently that this technology received
* Corresponding author. Tel.: þ351 225081695; fax: þ351 225081449.E-mail address: [email protected] (A. Mendes).
A v a i l a b l e a t w w w . s c i e n c e d i r e c t . c o m
j o u r n a l h o m e p a g e : w w w . e l s e v i e r . c o m / l o c a t e / h e
i n t e r n a t i o n a l j o u r n a l o f h y d r o g e n e n e r g y 3 6 ( 2 0 1 1 ) 1 7 5e1 8 8
0360-3199/$ e see front matter ª 2010 Professor T. Nejat Veziroglu. Published by Elsevier Ltd. All rights reserved.
doi:10.1016/j.ijhydene.2010.09.098

8/6/2019 Andrade 2011 International Journal of Hydrogen Energy
http://slidepdf.com/reader/full/andrade-2011-international-journal-of-hydrogen-energy 2/14
special attention from researchers as a potential renewable
energy source [3,6e9].
A photoelectrochemical cell is made of a semiconductor,
such as iron oxide (Fe2O3) e hematite e and a counter-elec-
trode (cathode), both immersed in an aqueous electrolyte
solution. When exposed to sunlight, the semiconductor
absorbs photons with sufficient energy to inject electrons
from the valence band to its conduction band, creating elec-tron-hole pairs. The holes exhibit oxidation potential while
the electrons are transferred over the external circuit to the
cathode to promote water reduction into hydrogen gas. The
energy conversion efficiency of such process is therefore
highly determined by the structure and properties of the
semiconductor and the electronic junction formed at the
semiconductor/electrolyte interface [10,11]. Presently, these
devices achieve very low conversion efficiencies since most of
the semiconductors used for this application have a large
energy bandgap. Furthermore, the band edge potentials of
many semiconductors are not suitable for oxygen and
hydrogen evolution and the water split reaction can not take
place. This is the case of hematite, whose conduction bandedge is positioned at a more positive potential than the
reduction potential of water. As a result, an additional bias
voltage is required to promote the reduction reaction at the
cathode side [3].
In the last decade, several studies focusing on promising
photoelectrodes were carried out. Doped and undoped
semiconductor materials were synthesized and character-
ized regarding their photoelectrochemical, structural, elec-
trical and optical properties [8,12e14]. Recent studies report
hematite as a promising material with several advantages: it
has a suitable bandgap energy around 2.0 eV, is able to use
40% of the incident solar spectrum, it is chemically and
thermally stable in aqueous solutions and also toward pho-tocorrosion, its valence band is appropriate for oxygen
evolution and it is abundant and a low-cost material [3,8,15].
Despite several efforts have been made to develop new more
adequate materials for water splitting in photo-
electrochemical cells, very few research works focused on the
insightful understanding of the working mechanisms of PEC
cells. An important work was developed by Gerischer [16,17]
on the kinetics and energetics of electron transfer across
semiconductor/electrolyte junctions and on the nature of the
space-charge layer e the semiconductor layer adjacent to the
semiconductor/electrolyte interface. Nozik [18] evaluated the
energy level scheme for pen photoelectrolysis cells in order
to demonstrate an enhanced efficiency by simultaneouslyilluminating the n- and p-type electrodes. Khan and Bockris
[19] derived an analytical expression for the resulting
photocurrent as a function of the physical properties of an
illuminated p-type semiconductor electrode and the neigh-
boring electrolyte solution. Boudjemaa and co-authors [13]
studied the transport properties of hematite and its applica-
tion for hydrogen production. Nevertheless, a global and
integrated transient phenomenological model for a better
understanding of the phenomena occurring in a PEC cell and
how they contribute for its performance has never been
presented. Simple models were already developed for other
water splitting systems, pointing out some relevant aspects.
Choi et al. [20] studied a water electrolysis system with a solid
polymer electrolyte by means of a simple model based on the
ButlereVolmer kinetics. Also based on the ButlereVolmer
approach, Nie et al. [21] modeled a proton exchange
membrane water electrolyzer and Marangio et al. [22] studied
a high pressure polymer electrolyte membrane water elec-
trolyzer. Ni [23e25] developed an interesting work based on
the mathematical modeling of solid oxide steam electrolyzers
for hydrogen production.In the present work, an integrated transient phenomeno-
logical model for PEC cells is presented. This model aims at
contributing to a better understanding of the phenomena
occurring in a PEC cell and how they contribute for its
performance. The simulated IeV characteristic curves of the
PEC cell allowed the calculation of the cells’ performance
parameters.
2. Development of the PEC cell model
Photoelectrolysis of water is the dissociation of water mole-
cules into hydrogen and oxygen by the direct use of light: theconversion of light into electrical current allows the trans-
formation of a chemical entity e water e into another e
hydrogen e known to be a preferential energy vector [26]. The
principle of operation of a photoelectrochemical cell for water
splitting is governed by the kinetics of the charge carriers and
reaction mechanisms that take place at the electrodes of the
PEC cell. Therefore, the understanding of the electronic
processes occurring at the semiconductor nanoparticles level,
as well as the dynamics of charge separation/transport and
reactive mechanisms in the different interfaces is of great
importance. Photons with energy h$y higher than the semi-
conductor’s bandgap generate electron-hole pairs
ðeÀCB
þhþVB
Þin the conduction and valence bands, respectively:
hyþ SC/SC
eÀCB þ hþVB
(1)
In an alkaline media, holes oxidize water to oxygen in the
semiconductor surface (photoanode),
2Hþ þ 2OHÀ/H2O þ 1=2O2 (2)
while the photoexcited conduction band electrons, trans-
ported to the counter-electrode (cathode) of the PEC cell,
reduce water to form hydrogen gas:
2H2O þ 2eÀ/2OHÀ þ H2 (3)
The mechanisms behind oxidation of water by photo-generated holes are not completely understood and depend
most probably on the interfacial properties of the semi-
conductor. On the other hand, the reduction of water into
hydrogen is a kinetically simple process compared to the
water oxidation reaction [27]. In fact, the efficiency of the
oxidation process occurring at the semiconductor can be
limited by several competing electron loss pathways: bulk
recombination via bandgap states or direct electron loss to
holes in the valence band; surface recombination; electron
loss from the conduction band; photocorrosion of the semi-
conductor; and dissolution reactions. The last two processes
are responsible forthe degradation of the electrode and forthe
consequent stability problems [28].
i n t e r n a t i o n a l j o u r n a l o f h y d r o g e n e n e r g y 3 6 ( 2 0 1 1 ) 1 7 5 e1 8 8176

8/6/2019 Andrade 2011 International Journal of Hydrogen Energy
http://slidepdf.com/reader/full/andrade-2011-international-journal-of-hydrogen-energy 3/14
Fig. 1 shows a scheme of the modeled PEC cell. The pho-
toanode consists of a homogeneous nanocrystalline hematite
structure, with thickness L, porosity 3 p and tortuosity s. The
photoanode is deposited onto a transparent conductive
substrate (TCO), defining the interface TCO/semiconductor at
x ¼ 0. This interface is modeled as an ideal ohmic contact.
Since the semiconductor considered herein is a hematite film,
an alkaline electrolyte solution should be used, such assodium hydroxide, allowing the transport of the ionic species
from the counter-electrode, a platinum wire, to the photo-
anode [6]. At x ¼ b, the electron transfer phenomenon occur-
ring at the electrolyte/platinized TCO interface is described by
the ButlereVolmer equation. The semiconductor/electrolyte
interface is defined at x ¼ L. The mobile charges considered in
the development of the present model are the electrons in the
conduction band of the semiconductor, eÀ, the holes in the
valence band, hþ, and the hydroxyl ions in the electrolyte.
For simplicity, the model considers a cell design where the
photoelectrode faces its counter-electrode and the space in
between is filled with the electrolyte solution. However,
typical currentevoltage characterization of the PEC cells areperformed in a cell configuration known as “cappuccino” [29],
in which the surface of the platinum counter-electrode is far
away from the semiconductor/electrolyte interface. Hence, in
the present model b >> L. Moreover, the cell is irradiated
perpendicularly to its photoelectrode and it is assumed that
each absorbed photon injects one electron into the hematite
conduction band.
Concerning the electron loss pathways, only the bulk
recombination of conduction band electrons with holes in the
valence band is taken into account. The space-charge
recombination as well as the remaining recombination
mechanisms mentioned above are therefore neglected [19].
The mobile charge transport can take place via diffusion,
which arises from the concentration profiles, and migration,
caused by a macroscopic electric field E. Effects of microscopic
electric fields in the cell and screening effects, as well as
Helmholtz and diffuse layers are neglected. Thus, chargetransport can be described with sufficient accuracy using
diffusion constants Di and mobilities mi, connected by the
Einstein relation [30]:
Di ¼ kBT
qmi; i ¼ eÀ; hþ and OHÀ (4)
Taking into account the previous assumptions, the
proposed phenomenological model for PEC cells comprises
the continuity and transport equations for the mobile species
in unsteady-state and isothermal conditions. The continuity
equation for the particle density ni is:
Àv ji
vxþ GiðxÞ À RiðxÞ ¼ vni
vt; i ¼ eÀ; hþ and OHÀ (5)
The first term on the left-hand side of the equation repre-
sents the charge carrier flux defined by the respective trans-
port equation. The second and third terms are the generation
and relaxation rates of species i, respectively. Both reaction
kinetics are characterized by a time constant. The term on the
right-hand side of the equation corresponds to carrier
i concentration history. The respective continuity equations,
initial and boundary conditions for the three mobile charges
are presented hereafter.
2.1. Electrons
As described above two contributions for the electron flux, jeÀ ,
are considered: a diffusive transport of electrons within the
hematite film toward the transparent conductive substrate
and a migration transport driven by a macroscopic electric
field across the semiconductor layer. Equation (6) relates the
electron flux at any position x to the gradient of electrons
concentration across the semiconductor layer, neÀ , by means
of the electron diffusion coefficient, DeÀ , the electron mobility,
meÀ , and the macroscopic electric field, E:
jeÀ
¼ ÀDeÀ
vneÀ
v
x ÀmeÀneÀE (6)
The generation term for electrons in Equation (5) is
described by the following absorption equation [30]:
GeÀ ¼ hinjaðlÞI0eÀaðlÞx (7)
It is assumed that each photon, with energy hn ! Eg,
absorbed by the semiconductor results in the injection of one
electron into its conduction band. a(l) is the wavelength-
dependent absorption coefficient, which is a property of the
material; I0 is the incident photon flux, corrected for reflection
losses of the TCO glass; and hinj is the electron injection
efficiency.
The electron recombination term is here represented by
a generic equation based on an excess electron density
Fig. 1 e Schematic representation of the modeled PEC cell
for photo-assisted water splitting. The TCO/semiconductor
interface at x [ 0 and the electrolyte/platinized TCO at
x[ b define the limits of the photoanode and the cathode,
respectively. The electrolyte solution fills the pores in the
photoanode with thickness L and the free volume between
x[ L and x[ b. The dimensions of L and b are not in scale
since b>> L.
i n t e r n a t i o n a l j o u r n a l o f h y d r o g e n e n e r g y 3 6 ( 2 0 1 1 ) 1 7 5e1 8 8 177

8/6/2019 Andrade 2011 International Journal of Hydrogen Energy
http://slidepdf.com/reader/full/andrade-2011-international-journal-of-hydrogen-energy 4/14
regarding its equilibrium value, DneÀ
¼neÀ
ðx; t
Þ Àneq, and
a first-order kinetics, keÀ ¼ 1=sn:
ReÀ ¼ keÀDneÀ (8)
where sn is the lifetime of the carriers before recombine and
neq is the dark equilibrium electron density, corresponding to
the match between the electron’s Fermi level in the semi-
conductor and the redox potential of the electrolyte:
neq ¼ NCBexp
À qðECB À ERedoxÞ
kBT
!(9)
NCB is the effective density of states of the respective
conduction band and can be calculated by the following
equation [30]:
NCB ¼ 2
2pmÃ
eÀ kBT
h2
(10)
The continuity equation, initial and boundary conditions for
electrons can now be written taking all these considerations
into account:
DeÀv
2neÀ
vx2þ meÀ E
vneÀ
vxþ meÀ neÀ
dE
dxþ hinjI0aeÀax À
ÀneÀ À neq
Ásn
¼ vneÀ
vt
(11)
2.1.1. Initial conditionsFor t ¼ 0 the cell is considered to be under dark equilibrium
conditions:
t ¼ 0 neÀ ðx; 0Þ ¼ neq (12)
2.1.2. Boundary conditions
Considering the TCO/semiconductor interface at x ¼ 0 as an
ohmic contact with negligible energy band bending, a simple
charge balance at this interface can be written in terms of the
current densities at x ¼ 0À and x ¼ 0þ, i .e. j0ÀeÀ and j0þ
eÀ ,
respectively:
x ¼ 0 j0ÀeÀ ¼ j0þ
eÀ (13)
The current density flowing across x ¼ 0þ results from the
transport of electrons by diffusion and drift across the semi-
conductor e Equation (6) e which, in steady-state conditions,
corresponds also to the net current density, Jcell, generated by
the cell under operation (see Fig. 2). This term will be analyzed
and defined in more detail in Section 2.4. Thus,
j0ÀeÀ ¼ Jcellq (14)
j0þeÀ ¼ ÀDeÀ
vneÀ
vx
x¼0þ
À meÀ neÀE
x¼0þ (15)
At x ¼ L there are no electrons flowing from the semi-
conductor into the electrolyte and across it, so the respective
continuity equation for electrons is only integrated between
x ¼ 0 and x ¼ L. Between the limits x ¼ L and x ¼ b only the
electrolyte redox species are present.
x ¼ LvneÀ ðL; tÞ
vx¼ 0 (16)
2.2. Holes
When the semiconductor absorbs solar radiation with enough
energy to excite an electron from the valence band to the
conduction band, an electron-hole pair is generated. Thus,
they are generated at the same rate:
Ghþ ¼ GeÀ (17)
On the other hand, if a radiative recombination phenom-
enon is considered, a hole in the valence band reacts with an
electron from the conduction band and the correspondent
energy is dissipated. The recombination of a hole with
a conduction band electron occurs at the same rate of thespontaneous transition of an electron from the conduction
band to an unoccupied state in the valence band:
Rhþ ¼ ReÀ (18)
The respective continuity equation for holes is similar to the
one defined for electrons:
Dhþv
2nhþ
vx2þ mhþE
vnhþ
vxþ mhþ nhþ
dE
dxþ hinjI0aeÀax À DneÀ
sn
¼ vnhþ
vt(19)
2.2.1. Initial conditions
The initial concentration of holes equals the dark equilibrium
electrons density since electrons and holes are generated atthe same rate:
t ¼ 0 nhþðx; 0Þ ¼ neÀ ðx;0Þ (20)
2.2.2. Boundary conditions
There are no holesflowing from the semiconductor to the TCO
substrate neither from the semiconductor to the electrolyte:
x ¼ 0vnhþð0; tÞ
vx¼ 0 (21)
x ¼ LvnhþðL; tÞ
vx¼ 0 (22)
Fig. 2 e Detail of the TCO/semiconductor interface at x[ 0;
x[0D denotes the surface close to the semiconductor and
x[0L refers to the external surface of the TCO layer.
i n t e r n a t i o n a l j o u r n a l o f h y d r o g e n e n e r g y 3 6 ( 2 0 1 1 ) 1 7 5 e1 8 8178

8/6/2019 Andrade 2011 International Journal of Hydrogen Energy
http://slidepdf.com/reader/full/andrade-2011-international-journal-of-hydrogen-energy 5/14
2.3. Hydroxyl ions
Hydroxyl ions are formed in the counter-electrode by reduc-
tion of water to hydrogen gas. Then OHÀ ions diffuse to the
semiconductor surface where theyreact with holes to produce
oxygen gas. However, the transport of hydroxyl ions occurs in
two different regions of the PEC cell: in the pores of the
mesoscopic semiconductor film (with porosity 3 p and tortu-
osity s, between x ¼ 0 and x ¼ L) and within the free volume
between x ¼ L and the counter-electrode at x ¼ b. Generation
and recombination of hydroxyl ions occur only in the pores of
the semiconductor, and not in the bulk electrolyte layer (with
thickness beL) where only ionic transport is considered. Thus,twodistinct equationsshouldbe writtenfor thisredoxspecies.
2.3.1. 0 x LAttempting to the stoichiometry of Equations (2) and (3), the
generation of two hydroxyl ions is always linked with the
consumption of two electrons, while the consumption rate of
hydroxyl ions equals the generation rate of holes. The charge
transport is again governed by diffusion and drift:
DLOHÀ
v2nL
OHÀ
vx2þ mL
OHÀEvnL
OHÀ
vx
þmLOHÀ nL
OHÀdE
dxÀ 13 p
hinjI0aeÀax À DneÀ
seÀÀ vneÀ
vt ¼ vnL
OHÀ
vt(23)
where
DLOHÀ ¼ 3 p
s
DOHÀ and mLOHÀ ¼ 3 p
s
mOHÀ (24)
are the effective diffusion and mobility constants defined for
the hydroxyl ions. The superscript L is included to clearly
show that the region under consideration is between x ¼ 0and
x ¼ L. The sixth term in Equation (23), vneÀ=vt, is included since
in unsteady-state the accumulated electrons do not partici-
pate in the redox reaction and therefore must be discounted
from the generation term:
Fig. 3 e Detail of the semiconductor/electrolyte interface at x [ L. Here, x [ L
L and x [ LD denote the limit of the
interface semiconductor/electrolyte at the semiconductor
and electrolyte sides, respectively.
Fig. 4 e Energy diagram of PEC components with (a) no applied bias EBias; (b) applied bias EBias but not enough for hydrogen
evolution and (c) applied bias EBias enough to produce hydrogen.
i n t e r n a t i o n a l j o u r n a l o f h y d r o g e n e n e r g y 3 6 ( 2 0 1 1 ) 1 7 5e1 8 8 179

8/6/2019 Andrade 2011 International Journal of Hydrogen Energy
http://slidepdf.com/reader/full/andrade-2011-international-journal-of-hydrogen-energy 6/14
hinjaðlÞI0eÀaðlÞx |fflfflfflfflfflfflfflfflfflfflfflffl{zfflfflfflfflfflfflfflfflfflfflfflffl} generation term
À vneÀ
vt |ffl{zffl} electron accumulation
2.3.2. L < x bOnly electrolyte exists in this region and so no ions are
generated or lost by recombination with holes. So, the conti-nuity equation is as follows:
DOHÀv
2nbOHÀ
vx2þ mOHÀ E
vnbOHÀ
vxþ mOHÀ nb
OHÀdE
dx¼ vnb
OHÀ
vt(25)
where the superscript b denotes the region between x ¼ L and
x ¼ b. Finally, initial and boundary conditions may now be
defined for hydroxyl ions in the spatial range 0 < x b.
2.3.2.1. Initial conditions
At instant t ¼ 0, initial concentration of the electrolyte species
is assumed:
t ¼ 0 n
L
OHÀ ðx;0Þ ¼ n
b
OHÀðx;0Þ ¼ n
init
OHÀ (26)
2.3.2.2. Boundary conditions
At the TCO/semiconductor interface only the photoinjected
electrons are able to flow. Thus, the net flux of OHÀ is zero:
x ¼ 0vnL
OHÀ ð0; tÞvx
¼ 0 (27)
For x ¼ L, corresponding to the transition between the
porous material and the bulk liquid, additional considerations
have to be taken into account. At this interface the concen-
trations of OHÀ ions in the liquid electrolyte filling the pores of
the semiconductor and in the bulk liquid are identical:
nL ÀOHÀ ¼ nL þ
OHÀ (28)
Moreover, by evaluating the charge balance at the interface
semiconductor/electrolytee see Fig. 3e the hydroxyl ions flux
at x ¼ LÀ (within the porous semiconductor structure) equals
the hydroxyl ions flux at x ¼ Lþ (bulk electrolyte):
x ¼ L jL ÀOHÀ ¼ jL þ
OHÀ (29)
where:
jL ÀOHÀ ¼ ÀDL
OHÀvnL
OHÀ
vx
x¼L À
À mLOHÀnL
OHÀ E
x¼L À (30)
jL þOHÀ ¼ ÀDOHÀ
v
nb
OHÀvx
x¼L þ À mOHÀnbOHÀ Ex¼L þ (31)
The total amount of the redox species contained in the semi-
conductornanopores andin the free electrolyte volumeremains
constant during thePEC celloperation. Thismay be described as:
x ¼ b
Z L0
nLOHÀðxÞdx þ
Z bL
nbOHÀ ðxÞdx ¼ ninit
OHÀ L þ ninitOHÀ ðb À LÞ (32)
2.4. Macroscopic electric field: Poisson equation
In undoped semiconductors the number of charge carriers is
determined by the properties of the material itself instead of
the amount of impurities. Thus, the number of excited elec-
trons and the number of holes are equal. For this type of
semiconductors the macroscopic electric field E is also related
to the charge carrier densities by the Poisson’s equation [26]:
d2E
dx2¼ qnint
330exp
qEðxÞkBT
!(33)
where nint is the intrinsic carrier concentration given by
nint ¼ ðNCBNVBÞ1=2exp
À Eg
2kBT
(34)
where 3 and 30 are the static relative permittivity or dielectric
constant of the material and the permittivity of free space,
respectively. The dielectric constant describes the effective
dielectric behavior of the quasi-homogeneous medium.
The model assumes that there are no unbalanced electric
charges for x 0 and x ! b. Thus, the electric field vanishes
exactly at these boundaries [31]:
Eðx ¼ 0Þ ¼ Eðx ¼ bÞ ¼ 0 (35)
2.5. Electrolyte-platinum contact: ButlereVolmer
equation
The non-linear differential Equations (11), (19), (23) and (25) for
the three charged species are integrated with the respective
initial and boundary conditions. All these conditions were
described and defined mathematically, but the boundary
condition for electrons at x ¼ 0 requires a deeper analysis. In
fact, it was mentioned above that the current density flowing
across x ¼ 0þ results from the transport of electrons by
diffusion and drift through the semiconductor e Equation (6)
e which corresponds, in steady-state conditions, to the net
current density, Jcell, generated by the cell under operation.This variable Jcell corresponds to the current density that is
returned to the cell via the counter-electrode and is a conse-
quence of the external potential difference applied to the cell.
At the counter-electrode, electrons take part in the water
reduction reaction catalyzed by the platinum wire. Conse-
quently, the electrolyte/platinum interface can be treated as
an electrochemical half-cell and a ButlereVolmer kinetics is
therefore considered [32]:
Jcell ¼ J0
24nH2OðbÞ
nref H2OðbÞ
exp
bnqhPt
kBT
À nH2 ðbÞn2OHÀðbÞnref
H2ðbÞ
nref
OHÀ
2ðbÞ
expÀð1 À bÞnqhPt
kBT
35 (36)
The ButlereVolmer equation defines an exponential rela-
tion between the electric current crossing the electrolyte/
platinum interface and the activation overpotential, hPt, in the
platinum cathode, where water is reduced to hydrogen gas
with the consumption of two electrons (n ¼ 2 in Equation (36)).
The overpotential may be regarded as the extra voltage
needed to reduce the energy barrier of the rate determining
step to a value such that the electrode reaction proceeds at
a desired rate. The concentrations of the species involved in
such reaction have to be normalized by a reference concen-
tration: nref H2O; nref
H2; nref
OHÀ . For dilute solutions in pure water at
i n t e r n a t i o n a l j o u r n a l o f h y d r o g e n e n e r g y 3 6 ( 2 0 1 1 ) 1 7 5 e1 8 8180
8/6/2019 Andrade 2011 International Journal of Hydrogen Energy
http://slidepdf.com/reader/full/andrade-2011-international-journal-of-hydrogen-energy 7/14
a given pressure, water concentration is virtuallyconstant. So,
if pure water at approximately atmospheric pressure is taken
as the standard state for H2O, nH2O and nref H2O concentrations in
Equation (36) are equal. Additionally, the reference concen-
tration for hydroxyl ions is its initial concentration, while the
reference hydrogen concentration is taken as the maximum
solubility of hydrogen in water at 1 bar and 25 C:
8.465 Â 10À5 mol dmÀ3 [33].In what concerns the definition of the total overpotentials
in the PEC cell, a thoughtful analysis needs to be made. The
operation of a photoelectrochemical cell is analogous to that
of a Schottky barrier and therefore the input energy of an
absorbed photon is equal to the semiconductor bandgap Eg.
Energy losses in the semiconductor result from the movement
of electrons and holes from their point of generation to the
respective electrolyte/electrode interface, and from the
difference between the energy conduction band edge in the
bulk and the Fermi level, DEF ¼ EFðx ¼ 0Þ À ECB. The former
phenomenon is responsible for the energy band bending EB
observed at the electrolyte/electrode interface. In the elec-
trolyte, only a fraction of this energy is used to originate freeenergy per electron for the overall cell reaction (ΔG /
nF ¼ 1.23 eV for water decomposition). The remaining energy
is lost through overpotentials at the anode and the cathode,haand hPt, respectively, and through ohmic losses, hohmic. The
following energy balance can be written [11]:
EBias þ Eg À EB À DEF ¼ DG
nFþ ha þ hPt þ hohmic (37)
The term EBias in the left-hand side of Equation (37) is added
when an external bias applied to the PEC cell is required.
When a semiconductor is brought into contact with an
electrolyte, equilibrium of the electrochemicalpotentials of the
two phases is established by electron transfer across theinterface[16]. Thisproducesa positivespace-chargelayer in the
semiconductor side,also called depletion layer since the region
is depleted of majority charge carriers (electrons). Additionally,
a charged layeris also formedin theelectrolyteside, adjacent to
the interface with the solid electrode e known as Helmholtz
layer. However, this is not considered in the present model.
Finally, the extent of band bending is given by [11]:
EB ¼ EFðx ¼ 0Þ À E fb (38)
where EF is the Fermi level of the semiconductor and E fb is the
semiconductor flat band potential, which reflects the energy
state at which the semiconductor bands are flat (zero space
charge in the semiconductor).The anodic overpotential is considered as the difference
between the valence band edge potential and the oxidation
potential of water [34]:
ha ¼ EVB À EO2=OHÀ (39)
where the oxidationpotentialof water is directly related to the
water reduction potential by the standard free enthalpy for
water splitting (1.23 eV):
EO2=OHÀ ¼ 1:23 À EH2O=H2(40)
In its turn, the electrochemical potential of water reduction
to hydrogen at the platinum electrode is given by the Nernst
equation:
EH2O=H2¼ E
H2O=H2
À kBT
2qln
nH2ðbÞn2
OHÀ ðbÞn3
st
(41)
The standard concentration nSt is here defined as a refer-
ence concentration of 1 mol dmÀ3. Finally, the ohmic losses
through the electrode area A may be written in terms of an
ohmic resistance, Rohmic:
hohmic ¼ JcellARohmic (42)
At this moment all the terms of Equation (37) can be eval-
uated and thus it can be solved in order to the cathode over-
potential, hPt. Then, the resulting equation can be substituted
in the ButlereVolmer equation in order to find the net current
density Jcell at a defined applied external bias EBias.
The parameter EBias is of great importance since it deter-
mines the possibility of hydrogen evolution takes place or not.
In fact, forefficient water cleavage, the conduction band of the
n-type semiconductor needs to be positioned at a more
negative potential than the reduction potential of water, i.e.
ECB < EH2O=H2
, while thevalencebandneeds to be positioned at
a more positive potential than the oxidation reaction, i.e.EVB > E
O2=OHÀ . However, for a hematite porous film, the
conduction band potential does not fulfill the required
potential position and so an additional bias is needed. Varying
the value of the applied bias, three different situations should
be considered: i) EBias ¼ 0, meaning that no bias is applied; ii)
the applied bias is higher than zero but not sufficiently high to
produce hydrogen evolution and iii) the applied bias is high
enough to produce hydrogen. The energy diagrams for these
three situations are sketched in Fig. 4 and for each case the
energy balance is showed.
At high intensity illumination the semiconductor potential
is driven toward its flat band potential and in the case of zero
bias e Fig. 4(a) e the band bending is negligible e EBz
0 sinceE fbzEF. When no bias is applied, Equation (37) reduces to:
hPt ¼ Eg ÀÀ
E fb À ECB
Á ÀDG
nFÀ ha À hohmic (43)
Since there is no bias, the system is not able to produce
hydrogen gas and so the water reduction potential equals the
standard potential of À0.828 V in alkaline environment and at
25 C:
ha ¼ EVB À
1:23 À EH2O=H2
(44)
Equation (44) can also be used for the case when an anodic
bias is applied but it is not sufficient to produce hydrogen e
Fig. 4(b). In this case the band bending cannot be neglected:
hPt ¼ EBias þ Eg ÀÀ
EF À E fb
ÁÀ ðEF À ECBÞ À DG
nFÀh
EVB À
1:23 À EH2 O=H2
iÀ hohmic (45)
For the generic case represented in Fig. 4(c), the over-
potential of cathode is given by:
hPt ¼ EBias þ Eg ÀÀ
EF À E fb
ÁÀ ðEF À ECBÞ À DG
nFÀ
EVB À
1:23 À EH2O=H2
þ kBT
2qlnÀ
nH2n2
OHÀÁ!À ð JcellARohmicÞ (46)
For the cases illustrated in Fig. 4(a) and (b), since there is no
hydrogen gas evolution, the second term of the ButlereVolmer
i n t e r n a t i o n a l j o u r n a l o f h y d r o g e n e n e r g y 3 6 ( 2 0 1 1 ) 1 7 5e1 8 8 181
8/6/2019 Andrade 2011 International Journal of Hydrogen Energy
http://slidepdf.com/reader/full/andrade-2011-international-journal-of-hydrogen-energy 8/14
equatione Equation (36)e is zero, becoming Jcell ¼ J0expð2bqkB T
hPtÞ.The ButlereVolmerequation assumes its original form given in
Equation (36) only for the case represented in Fig. 4(c).
2.6. Dimensionless equations
The model variables were made dimensionless with respectto
electron parameters and to the thickness of the semi-
conductor L. Changing for dimensionless variables and
introducing suitable dimensionless parameters, the conti-
nuity equations for the three charge carrier species and the
respective initial and boundary conditions become:
DÃeÀv
2nÃeÀ
vxÃ2þmÃeÀz
EÃvnÃ
eÀ
vxÃþnÃ
eÀdEÃ
vxÃ
þDa$eÀgxÃÀF2
nÃ
eÀ ÀnÃeq
¼ vnÃ
eÀ
vq
(47)
q ¼ 0 nÃeÀ ðxÃ; 0Þ ¼ nÃ
eq (48)
xà ¼ 0 JÃcell ¼nref Dref q
J0L
À DÃ
eÀvnÃ
eÀ
vxÃ
xü0þ
Àmref nref Eref q
J0
ÀmÃeÀ nÃ
eÀ EÃjxü0þÁ
(49)
xà ¼ 1vnÃ
eÀ
vxà ¼ 0 (50)
DÃhþv
2nÃhþ
vxÃ2þ mÃhþz
EÃvnÃ
hþ
vxà þ nÃhþ
dEÃ
vxÃ
þ Da$eÀgxÃ
ÀF2
nÃeÀ À nÃ
eq
À vnÃ
eÀ
vq¼ vnÃ
hþ
vq(51)
q ¼ 0 nÃhþ ðxÃ;0Þ ¼ nÃeq (52)
xà ¼ 0vnÃ
hþ
vxü 0 (53)
xà ¼ 1vnÃ
hþ
vxü 0 (54)
DLÃOHÀ
v2nLÃ
OHÀ
vxÃ2þ mLÃ
OHÀz
EÃvnLÃ
OHÀ
vxà þ nLÃOHÀ
dEÃ
vxÃ
À13 p
Da$eÀgxà ÀF2
nÃ
eÀ À nÃeq
À vnÃ
eÀ
vq
!¼ vnLÃ
OHÀ
vq(55)
DÃOHÀ
v2nbÃ
OHÀ
vxÃ2þ mÃOHÀz
EÃvnbÃ
OHÀ
vxà þ nbÃOHÀ
dEÃ
vxÃ
¼ vnbÃ
OHÀ
vq(56)
q ¼ 0 nLÃOHÀðxÃ;0Þ ¼ nbÃ
OHÀ ðxÃ; 0Þ ¼ nÃinitOHÀ (57)
xà ¼ 1 jÃ1 ÀOHÀ ¼ jÃ1 þ
OHÀ and nÃ1 ÀOHÀ ¼ nÃ1 þ
OHÀ (58)
xà ¼ b=L
Z 10
nÃLOHÀ ðxÃÞdxà þ
Z b=L
1
nÃbOHÀðxÃÞdxÃ
¼ nÃinitOHÀ þ nÃinit
OHÀ ðb=L À 1Þ (59)
where
nÃi ¼
ni
nref ; xà ¼ x
L; DÃ
i ¼Di
Dref ; mÃi ¼
mi
mref
i ¼ eÀ; hþ; OHÀ
;
EÃ ¼ E
Eref ; q ¼ t
s
; sref ¼ L2
Dref ; JÃcell ¼
Jcell
J0; z ¼ mref Eref L
Dref ;
Da ¼ L2hinjaI0
Dref nref ; g ¼ aL and F ¼ L
ffiffiffiffiffiffiffiffiffikeÀ
Dref
s :
2.7. Numerical solution strategy
To simulate a PEC cell it is necessary to solve Equations (47),
(51), (55) and (56) with the respective boundary and initial
conditions. In order to apply the boundary condition at x* ¼ 0
for the electrons, for a given value of EBias, Equations (43) or (46)
should be substituted in Equation (36) to obtain the current
density in the external circuit. The partial differential equa-
tions were spatially discretized using the finite differences
method. The time integration was accomplished using LSODA
[35],anumericalpackagedevelopedattheLawrenceLivermore
National Laboratory.To compute the IeV characteristic curves,
the equations were solved for steady-state conditions (when-ever the time derivative was smaller than a pre-defined value).
3. Results and discussion
3.1. IeV characteristic of an undoped hematite electrode
based-PEC cell
Theproposedmodelwasusedtocomputethe IeV characteristic
curves of a mesoporous undoped hematite photoanode studied
by Cesar et al. [36] and compared with the corresponding
experimental results obtained by these authors. The hematite
sample was prepared by atmospheric pressure chemical vapordeposition (APCVD) andthe deposition time was1 min[36].The
experimental current density evolution versus potential was
measured using a 1 M NaOH electrolyte solution (pH 13.6), at
50 mV sÀ1, under 1 sun simulated back-illumination (AM 1.5 G,
100 mWcmÀ2). The experimental data extracted from the work
by Cesar et al. [36] were used for simulation purposes and are
compiled in Table 1, together with other model parameters
obtained in the literature. The experimental and simulated IeV
curves were fitted adjusting parameters Rohmic and hinj.
Fig.5 compares the experimental datawith the corresponding
simulated IeV curve. As it can be realized from this figure, the
model agrees quite well with the experimental data, especially
for voltages lower than 1.6 V. For higher values of voltage theelectrocatalytic oxygen evolution starts by the reaction of holes
with the OHÀ ions in the electrolyte. This phenomenon explains
the accentuated current density increase noticed in both char-
acteristic curves for voltages higher than 1.6e1.7 V.
Considering a “cappuccino” like PEC cell, described else-
where [38], the illumination of the photoanode can be made
through the front-side (via the electrolyte/hematite interface)
or through the back-side (via the substrate/hematite inter-
face). Front- and back-side illumination experiments may be
used to distinguish between electron and hole transport
limitations, as discussed by Cesar et al. [36]. However, this
conclusion can only be taken if the film thickness is larger
than the reciprocal value of the absorption coefficient. For
i n t e r n a t i o n a l j o u r n a l o f h y d r o g e n e n e r g y 3 6 ( 2 0 1 1 ) 1 7 5 e1 8 8182

8/6/2019 Andrade 2011 International Journal of Hydrogen Energy
http://slidepdf.com/reader/full/andrade-2011-international-journal-of-hydrogen-energy 9/14
undoped samples of hematite, back-side illumination (Fig. 5)
always gives higher photocurrent than front-side illumination
(Fig. 6). This indicates that the rate-limiting step in undoped
Fe2O3 samples is the electron transport, in contrast to Si-
doped hematite photoanodes where hole transport is found to
be rate-limiting [39,40]. The front-side illumination
experiment was also simulated in the present work, where
Equation (7) was replaced by the corresponding one for front-
side irradiation:
GeÀ ¼ hinjaðlÞI0eÀaðlÞðLÀxÞ (60)
being L the hematite layer thickness. The fitted injection
efficiency obtained was 90%.
Fig. 7 shows the simulated steady-state electron density
profiles across the 63 nm-thick of the hematite film at 1.23 Vand under 1 sun back-side illumination. Since the experi-
ment was performed with back-side illumination (see
scheme in Fig. 1), most electrons were generated near the
glass substrate due to the exponential absorption behaviore
Equation (7). Thus, the maximum electron density gradient
Table 1 e Simulator input and fitting parameters. The values extracted from the literature are indexed to thecorresponding reference and the model values fitted tothe experimental IeV curve are identified by “Fit ”.
Parameter Value Reference
CinitOHÀ 1 M [36]
DeÀ 4.07 Â 10
À4
cm
2
s
À1
[30]Dhþ 1.25 Â 10À4 cm2 sÀ1 [30]
DOHÀ 5.26 Â 10À5 cm2 sÀ1 [37]
A 0.5 cm2 [29]
L 63 nm [36]
b w1 cm [36]
3 p 0.63 [36]
s 1.0 [36]
NCB 1.0 Â 1019 cmÀ3 [30]
sn 0.22 ns [36]
hinj 0.93 Fit
að550 nmÞ 8.5 Â 104 cmÀ1 [36]
I0 1.50 Â 1017 cmÀ2 sÀ1 [36]
b 0.50 [37]
J0 1.0 Â 10À4 mA cmÀ2 [37]
ECB À0.5 V [3]EVB 1.7 V [3]
E fb À0.43 V [27]
EH2O=H2
À0.828 V [3]
EO2=OHÀ 0.402 V [3]
DG=nF 1.23 V [3]
Rohmic 50 U Fit
T 298 K [29]
pH 13.6 [36]
Fig. 5 e Experimental (solid line) and simulated (dashed
line) IeV characteristic for the system described in Table 1
( hinj[ 0.93), under 1 sun back-illumination. The
experimental curve was taken from Ref. [36], Fig. 6, dashed
curve labeled “1’bc no si”.
Fig. 6 e Experimental (solid line) and simulated (dashed
line) IeV characteristics for a PEC cell characterized by
parameters given in Table 1 ( hinj[ 0.90), under 1 sun front-
side illumination. The experimental curve was taken fromRef. [36], Fig. 6, solid curve labeled as “1’ no Si”.
Fig. 7 e Simulated electron density profiles for the system
characterized by parameters given in Table 1 under 1 sun
back-side illumination at 1.23 V.
i n t e r n a t i o n a l j o u r n a l o f h y d r o g e n e n e r g y 3 6 ( 2 0 1 1 ) 1 7 5e1 8 8 183
8/6/2019 Andrade 2011 International Journal of Hydrogen Energy
http://slidepdf.com/reader/full/andrade-2011-international-journal-of-hydrogen-energy 10/14
is observed for axial position x ¼ 0. Under these conditions,
the hematite layers closest to the current collector (TCO)
contribute mostly to the electron flux toward the external
circuit. This fact is related to high concentration gradients
and then diffusion transport, limiting the electron recom-
bination kinetics.
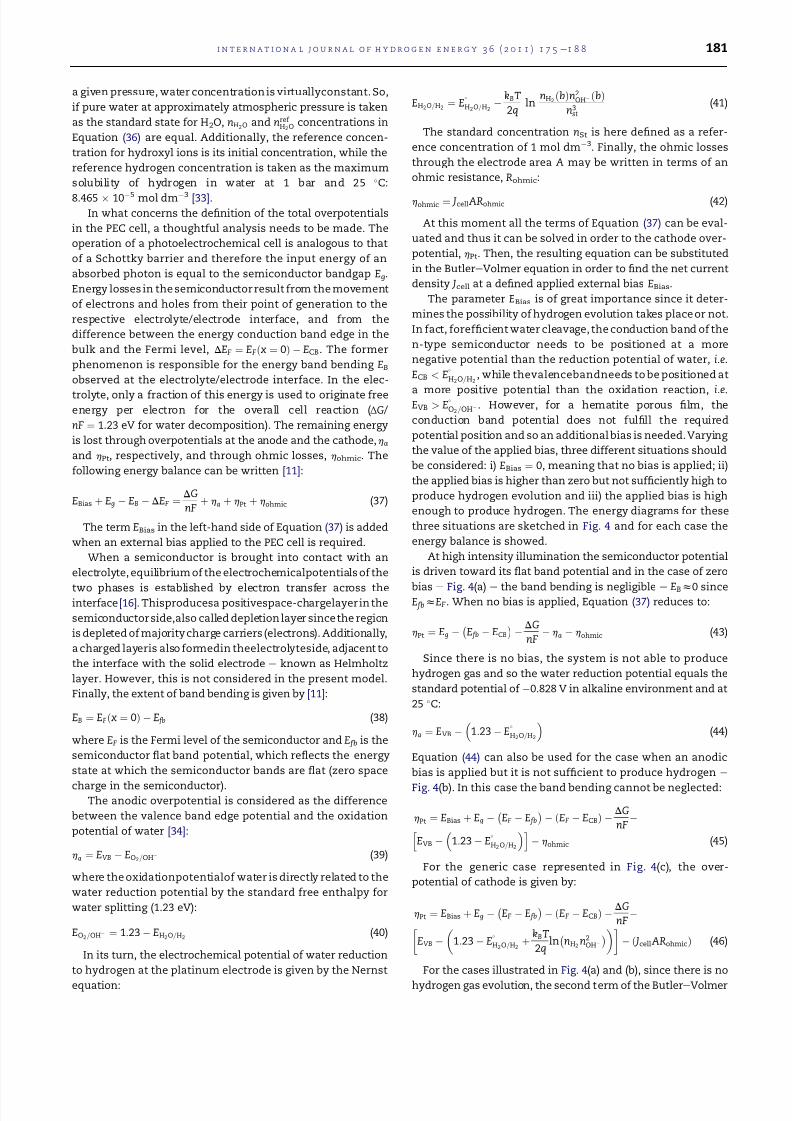
Fig. 8 shows the evolution of the transient electron density
profiles ofthe undoped hematite film at 1.23 V and under 1 sun
back-side illumination before reaching the steady-state
condition. The electron density profiles during the first
micrometers of the hematite film is characterized by a steadyincrease, becoming a flat profile towards x ¼ L. For higher
values of q, the electron density profile tends to the steady-
state condition (shown in Fig. 7).
3.2. Effect of the electrolyte layer thickness
As mentioned above, the photoelectrochemical characteriza-
tion was performed in a PEC cell configuration known as
“cappuccino” [36]. The illumination of the photoanode is done
through an uncoated fused silica window pressed against an
o-ring by a metallic window part. A conductive uncoated area
of the photoanode sample is clipped onto a titanium contact.
This clip can rotate to facilitate front- and back-side illumi-
nation. The counter-electrode, usually a platinum wire isplaced at a distance of w10 mm from the photoanode. The
space between the two electrodes is filled with the electrolyte
solution. Consequently, the hydroxyl ions formed at the
counter-electrode have to diffuse a pathway of around 10 mm
Fig. 8 e Transient electron density profiles for the system
characterized by parameters given in Table 1 under 1 sun
back-illumination at 1.23 V. Density profiles are presented
as a function of dimensionless time q.
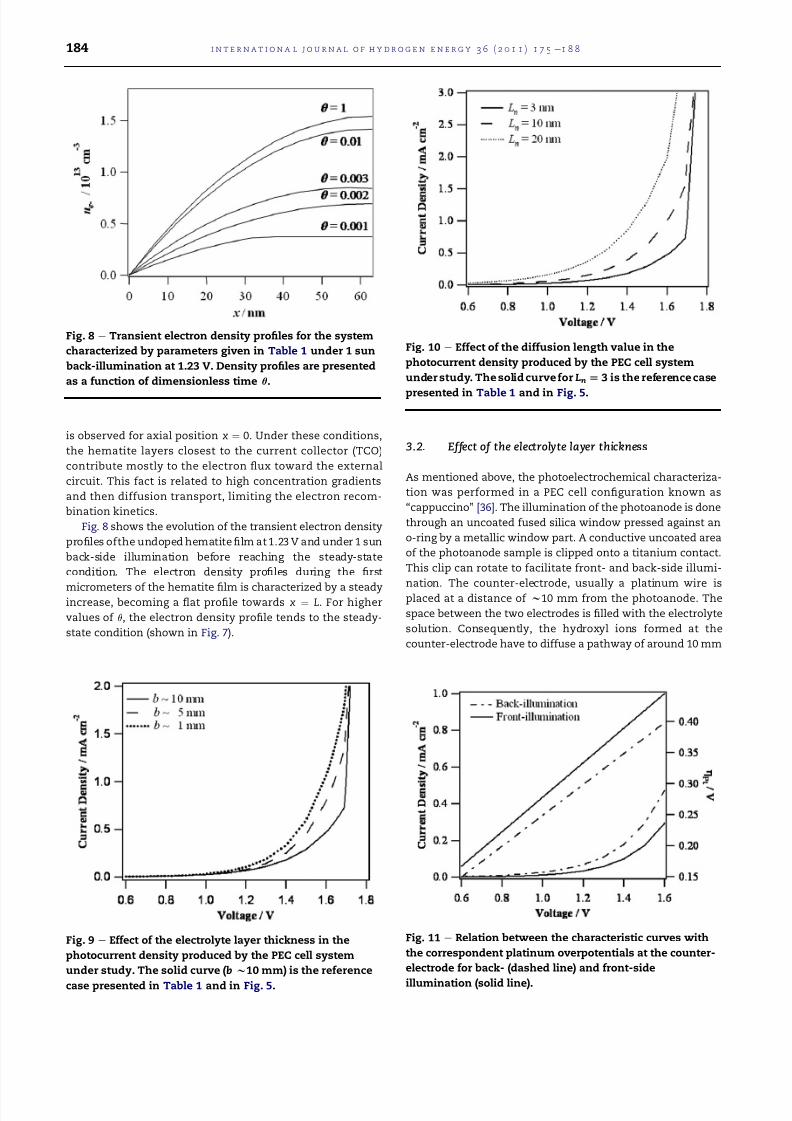
Fig. 9 e Effect of the electrolyte layer thickness in the
photocurrent density produced by the PEC cell system
under study. The solid curve ( b w10 mm) is the reference
case presented in Table 1 and in Fig. 5.
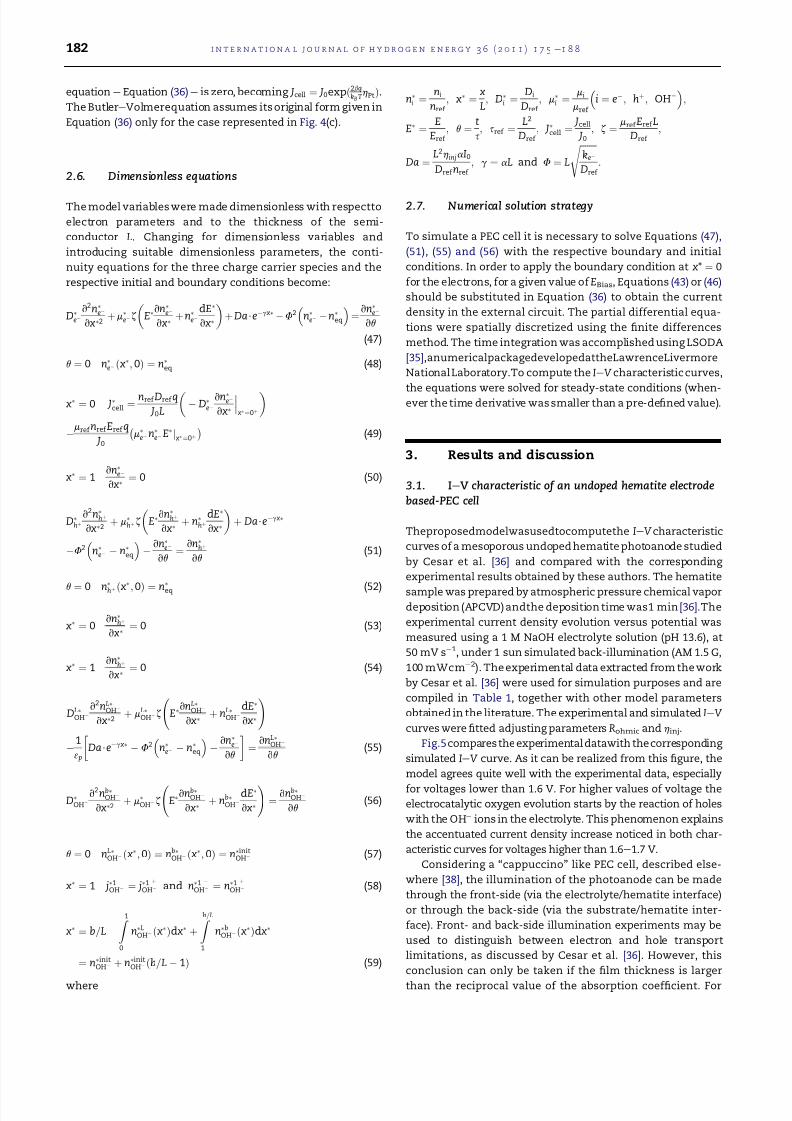
Fig. 10 e Effect of the diffusion length value in the
photocurrent density produced by the PEC cell system
under study. The solid curve for Ln[ 3 is the reference case
presented in Table 1 and in Fig. 5.
Fig. 11 e Relation between the characteristic curves with
the correspondent platinum overpotentials at the counter-
electrode for back- (dashed line) and front-side
illumination (solid line).
i n t e r n a t i o n a l j o u r n a l o f h y d r o g e n e n e r g y 3 6 ( 2 0 1 1 ) 1 7 5 e1 8 8184

8/6/2019 Andrade 2011 International Journal of Hydrogen Energy
http://slidepdf.com/reader/full/andrade-2011-international-journal-of-hydrogen-energy 11/14
until reaching the photoanode, where water oxidation occurs.
This distance is beL in Fig. 1 (L is almost negligible when
compared with b and so from now on beL will be considered
approximately equal to b). Thus, by changing the thickness of
the free electrolyte, the resistance that ions OHÀ ions have to
face crossing the electrolyte layer is also different. In fact,
diminishing the value of b, potential losses in the electrolyte
are lower and the photocurrent density increases. From Fig. 9
it can be noticed that the increase in the photocurrent density
is more pronounced when the electrolyte thickness decreasesfrom 10 mm to 5 mm than from 5 mm to 1 mm. This may
indicate that the reduction of the electrolyte thickness to
values lower than 1 mm is not that worthy for the photocur-
rent density response.
3.3. Effect of the hole diffusion length
The low values of photocurrent observed for the system under
study are due to a low water oxidation rate by surface trapped
holes [41] and a short hole diffusion length Ln in hematite pho-
toelectrodes (Ln ¼ ffiffiffiffiffiffiffiffiffiffiffiffiffi
Dhþsnp
, being Dhþ and sn the diffusion coeffi-
cientand lifetimeof the holes, respectively). In thispresent case
Ln ¼ 3 nm, which implies that most holes are created in thesemiconductor bulk and will recombine with electrons before
having reached the surface [38]. Increasing the hole diffusion
length allows a significant increase in the photocurrent density
eFig.10eand,consequently, in the hydrogenproductionby the
PEC cell. However, undoped hematite shows a hole diffusion
length of only 2e4 nm since the photon penetration depth at
visible wavelengths in hematite (aÀ1 ¼ 118 nm at l ¼ 550 nm)
causes themajority ofphotogeneratedcarriers to be producedat
a distanceof ca. 100nm from thesemiconductorliquid junction
[42]; the recombination time constants of the photogenerated
carriers are on the order of 10 ps [43]; and the minority charge
carrier has a poor mobility (maximum of 0.2 cm2 VÀ1 sÀ1) [44].
Thus, it is almost impossible to achieve the photocurrentvaluesshown in Fig. 10 for diffusion lengths higher than 10 nm, which
explains the need of doping hematite. In fact, the performance
of these photoanodes is significantly improved by doping with
silicon [6].
3.4. Effect of the ButlereVolmer kinetics
The potential of the electrodes affects strongly the kinetics of
reactions occurring on their surface. As explained before,
this currentepotential dependence is described by the
ButlereVolmer equation. In electrochemical reactions acti-
vation losses take place, which are caused by the slowness of
the reactions occurring on the surface of the electrodes. Oncean electrochemical reaction is initiated, the concentration of
the species taking part in the reaction at the electrode/elec-
trolyte interface will normally be different than those in the
bulk of the solution. Thus, concentration profiles arise due to
effects of simple diffusion and/or effects of migration in the
electric field at or near the electrode. A point to holdback at
this stage is that the transport to or from the electrode surface
of the species involved in the electrochemical processmay not
be sufficiently fast to maintain the same concentration at the
electrode surface as in the bulk. If transport processes are
rapid compared to charge transfer, then bulk concentration
and electrode surface concentration are similar. On the other
hand, when there is a considerable current flowing, the elec-trode surface concentration is lower than the bulk concen-
tration and thus the potential must be increased in order to
maintain the desired current density [45]. This increased
potential is in fact called overpotential, here labeled as hPt. By
increasing the current density, more voltage is needed to be
sacrificed in order to maintain those values of current. The
platinum overpotentialalso increases with the applied voltage
e Fig. 11. The present model allows to predict the platinum
overpotential occurring at each specific case and how it
evolves through the currentevoltage characteristic.
The transfer coefficient b that appears in the ButlereVolmer
equation depends on the symmetry of the activation barrier
and, for that reason, is also known as symmetry parameter. Its
Fig. 12 e Effect of the transfer coefficient on the symmetry
of the current-overpotential curves for the system under
study. Again, the solid curve for b [ 0.5 is the reference
case presented in Table 1 and in Fig. 5.
Fig. 13 e Logarithmic representation of the current density
versus overpotential for the platinum counter-electrode
and for high values of hPt e Tafel plots.
i n t e r n a t i o n a l j o u r n a l o f h y d r o g e n e n e r g y 3 6 ( 2 0 1 1 ) 1 7 5e1 8 8 185

8/6/2019 Andrade 2011 International Journal of Hydrogen Energy
http://slidepdf.com/reader/full/andrade-2011-international-journal-of-hydrogen-energy 12/14
value expresses how the change in the electrical potential
across the reaction interface changes the sizes of the forward
versus reverse activation barrier. For b ¼ 0.5 the anodic and
cathodic branches of the total current will be symmetrical.
However, forb value near unity the cathodic branch rises much
more steeply than the anodic branch, whereas for b near zero
the inverse is found. The transfer coefficient depends on the
reaction involved and on the electrode materials [46]. Never-theless, for the system under analysis the variation of b, which
can be obtained e.g. by using different materials, have a little
impact on the performance of the PEC cell e Fig. 12.
As overpotentials become larger than about 50e100 mV,
the second term of Equation (36) becomes negligible, meaning
that the forward-reaction direction dominates. Hence, simple
exponential relationships between current density and over-
potential are obtained, i.e. the overpotential can be considered
as logarithmically dependent on the current density. The
ButlereVolmer equation simplifies to:
Jcell
¼ J0exp
bnq
kBT
hPt (61)
Equation (61) is known as the Tafel equation and plotting ln
( Jcell) versus hPt one obtains a straight line. Therefore, the
approximation to the Tafel equation is valid. The slope of
a Tafel plot is related to the transfer coefficient b accordingly
to: slope ¼ bnq=ðkBTÞ [32] (Fig. 13).
4. Conclusions
A transient phenomenological model of a PEC cell using an
undoped hematite photoanode was developed. The model
results were critically compared with the experimental IeV characteristics and very good agreement was observed.
This model allowed to study underlying mechanisms of
the PEC cell. Steady-state electron density profiles for back-
illumination were obtained, suggesting that most electrons
aregenerated near the currentcollector. In this part of the cell,
higher concentration gradients were observed and then
enhanced electron diffusion rates, which in its turn limits
electron recombination kinetics. Front- and back-side illumi-
nation experiments (via the electrolyte/hematite and via the
substrate/hematite interfaces, respectively) were simulated in
order to distinguish between electron and hole transport
limitations. For undoped samples of hematite, back-side illu-
mination showed higher photocurrent than front-sideillumination.
The influence of several operation conditions was simulated
and namely thickness of free electrolyte, hole diffusion length
and ButlereVolmer kinetics. By decreasing the thickness of the
free electrolyte, the ionic mass transfer in that region is lower
and the photocurrent density increases. The increase of hole
diffusion length allows a significant increase in the photocur-
rent density and, consequently, in the hydrogen production by
the PEC cell. Even though the simulation results showed
considerable photocurrent densities for Ln > 10 nm using
undoped hematite samples, it is almost impossible to achieve
holediffusion lengthsin thatrangedue to structural limitations.
This fact explains the need of doping hematite photoanodes.
Finally, the reduction of water at the platinum counter-elec-
trode was described based on the ButlereVolmer equation. The
present model allows obtaining the platinum overpotential as
a function of the observed current density. The effect of the
transfer coefficient was assessed using the simulator. The
results showed, for the system under analysis, that this varia-
tion causes little effect in the performance of the PEC cell.
Acknowledgments
This research has been funded by the European Commission
(Project NanoPEC, contract number 227179) and the Portu-
guese Foundation for Science and Technology (Project PTDC/
EQU-EQU/107990/2008). L. Andrade and T. Lopes are grateful
to the Portuguese Foundation for Science and Technology
(FCT) for their PhD grants (references: SFRH/BD/30464/2006
and SFRH/BD/62201/2009, respectively). H. Aguilar Ribeiro
acknowledges the Programa Ciencia 2007.
Nomenclature
A cell area, m2
b cell thickness, m
Ci concentration of species i, mol mÀ3
Di diffusion coefficient of species i, m2 sÀ1
Dbi diffusion coefficient of species i in the bulk
electrolyte, m2 sÀ1
DLi diffusion coefficient of species i in the electrolyte in
the pores of the semiconductor, m2 sÀ1
Dref reference diffusion coefficient, m2 sÀ1
E macroscopic electric field, V mÀ1
EBias external bias potential, V
EB band bending potential, V
ECB conduction band potential, V
E fb flat band potential, V
Eg semiconductor bandgap, V
EF fermi level of the semiconductor, V
EH2 O=H2water reduction potential, V
EO2=OHÀ water oxidation potential, V
ERedox redox potential, V
EVB valence band potential, V
F Faraday constant, 9.6485339 Â 104 C molÀ1
FF fill factor
Gi generation rate of species i, mÀ3 sÀ1
h Planck constant, 6.6260693(11) Â 10À34 J s
I0 incident photon flux corrected for reflection losses,
mÀ2 sÀ1
ji current density of species i, sÀ1 mÀ2
jLi current density of species i in the electrolyte in the
pores of the semiconductor, sÀ1 mÀ2
jsc short-circuit current density, A mÀ2
Jcell net current density, A mÀ2
J0 exchange current density at Pt electrode, A mÀ2
kB boltzman constant, 1.3806503 Â 10À23 J KÀ1
keÀ back reaction rate constant, sÀ1
L thickness of the semiconductor, m
mÃeÀ effective electron mass, kg
i n t e r n a t i o n a l j o u r n a l o f h y d r o g e n e n e r g y 3 6 ( 2 0 1 1 ) 1 7 5 e1 8 8186

8/6/2019 Andrade 2011 International Journal of Hydrogen Energy
http://slidepdf.com/reader/full/andrade-2011-international-journal-of-hydrogen-energy 13/14
n number of electrons transferred in the reaction
neq dark equilibrium electron density, mÀ3
ni density of species i, mÀ3
nbi density of species i in the bulk electrolyte, mÀ3
nLi density of species i in the electrolyte in the pores of
the semiconductor, mÀ3
nint intrinsic carrier concentration, mÀ3
nref reference particle density, mÀ3
NCB effective density of states in the conduction band,
mÀ3
NVB effective density of states in the valence band, mÀ3
q elementary charge, 1.60217646 Â 10À19 C
Ri recombination rate of species i, mÀ3 sÀ1
Rohmic ohmic resistance, U
T absolute temperature, K
t time, s
V OC open-circuit voltage, V
x coordinate, m
aðlÞ wavelength-dependent absorption coefficient, mÀ1
b transfer coefficient
3 dielectric constant3 p semiconductor film porosity
30 permittivity of free space, 8.85419 Â 10À12 F mÀ1
ha overpotential at the anode, V
hinj electron injection efficiency
hohmic ohmic overpotential, V
hPt overpotential at Pt electrode (cathode), V
l wavelength, m
mi mobility of species i, m2 VÀ1 sÀ1
mbi mobility of species i in the bulk electrolyte,
m2 VÀ1 sÀ1
mLi mobility of species i in the electrolyte in the pores of
the semiconductor, m2 VÀ1 sÀ1
n frequency, sÀ1
s tortuosity
sn carrier lifetime, s
DEF variation of the Fermi level potential, V
DG free energy for the overall cell reaction, J
q dimensionless time variable
Superscripts
init initial conditions
0þ point close to the photoanode
0À external point of the current collector
* dimensionless variable standard
Subscripts
eÀ electrons
hþ holes
Abbreviations
CB conduction band
CE counter-electrode
ref reference
SC semiconductor
PEC photoelectrochemical
TCO transparent conductor oxide
VB valence band
r e f e r e n c e s
[1] Nathan SL. Basic research needs for solar energy utilization.Renee M. Nault; 2005.
[2] Gratzel M. Nature 2001;414:338.[3] Krol RVd, Liang Y, Schoonman J. Journal of Materials
Chemistry 2008;18:2311.[4] Trieb F. Concentrating solar power for the Mediterraneanregion. German Aerospace Center (DLR); 2005.
[5] Nowotny J, Sorrell CC, Sheppard LR, Bak T. International Journal of Hydrogen Energy 2005;30:521.
[6] Cesar I, Kay A, Gonzalez Martinez JA, Gra ¨ tzel M. Journal of the American Chemical Society 2006;128:4582.
[7] Archer MD, Nozik AJ. Nanostructured andphotoelectrochemical systems for solar photon conversion.London/Singapore; Hackensack, NJ: Imperial College Press/World Scientific Pub. Co.; 2008.
[8] Aroutiounian VM, Arakelyan VM, Shahnazaryan GE,HovhannisyanHR,WangH, Turner JA.Solar Energy 2007;81:1369.
[9] Zerta M, Schmidt PR, Stiller C, Landinger H. International Journal of Hydrogen Energy 2008;33:3021.
[10] Aroutiounian VM, Arakelyan VM, Shahnazaryan GE,Stepanyan GM, Turner JA, Khaselev O. International Journalof Hydrogen Energy 2002;27:33.
[11] Nozik AJ. Annual Review of Physical Chemistry 1978;29:189.[12] Aroutiounian VM, Arakelyan VM, Shahnazaryan GE,
Stepanyan GM, Turner JA, Kocha SS. Electrochimica Acta2000;45:1999.
[13] Boudjemaa A, Boumaza S, Trari M, Bouarab R, Bouguelia A.International Journal of Hydrogen Energy 2009;34:4268.
[14] Glasscock JA, Barnes PRF, Plumb IC, Savvides N. The Journalof Physical Chemistry C 2007;111:16477.
[15] Sivula K, Formal FL, GraIˆtzel M. Chemistry of Materials 2009;21:2862.
[16] Gerischer H. Journalof Electroanalytical Chemistry 1975;58:263.[17] Gerischer H. Journalof Electroanalytical Chemistry 1977;82:133.
[18] Nozik AJ. Applied Physics Letters 1976;29:150.[19] Khan SUM, Bockris JOM. The Journal of Physical Chemistry
1984;88:2504.[20] Choi P, Bessarabov DG, Datta R. Solid State Ionics 2004;175:
535.[21] Nie J, Chen Y, Boehm RF, Katukota S. Journal of Heat Transfer
2008;130:042409.[22] Marangio F, Santarelli M, Calı M. International Journal of
Hydrogen Energy 2009;34:1143.[23] Ni M. Mathematical modeling of solid oxide steam
electrolyzer for hydrogen production. PhD Thesis. Universityof Hong Kong; 2007.
[24] Ni M, Leung MKH, Leung DYC. International Journal of Hydrogen Energy 2008;33:2337.
[25] Ni M, Leung MKH, Leung DYC. International Journal of
Hydrogen Energy 2008;33:4040.[26] Grimes CA, Varghese OK, Ranjan S. Light, water, hydrogen:
the solar generation of hydrogen by water photoelectrolysis.New York: Springer; 2008.
[27] Lindgren T, Vayssieres L, Wang H, Lindquist S-E. In:Kokorin AI, Bahnemann DW, editors. Chemical physics of nanostructured semiconductors. Boston: VSP e An imprintof BRILL; 2003. p. 83.
[28] Archer MD, Nozik AJ. Nanostructured andphotoelectrochemical systems for solar photon conversion.London: Imperial College Press; 2008.
[29] Cesar I. Solar photoelectrolysis of water with translucentnano-structured hematite photoanodes. PhD Thesis. EPFL;2007.
[30] Wu ¨ rfel P. Physics of solar cells: from principles to new
concepts. Weinheim; 2005.
i n t e r n a t i o n a l j o u r n a l o f h y d r o g e n e n e r g y 3 6 ( 2 0 1 1 ) 1 7 5e1 8 8 187

8/6/2019 Andrade 2011 International Journal of Hydrogen Energy
http://slidepdf.com/reader/full/andrade-2011-international-journal-of-hydrogen-energy 14/14
[31] Ferber J, Stangl R, Luther J. Solar Energy Materials and SolarCells 1998;53:29.
[32] Bard AJ, Faulkner LR. Electrochemical methods: fundamentalsand applications. 2nd ed. USA: John Wiley & Sons, Inc.; 2001.
[33] Baranenko VI, Kirov VS. Atomic Energy 1989;66:30.[34] Bak T, Nowotny J, Rekas M, Sorrell CC. International Journal
of Hydrogen Energy 2002;27:991.[35] Petzold L. SIAM Journal of Scientific and Statical Computing
1983;4:136.[36] Cesar I, Sivula K, Kay A, Zboril R, Graetzel M. The Journal of
Physical Chemistry C 2009;113:772.[37] O’Hayre R, Cha S-W, Colella W, Prinz FB. Fuel cells
fundamentals. New York: John Wiley & Sons, Inc.; 2006.[38] Kay A, Cesar I, Gratzel M. Journal of the American Chemical
Society 2006;128:15714.[39] Bjoerksten U, Moser J, Graetzel M. Chemistry of Materials
1994;6:858.
[40] Liang Y, Enache CS, Krol RVd. International Journal of Photoenergy 2008;2008. doi:10.1155/2008/739864. Article ID739864, 7 pages.
[41] Dare-Edwards MP, Goodenough JB, Hamnett A,Trevellick PR. Journal of the Chemical Society, FaradayTransactions 1: Physical Chemistry in Condensed Phases1983;79.
[42] Itoh K, Bockris JOM. Journal of the Electrochemical Society
1984;131:1266.[43] Cherepy NJ, Liston DB, Lovejoy JA, Deng H, Zhang JZ. The
Journal of Physical Chemistry B 1998;102:770.[44] Bosman AJ, van Daal HJ. Advances in Physics 1970;19:1.[45] Hamann CH, Hamnett A, Vielstich W. Electrochemistry.
2nd ed. Weinheim: Wiley-VCH Verlag GmbH & Co. KGaA;2007.
[46] Larminie J, Dicks A. Fuel cells systems explained. 2nd ed.England: John Wiley & Sons Ltd; 2003.
i n t e r n a t i o n a l j o u r n a l o f h y d r o g e n e n e r g y 3 6 ( 2 0 1 1 ) 1 7 5 e1 8 8188