andrea brandolini banca d’italia, department for structural economic analysis
DESCRIPTION
Social policies: is it the case of dismantling the welfare state?. Andrea Brandolini Banca d’Italia, Department for Structural Economic Analysis LAC-EU Economic Forum 2013 - PowerPoint PPT PresentationTRANSCRIPT

Andrea BrandoliniBanca d’Italia, Department for Structural Economic Analysis
LAC-EU Economic Forum 2013“Globalization, International Trade and the Welfare State at Crossroads:
Converging Views in European and Latam countries?”Santiago, 21-22 January 2013
Social policies: is it the case of dismantling the welfare state?

• Background• Do Europe’s welfare states work? • European social models • Common trends?• Underlying forces• Conclusions
Outline

• Globalization, fragmentation of global supply chains, unbundling, dematerialisation, reallocation …
→ stronger ‘competition’ → pressure to cut taxwedge on labour to recover cost competitiveness→ less resources for welfare
→ less stable employment relationships → shift ofrisk to families → greater need of welfare
• Growing inequalities
• Population ageing
→ longer working life → productivity of olderworkers and lifelong learning → long-term care→ expansion of welfare
Background
• One important test: the Great Recession (2007-09)
– Differences across countries, but fall in output not experienced since Great Depression
– Household incomes did not fall as much as GDP
– Overall, small effects on income distribution: little or no increase in poverty and inequality in majority of countries …
– … but differences across age classes
→ largely due to tax-benefit redistribution (both automatic and
discretionary)
Do Europe’s welfare states work?
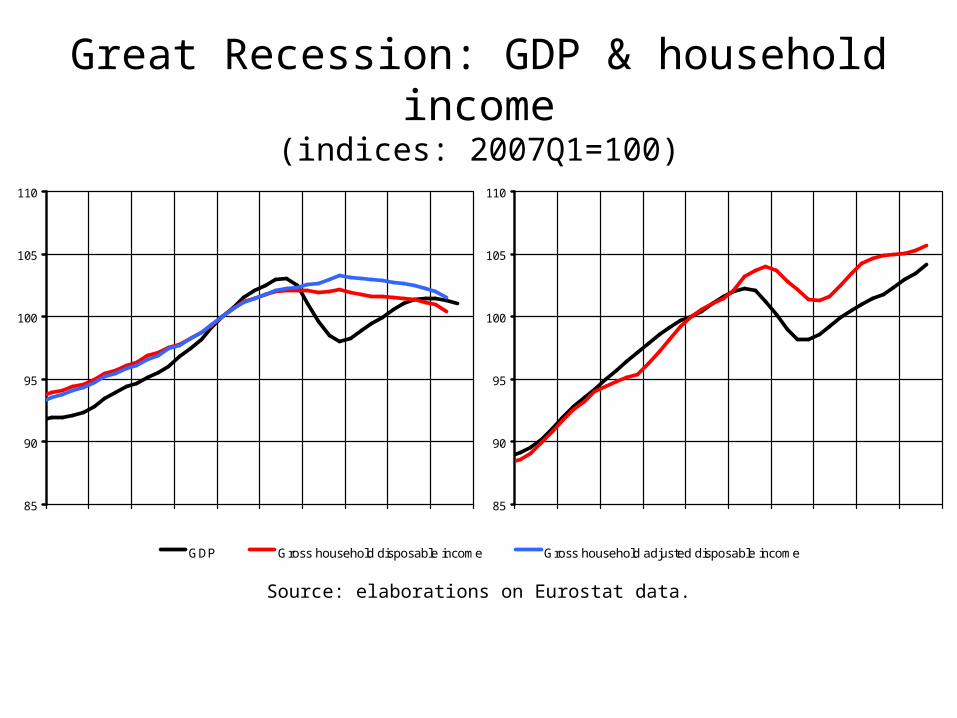
Great Recession: GDP & household income(indices: 2007Q1=100)
Source: elaborations on Eurostat data.
GDP Gross household disposable income Gross household adjusted disposable income
85
90
95
100
105
110United States
201220072006200520042003 2008 201120102009
85
90
95
100
105
110Euro area (17 countries)
201220072006200520042003 2008 201120102009

AT
BECA
DK
FI
FR
DE
GR
IE
IT
NL
NO
PT
SE
CHUK
ES
US
-4
-2
0
2
4
6
8
10
Pe
rcen
tage
ch
ange
in r
eal G
HD
I, 20
07-9
-10 -8 -6 -4 -2 0 2Percentage change in real GDP, 2007-9
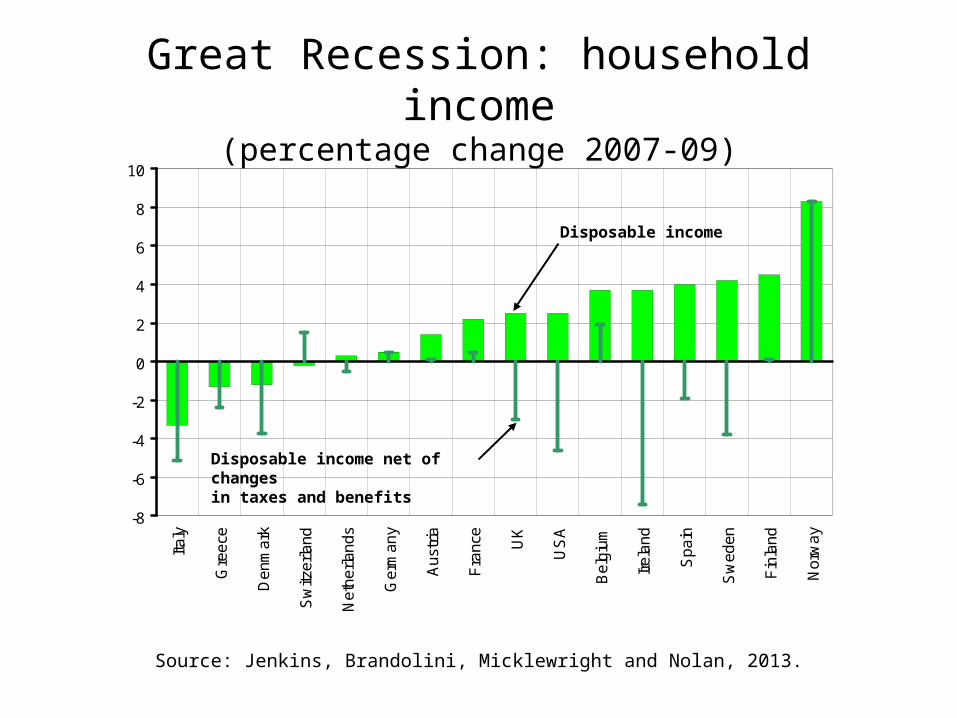
Source: Jenkins, Brandolini, Micklewright and Nolan, 2013.
Great Recession: GDP & household income(percentage change 2007-09)
-8
-6
-4
-2
0
2
4
6
8
10Ita
ly
Gre
ece
Den
mar
k
Sw
itzer
land
Net
herla
nds
Ger
man
y
Aus
tria
Fra
nce
UK
US
A
Bel
gium
Irel
and
Spa
in
Sw
eden
Fin
land
Nor
way
Disposable income
Disposable income net of changesin taxes and benefits
Source: Jenkins, Brandolini, Micklewright and Nolan, 2013.
Great Recession: household income(percentage change 2007-09)

Anchored poverty
-3
-2
-1
0
1
2
3
4
Irel
and
Sw
itzer
land
Net
herla
nds
Por
tuga
lN
orw
ayF
inla
ndB
elgi
umG
erm
any
Gre
ece
UK
Aus
tria
Fra
nce
Sw
eden
Italy
Luxe
mbo
urg
Den
mar
kS
pain
Relative poverty
-3
-2
-1
0
1
2
3
4
Irel
and
Sw
itzer
land
Net
herla
nds
Por
tuga
lN
orw
ayF
inla
ndB
elgi
umG
erm
any
Gre
ece
UK
Aus
tria
Fra
nce
Sw
eden
Italy
Luxe
mbo
urg
Den
mar
kS
pain
Gini index
-3
-2
-1
0
1
2
3
4
Irel
and
Sw
itzer
land
Net
herla
nds
Por
tuga
lN
orw
ayF
inla
ndB
elgi
umG
erm
any
Gre
ece
UK
Aus
tria
Fra
nce
Sw
eden
Italy
Luxe
mbo
urg
Den
mar
kS
pain
Source: elaborations on EU-SILC data. Countries are ranked by absolute change in Gini index.
Great Recession and income distribution(percentage point changes 2007-09)

Source: elaborations on EU-SILC data.
Share of individuals with equivalent income below 60% of median national equivalent income.
Great Recession and relative poverty(percentage point changes 2007-09)
-6
-5
-4
-3
-2
-1
0
1
2
3S
witz
erla
nd UK
Aus
tria
Fin
land
Por
tuga
l
Irel
and
Gre
ece
Italy
Sw
eden
Net
herla
nds
Bel
gium
Luxe
mbo
urg
Den
mar
k
Spa
in
Fra
nce
Nor
way
Ger
man
y
Less than 18 years From 18 to 64 years 65 years or over

• More uncertain picture for post-GR period, because of fiscal consolidation– Inequality and poverty (esp. absolute) up in 2010 in
Ireland, not in UK
• Austerity packages differ in design– Micro-simulations of 2009-11 measures using
Euromod by H. Sutherland and co-authors
Do Europe’s welfare states work?

Anchored poverty
-3
-2
-1
0
1
2
3
4
Irel
and
Sw
itzer
land
Net
herla
nds
Por
tuga
lN
orw
ayF
inla
ndB
elgi
umG
erm
any
Gre
ece
UK
Aus
tria
Fra
nce
Sw
eden
Italy
Luxe
mbo
urg
Den
mar
kS
pain
Relative poverty
-3
-2
-1
0
1
2
3
4
Irel
and
Sw
itzer
land
Net
herla
nds
Por
tuga
lN
orw
ayF
inla
ndB
elgi
umG
erm
any
Gre
ece
UK
Aus
tria
Fra
nce
Sw
eden
Italy
Luxe
mbo
urg
Den
mar
kS
pain
Gini index
-3
-2
-1
0
1
2
3
4
Irel
and
Sw
itzer
land
Net
herla
nds
Por
tuga
lN
orw
ayF
inla
ndB
elgi
umG
erm
any
Gre
ece
UK
Aus
tria
Fra
nce
Sw
eden
Italy
Luxe
mbo
urg
Den
mar
kS
pain
Source: elaborations on EU-SILC data. Countries are ranked by absolute change in Gini index.
Great Recession and income distribution(percentage point changes 2007-09)

Anchored poverty
-3
-2
-1
0
1
2
3
4
Irel
and
Sw
itzer
land
Net
herla
nds
Por
tuga
lN
orw
ayF
inla
ndB
elgi
umG
erm
any
Gre
ece
UK
Aus
tria
Fra
nce
Sw
eden
Italy
Luxe
mbo
urg
Den
mar
kS
pain
Relative poverty
-3
-2
-1
0
1
2
3
4
Irel
and
Sw
itzer
land
Net
herla
nds
Por
tuga
lN
orw
ayF
inla
ndB
elgi
umG
erm
any
Gre
ece
UK
Aus
tria
Fra
nce
Sw
eden
Italy
Luxe
mbo
urg
Den
mar
kS
pain
Gini index
-3
-2
-1
0
1
2
3
4
Irel
and
Sw
itzer
land
Net
herla
nds
Por
tuga
lN
orw
ayF
inla
ndB
elgi
umG
erm
any
Gre
ece
UK
Aus
tria
Fra
nce
Sw
eden
Italy
Luxe
mbo
urg
Den
mar
kS
pain
Source: elaborations on EU-SILC data. Countries are ranked by absolute change in Gini index.
Great Recession and income distribution(percentage point changes 2007-09 and 2009-10)

-4
-2
0
1 2 3 4 5 6 7 8 9 10income decile group
IT LT UK
-8
-6
-4
-2
0
1 2 3 4 5 6 7 8 9 10income decile group
EE ES RO
-14
-12
-10
-8
-6
-4
-2
0
1 2 3 4 5 6 7 8 9 10income decile group
EL LV PT
chan
ge in
ave
rage
dis
pos
abl
e in
com
e, %
Austerity packages and household income (micro-simulated percentage point changes)
Source: Euromod estimates from Figari, Tandullia and Taddei 2012.
• There is no European social model, but many models
• Account for diversity:– Size– Structure: tax composition– Structure: in-kind vs. cash benefits– Structure: means vs. non-means-tested benefits– …
European social models

Source: Eurostat.
Receipts from taxes and social contributions(2007, % of GDP)
0 5 10 15 20 25 30 35 40 45 50
Slovakia
Romania
Lithuania
Latvia
Estonia
Ireland
Bulgaria
Greece
Poland
Czech Rep.
Portugal
Malta
Luxembourg
Slovenia
UK
Spain
Netherlands
Germany
Cyprus
Hungary
Italy
Finland
Austria
France
Belgium
Sweden
Denmark
Taxes on incomeand wealth
Social securitycontributions
Taxes on importsand production
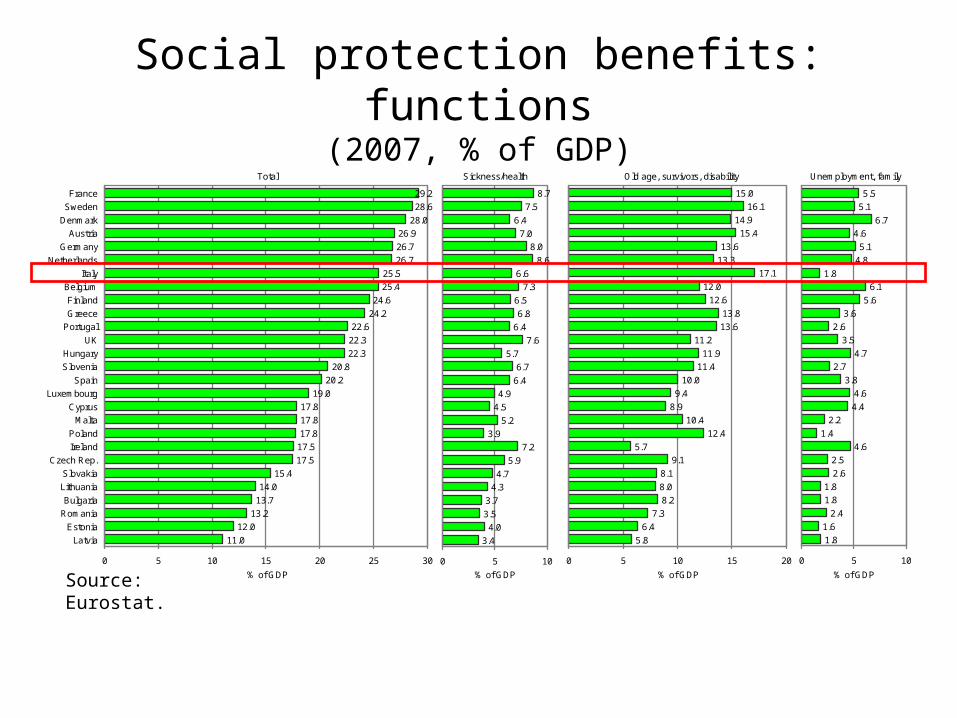
Social protection benefits: functions(2007, % of GDP)
Source: Eurostat.
Total
11.0
12.0
13.2
13.7
14.0
15.4
17.5
17.5
17.8
17.8
17.8
19.0
20.2
20.8
22.3
22.3
22.6
24.2
24.6
25.4
25.5
26.7
26.7
26.9
28.0
28.6
29.2
0 5 10 15 20 25 30
Latvia
Estonia
Romania
Bulgaria
Lithuania
Slovakia
Czech Rep.
Ireland
Poland
Malta
Cyprus
Luxembourg
Spain
Slovenia
Hungary
UK
Portugal
Greece
Finland
Belgium
Italy
Netherlands
Germany
Austria
Denmark
Sweden
France
% of GDP
Sickness/health
3.4
4.0
3.5
3.7
4.3
4.7
5.9
7.2
3.9
5.2
4.5
4.9
6.4
6.7
5.7
7.6
6.4
6.8
6.5
7.3
6.6
8.6
8.0
7.0
6.4
7.5
8.7
0 5 10
% of GDP
Unemployment, family
1.8
1.6
2.4
1.8
1.8
2.6
2.5
4.6
1.4
2.2
4.4
4.6
3.8
2.7
4.7
3.5
2.6
3.6
5.6
6.1
1.8
4.8
5.1
4.6
6.7
5.1
5.5
0 5 10
% of GDP
Old age, survivors, disability
5.8
6.4
7.3
8.2
8.0
8.1
9.1
5.7
12.4
10.4
8.9
9.4
10.0
11.4
11.9
11.2
13.6
13.8
12.6
12.0
17.1
13.3
13.6
15.4
14.9
16.1
15.0
0 5 10 15 20
% of GDP

Source: Eurostat.
Social protection benefits: structure(2007, % of GDP)
0 5 10 15 20 25 30
Latvia
Estonia
Romania
Bulgaria
Lithuania
Slovakia
Czech Rep.
Ireland
Poland
Malta
Cyprus
Luxembourg
Spain
Slovenia
Hungary
UK
Portugal
Greece
Finland
Belgium
Italy
Netherlands
Germany
Austria
Denmark
Sweden
France
Means-testedbenefits
Non means-tested benefits
0 5 10 15 20 25 30
Latvia
Estonia
Romania
Bulgaria
Lithuania
Slovakia
Czech Rep.
Ireland
Poland
Malta
Cyprus
Luxembourg
Spain
Slovenia
Hungary
UK
Portugal
Greece
Finland
Belgium
Italy
Netherlands
Germany
Austria
Denmark
Sweden
France
Benefits in kind
Cash benefits

• Taxes and benefits are stratified systems, resulting from cumulative changes, need not correspond to a rational and organic design
• Systems evolve over time • Account for change
– Hartz reforms, Germany, 2003-05– Revenu de solidarité active, France, 2009– Universal Credit, UK, 2013– Assicurazione sociale per l’impiego (Social
Insurance for Employment), Italy, 2012– …
European social models

• Family policies:
“… Societies approach the relationship between family, state and market in rather different ways … A range of factors have conditioned this set of interrelations historically; the homogenizing tendency of economic growth and development being reined in by the specificities of political philosophy and politics at nation state level.
… the distinctiveness of family policy across countries is being eroded. While no country has exactly the same reform programme and none is following exactly the approach endorsed by the EU and OECD, they have in common a proclivity to ‘mix and match’. The result is a hybridization of existing systems ….”
(Daly 2012)
Common trends?

Strictness of employment protection, 1998-2008(1-6 scale)
Source: elaborations on OECD data.
1998
2008
0.0
0.5
1.0
1.5
2.0
2.5
3.0
3.5
4.0U
nit
ed
Kin
gd
om
Ire
lan
d
Hu
ng
ary
Po
lan
d
Den
ma
rk
Cze
ch
Rep
ub
lic
Slo
vak
Re
pu
blic
Fin
lan
d
Au
stri
a
Bel
giu
m
Sw
ed
en
Ge
rma
ny
Net
he
rla
nd
s
Fra
nc
e
Sp
ain
Ita
ly
Gre
ece
Po
rtu
ga
l

50
52
54
56
58
60
62
64
66
68It
aly
Gre
ece
Bel
giu
m
Cze
ch
Rep
ub
lic
Fra
nc
e
Hu
ng
ary
Lu
xem
bo
urg
Slo
vak
Re
pu
blic
Ge
rma
ny
Au
stri
a
Fin
lan
d
Ire
lan
d
Net
he
rla
nd
s
Po
lan
d
Po
rtu
ga
l
Sp
ain
Sw
ed
en
Un
ite
d K
ing
do
m
Den
ma
rk
Men’s pensionable age, 1993-2030(years; updated to January 2011)
Source: elaborations on OECD data.
1993
2030
0
10
20
30
40
50
60
70
80
90
100U
nit
ed
Kin
gd
om
Ire
lan
d
Cze
ch
Rep
ub
lic
Ita
ly
Po
lan
d
Au
stri
a
Gre
ece
Hu
ng
ary
Ge
rma
ny
Fin
lan
d
Slo
vak
Re
pu
blic
Net
he
rla
nd
s
Fra
nc
e
Sp
ain
Bel
giu
m
Po
rtu
ga
l
Sw
ed
en
Lu
xem
bo
urg
Den
ma
rk
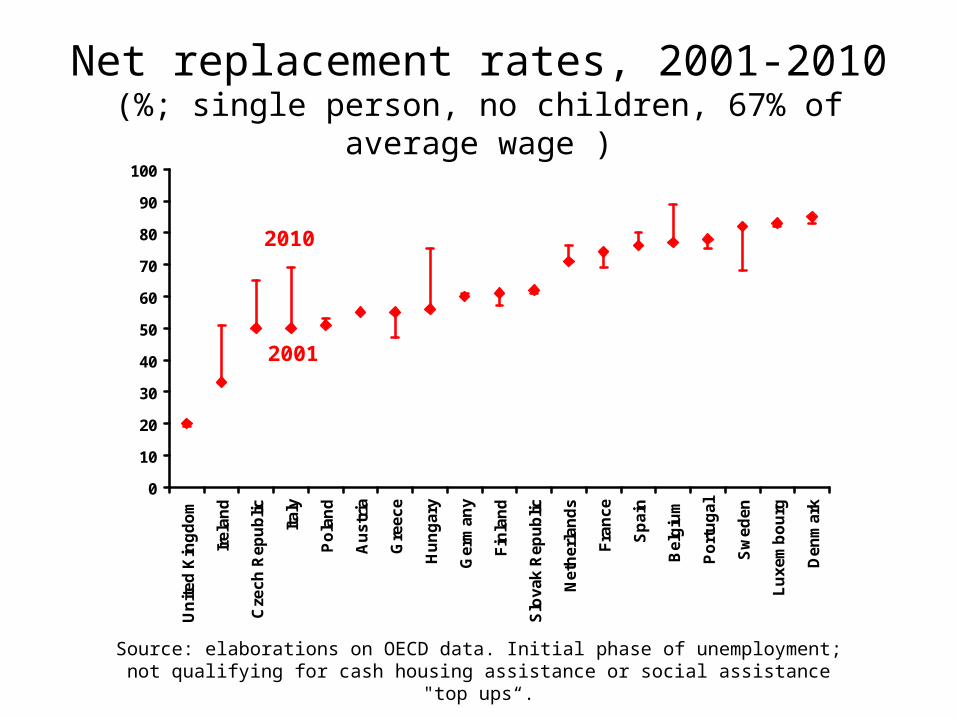
Net replacement rates, 2001-2010(%; single person, no children, 67% of average wage )
Source: elaborations on OECD data. Initial phase of unemployment; not qualifying for cash housing assistance or social assistance "top ups“.
2001
2010

Cross-country coefficient of variationof policy indicators
Source: elaborations on OECD data.
0.20
0.24
0.28
0.32
1990 1995 2000 2005 2010 2015 2020 2025 2030
0.03
0.04
0.05
0.06
1990 1995 2000 2005 2010 2015 2020 2025 2030
Employment protection
Net replacement rate
Men’s pensionable age

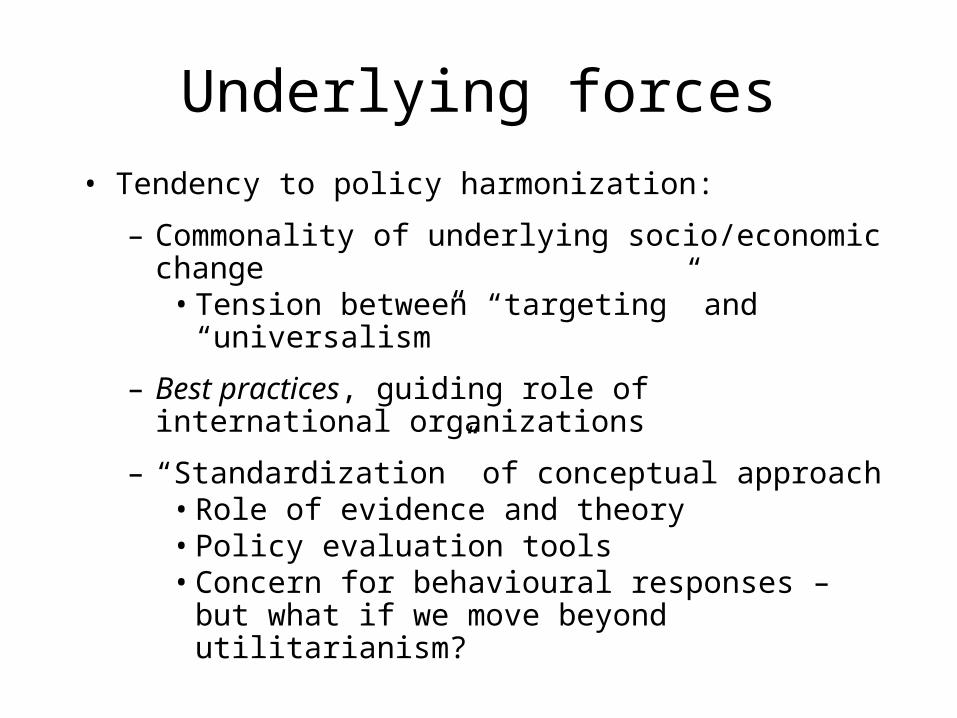
• Tendency to policy harmonization:
– Commonality of underlying socio/economic change• Tension between “targeting” and “universalism”
– Best practices, guiding role of international organizations
– “Standardization” of conceptual approach• Role of evidence and theory
Underlying forces

• The role of evidence and theory:
“… these empirical relationships are brought together with the structure of mechanism design from economic theory to determine efficiency costs, overall optimality, and improvements to tax design.” (Blundell 2012)
“There are three key ingredients to any optimal tax analysis: the accurate measurement of response elasticities, the detailed description of the distribution of income, and some view of social welfare weights.” (Blundell 2012)
The Mirrlees Review
• Tendency to policy harmonization:
– Commonality of underlying socio/economic change• Tension between “targeting” and “universalism”
– Best practices, guiding role of international organizations
– “Standardization” of conceptual approach• Role of evidence and theory• Policy evaluation tools• Concern for behavioural responses – but what if
we move beyond utilitarianism?
Underlying forces

Conclusions• European tax-and-benefit systems played positive
roles but need reform: citizens may not be all equally protected, context is different, spending cuts, …
• Reform process:
– “Politics” matters
– Economic theory and empirical evidence provide useful guidance, but be aware of their limits
• Novelty: European dimension?
– Status quo vs. break-up of MU: no alternative?
• Van Rompuy’s EU level unemployment benefit
• Atkinson’s EU level child benefit

Thank you for your attention!