andreu, n; zelmer, a; fletcher, t; elkington, pt; ward, th...
TRANSCRIPT
Andreu, N; Zelmer, A; Fletcher, T; Elkington, PT; Ward, TH; Ripoll,J; Parish, T; Bancroft, GJ; Schaible, U; Robertson, BD; Wiles, S(2010) Optimisation of bioluminescent reporters for use with my-cobacteria. PloS one, 5 (5). e10777. ISSN 1932-6203 DOI: https://doi.org/10.1371/journal.pone.0010777
Downloaded from: http://researchonline.lshtm.ac.uk/3509/
DOI: 10.1371/journal.pone.0010777
Usage Guidelines
Please refer to usage guidelines at http://researchonline.lshtm.ac.uk/policies.html or alterna-tively contact [email protected].
Available under license: http://creativecommons.org/licenses/by/2.5/

Optimisation of Bioluminescent Reporters for Use withMycobacteriaNuria Andreu1, Andrea Zelmer2, Taryn Fletcher1, Paul T. Elkington1, Theresa H. Ward2, Jorge Ripoll3,
Tanya Parish4,5, Gregory J. Bancroft2, Ulrich Schaible2,6, Brian D. Robertson1, Siouxsie Wiles2,7*
1 Department of Medicine, Imperial College London, London, United Kingdom, 2 Department of Infectious and Tropical Diseases, London School of Hygiene and Tropical
Medicine, London, United Kingdom, 3 Institute of Electronic Structure and Laser, Foundation for Research and Technology-Hellas, Heraklion, Crete, Greece, 4 Barts and the
London School of Medicine and Dentistry, Queen Mary University of London, London, United Kingdom, 5 Infectious Diseases Research Institute, Seattle, Washington,
United States of America, 6 Department of Molecular Infection Research, Research Center Borstel, Borstel, Germany, 7 Department of Molecular Medicine and Pathology,
University of Auckland, Auckland, New Zealand
Abstract
Background: Mycobacterium tuberculosis, the causative agent of tuberculosis, still represents a major public health threat inmany countries. Bioluminescence, the production of light by luciferase-catalyzed reactions, is a versatile reporter technologywith multiple applications both in vitro and in vivo. In vivo bioluminescence imaging (BLI) represents one of its mostoutstanding uses by allowing the non-invasive localization of luciferase-expressing cells within a live animal. Despite theextensive use of luminescent reporters in mycobacteria, the resultant luminescent strains have not been fully applied to BLI.
Methodology/Principal Findings: One of the main obstacles to the use of bioluminescence for in vivo imaging is theachievement of reporter protein expression levels high enough to obtain a signal that can be detected externally. Therefore,as a first step in the application of this technology to the study of mycobacterial infection in vivo, we have optimised the useof firefly, Gaussia and bacterial luciferases in mycobacteria using a combination of vectors, promoters, and codon-optimisedgenes. We report for the first time the functional expression of the whole bacterial lux operon in Mycobacterium tuberculosisand M. smegmatis thus allowing the development of auto-luminescent mycobacteria. We demonstrate that the Gaussialuciferase is secreted from bacterial cells and that this secretion does not require a signal sequence. Finally we prove thatthe signal produced by recombinant mycobacteria expressing either the firefly or bacterial luciferases can be non-invasivelydetected in the lungs of infected mice by bioluminescence imaging.
Conclusions/Significance: While much work remains to be done, the finding that both firefly and bacterial luciferases canbe detected non-invasively in live mice is an important first step to using these reporters to study the pathogenesis of M.tuberculosis and other mycobacterial species in vivo. Furthermore, the development of auto-luminescent mycobacteria hasenormous ramifications for high throughput mycobacterial drug screening assays which are currently carried out either in adestructive manner using LuxAB or the firefly luciferase.
Citation: Andreu N, Zelmer A, Fletcher T, Elkington PT, Ward TH, et al. (2010) Optimisation of Bioluminescent Reporters for Use with Mycobacteria. PLoS ONE 5(5):e10777. doi:10.1371/journal.pone.0010777
Editor: T. Mark Doherty, Statens Serum Institute, Denmark
Received January 20, 2010; Accepted April 27, 2010; Published May 24, 2010
Copyright: � 2010 Andreu et al. This is an open-access article distributed under the terms of the Creative Commons Attribution License, which permitsunrestricted use, distribution, and reproduction in any medium, provided the original author and source are credited.
Funding: This work is funded by an award (42786) to the Imaging TB Consortium from the Bill and Melinda Gates Foundation (www.gatesfoundation.org) TBDrug Accelerator program. The funders had no role in study design, data collection and analysis, decision to publish, or preparation of the manuscript.
Competing Interests: The authors have declared that no competing interests exist.
* E-mail: [email protected]
Introduction
Mycobacterium tuberculosis was first isolated more than 125 years ago.
Although a huge amount of research has been devoted to it over this
time, tuberculosis still represents a major public health threat in many
countries [1]. The main hindrances in fighting this disease include a
lack of understanding of the human infection, its establishment and
progression, as well as the host-pathogen interactions that determine
the different outcomes. Furthermore, the treatment regimen of six
months administration of up to four drugs has not evolved in more
than four decades, and recent years have seen an alarming increase in
multi-drug resistant (MDR) and extensively drug-resistant (XDR)
strains. It is clear then that novel and imaginative approaches are
needed to speed up both basic and translational research in
tuberculosis, especially in the areas of vaccine and drug development.
Bioluminescence, the production of light by luciferase-catalysed
reactions, is a versatile reporter technology with multiple
applications both in vitro and in vivo. In vivo bioluminescence
imaging (BLI) represents one of its most outstanding uses by
allowing the non-invasive localisation of luciferase-expressing cells
within an animal. Applied to the study of infectious diseases, BLI
permits the detection of microorganisms from within living
animals thus allowing the spatiotemporal study of infection in
real-time in the same host [2]. Moreover, using luciferase as a
reporter of gene expression, it is possible to establish when and
where a gene function is needed, shedding light on bacterial
pathogenesis [3,4,5]. Finally, BLI constitutes an easy and rapid
method to test novel antimicrobial compounds in vivo [6,7].
Luciferases are a large family of enzymes that catalyse the
oxidation of a substrate, generically called luciferin, to yield
PLoS ONE | www.plosone.org 1 May 2010 | Volume 5 | Issue 5 | e10777

oxyluciferin with the concomitant production of light. Three main
luciferin-luciferase systems have been utilised for BLI [8]. The first
system is represented by the firefly luciferase (FFluc) from Photinus
pyralis which uses D-luciferin (a benzothiazole) as substrate, is
dependent on ATP and results in the production of yellow-green
light (557 nm). The second system includes the luciferases from the
marine organisms Renilla reniformis (a cnidarian) and Gaussia princeps
(a copepod) and the substrate coelenterazine. The signal produced
by the G. princeps luciferase (Gluc) has been reported to be stronger
than that of FFluc [9], even though the light emitted is in the blue
range (480 nm) and is therefore more susceptible to tissue
absorption and scattering. The fact that Gluc is strongly resistant
to heat and extreme pH [9,10], and that it is secreted by
eukaryotic cells also make this system very attractive. Bacterial
luciferases, found in the terrestrial bacterium Photorhabdus lumines-
cens and marine bacteria from the genera Vibrio and Photobacterium,
constitute the third luciferin-luciferase system. These luciferases
are heterodimeric enzymes that use FMNH2 and a long-chain
aldehyde as substrates. Bacterial luciferases are encoded by the
genes luxAB that form an operon (luxCDABE) together with three
additional genes (luxCDE) whose products synthesise the long-
chain aldehyde. The main advantage of this system is that it does
not need exogenously added substrate, but again the light
produced is in the blue range (490 nm).
Bioluminescence has been used in mycobacterial research for
more than 20 years. Initially, FFluc was used to measure ATP as
an indirect method of assessing cell viability and cell numbers
[11,12]. Considering the long duplication times of mycobacteria,
the advantages of using bioluminescence as a reporter to assay
anti-mycobacterial agents soon became evident when compared to
the more traditional colony count methods. To this end LuxAB
(requiring the addition of exogenous substrate) and FFluc have
been used in M. smegmatis, M. tuberculosis, M. bovis BCG, and even
M. avium, M. intracellulare and M. aurum [13,14,15,16,17,18,19].
The development of luciferase reporter phages represented a
further improvement as it enabled testing of the drug susceptibility
of clinical strains and has subsequently been applied to
tuberculosis diagnostics [20,21,22,23,24,25,26,27]. Finally, lumi-
nescent reporter strains have also been used for antibiotic testing
and immunity assessment in cell cultures and ex vivo in organ
homogenates of infected mice [28,29,30,31,32,33,34,35].
Despite the extensive use of luminescent reporters in mycobac-
teria, these have only recently been applied to the imaging of
mycobacteria in vivo [36]. In the single published paper on BLI of
mycobacteria, Heus and collaborators utilised a recombinant M.
bovis BCG strain expressing luxAB to monitor mycobacteria
infection in vivo. While the authors prove that BLI can be used
to study bacterial dissemination, drug efficacy and the role of the
immune response, their approach has some limitations. In fact, the
authors failed to detect BCG in the lungs of infected mice despite
being able to detect bacteria in these organs by colony counting
and ex vivo imaging. Because their luminescent strain of BCG did
not express the luxCDE genes for substrate synthesis, Heus and
collaborators had to administer decanal to the mice in order to
image the bacteria. This substrate is highly toxic and, although
they were able to deliver it by injection into the murine
peritoneum dissolved in a mixture of olive oil and ethanol, this
delivery method would appear to have limited distribution to the
lungs, which are of major importance for tuberculosis research.
In the work reported here, we have improved the signal
obtained from FFluc and Gluc (both of which use non-toxic
substrates), and Lux in mycobacteria using a combination of
vectors, promoters, and codon-optimised genes. We report for the
first time the functional expression of the whole Lux operon in M.
tuberculosis and M. smegmatis thus allowing the development of auto-
luminescent mycobacteria. Moreover, we demonstrate that FFluc
and Lux are both useful for the non-invasive detection of
mycobacteria in the lungs of infected mice.
Results
Maximising luminescent reporter gene expressionAs a first step towards the generation of highly-luminescent
mycobacteria, each of the three luciferases was cloned into three
different expression vectors that contained the same promoter
(Phsp60) but which differ in copy number: (i) pSMT3, which has a
pAL5000 replicon and is maintained at 2–5 copies per cell [37,38];
(ii) pSMT3M [39], which has a mutation in the repA gene that
increases the copy number to 32–64 copies [40]; and (iii)
pMV306hsp which integrates into the chromosomal attB site and
hence results in single copy number [38]. For the Lux reporter we
used a luxABCDE operon that had been previously modified for
expression in Gram positive bacteria by replacement of the
ribosome binding sites and reorganisation of the genes [41]. All the
constructs were electroporated into M. smegmatis, and the
luminescence of 10 randomly selected clones was analysed for
each type of construct (Fig. 1). For the three reporters, a high
luminescent signal was produced by colonies expressing the
integrated constructs derived from pMV306hsp with median
values of 1.16107 RLUs for FFluc, 8.96106 RLUs for Gluc, and
3.66104 RLUs for Lux. The pSMT3 derivatives also yielded good
signal levels with Gluc (median value, 1.56107 RLUs) and in three
out of ten FFluc clones (4.56105, 5.86106 and 1.56107 RLUs).
Remarkably, a high variation was detected among the
pSMT3+FFluc clones (signal range of 3.76102–1.56107 RLUs),
with light production only slightly over the background in three of
them (Fig. 1A); this is likely related to the fact that many of these
clones carried deletions affecting the reporter gene (data not
shown). For all three reporters, the lowest luminescence was
obtained with pSMT3M, the high copy number vector. In
particular, seven out of ten transformants carrying
pSMT3M+FFluc and all the pSMT3M+Lux clones analysed
produced only background levels of bioluminescence (Fig. 1A, C).
Further screening of 96 pSMT3M+Lux transformants imaged
with the IVISH Spectrum failed to detect any bioluminescent
clones. Similarly, out of 387 pSMT3+Lux transformants obtained,
only 12 were glowing when imaged with the IVISH Spectrum.
However, these positive clones lost their luminescence after
subculturing. Deletions of 5–6 kb, comprising almost the whole
lux operon, were detected in these and the pSMT3M+Lux
transformants (data not shown). Therefore the highest expression
and stability was achieved with the pMV306hsp integrating vector,
which was selected for further studies.
Next, we tested different promoters to drive expression of the
luciferase genes. Using the integrating vector pMV306, each
reporter gene was cloned in front of previously described strong
promoters: Phsp60, PmyctetO [42], and PG13 [43,44]. These
constructs were introduced into M. smegmatis, and the lumines-
cence of 10 randomly selected transformants analysed (Fig. 2).
Similar luminescence values were obtained among strains
expressing either FFluc or Gluc under the control of either Phsp60
or PG13 (median values of 1.56107 and 2.36107 RLUs respec-
tively for FFluc, 8.96106 and 5.056106 RLUs for Gluc), while
production of light from PmyctetO clones was 3–13 times lower. In
the case of Lux, the highest luminescence was achieved using Phsp60
(3.66104 RLUs), followed by PG13 (9 times lower), and PmyctetO
(180 times lower than that of Phsp60). Consequently Phsp60 was the
promoter chosen for expression of the luminescent reporters.
Bioluminescent Mycobacteria
PLoS ONE | www.plosone.org 2 May 2010 | Volume 5 | Issue 5 | e10777

Additionally, in order to increase the amount of substrate
synthesised by the Lux operon and in this way the amount of
luminescence, PG13 was cloned in front of luxC in
pMV306hsp+Lux. This resulted in a 6-fold increase in the
luminescence activity compared to the original pMV306hsp+Lux,
from 3.66104 to 2.256105 RLUs (Fig. 2C).
Lastly, as a potential way of enhancing the expression of
reporter genes at the translational level, we utilised versions of ffluc
and gluc whose codon usage had been optimised for use in
mycobacteria, together with an improved Shine Dalgarno
sequence [45]. We also tested a lux operon with codon usage
optimised for mycobacteria, but no luminescence was produced by
this strain, even if the substrate for the bacterial luciferase was
added exogenously (data not shown). Alternatively, we used a
luxCDABE operon (LuxStm) codon-optimised for Streptomyces
coelicolor [46]. Using pMV306hsp as the expression vector the
luminescence of the optimised reporters was compared to that of
the wild-type genes (Fig. 3). Codon optimisation resulted in a 30-
fold, 2.5-fold and 4-fold improvement in the signal for FFluc, Gluc
and Lux respectively. Accordingly, the optimised gluc and ffluc
genes were selected for further study. However, since the
luminescence of LuxStm was lower than that of the reorganised
lux operon with PG13 cloned in front of luxC, the latter was chosen
for further study.
The three reporters were also tested in M. tuberculosis by
electroporating pMV306hsp+FFluc, pMV306hsp+Gluc and
pMV306hsp+Lux and measuring the bioluminescence of 10
randomly selected clones (Fig. 4). The signal obtained in M. tuberculosis
was slightly lower than that of M. smegmatis for FFluc (1.16107 and
1.56107 RLUs, respectively), whereas no significant differences were
detected for Gluc and Lux (5.86105 vs. 8.46105 RLUs, and 3.66104
vs. 4.66104 RLUs, correspondingly).
Optimisation of the in vitro bioluminescence reactionTo achieve the highest signal to background ratio we tested
different integration times (0.1–10 s) for the three reporters, at four
Figure 2. Expression of luciferases using promoters Phsp60 and PG13 leads to greater light production. Luminescence of M. smegmatisexpressing ffluc (a), gluc (b) and lux (c) was assayed using Phsp60, PmyctetO, and PG13 in the integrating vector pMV306. Each dot represents a randomlyselected transformant. Results are given as relative light units (RLUs) and are corrected for the background. Statistical significance was evaluated bythe Kruskal–Wallis test with subgroup analysis performed by Dunn’s multiple comparison test and those found to be significant (p,0.05) areindicated with *.doi:10.1371/journal.pone.0010777.g002
Figure 1. Expression from an integrating vector results in the highest and most stable bioluminescent signal. To study the effect ofcopy number on light production each reporter was cloned into standard (pSMT3), high (pSMT3M), and single copy number (pMV306hsp) vectors.Luminescence was measured for 10 independent M. smegmatis transformants each carrying the FFluc (a), Gluc (b) and Lux (c) constructs. Results aregiven as relative light units (RLUs) and are corrected for the background. Overall differences between groups were assessed using the Kruskal–Wallisnon-parametric test with differences between subgroups assessed by Dunn’s multiple comparisons test and those found to be significant (p,0.01)are indicated with *.doi:10.1371/journal.pone.0010777.g001
Bioluminescent Mycobacteria
PLoS ONE | www.plosone.org 3 May 2010 | Volume 5 | Issue 5 | e10777

different substrate concentrations for Gluc and FFluc (Fig. 5). As
shown in Fig. 5A, increasing the integration time yielded an
increased ratio for FFluc, reaching a maximal ratio at integration
times between 5 and 10 s, depending on substrate concentration.
This was also the case for Lux, with 10 s yielding the best result
(Fig. 5C). In contrast, increasing the integration time resulted in a
decreased signal to noise ratio for Gluc (Fig. 5B). This was likely
due to the high background produced by auto-oxidation of its
substrate coelenterazine [47]. Therefore, for further studies the
integration times selected were 5 s, 0.1 s and 10 s for FFluc, Gluc
and Lux respectively.
We then studied the effect of substrate concentration on light
production by FFluc and Gluc (Fig. 6). In both cases the
luminescence increased with increasing substrate concentration
in an exponential manner until a plateau was reached at 40 mM
coelenterazine for Gluc and 1570 mM luciferin for FFluc, with
40 mM and 470 mm chosen as working concentrations.
Luminescence reaction kineticsThe kinetics of light output for each luciferase was measured for
M. smegmatis pMVhsp+FFluc, pMVhsp+Gluc and pMVhsp+Lux-
AB+G13+CDE over 30 min, following the addition of substrate as
appropriate (Fig. 7). For both Gluc and FFluc, the maximum
signal was obtained immediately after substrate addition with
median values of 2.9610568.96103 RLUs for Gluc and
2.2610767.16105 RLUs for FFluc. Then, Gluc luminescence
decreased dramatically with a 90% loss in just 1 min, whereas the
FFluc signal dropped slowly, still retaining 50% of the initial signal
after 17 min. In contrast, the light output for Lux remained stable
between 1.16106 and 2.26106 RLUs during the whole experi-
ment, most likely reflecting a continuous production of substrate
by the cells.
We then analysed luminescence production during the growth
of the same luciferase-producing strains (Fig. 8). The level of
luminescence correlated well with cell density during the
exponential growth phase for all the three reporters. However,
the signal dropped when the cultures of lux- and ffluc-expressing
cells entered stationary phase with a total loss of 83% and 77%
respectively between the time points 12 and 28 h (Fig. 8A, C). This
is most likely related to a decrease in the metabolic activity of the
bacteria, and therefore in the availability of the FMNH2 and ATP
needed by Lux and FFluc, respectively. In contrast, luminescence
from cells expressing the Gaussia luciferase, which does not require
any bacterial cofactors to catalyse the luminescence reaction,
remained related to cell numbers until the end of the growth curve
(Fig. 8B). Moreover, using mid-log cultures a good correlation
(Spearman r = 1) was found between colony forming units (CFU)
and luminescence (measured with the plate luminometer) over a
Figure 3. Codon optimisation increases bioluminescence in vitro. Relative light units (RLUs) were measured in 10 M. smegmatis clones transformedwith a wild-type or a Mycobacterium optimised FFluc (a) or Gluc (b), or with a Gram positive or Streptomyces optimised Lux (c). In all cases pMV306hsp wasused as backbone. Results are corrected for the background. Statistical significance was evaluated by the Mann-Whitney non-parametric test for FFluc andLux, and by unpaired t test for Gluc (data normality passed) and those found to be significant (p,0.05) are indicated with *.doi:10.1371/journal.pone.0010777.g003
Figure 4. Bioluminescence levels in M. tuberculosis and M. smegmatis are comparable in vitro. Relative light units (RLUs) were measured in10 M. smegmatis and 10 M. tuberculosis clones transformed with pMV306hsp+FFluc (a), pMV306hsp+Gluc (b) or pMV306hsp+Lux (c). Results arecorrected for the background. Statistical significance was evaluated by the Mann-Whitney non-parametric test for Lux, and by unpaired t test forFFluc and Gluc (data normality passed) and those found to be significant (p,0.05) are indicated with *.doi:10.1371/journal.pone.0010777.g004
Bioluminescent Mycobacteria
PLoS ONE | www.plosone.org 4 May 2010 | Volume 5 | Issue 5 | e10777

range of cell numbers: 104 and 108 CFU for ffluc-expressing M.
smegmatis, 103 and 108 for lux-expressing cells, and 104–106 for
Gluc producing M. smegmatis (Fig. 8D–F).
Secretion of Gaussia luciferaseIt has previously been stated that Gluc is secreted from eukaryotic
cells because of a signal peptide situated at the N-terminal end of the
Figure 5. Signal:noise for FFluc and Lux increases with integration time, and decreases for Gluc. Luminescence was measured using sixdifferent integration times and four different substrate concentrations for M. smegmatis producing FFluc (a) and Gluc (b), or without substrate for Lux(c). The background luminescence was obtained from cultures of M. smegmatis with the empty pMV306hsp. Assays were performed with threeindependent mid-log cultures and each culture was measured in duplicate. As the data was not normally distributed, median values are displayed(bar) with inter-quartile ranges (box), and highest and lowest values (whiskers).doi:10.1371/journal.pone.0010777.g005
Figure 6. Bioluminescence correlates with substrate concentration at low concentrations. Luminescence (given as relative light units[RLUs]) of M. smegmatis pMVhsp+FFluc (a) and M. smegmatis pMVhsp+Gluc (b) was measured with integration times of 5 s and 0.1 s respectively. Thesubstrate concentrations assayed ranged from 20 to 4710 mM luciferin for FFluc, and from 0.05 to 400 mM coelenterazine for Gluc. Means andstandard deviations (smaller than symbols) of six replicates are shown.doi:10.1371/journal.pone.0010777.g006
Bioluminescent Mycobacteria
PLoS ONE | www.plosone.org 5 May 2010 | Volume 5 | Issue 5 | e10777

protein [9]. To determine if Gluc was also secreted in M. smegmatis, we
examined the luminescence produced by the whole culture, the cells
or the culture supernatant. Moreover, as a way to assess the role of the
signal peptide, experiments were also performed using strains
expressing codon-optimised and wild-type forms of Gluc without
the signal sequence. As shown in Fig. 9, almost 100% of the
luminescence was detected in the supernatant of all gluc-expressing M.
smegmatis regardless of the presence or absence of the signal peptide
and the codon usage of the gene used. In contrast, only 2% of the
total luminescence was found in the supernatant of FFluc-
producing M. smegmatis when analysed in a similar way. Surprisingly,
the light output from Gluc was higher when the signal peptide
was deleted (Fig. 9), both for the Mycobacterium optimised
(8.2610565.66104 RLUs compared to 1.75610563.86104
RLUs with signal peptide) and the wild-type genes
(1.5610561.366104 RLUs compared to 2.1610461.36103 RLUs).
Bioluminescence in vivo imagingTo assess if the signal produced by each of the three reporters
could be detected in vivo, three or four Balb/c mice were
endotracheally inoculated with 106–107 CFU of luminescent M.
smegmatis and imaged 24 h later with the IVISH Spectrum. The
background level of luminescence was estimated by imaging two
mice inoculated with the non-luminescent M. smegmatis
pMV306hsp.
Two substrate concentrations and two routes of administration
were assessed for FFluc: (i) 300 mg kg21 body weight and 500 mg
kg21 body weight for the intraperitoneal route, and (ii) 15 mg
ml21 and 30 mg ml21 for the intranasal route. Images were
acquired over a 3 h time period to determine the optimal time to
image after luciferin administration. For luciferin administered via
the intraperitoneal route, no signal could be detected until 5 min
post-substrate administration at which point bioluminescence was
evident in the lungs of all four positive mice and in the abdomen of
one mouse injected with 500 mg kg21 luciferin (Fig. 10). The
signal in the abdomen most likely reflects the presence of ffluc-
expressing M. smegmatis in the gastrointestinal tract, which could be
due to the introduction of some bacteria into the oesophagus
during the endotracheal inoculation. After the first 5 min, the
bioluminescent signal increased exponentially, reaching a peak
25–30 min after substrate injection, with a level four to six times
greater when using the higher concentration of luciferin (4.56107–
7.56107 photons s21 compared to 1.26107–1.46107 photons
s21). After that the light level diminished approximately 50% in
30 min, followed by another 50% decrease every hour until the
end of the experiment. No signal was detected in mice inoculated
with M. smegmatis pMV306hsp (Fig. 10A), with stable background
levels during the whole experiment (66104–86104 photons s21 for
300 mg kg21 luciferin, and 5.96104–1.26105 photons s21 for
500 mg kg21 luciferin, Fig. 10B). Therefore the best conditions for
imaging of ffluc-expressing M. smegmatis given intraperitoneal
substrate are using 500 mg kg21 luciferin and imaging 25–
30 min post-substrate administration.
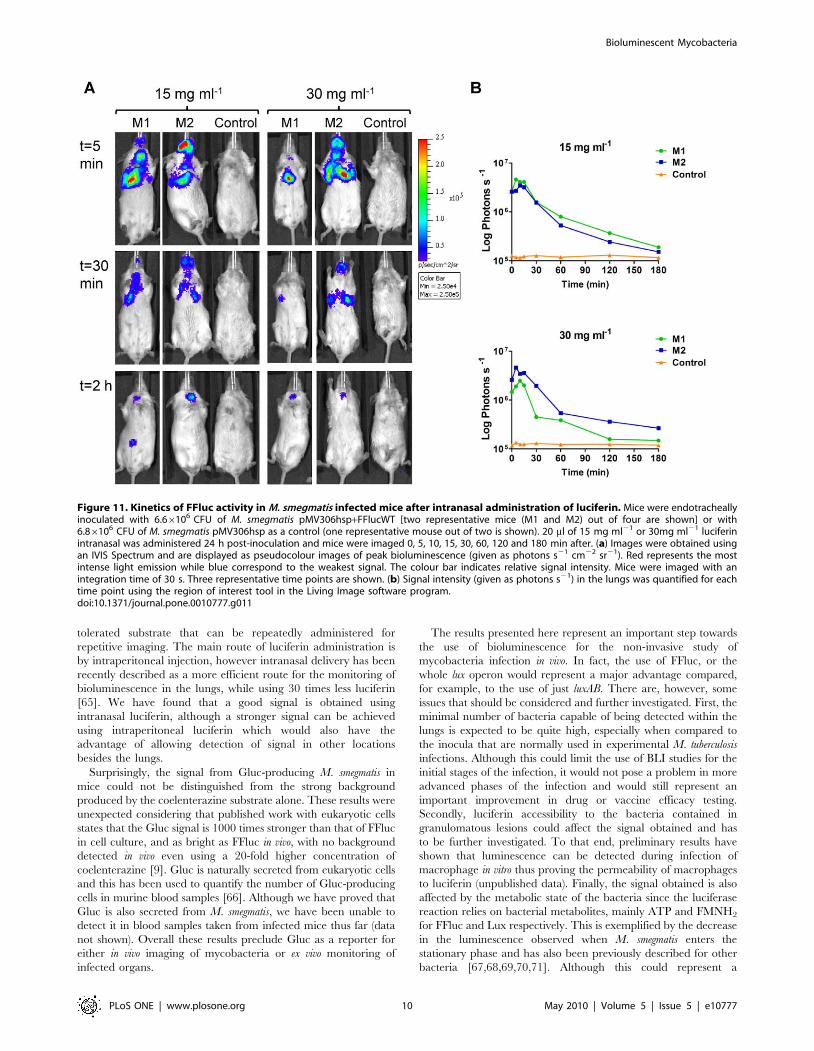
For luciferin administered by the intranasal route, biolumines-
cence could be detected immediately after substrate introduction
(Fig. 11), and the maximum signal in the lungs was obtained in just
5–10 min (3.56106–4.66106 photons s21 when 15 mg ml21
luciferin was administered, and 2.56106–4.66106 photons s21
for 30 mg ml21 luciferin). In addition to the signal in the lungs a
strong signal could be detected in the nose of the three positive
mice (Fig. 11A) indicating the presence of FFluc-producing M.
smegmatis in that organ too. This signal was not observed when the
luciferin was administered via the intraperitoneal route, most likely
as a result of the increased systemic distribution of the substrate.
After reaching a peak, the bioluminescence in the lung and nose
decreased by 50–80% in 30 min falling close to background levels
2–3 h after substrate administration (Fig. 11). The background
levels remained constant during the whole experiment at
approximately 1.26105 photons s21. Thus the best conditions
for imaging of ffluc-expressing M. smegmatis given intranasal
substrate are using 15 mg ml21 luciferin and imaging 5–10 min
post-substrate administration.
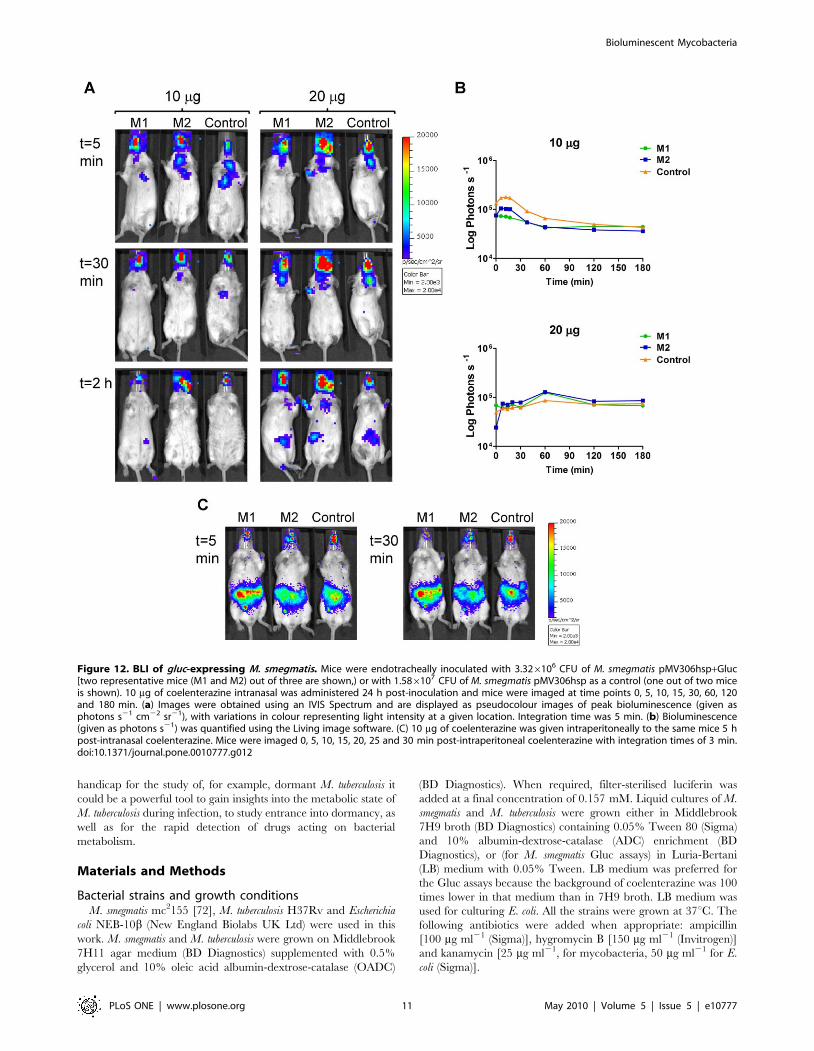
A similar assay was performed using Gluc. Two coelenterazine
concentrations were administered intranasally (10 and 20 mg) and
images were acquired at different time points over 3 h. A high
background was detected in all cases and no differences were
observed between mice inoculated with M. smegmatis
pMV306hsp+Gluc or M. smegmatis pMV306hsp (Fig. 12A, B).
The same mice were then administered 10 mg coelenterazine by
Figure 7. Light production from FFluc and Lux is stable, whereas the signal from Gluc rapidly dissipates. Luminescence (given asrelative light units [RLUs]) was measured every 10 s for gluc-expressing M. smegmatis and every 30 s for ffluc- or lux-expressing M. smegmatis, over a30 min period. The integration times used were 0.1 s, 5 s and 10 s for Gluc, FFluc and Lux respectively. At time point 0 min, 470 mM luciferin or40 mM coelenterazine were added to FFluc- and Gluc-producing M. smegmatis respectively. Two independent cultures were used for FFluc and Lux,and three for Gluc. Each culture was measured in duplicate and the means and standard deviations (smaller than symbols) are plotted.doi:10.1371/journal.pone.0010777.g007
Bioluminescent Mycobacteria
PLoS ONE | www.plosone.org 6 May 2010 | Volume 5 | Issue 5 | e10777

the intraperitoneal route 5 h after initial intranasal substrate
administration. A high background signal was detected in the
abdomen of both the positive and control mice (Fig. 12C), while
the bioluminescence observed in the nose was due to the previous
intranasal coelenterazine. Consequently, Gluc is not useful for in
vivo imaging of M. smegmatis.
Mice infected with M. smegmatis pMVhsp+LuxAB+G13+CDE
were also imaged. Bioluminescence could be detected in the lungs
of the positive mice while no signal was observed in the control
mouse (Fig. 13).
Finally, we also imaged mice infected with ffluc-expressing M.
tuberculosis after administering intranasal luciferin. Bioluminescence
Figure 8. Bioluminescence correlates with cell density during exponential growth in vitro. Cultures of M. smegmatis pMVhsp+FFluc (a),pMVhsp+Gluc (b) and pMVhsp+Lux (c) were inoculated to an optical density (OD) at 600 nm of 0.1 and the OD and the luminescence [given asrelative light units (RLUs)] measured over 28 h. The luminescence was measured with integration times of 5, 0.1, and 10 s respectively, and substrateconcentrations of 470 mM luciferin for FFluc and 40 mM coelenterazine for Gluc. The values represented correspond to the means of two independentcultures measured in triplicate. The error bars indicate standard deviations. A near linear relationship was found between bioluminescence [given asRLUs] and colony counts (given as colony forming units [CFU]) for mid-log cultures of M. smegmatis pMVhsp+FFluc (d), pMVhsp+Gluc (e) andpMVhsp+Lux (f) using a plate luminometer.doi:10.1371/journal.pone.0010777.g008
Bioluminescent Mycobacteria
PLoS ONE | www.plosone.org 7 May 2010 | Volume 5 | Issue 5 | e10777

was detected in the lungs of mice receiving ffluc-expressing
bacteria, while no signal was observed in the control mouse
infected with the wild-type M. tuberculosis H37Rv (Fig. 14).
Discussion
Work with mycobacteria is hampered by their long duplication
times meaning that, in the case of M. tuberculosis, results based on
organ CFU counts are only available three to four weeks after the
conclusion of the experiment. This handicap can, in part, be
overcome by the use of non-invasive imaging techniques which
allow infection dynamics to be studied in real-time. Moreover,
such techniques allow for drastic reductions in the numbers of
animals used in experiments. Recently an M. tuberculosis recom-
binant strain expressing a bacterial thymidine kinase was visualised
in vivo using [125I]FIAU-single photon emission computed
tomography (SPECT) [48]. While this technique is able to
accurately measure the level of signal and has good spatial
resolution, there are some issues with non-specific signals and the
relatively high cost [48].
An alternative to this technique is the use of BLI which has
proved very useful in the study of infectious diseases caused by a
variety of bacteria [49,50,51,52,53,54]. In the only work on BLI of
mycobacteria published so far, the luxAB genes were used, thus
requiring the administration of the toxic substrate decanal.
Although the infection could be detected in the abdomen of
intravenously infected mice, the signal in the lungs was too low to
be detected after intraperitoneal administration of aldehyde. To
overcome these problems and thus further develop BLI imaging of
mycobacteria, we have optimised the FFluc and Gluc luciferases
for use in mycobacteria, both of which use non-toxic substrates,
and the whole lux operon that does not require the external
addition of substrate.
Approaches for imaging reporter gene expression mainly
depend on robust levels of reporter protein. This, in turn, depends
on the nature of the expression vector used, including the copy
number, and the transcriptional and translational signals. With
this in mind we compared the bioluminescent signal obtained with
each reporter using three different vectors (two episomal vectors
with 2–5 and 32–64 copies per cell, and one integrating vector),
three different promoters (Phsp60, PmyctetO, and PG13), and finally,
with an optimised Shine-Dalgarno sequence, we also tested the
effect of codon optimisation. Our results demonstrate that the best
expression was achieved using the integrating vector, a finding
most likely linked to a considerable instability of the replicating
vectors when expressing ffluc and lux. In fact, the whole lux operon
was only stably expressed in M. smegmatis when it was cloned into
the integrating vector, with no positive clones isolated using the
episomal vectors. This would explain why this reporter operon had
never been successfully expressed in mycobacteria until now. A
similar situation has also been reported for the expression in
mycobacteria of other recombinant genes like the HIV-1 gp120
[38] or the human interleukin 2 [55]. The more stable expression
of foreign antigens in mycobacteria using integrating vectors as
opposed to episomal vectors has been extensively documented
[56,57,58,59] and is mainly attributed to lower expression, and
therefore a lower metabolic burden, associated with the reduction
in the copy number.
In the case of the lux operon, we have previously found that
plasmid-based expression of luxD is toxic in mycobacteria (S.
Wiles, unpublished results). This gene encodes an acyl transferase
which forms part of an enzyme complex (along with the products
of luxC and luxE) responsible for recycling the fatty acid by-
products of the luciferase reaction back into long chain aldehydes
for use as further substrate. Given the importance of fatty acids in
the cell wall structure of mycobacteria, it is not surprising that
over-expression of fatty acid modifying enzymes would be
detrimental.
Regarding promoter selection, we have found that the promoter
Phsp60 drove the highest luminescence for the three reporters,
although the differences between the three promoters were only
minor. Phsp60 is known to be a strong promoter in mycobacteria and
has been used extensively to over-express proteins [38,60,61,62,63].
However, PmyctetO, isolated from an M. smegmatis/M. tuberculosis
library using GFP to assess gene expression in vitro [42]; and PG13,
Figure 9. Gaussia luciferase is secreted from mycobacterial cells. Luminescence (given as relative light units [RLUs]) was measured in culture,supernatant and cell samples of M. smegmatis producing Gluc Mycobacterium optimised with (GlucSS) or without (Gluc) signal peptide, Gluc wild-type with (GlucWT+SS) or without (GlucWT-SS) signal peptide, and FFluc as control. Assays were performed with three independent cultures and eachculture was measured in duplicate. As the data was not normally distributed, median values are displayed (bar) with inter-quartile ranges (box), andhighest and lowest values (whiskers).doi:10.1371/journal.pone.0010777.g009
Bioluminescent Mycobacteria
PLoS ONE | www.plosone.org 8 May 2010 | Volume 5 | Issue 5 | e10777

isolated from an M. marinum library expressing GFP inside
macrophages [43,44], have both been reported to be stronger than
Phsp60 (10 and 10–20 times, respectively). The discrepancy with our
results could be related to the different reporters used to measure gene
expression, and the toxicity and metabolic load associated with their
over-expression. It may also be that the highest stable level of
expression for our reporters had already been achieved with the Phsp
and therefore the use of stronger promoters did not increase
expression further. This would be in agreement with the instability
observed using the episomal vectors for ffluc and lux, and when using
the PmyctetO with lux.
Perhaps unsurprisingly, codon-optimisation was found to increase
the signal obtained for FFluc (30-fold [76% homology]) and Gluc
(2.5-fold [74% homology]). Unexpectedly, the M. tuberculosis codon-
optimised Lux was found to be non-functional, even after the addition
of exogenous substrate. We have not explored the basis for this
inactivity; however, there is a suggestion from the optimised sequence
that after transcription the DNA may form secondary structures that
impede translation (data not shown).
We also characterised the various bioluminescence reactions by
varying the integration time and substrate concentration, and by
measuring the kinetics of light output. The results obtained are
similar to those previously described [9,10] proving that Gluc
catalyses a rapid ‘flash’ reaction, FFluc has glow kinetics, and the
continuous synthesis of substrate by the lux operon allows for
steady luminescence. In this work, we have found that FFluc
produced the highest luminescence, 10 times brighter than that
obtained with Lux, and 100 times that of Gluc. This is in contrast
with the results of Snewin et al. who found LuxAB to be brighter
than FFluc [31], but this was done using an episomal reporter that
required the addition of aldehyde substrate. Consequently, the
substrate may have been in excess, which might be a limiting
factor in our whole operon lux reporter. To test this hypothesis an
extra promoter was cloned in front of luxCDE to boost substrate
synthesis, and indeed a 6-fold higher signal was obtained. The
alternative of adding exogenous substrate also increased the signal
5–10 times (data not shown). The availability of FMNH2 could
also be a limiting factor. In yeast, co-expression of luxAB together
with the frp gene, encoding a NADPH-FMN oxidoreductase from
Vibrio harveyi, led to a 100-fold increase in the luminescence [64].
However, we have found the same approach in mycobacteria to
have no effect on the final signal (unpublished results).
Once the best conditions for reporter expression were selected,
we proceeded to explore if the bioluminescence signal obtained
was strong enough for the imaging of mycobacteria in vivo.
Importantly, bioluminescence could be detected in the lungs of
mice infected with either ffluc or lux-expressing M. smegmatis or
ffluc-expressing M. tuberculosis. FFluc utilises a non-toxic, well
Figure 10. Kinetics of FFluc activity in M. smegmatis infected mice after intraperitoneal injection of luciferin. Mice were endotracheallyinoculated with 1.46107 CFU of M. smegmatis pMV306hsp+FFlucWT [two representative mice (M1 and M2) out of four are shown] or with6.86106 CFU of M. smegmatis pMV306hsp (control). 300 mg kg21 or 500 mg kg21 luciferin intraperitoneal was given 24 h post-inoculation andimages were acquired at time points 0 (immediately after substrate administration), 5, 10, 15, 20, 25, 30, 60, 120 and 180 min. (a) Images wereobtained using an IVIS Spectrum and are displayed as pseudocolour images of peak bioluminescence (given as photons s21 cm22 steridian [sr]21),with variations in colour representing light intensity at a given location. Mice injected with 300 mg kg21 luciferin were imaged with an integrationtime of 1 min, whereas those that received 500 mg kg21 luciferin were imaged for 10 s to avoid saturation of the image. Three representative timepoints are shown. (b) Bioluminescence (given as photons s21) in the thorax was quantified for each time point using the region of interest tool in theLiving Image software program.doi:10.1371/journal.pone.0010777.g010
Bioluminescent Mycobacteria
PLoS ONE | www.plosone.org 9 May 2010 | Volume 5 | Issue 5 | e10777
tolerated substrate that can be repeatedly administered for
repetitive imaging. The main route of luciferin administration is
by intraperitoneal injection, however intranasal delivery has been
recently described as a more efficient route for the monitoring of
bioluminescence in the lungs, while using 30 times less luciferin
[65]. We have found that a good signal is obtained using
intranasal luciferin, although a stronger signal can be achieved
using intraperitoneal luciferin which would also have the
advantage of allowing detection of signal in other locations
besides the lungs.
Surprisingly, the signal from Gluc-producing M. smegmatis in
mice could not be distinguished from the strong background
produced by the coelenterazine substrate alone. These results were
unexpected considering that published work with eukaryotic cells
states that the Gluc signal is 1000 times stronger than that of FFluc
in cell culture, and as bright as FFluc in vivo, with no background
detected in vivo even using a 20-fold higher concentration of
coelenterazine [9]. Gluc is naturally secreted from eukaryotic cells
and this has been used to quantify the number of Gluc-producing
cells in murine blood samples [66]. Although we have proved that
Gluc is also secreted from M. smegmatis, we have been unable to
detect it in blood samples taken from infected mice thus far (data
not shown). Overall these results preclude Gluc as a reporter for
either in vivo imaging of mycobacteria or ex vivo monitoring of
infected organs.
The results presented here represent an important step towards
the use of bioluminescence for the non-invasive study of
mycobacteria infection in vivo. In fact, the use of FFluc, or the
whole lux operon would represent a major advantage compared,
for example, to the use of just luxAB. There are, however, some
issues that should be considered and further investigated. First, the
minimal number of bacteria capable of being detected within the
lungs is expected to be quite high, especially when compared to
the inocula that are normally used in experimental M. tuberculosis
infections. Although this could limit the use of BLI studies for the
initial stages of the infection, it would not pose a problem in more
advanced phases of the infection and would still represent an
important improvement in drug or vaccine efficacy testing.
Secondly, luciferin accessibility to the bacteria contained in
granulomatous lesions could affect the signal obtained and has
to be further investigated. To that end, preliminary results have
shown that luminescence can be detected during infection of
macrophage in vitro thus proving the permeability of macrophages
to luciferin (unpublished data). Finally, the signal obtained is also
affected by the metabolic state of the bacteria since the luciferase
reaction relies on bacterial metabolites, mainly ATP and FMNH2
for FFluc and Lux respectively. This is exemplified by the decrease
in the luminescence observed when M. smegmatis enters the
stationary phase and has also been previously described for other
bacteria [67,68,69,70,71]. Although this could represent a
Figure 11. Kinetics of FFluc activity in M. smegmatis infected mice after intranasal administration of luciferin. Mice were endotracheallyinoculated with 6.66106 CFU of M. smegmatis pMV306hsp+FFlucWT [two representative mice (M1 and M2) out of four are shown] or with6.86106 CFU of M. smegmatis pMV306hsp as a control (one representative mouse out of two is shown). 20 ml of 15 mg ml21 or 30mg ml21 luciferinintranasal was administered 24 h post-inoculation and mice were imaged 0, 5, 10, 15, 30, 60, 120 and 180 min after. (a) Images were obtained usingan IVIS Spectrum and are displayed as pseudocolour images of peak bioluminescence (given as photons s21 cm22 sr21). Red represents the mostintense light emission while blue correspond to the weakest signal. The colour bar indicates relative signal intensity. Mice were imaged with anintegration time of 30 s. Three representative time points are shown. (b) Signal intensity (given as photons s21) in the lungs was quantified for eachtime point using the region of interest tool in the Living Image software program.doi:10.1371/journal.pone.0010777.g011
Bioluminescent Mycobacteria
PLoS ONE | www.plosone.org 10 May 2010 | Volume 5 | Issue 5 | e10777
handicap for the study of, for example, dormant M. tuberculosis it
could be a powerful tool to gain insights into the metabolic state of
M. tuberculosis during infection, to study entrance into dormancy, as
well as for the rapid detection of drugs acting on bacterial
metabolism.
Materials and Methods
Bacterial strains and growth conditionsM. smegmatis mc2155 [72], M. tuberculosis H37Rv and Escherichia
coli NEB-10b (New England Biolabs UK Ltd) were used in this
work. M. smegmatis and M. tuberculosis were grown on Middlebrook
7H11 agar medium (BD Diagnostics) supplemented with 0.5%
glycerol and 10% oleic acid albumin-dextrose-catalase (OADC)
(BD Diagnostics). When required, filter-sterilised luciferin was
added at a final concentration of 0.157 mM. Liquid cultures of M.
smegmatis and M. tuberculosis were grown either in Middlebrook
7H9 broth (BD Diagnostics) containing 0.05% Tween 80 (Sigma)
and 10% albumin-dextrose-catalase (ADC) enrichment (BD
Diagnostics), or (for M. smegmatis Gluc assays) in Luria-Bertani
(LB) medium with 0.05% Tween. LB medium was preferred for
the Gluc assays because the background of coelenterazine was 100
times lower in that medium than in 7H9 broth. LB medium was
used for culturing E. coli. All the strains were grown at 37uC. The
following antibiotics were added when appropriate: ampicillin
[100 mg ml21 (Sigma)], hygromycin B [150 mg ml21 (Invitrogen)]
and kanamycin [25 mg ml21, for mycobacteria, 50 mg ml21 for E.
coli (Sigma)].
Figure 12. BLI of gluc-expressing M. smegmatis. Mice were endotracheally inoculated with 3.326106 CFU of M. smegmatis pMV306hsp+Gluc[two representative mice (M1 and M2) out of three are shown,) or with 1.586107 CFU of M. smegmatis pMV306hsp as a control (one out of two miceis shown). 10 mg of coelenterazine intranasal was administered 24 h post-inoculation and mice were imaged at time points 0, 5, 10, 15, 30, 60, 120and 180 min. (a) Images were obtained using an IVIS Spectrum and are displayed as pseudocolour images of peak bioluminescence (given asphotons s21 cm22 sr21), with variations in colour representing light intensity at a given location. Integration time was 5 min. (b) Bioluminescence(given as photons s21) was quantified using the Living image software. (C) 10 mg of coelenterazine was given intraperitoneally to the same mice 5 hpost-intranasal coelenterazine. Mice were imaged 0, 5, 10, 15, 20, 25 and 30 min post-intraperitoneal coelenterazine with integration times of 3 min.doi:10.1371/journal.pone.0010777.g012
Bioluminescent Mycobacteria
PLoS ONE | www.plosone.org 11 May 2010 | Volume 5 | Issue 5 | e10777

Construction of bioluminescent reporter plasmids andstrains
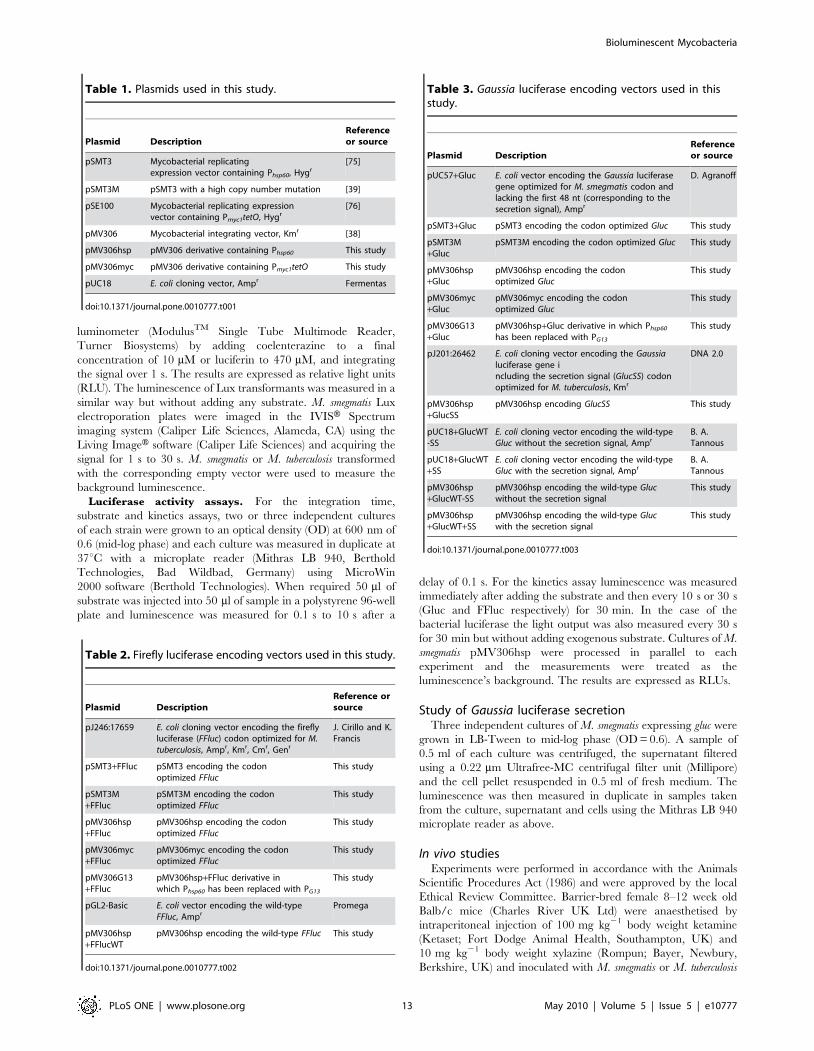
The plasmids used in this study are described in Tables 1–4.
The integrating expression vectors pMV306hsp and pMV306myc
were constructed by cloning into pMV306 the promoters Phsp60
and Pmyc1tetO obtained as NotI-HindIII and XbaI-SalI fragments
from pSMT3 and pSE100 respectively. All reporter genes, except
for the lux operon, were PCR amplified using the primers and
templates listed in Table 5. These primers contained an optimised
Shine-Dalgarno sequence (Mega SD) [45] and/or restriction sites
as indicated. The sequence of the PCR products was confirmed by
DNA sequencing. The M. smegmatis optimised gluc gene was cloned
into pSMT3 and pSMT3M as a BamHI-HindIII fragment and
into pMV306myc as an EcoRI-SalI fragment. For cloning the
wild-type and optimised gluc genes into pMV306hsp the PCR
products were digested with EcoRI-SalI. Plasmids containing the
M. tuberculosis optimised ffluc gene were made in a similar way but
cloning the EcoRI-XbaI PCR product into pUC18 first to use the
restriction sites of this vector’s MCS. The wild-type ffluc was
cloned into pMV306hsp as a HindIII-SalI insert. Plasmids
pMV306hsp+Lux, pSMT3+Lux and pSMT3M+Lux were created
by cloning a 5.7-kb EcoRI-PstI blunted fragment (containing the
whole lux operon) from pSB2025 into the respective expression
vector. Deletion of a 0.4 kb NotI-EcoRI fragment (containing
Phsp60) from pMV306hsp+Lux and insertion of Pmyc1tetO from
pMV306myc produced pMV306myc+Lux. In a similar way, the
reporter plasmids containing the G13 promoter were made
replacing the Phsp60 of the corresponding reporter vector with
PG13 by digestion with NotI-EcoRI. pMVhsp+LuxAB+G13+CDE
was obtained by cloning the KpnI PG13 PCR fragment into
pMVhsp+Lux in front of luxC. Finally, luxCDABE from pMU1*
was cloned into pMV306hsp as a 5.7-kb EcoRI PCR fragment.
Reporter strains were obtained by electroporation of reporter
plasmids into M. smegmatis mc2155 or M. tuberculosis H37Rv as
previously described [73]. Each strain was named according to the
plasmid it contained. The strains transformed with an integrating
vector were checked by PCR with primers amplifying the
corresponding promoter and reporter gene; whereas recombinant
strains with replicating vectors were confirmed by recovering the
plasmid after transformation into E. coli.
Bioluminescence assaysLuciferases substrates. Coelenterazine (Gold BioTech-
nologyH, Inc., St. Louis, Mo., USA), the substrate for Gluc, was
reconstituted in acid methanol to a concentration of 10 mM
(4.238 mg ml21). The substrate for FFluc, D-luciferin (Gold
BioTechnologyH), was prepared in distilled water at 94 mM
(30 mg ml21). All stocks were stored at 220uC and diluted in
broth media or D-PBS (without calcium or magnesium)
immediately before use. Working solutions were kept on ice in
the dark during preparation.
Screening of transformants. After electroporation, 10
randomly selected transformants were grown in broth media.
Luminescence was then measured at room temperature on a tube
Figure 13. BLI of lux-expressing M. smegmatis. Mice wereinoculated endotracheally with M. smegmatis pMV306hsp+Lux-AB+G13+CDE [7.96106 CFU, two mice (M1 and M2) out of four areshown] or M. smegmatis pMV306hsp (6.86106 CFU, control) andimaged 24 h post-inoculation. Images were obtained using an IVISSpectrum and are displayed as pseudocolour images of peakbioluminescence (given as photons s21 cm22 sr21), with variations incolour representing light intensity at a given location. Mice wereimaged with an integration time of 5 min.doi:10.1371/journal.pone.0010777.g013
Figure 14. BLI of ffluc-expressing M. tuberculosis. Mice were inoculated endotracheally with 56106 CFU of either wild-type M. tuberculosis(control) or FFluc-producing M. tuberculosis. 20 ml of 30 mg ml21 luciferin was administered intranasally and mice were imaged 5–10 min after. Micewere contained in a large air-tight box for safety considerations. The image was obtained using an IVIS Spectrum and is displayed as a pseudocolourimage of peak bioluminescence (given as photons s21 cm22 sr21). Red represents the most intense light emission while blue correspond to theweakest signal. The colour bar indicates relative signal intensity. Mice were imaged with an integration time of 1 min.doi:10.1371/journal.pone.0010777.g014
Bioluminescent Mycobacteria
PLoS ONE | www.plosone.org 12 May 2010 | Volume 5 | Issue 5 | e10777
luminometer (ModulusTM Single Tube Multimode Reader,
Turner Biosystems) by adding coelenterazine to a final
concentration of 10 mM or luciferin to 470 mM, and integrating
the signal over 1 s. The results are expressed as relative light units
(RLU). The luminescence of Lux transformants was measured in a
similar way but without adding any substrate. M. smegmatis Lux
electroporation plates were imaged in the IVISH Spectrum
imaging system (Caliper Life Sciences, Alameda, CA) using the
Living ImageH software (Caliper Life Sciences) and acquiring the
signal for 1 s to 30 s. M. smegmatis or M. tuberculosis transformed
with the corresponding empty vector were used to measure the
background luminescence.
Luciferase activity assays. For the integration time,
substrate and kinetics assays, two or three independent cultures
of each strain were grown to an optical density (OD) at 600 nm of
0.6 (mid-log phase) and each culture was measured in duplicate at
37uC with a microplate reader (Mithras LB 940, Berthold
Technologies, Bad Wildbad, Germany) using MicroWin
2000 software (Berthold Technologies). When required 50 ml of
substrate was injected into 50 ml of sample in a polystyrene 96-well
plate and luminescence was measured for 0.1 s to 10 s after a
delay of 0.1 s. For the kinetics assay luminescence was measured
immediately after adding the substrate and then every 10 s or 30 s
(Gluc and FFluc respectively) for 30 min. In the case of the
bacterial luciferase the light output was also measured every 30 s
for 30 min but without adding exogenous substrate. Cultures of M.
smegmatis pMV306hsp were processed in parallel to each
experiment and the measurements were treated as the
luminescence’s background. The results are expressed as RLUs.
Study of Gaussia luciferase secretionThree independent cultures of M. smegmatis expressing gluc were
grown in LB-Tween to mid-log phase (OD = 0.6). A sample of
0.5 ml of each culture was centrifuged, the supernatant filtered
using a 0.22 mm Ultrafree-MC centrifugal filter unit (Millipore)
and the cell pellet resuspended in 0.5 ml of fresh medium. The
luminescence was then measured in duplicate in samples taken
from the culture, supernatant and cells using the Mithras LB 940
microplate reader as above.
In vivo studiesExperiments were performed in accordance with the Animals
Scientific Procedures Act (1986) and were approved by the local
Ethical Review Committee. Barrier-bred female 8–12 week old
Balb/c mice (Charles River UK Ltd) were anaesthetised by
intraperitoneal injection of 100 mg kg21 body weight ketamine
(Ketaset; Fort Dodge Animal Health, Southampton, UK) and
10 mg kg21 body weight xylazine (Rompun; Bayer, Newbury,
Berkshire, UK) and inoculated with M. smegmatis or M. tuberculosis
Table 1. Plasmids used in this study.
Plasmid DescriptionReferenceor source
pSMT3 Mycobacterial replicatingexpression vector containing Phsp60, Hygr
[75]
pSMT3M pSMT3 with a high copy number mutation [39]
pSE100 Mycobacterial replicating expressionvector containing Pmyc1tetO, Hygr
[76]
pMV306 Mycobacterial integrating vector, Kmr [38]
pMV306hsp pMV306 derivative containing Phsp60 This study
pMV306myc pMV306 derivative containing Pmyc1tetO This study
pUC18 E. coli cloning vector, Ampr Fermentas
doi:10.1371/journal.pone.0010777.t001
Table 2. Firefly luciferase encoding vectors used in this study.
Plasmid DescriptionReference orsource
pJ246:17659 E. coli cloning vector encoding the fireflyluciferase (FFluc) codon optimized for M.tuberculosis, Ampr, Kmr, Cmr, Genr
J. Cirillo and K.Francis
pSMT3+FFluc pSMT3 encoding the codonoptimized FFluc
This study
pSMT3M+FFluc
pSMT3M encoding the codonoptimized FFluc
This study
pMV306hsp+FFluc
pMV306hsp encoding the codonoptimized FFluc
This study
pMV306myc+FFluc
pMV306myc encoding the codonoptimized FFluc
This study
pMV306G13+FFluc
pMV306hsp+FFluc derivative inwhich Phsp60 has been replaced with PG13
This study
pGL2-Basic E. coli vector encoding the wild-typeFFluc, Ampr
Promega
pMV306hsp+FFlucWT
pMV306hsp encoding the wild-type FFluc This study
doi:10.1371/journal.pone.0010777.t002
Table 3. Gaussia luciferase encoding vectors used in thisstudy.
Plasmid DescriptionReferenceor source
pUC57+Gluc E. coli vector encoding the Gaussia luciferasegene optimized for M. smegmatis codon andlacking the first 48 nt (corresponding to thesecretion signal), Ampr
D. Agranoff
pSMT3+Gluc pSMT3 encoding the codon optimized Gluc This study
pSMT3M+Gluc
pSMT3M encoding the codon optimized Gluc This study
pMV306hsp+Gluc
pMV306hsp encoding the codonoptimized Gluc
This study
pMV306myc+Gluc
pMV306myc encoding the codonoptimized Gluc
This study
pMV306G13+Gluc
pMV306hsp+Gluc derivative in which Phsp60
has been replaced with PG13
This study
pJ201:26462 E. coli cloning vector encoding the Gaussialuciferase gene including the secretion signal (GlucSS) codonoptimized for M. tuberculosis, Kmr
DNA 2.0
pMV306hsp+GlucSS
pMV306hsp encoding GlucSS This study
pUC18+GlucWT-SS
E. coli cloning vector encoding the wild-typeGluc without the secretion signal, Ampr
B. A.Tannous
pUC18+GlucWT+SS
E. coli cloning vector encoding the wild-typeGluc with the secretion signal, Ampr
B. A.Tannous
pMV306hsp+GlucWT-SS
pMV306hsp encoding the wild-type Glucwithout the secretion signal
This study
pMV306hsp+GlucWT+SS
pMV306hsp encoding the wild-type Glucwith the secretion signal
This study
doi:10.1371/journal.pone.0010777.t003
Bioluminescent Mycobacteria
PLoS ONE | www.plosone.org 13 May 2010 | Volume 5 | Issue 5 | e10777

by endotracheal aerosol application of a total volume of 25 ml
using a MicrosprayerH (PennCentury, Philadelphia, PA, USA) as
previously described [74].
Assessment of bioluminescence (photons s21cm22 steridian
[sr]21) from living animals was performed using an IVISHSpectrum system (Caliper Life Sciences, Alameda, USA) which
consists of a cooled charge-coupled device camera mounted on a
light-tight specimen chamber. Prior to bioluminescent imaging,
mice were anaesthetised with 4% isoflurane. Luciferin dissolved in
sterile D-PBS was then administered to animals inoculated with
FFluc expressing strains [20 ml of 15 mg ml21 (47 mM) or 30 mg
ml21 (94 mM) luciferin via the intranasal route, or 300 mg kg21 or
500 mg kg21 body weight by intraperitoneal injection]. To image
mice infected with Gluc expressing M. smegmatis 50 ml of 0.48 mM
or 0.96 mM coelenterazine (prepared by diluting the 10 mM stock
in sterile D-PBS just before use) was intranasally administered (10
or 20 mg per mouse respectively), or 150 ml of 0.16 mM
coelenterazine via the intraperitoneal route (10 mg). Mice were
placed into the camera chamber of the IVISH Spectrum imaging
system where a controlled flow of 2.5% isoflurane in air was
administered through a nose cone via the IXG8 gas anaesthesia
system (Caliper Life Sciences). A grayscale reference image was
taken under low illumination prior to quantification of emitted
photons over 30 s to 5 min, depending on signal intensity, using
the software program Living Image (Caliper Life Sciences) as an
overlay on Igor (Wavemetrics, Seattle, WA). For anatomical
localisation, a pseudocolour image representing light intensity
(blue, least intense to red, most intense) was generated using the
Living Image software and superimposed over the grayscale
reference image. Bioluminescence within specific regions of
individual mice was also quantified using the region of interest
(ROI) tool in the Living Image software program (given as photons
s21). Animals were imaged immediately after inoculation, to assess
the success of the delivery, and 24 h post-infection. Animals
inoculated with ffluc- or gluc- expressing M. smegmatis were imaged
at different time points after substrate administration for up to 3 h.
Table 4. Bacterial luciferase encoding vectors used in this study.
Plasmid Description Reference or source
pSB2025 E. coli vector containing the LuxABCDE operon from P. luminescensmodified for expression in Gram positive bacteria, Ampr
[41]
pSMT3+Lux pSMT3 encoding LuxABCDE This study
pSMT3M+Lux pSMT3M encoding LuxABCDE This study
pMV306hsp+Lux pMV306hsp encoding LuxABCDE This study
pMV306myc+Lux pMV306myc encoding LuxABCDE This study
pMV306G13+Lux pMV306hsp+LuxABCDE derivative in which Phsp60 has been replaced with PG13 This study
pMV306hsp+LuxAB+G13+CDE pMV306hsp+LuxABCDE derivative with PG13 cloned in front of luxC This study
pMU1* Improved pMU1 (which has a promoterless luxCDABE optimized forhigh-GC [46]) with a corrected mutation in luxD
A. Craney & J. Nodwell
doi:10.1371/journal.pone.0010777.t004
Table 5. Primers used in this study.
Target Primera Template
FFluc 59-CCGAGGAATTCGGATCCAGAAGGAGAAGTACCGATG GAAGATGCGAAGAAC-39 pJ246:17659
59-AGGCTTCTAGAGTCACTTGCCTCCTTTCTTCGC-39
FFlucWT 59-AAGCTTAGAAGGAGAAGTACCGATGGAAGACGCCAA AAAC-39 pGL2-Basic
59-GTCGACTTACTTTCCGCCCTTCTTGGC-39
Gluc 59-CCGAGGAATTCGGATCCAGAAGGAGAAGTACCGATG AAGCCGACCGAGAAC-39 pUC57+Gluc
59-TTATATAAGCTTGTCGACTCAGTCGCCGCCGGCGCC-39
GlucWT-SS 59-CCGAGGAATTCGGATCCAGAAGGAGAAGTACCGATG AAACCAACTGAAAAC-39 pUC18+GlucWT-SS
59-GTCGACAAGCTTTTAATCACCACCGGCACCCTTTAT-39
GlucWT+SS 59-CCGAGGAATTCGGATCCAGAAGGAGAAGTACCGAT GGGAGTGAAAGTTCTTTTTG-39 pUC18+GlucWT+SS
59-GTCGACAAGCTTTTAATCACCACCGGCACCCTTTAT-39
PG13 59-GCGGCCGCGATCGCCACTAGCGCCGCGGT-39 M. marinum
59-GAATTCTCGGTTACCAAGCGTGCATTT-39
59-GGTACCGATCGCCACTAGCGCCGCGGT-39
59-GGTACCTCGGTTACCAAGCGTGCATTT-39
LuxStm 59-CCGAGAATTCCAGATCTGACTGAGTGACCAAAG-39 pMU1*
59-TGACGAATTCTCAGCTGTTGAACGCCTGGTT-39
aIn italics, sequence added to include restriction sites (underlined) for cloning procedures, and optimized Shine-Dalgarno sequence (in bold) [45].doi:10.1371/journal.pone.0010777.t005
Bioluminescent Mycobacteria
PLoS ONE | www.plosone.org 14 May 2010 | Volume 5 | Issue 5 | e10777

Statistical analysisStatistical analyses were performed using GraphPad Prism 5.02
(GraphPad Software, San Diego, USA). Normality of data was
tested by use of the D’Agostino & Pearson omnibus normality test.
According to this, differences in reporter constructs activity were
assessed by use of the non-parametric Kruskal-Wallis test for
comparisons of groups of three. If the Kruskal–Wallis test was
statistically significant, then a Dunn’s multiple comparison test was
employed. For groups in pairs the non-parametric Mann-Whitney
test, or the t test for normal data, were used.
Acknowledgments
We would like to thank Phil Hill (University of Nottingham) for plasmid
pSB2025; Bakhos A. Tannous (Harvard Medical School, Boston,
Massachusetts) for plasmids pUC18 containing the wild-type gluc with
and without secretion sequence; Jeff Cirillo (Texas A&M) and Kevin
Francis (Caliper Life Sciences) for plasmid pJ246:17659 containing
Mycobacterium codon-optimised FFluc; Arryn Craney and Justin Nodwell
(Biochemistry & Biomedical Sciences, McMaster University, Ontario,
Canada) for providing plasmid pMU1*; Paul Carroll (Queen Mary
University of London, Barts and the London School of Medicine and
Dentistry) for kindly supplying pSMT3M; and Dan Agranoff (Department
of Infectious Diseases & Immunity, Imperial College London) for plasmid
pUC57+Gluc containing Mycobacterium codon-optimised Gluc. We would
also like to thank Vivek Rao, Paul Carroll, Lise J. Schreuder and Dimitris
Kioussis for helpful discussions. We especially thank Cesar Sanchez for
critically reviewing the manuscript and helpful suggestions.
Author Contributions
Conceived and designed the experiments: NA THW JR TP GJB UES
BDR SW. Performed the experiments: NA AZ TF PE SW. Analyzed the
data: NA SW. Wrote the paper: NA BDR SW.
References
1. WHO (2009) Global tuberculosis control 2009. Epidemiology, strategy,
financing: WHO Press. 303 p.
2. Hutchens M, Luker GD (2007) Applications of bioluminescence imaging to the
study of infectious diseases. Cell Microbiol 9: 2315–2322.
3. Wright JS, 3rd, Jin R, Novick RP (2005) Transient interference with
staphylococcal quorum sensing blocks abscess formation. Proc Natl Acad
Sci U S A 102: 1691–1696.
4. Lane MC, Alteri CJ, Smith SN, Mobley HL (2007) Expression of flagella is
coincident with uropathogenic Escherichia coli ascension to the upper urinary
tract. Proc Natl Acad Sci U S A 104: 16669–16674.
5. Steinhuber A, Landmann R, Goerke C, Wolz C, Fluckiger U (2008)
Bioluminescence imaging to study the promoter activity of hla of Staphylococcus
aureus in vitro and in vivo. Int J Med Microbiol 298: 599–605.
6. Xiong YQ, Willard J, Kadurugamuwa JL, Yu J, Francis KP, et al. (2005) Real-
time in vivo bioluminescent imaging for evaluating the efficacy of antibiotics in a
rat Staphylococcus aureus endocarditis model. Antimicrob Agents Chemother 49:
380–387.
7. Kadurugamuwa JL, Modi K, Yu J, Francis KP, Orihuela C, et al. (2005)
Noninvasive monitoring of pneumococcal meningitis and evaluation of
treatment efficacy in an experimental mouse model. Mol Imaging 4: 137–142.
8. Gheysens O, Mottaghy FM (2009) Method of bioluminescence imaging for
molecular imaging of physiological and pathological processes. Methods 48:
139–145.
9. Tannous BA, Kim DE, Fernandez JL, Weissleder R, Breakefield XO (2005)
Codon-optimized Gaussia luciferase cDNA for mammalian gene expression in
culture and in vivo. Mol Ther 11: 435–443.
10. Wiles S, Ferguson K, Stefanidou M, Young DB, Robertson BD (2005)
Alternative luciferase for monitoring bacterial cells under adverse conditions.
Appl Environ Microbiol 71: 3427–3432.
11. Prioli RP, Tanna A, Brown IN (1985) Rapid methods for counting
mycobacteria–comparison of methods for extraction of mycobacterial adenosine
triphosphate (ATP) determined by firefly luciferase assay. Tubercle 66: 99–108.
12. Janaszek W, Aleksandrowicz J, Sitkiewicz D (1987) The use of the firefly
bioluminescent reaction for the rapid detection and counting of mycobacterium
BCG. J Biol Stand 15: 11–16.
13. Andrew PW, Roberts IS (1993) Construction of a bioluminescent mycobacte-
rium and its use for assay of antimycobacterial agents. J Clin Microbiol 31:
2251–2254.
14. Cooksey RC, Crawford JT, Jacobs WR, Jr., Shinnick TM (1993) A rapid
method for screening antimicrobial agents for activities against a strain of
Mycobacterium tuberculosis expressing firefly luciferase. Antimicrob Agents Che-
mother 37: 1348–1352.
15. Cooksey RC, Morlock GP, Beggs M, Crawford JT (1995) Bioluminescence
method to evaluate antimicrobial agents against Mycobacterium avium. Antimicrob
Agents Chemother 39: 754–756.
16. Arain TM, Resconi AE, Hickey MJ, Stover CK (1996) Bioluminescence
screening in vitro (Bio-Siv) assays for high-volume antimycobacterial drug
discovery. Antimicrob Agents Chemother 40: 1536–1541.
17. Gordon S, Chung G, Andrew P (1998) The application of bacterial luciferase as
a reporter gene in mycobacteria. Methods Mol Biol 101: 235–243.
18. Deb DK, Srivastava KK, Srivastava R, Srivastava BS (2000) Bioluminescent
Mycobacterium aurum expressing firefly luciferase for rapid and high throughput
screening of antimycobacterial drugs in vitro and in infected macrophages.
Biochem Biophys Res Commun 279: 457–461.
19. Shawar RM, Humble DJ, Van Dalfsen JM, Stover CK, Hickey MJ, et al. (1997)
Rapid screening of natural products for antimycobacterial activity by using
luciferase-expressing strains of Mycobacterium bovis BCG and Mycobacterium
intracellulare. Antimicrob Agents Chemother 41: 570–574.
20. Jacobs WR, Jr., Barletta RG, Udani R, Chan J, Kalkut G, et al. (1993) Rapid
assessment of drug susceptibilities of Mycobacterium tuberculosis by means of
luciferase reporter phages. Science 260: 819–822.
21. Carriere C, Riska PF, Zimhony O, Kriakov J, Bardarov S, et al. (1997)
Conditionally replicating luciferase reporter phages: improved sensitivity for
rapid detection and assessment of drug susceptibility of Mycobacterium tuberculosis.
J Clin Microbiol 35: 3232–3239.
22. Riska PF, Jacobs WR, Jr., Bloom BR, McKitrick J, Chan J (1997) Specific
identification of Mycobacterium tuberculosis with the luciferase reporter mycobac-
teriophage: use of p-nitro-alpha-acetylamino-beta-hydroxy propiophenone.
J Clin Microbiol 35: 3225–3231.
23. Riska PF, Jacobs WR, Jr. (1998) The use of luciferase-reporter phage for
antibiotic-susceptibility testing of mycobacteria. Methods Mol Biol 101:
431–455.
24. Banaiee N, Bobadilla-Del-Valle M, Bardarov S, Jr., Riska PF, Small PM, et al.
(2001) Luciferase reporter mycobacteriophages for detection, identification, and
antibiotic susceptibility testing of Mycobacterium tuberculosis in Mexico. J Clin
Microbiol 39: 3883–3888.
25. Bardarov S, Jr., Dou H, Eisenach K, Banaiee N, Ya S, et al. (2003) Detection
and drug-susceptibility testing of M. tuberculosis from sputum samples using
luciferase reporter phage: comparison with the Mycobacteria Growth Indicator
Tube (MGIT) system. Diagn Microbiol Infect Dis 45: 53–61.
26. Pai M, Kalantri S, Pascopella L, Riley LW, Reingold AL (2005) Bacteriophage-
based assays for the rapid detection of rifampicin resistance in Mycobacterium
tuberculosis: a meta-analysis. J Infect 51: 175–187.
27. Banaiee N, January V, Barthus C, Lambrick M, Roditi D, et al. (2008)
Evaluation of a semi-automated reporter phage assay for susceptibility testing of
Mycobacterium tuberculosis isolates in South Africa. Tuberculosis (Edinb) 88: 64–68.
28. Arain TM, Resconi AE, Singh DC, Stover CK (1996) Reporter gene technology
to assess activity of antimycobacterial agents in macrophages. Antimicrob Agents
Chemother 40: 1542–1544.
29. Hickey MJ, Arain TM, Shawar RM, Humble DJ, Langhorne MH, et al. (1996)
Luciferase in vivo expression technology: use of recombinant mycobacterial
reporter strains to evaluate antimycobacterial activity in mice. Antimicrob
Agents Chemother 40: 400–407.
30. Bonay M, Bouchonnet F, Pelicic V, Lagier B, Grandsaigne M, et al. (1999)
Effect of stimulation of human macrophages on intracellular survival of
Mycobacterium bovis Bacillus Calmette-Guerin. Evaluation with a mycobacterial
reporter strain. Am J Respir Crit Care Med 159: 1629–1637.
31. Snewin VA, Gares MP, Gaora PO, Hasan Z, Brown IN, et al. (1999) Assessment
of immunity to mycobacterial infection with luciferase reporter constructs. Infect
Immun 67: 4586–4593.
32. Bouchonnet F, Boechat N, Bonay M, Hance AJ (2002) Alpha/beta interferon
impairs the ability of human macrophages to control growth of Mycobacterium
bovis BCG. Infect Immun 70: 3020–3025.
33. Turner DJ, Hoyle SL, Snewin VA, Gares MP, Brown IN, et al. (2002) An ex vivo
culture model for screening drug activity against in vivo phenotypes of
Mycobacterium tuberculosis. Microbiology 148: 2929–2936.
34. Kampmann B, Tena GN, Mzazi S, Eley B, Young DB, et al. (2004) Novel
human in vitro system for evaluating antimycobacterial vaccines. Infect Immun
72: 6401–6407.
35. Al-Attiyah R, El-Shazly A, Mustafa AS (2006) Assessment of in vitro immunity to
Mycobacterium tuberculosis in a human peripheral blood infection model using a
luciferase reporter construct of M. tuberculosis H37Rv. Clin Exp Immunol 145:
520–527.
36. Heuts F, Carow B, Wigzell H, Rottenberg ME (2009) Use of non-invasive
bioluminescent imaging to assess mycobacterial dissemination in mice, treatment
with bactericidal drugs and protective immunity. Micro Infect 11: 1114–1121.
Bioluminescent Mycobacteria
PLoS ONE | www.plosone.org 15 May 2010 | Volume 5 | Issue 5 | e10777

37. Ranes MG, Rauzier J, Lagranderie M, Gheorghiu M, Gicquel B (1990)
Functional analysis of pAL5000, a plasmid from Mycobacterium fortuitum:
construction of a ‘‘mini’’ mycobacterium-Escherichia coli shuttle vector.J Bacteriol 172: 2793–2797.
38. Stover CK, de la Cruz VF, Fuerst TR, Burlein JE, Benson LA, et al. (1991) New
use of BCG for recombinant vaccines. Nature 351: 456–460.
39. Carroll P, Schreuder LJ, Muwanguzi-Karugaba J, Wiles S, Robertson BD, et al.
(2010) Sensitive Detection of Gene Expression in Mycobacteria under
Replicating and Non-Replicating Conditions Using Optimized Far-Red
Reporters. PLoS One 5: e9823. doi:10.1371/journal.pone.0009823.
40. Bourn WR, Jansen Y, Stutz H, Warren RM, Williamson AL, et al. (2007)
Creation and characterisation of a high-copy-number version of the pAL5000
mycobacterial replicon. Tuberculosis (Edinb) 87: 481–488.
41. Qazi SN, Counil E, Morrissey J, Rees CE, Cockayne A, et al. (2001) agr
expression precedes escape of internalized Staphylococcus aureus from the host
endosome. Infect Immun 69: 7074–7082.
42. Ehrt S, Guo XV, Hickey CM, Ryou M, Monteleone M, et al. (2005) Controllinggene expression in mycobacteria with anhydrotetracycline and Tet repressor.
Nucleic Acids Res 33: e21.
43. Barker LP, Porcella SF, Wyatt RG, Small PL (1999) The Mycobacterium marinum
G13 promoter is a strong sigma 70-like promoter that is expressed in Escherichia
coli and mycobacteria species. FEMS Microbiol Lett 175: 79–85.
44. Barker LP, Brooks DM, Small PL (1998) The identification of Mycobacterium
marinum genes differentially expressed in macrophage phagosomes usingpromoter fusions to green fluorescent protein. Mol Microbiol 29: 1167–1177.
45. Le Dantec C, Winter N, Gicquel B, Vincent V, Picardeau M (2001) Genomic
sequence and transcriptional analysis of a 23-kilobase mycobacterial linearplasmid: evidence for horizontal transfer and identification of plasmid
maintenance systems. J Bacteriol 183: 2157–2164.
46. Craney A, Hohenauer T, Xu Y, Navani NK, Li Y, et al. (2007) A synthetic
luxCDABE gene cluster optimized for expression in high-GC bacteria. NucleicAcids Res 35: e46.
47. Zhao H, Doyle TC, Wong RJ, Cao Y, Stevenson DK, et al. (2004)
Characterization of coelenterazine analogs for measurements of Renilla luciferaseactivity in live cells and living animals. Mol Imaging 3: 43–54.
48. Davis SL, Be NA, Lamichhane G, Nimmagadda S, Pomper MG, et al. (2009)
Bacterial thymidine kinase as a non-invasive imaging reporter for Mycobacterium
tuberculosis in live animals. PLoS ONE 4: e6297.
49. Hardy J, Francis KP, DeBoer M, Chu P, Gibbs K, et al. (2004) Extracellular
replication of Listeria monocytogenes in the murine gall bladder. Science 303:
851–853.
50. Kadurugamuwa JL, Modi K, Coquoz O, Rice B, Smith S, et al. (2005)
Reduction of astrogliosis by early treatment of pneumococcal meningitis
measured by simultaneous imaging, in vivo, of the pathogen and host response.Infect Immun 73: 7836–7843.
51. Wiles S, Pickard KM, Peng K, MacDonald TT, Frankel G (2006) In vivo
bioluminescence imaging of the murine pathogen Citrobacter rodentium. Infect
Immun 74: 5391–5396.
52. Glomski IJ, Piris-Gimenez A, Huerre M, Mock M, Goossens PL (2007) Primary
involvement of pharynx and peyer’s patch in inhalational and intestinal anthrax.
PLoS Pathog 3: e76.
53. Lane MC, Alteri CJ, Smith SN, Mobley HL (2007) Expression of flagella is
coincident with uropathogenic Escherichia coli ascension to the upper urinary
tract. Proc Natl Acad Sci U S A 104: 16669–16674.
54. Sjolinder H, Jonsson AB (2007) Imaging of disease dynamics during
meningococcal sepsis. PLoS ONE 2: e241.
55. Kong D, Kunimoto DY (1995) Secretion of human interleukin 2 by
recombinant Mycobacterium bovis BCG. Infect Immun 63: 799–803.
56. Mederle I, Bourguin I, Ensergueix D, Badell E, Moniz-Peireira J, et al. (2002)
Plasmidic versus insertional cloning of heterologous genes in Mycobacterium bovis
BCG: impact on in vivo antigen persistence and immune responses. InfectImmun 70: 303–314.
57. Kumar D, Srivastava BS, Srivastava R (1998) Genetic rearrangements leading to
disruption of heterologous gene expression in mycobacteria: an observation withEscherichia coli beta-galactosidase in Mycobacterium smegmatis and its implication in
vaccine development. Vaccine 16: 1212–1215.
58. Dennehy M, Bourn W, Steele D, Williamson AL (2007) Evaluation ofrecombinant BCG expressing rotavirus VP6 as an anti-rotavirus vaccine.
Vaccine 25: 3646–3657.59. Dennehy M, Williamson AL (2005) Factors influencing the immune response to
foreign antigen expressed in recombinant BCG vaccines. Vaccine 23:
1209–1224.60. Bastos RG, Dellagostin OA, Barletta RG, Doster AR, Nelson E, et al. (2002)
Construction and immunogenicity of recombinant Mycobacterium bovis BCGexpressing GP5 and M protein of porcine reproductive respiratory syndrome
virus. Vaccine 21: 21–29.61. da Cruz FW, McBride AJ, Conceicao FR, Dale JW, McFadden J, et al. (2001)
Expression of the B-cell and T-cell epitopes of the rabies virus nucleoprotein in
Mycobacterium bovis BCG and induction of an humoral response in mice. Vaccine20: 731–736.
62. Dellagostin OA, Esposito G, Eales LJ, Dale JW, McFadden J (1995) Activity ofmycobacterial promoters during intracellular and extracellular growth. Micro-
biology 141 (Pt 8): 1785–1792.
63. Wang H, Liu Q, Liu K, Zhong W, Gao S, et al. (2007) Immune responseinduced by recombinant Mycobacterium bovis BCG expressing ROP2 gene of
Toxoplasma gondii. Parasitol Int 56: 263–268.64. Szittner R, Jansen G, Thomas DY, Meighen E (2003) Bright stable luminescent
yeast using bacterial luciferase as a sensor. Biochem Biophys Res Commun 309:66–70.
65. Buckley SM, Howe SJ, Rahim AA, et al. (2008) Luciferin detection after
intranasal vector delivery is improved by intranasal rather than intraperitonealluciferin administration. Hum Gene Ther 19: 1050–1056.
66. Wurdinger T, Badr C, Pike L, de Kleine R, Weissleder R, et al. (2008) Asecreted luciferase for ex vivo monitoring of in vivo processes. Nat Methods 5:
171–173.
67. Loimaranta V, Tenovuo J, Koivisto L, Karp M (1998) Generation ofbioluminescent Streptococcus mutans and its usage in rapid analysis of the efficacy
of antimicrobial compounds. Antimicrob Agents Chemother 42: 1906–1910.68. Francis KP, Yu J, Bellinger-Kawahara C, et al. (2001) Visualizing pneumococcal
infections in the lungs of live mice using bioluminescent Streptococcus pneumoniae
transformed with a novel gram-positive lux transposon. Infect Immun 69:
3350–3358.
69. Koga K, Harada T, Shimizu H, Tanaka K (2005) Bacterial luciferase activityand the intracellular redox pool in Escherichia coli. Mol Genet Genomics 274:
180–188.70. Galluzzi L, Karp M (2007) Intracellular redox equilibrium and growth phase
affect the performance of luciferase-based biosensors. J Biotechnol 127:
188–198.71. Morin CE, Kaper JB (2009) Use of stabilized luciferase-expressing plasmids to
examine in vivo-induced promoters in the Vibrio cholerae vaccine strain CVD 103-HgR. FEMS Immunology & Medical Microbiology 57: 69–79.
72. Snapper SB, Melton RE, Mustafa S, Kieser T, Jacobs WR, Jr. (1990) Isolationand characterization of efficient plasmid transformation mutants of Mycobacterium
smegmatis. Mol Microbiol 4: 1911–1919.
73. Parish T, Stoker NG (1998) Electroporation of mycobacteria. Methods Mol Biol101: 129–144.
74. Bivas-Benita M, Zwier R, Junginger HE, Borchard G (2005) Non-invasivepulmonary aerosol delivery in mice by the endotracheal route. European Journal
of Pharmaceutics and Biopharmaceutics 61: 214–218.
75. Garbe TR, Barathi J, Barnini S, Zhang Y, Abou-Zeid C, et al. (1994)Transformation of mycobacterial species using hygromycin resistance as
selectable marker. Microbiology 140 (Pt 1): 133–138.76. Guo XV, Monteleone M, Klotzsche M, Kamionka A, Hillen W, et al. (2007)
Silencing Mycobacterium smegmatis by using tetracycline repressors. J Bacteriol 189:
4614–4623.
Bioluminescent Mycobacteria
PLoS ONE | www.plosone.org 16 May 2010 | Volume 5 | Issue 5 | e10777