andrew manthe, m.p.h., c.h.e.s. california department of public health mary c. marks, ph.d....
TRANSCRIPT

Andrew Manthe, M.P.H., C.H.E.S.California Department of Public Health
Mary C. Marks, Ph.D.California Department of Education
The Link Between Coordinated School Health
and Academic Success

Coordinated School Health (CSH) as a Model
• There is a gap in rigorous quantitative research linking CSH (as a complete model) with academic achievement.
• There is a demonstrated link between (individual) CSH components…and academic achievement.
Vinciullo and Bradley, 2009
CSH State Health Policies
Students in states with policies promoting students’ health enjoy higher:
Academic scores High school graduation rates
Vinciullo and Bradley, 2009

Nutrition Services
States that: A) prohibit junk food consumption; B) evaluate their nutrition; C) prohibit food as a reward; D) provide funding for staff training have:
Better academic performance
Higher test scores
Vinciullo and Bradley, 2009
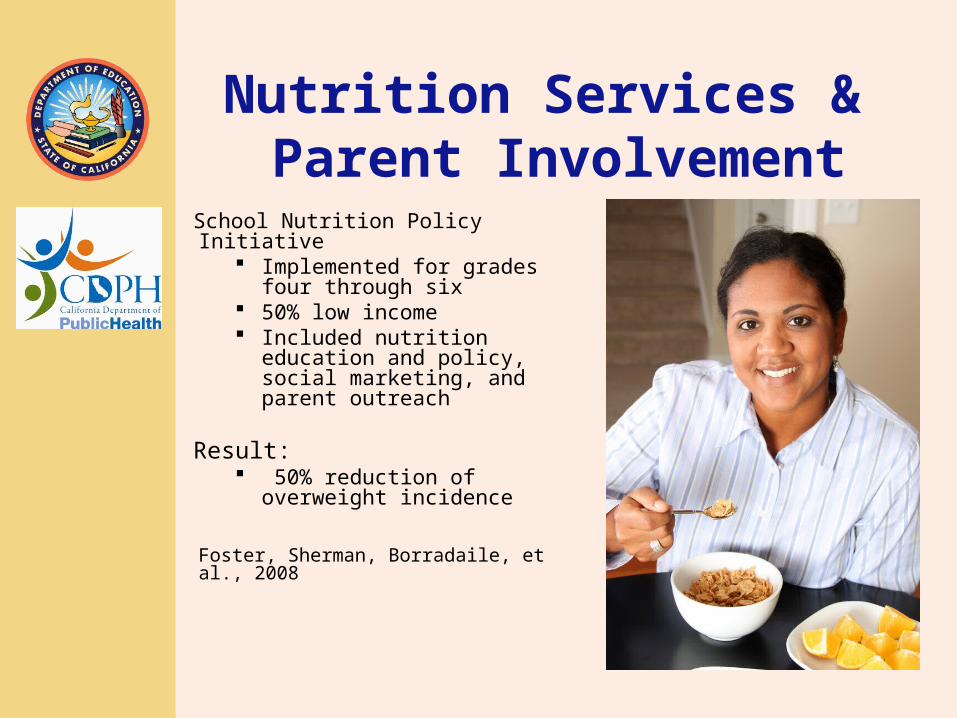
Nutrition Services & Parent Involvement
School Nutrition Policy Initiative Implemented for grades four
through six 50% low income Included nutrition education
and policy, social marketing, and parent outreach
Result: 50% reduction of overweight
incidence
Foster, Sherman, Borradaile, et al., 2008

Nutrition (School Breakfast Program)
Inner-city students (mostly African American) in grades one through eight who ate a school breakfast at least 80 percent of the time, had
Better math grades Less hyperactivity Better attendance – less
tardinessthan students who ate a school breakfast less than 80 percent of the time.
Murphy, Pagano, Nachmani, et al.,1998

Nutrition, Physical Activity & Tobacco
Healthy Maine Partnerships funded health coordinators and offered physical activity intramurals, improved nutrition education, and tobacco cessation.
Result:
Decreased soda consumption Higher physical activity Reduction in tobacco use
O’brien, Polacsek, MacDonald, et al., 2010

Health Services
States that provide health centers that serve as Medicaid providers to meet student health needs (including immunizations) enjoy:
– Greater academic achievement.
– Higher advanced placement program test scores
Vinciullo and Bradley, 2009
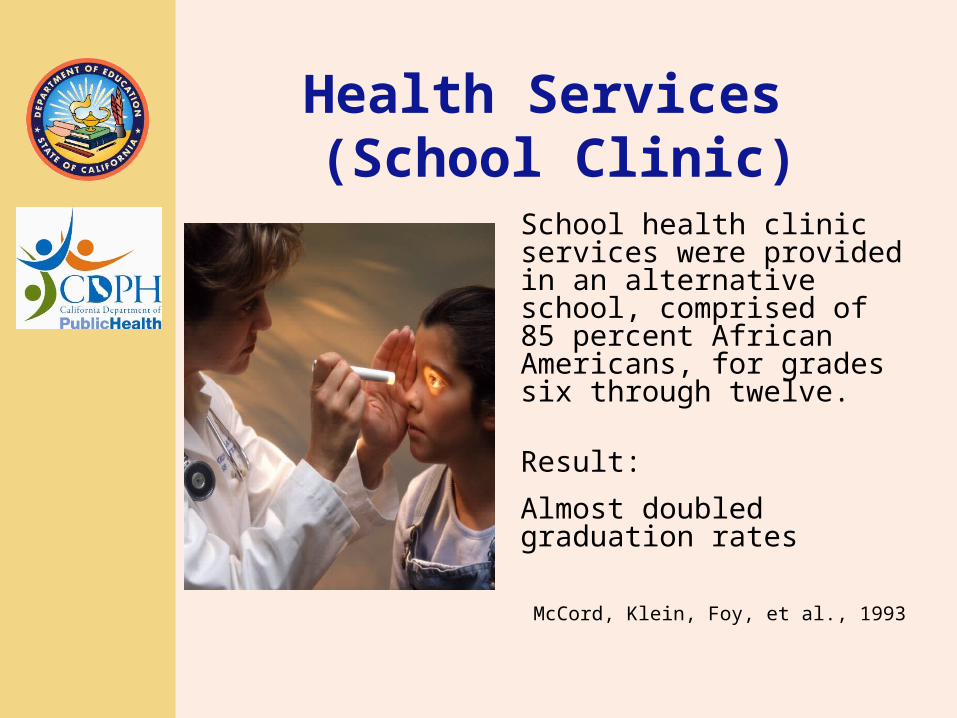
Health Services (School Clinic)
School health clinic services were provided in an alternative school, comprised of 85 percent African Americans, for grades six through twelve.
Result:
Almost doubled graduation rates
McCord, Klein, Foy, et al., 1993
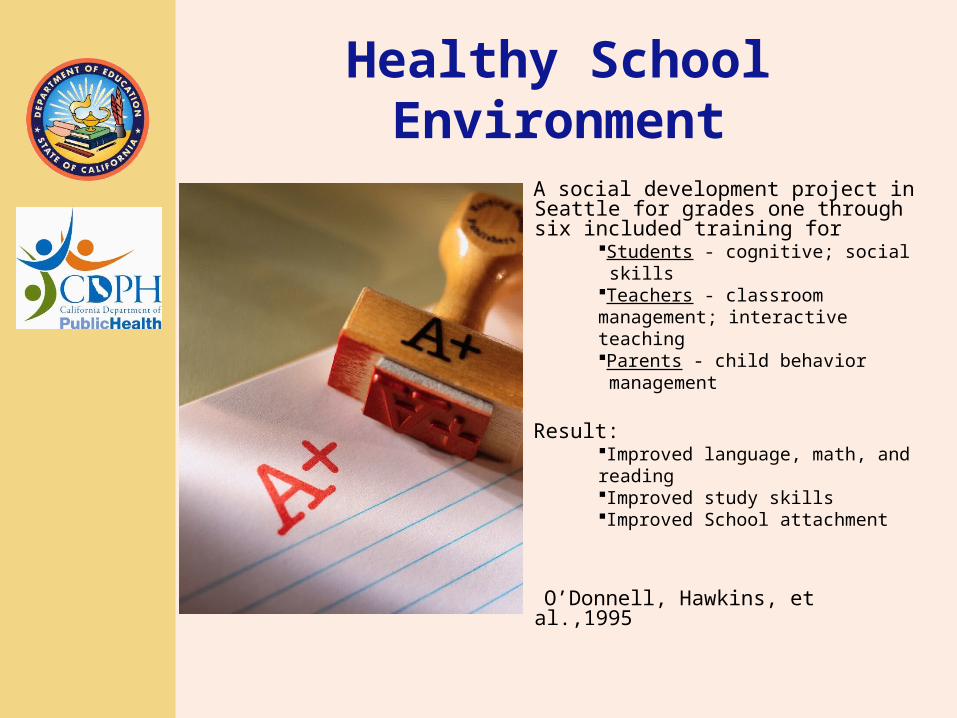
Healthy School Environment
A social development project in Seattle for grades one through six included training for
Students - cognitive; social skills Teachers - classroom management; interactiveteaching Parents - child behavior management
Result:Improved language, math, andreadingImproved study skillsImproved School attachment
O’Donnell, Hawkins, et al.,1995

Healthy School Environment
States with policies prohibiting harassment of students by fellow students and prevention of harassment at school were found to have
Higher test scores Lower dropout rates
than states that have not implemented such health-promoting policies.
Vinciullo and Bradley, 2009

School Environment
•A substantial body of researchexits to support use of good handwashing to reduce infectious diseases andimprove attendance at school.
•Payoff in time and resources isreduced student and staffillness.
Aiello, Coulborn, Perez, Larson 2008;Ejemot, Ehiri, Meremikwu, Critchley 2008; Meadows, LeSaux, 2004
Staff Health Promotion
A personalized lifestyle intervention for teachers including:
Health screening Health education Peer support Supportive health policies
Result: Staff improved health habits and
status. Note: Healthy staff serve as role
models for students!
Blair, Tritsch, Kutsch, et al., 1987
Staff Health Promotion• We did not find evidence to
associate staff health promotion with students’ academic achievement indicators
• However, numerous studies have demonstrated that employees who have poor health, or have family members in poor health, are more likely to miss work or have trouble concentrating at work.
Davis, Collins, Doty, Ho, Holmgren,2005; Blair, Tritsch,Kutsch,1987

Staff Health Promotion
• Worksite wellness programs have been shown to decrease absenteeism and improve productivity.
• The evidence that healthier worksites create healthier, more productive employees can be extended to suggest that healthier schools may create healthier, more successful students.
Harris, Lichiello, Hannon 2009; Goetzel, Ozminkowski 2008

Health Education
States that teach health-related topics at the high school level:
Improve academics Increase advanced
placement performance Have higher graduation
rates
Vinciullo, and Bradley, 2009
Health Education
States that taught health related topics at high school level and had someone oversee health education at individual school sites had students who:
Scored higher on advanced placement
Performed better academically
Were more likely to complete high school
Vinciullo and Bradley, 2009

Health Education
Simply providing health information to students is less likely to result in healthier choices and behaviors than delivering more comprehensive interventions.
Students receiving education on healthy food choices, who emerge from the classroom to be surrounded by options like soda, pizza, candy, and chips, are less likely to eat healthfully.
The impact of tobacco prevention education may be lessened if smoking is tolerated just off campus.

Health Education and Family Involvement
The addition of an asthma self-management program for Hispanic and African American students in grades three through five, including a program to parents, resulted in improved academic grades.
Physical Education
In Australia, a study providingdaily 15-minute morningphysical activity and afternoon60-minute aerobic and/ormotor skills sessions for fifthgraders.
Result:
Improved math scores Increased positive
classroom behavior
Dwyer, Coonan, Worsley, Leitch,1979
Physical Education
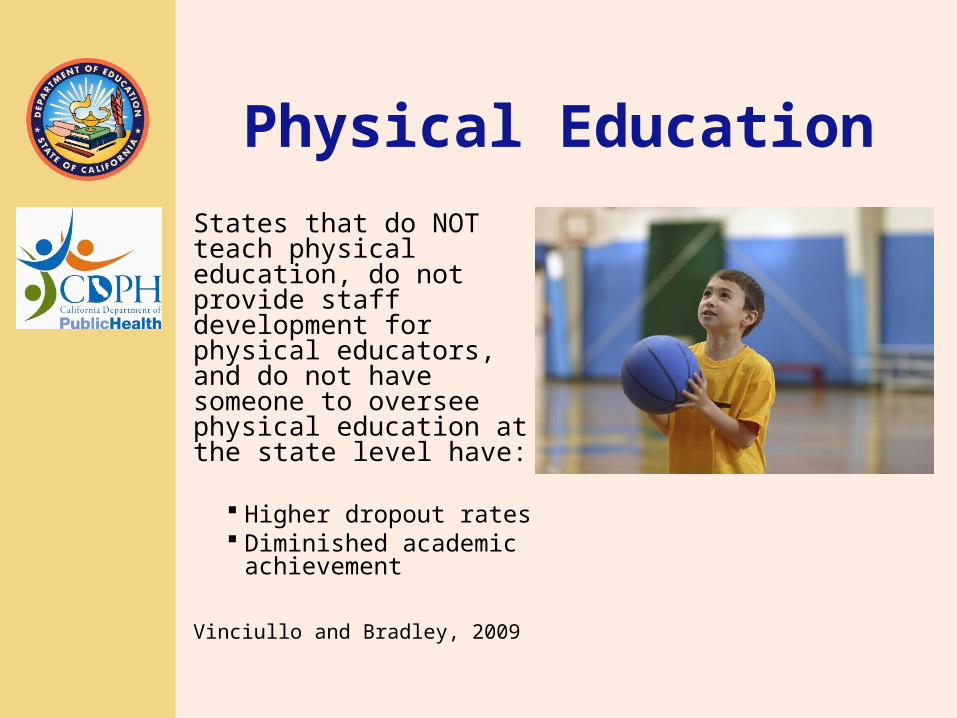
States that do NOT teach physical education, do not provide staff development for physical educators, and do not have someone to oversee physical education at the state level have:
Higher dropout rates Diminished academic
achievement
Vinciullo and Bradley, 2009
Physical Education
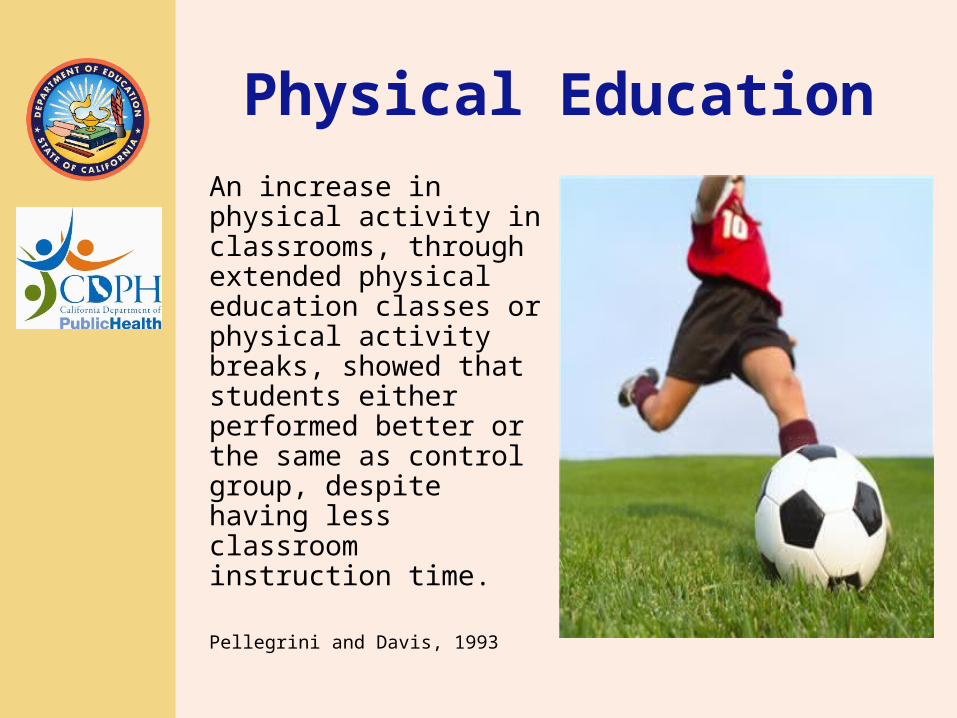
An increase in physical activity in classrooms, through extended physical education classes or physical activity breaks, showed that students either performed better or the same as control group, despite having less classroom instruction time.
Pellegrini and Davis, 1993

Physical Education
New research is emerging to explain how increased physical activity can improve learning.
Physical activity increases circulation, blood flow and may improve brain function.
Pellegrini, Kato, Blatchford, Baines, 2002; Norlander, Moas, Archer, 2005.

Importance of Recess Time spent in recess appears to have a positive relationship or no relationship with children’s attention, concentration, and/or on-task classroom behavior.
Children were less fidgety, less listless, more focused, and more on task compared with when they did not have recess.
Pellegrini, Huberty, Jones1995; Raviv, Low, 1990; Pollatschek, O’Hagan 1989; Sallis, McKenzi, Kolody, Lewis, Marshall, Rosengard,1999; Jarret, Maxwell, Dickerson, Hoge, Davies, Yetley,1980

Counseling, Psychological, & Social Services
Mental health and counseling services provided to high school students
Result:
Decreased absenteeism and tardiness.
Gall, Pagano, Desmond, et al., 2000

Every Health Risk Can Affect Academic Success
• Interventions can narrow disparities.
• Health interventions can improve learning and health.
Dilley, 2009

Healthy Students Learn Better
• Adolescents with poor general health were found less likely to graduate from high school than healthier students.
• Adults with less income and education had poorer health outcomes in comparison to those with more education and income.
CDE, 2005; Currie, 2005; Fiscella, 2009

The Poverty Factor
Review of state school health policies correlated with student academic achievement reinforce that poverty is strongly linked (inversely) with academic performance!
Vinciullo and Bradley, 2009
No Child Left Behind
A report on disparities in health and academic achievement among youth concluded that:
While the purpose of the No Child Left Behind Act of 2001 was to eliminate gaps in child achievement, little progress has been made.
It may be unrealistic to expect to close the achievement gap without also addressing the gaps in wellness, readiness to learn, and conditions affecting the health of the community.
Taras, 2005
Schools Can Improve Health
• School-based instructional programs for reducing alcohol-impaired driving
• School-based or linked dental delivery programs
• Enhanced school-based physical education
• Person-to-person interventions to improve caregivers’ parenting skills
• School-based programs to reduce youth violence
• Youth development behavioral interventions, coordinated with community service, to reduce sexual risk behaviors in adolescents
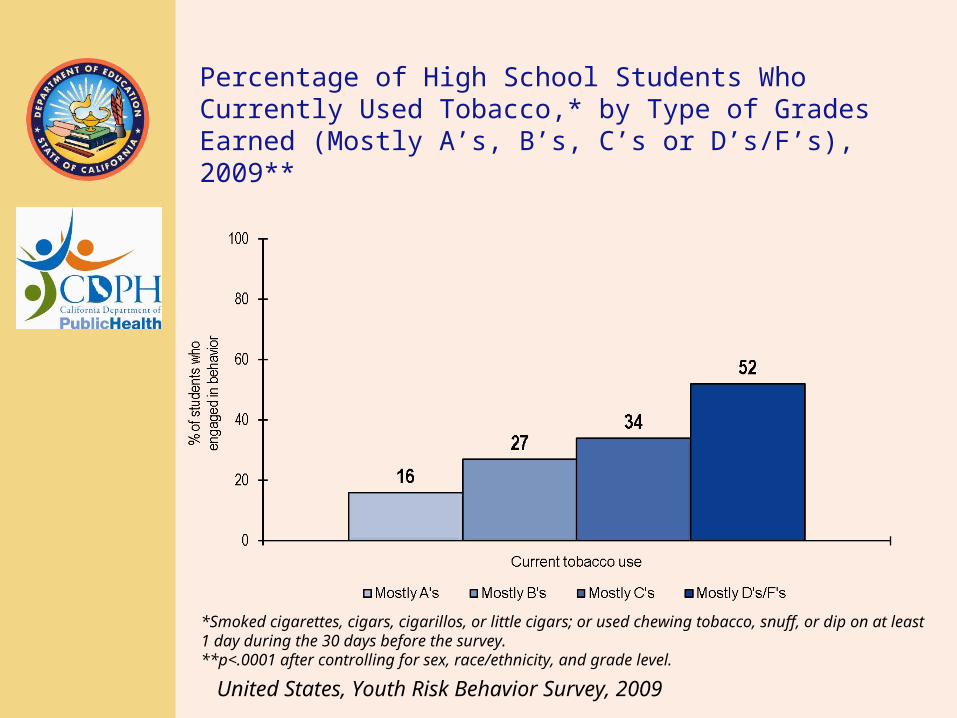
Percentage of High School Students Who Currently Used Tobacco,* by Type of Grades Earned (Mostly A’s, B’s, C’s or D’s/F’s), 2009**
*Smoked cigarettes, cigars, cigarillos, or little cigars; or used chewing tobacco, snuff, or dip on at least 1 day during the 30 days before the survey. **p<.0001 after controlling for sex, race/ethnicity, and grade level.
United States, Youth Risk Behavior Survey, 2009
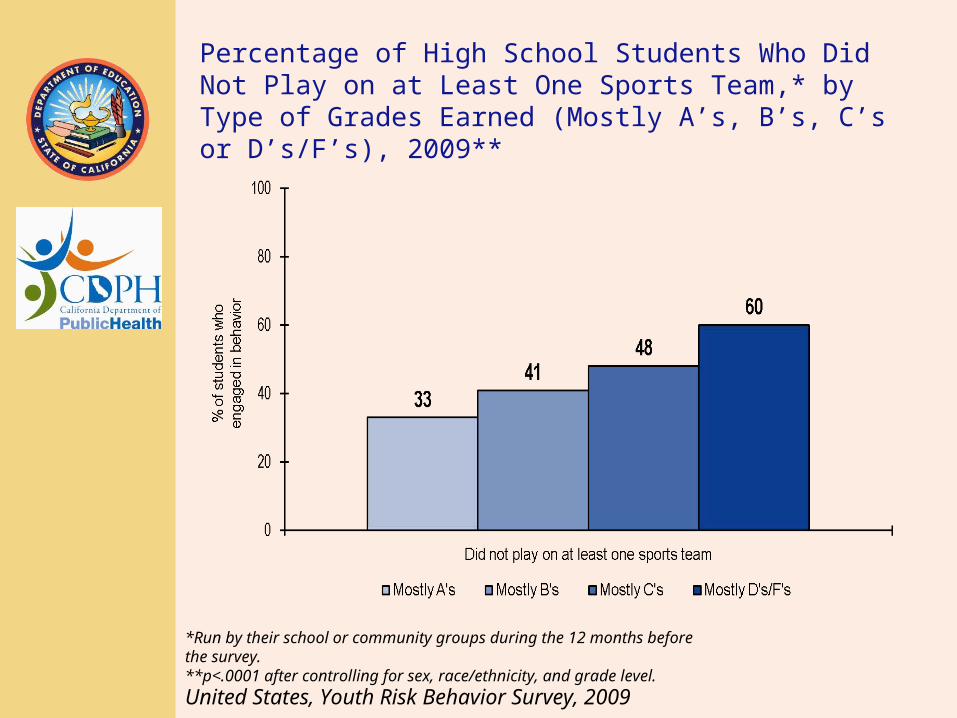
Percentage of High School Students Who Did Not Play on at Least One Sports Team,* by Type of Grades Earned (Mostly A’s, B’s, C’s or D’s/F’s), 2009**
*Run by their school or community groups during the 12 months before the survey.**p<.0001 after controlling for sex, race/ethnicity, and grade level.
United States, Youth Risk Behavior Survey, 2009

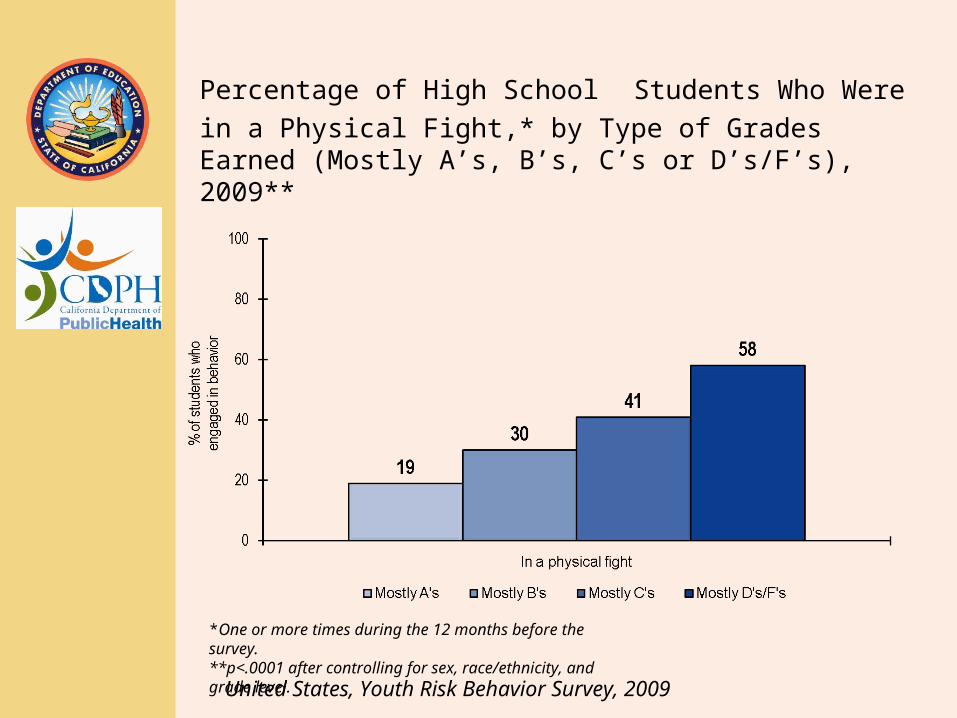
Percentage of High School Students Who Were in a
Physical Fight,* by Type of Grades Earned (Mostly A’s, B’s, C’s or D’s/F’s), 2009**
*One or more times during the 12 months before the survey.**p<.0001 after controlling for sex, race/ethnicity, and grade level.
United States, Youth Risk Behavior Survey, 2009

Speaker Contact
Mary C. Marks, Ph.D.
(916) 319-0277
Andrew Manthe, M.P.H., C.H.E.S.
(916) 449-5393
References
Data slides from Centers for Disease Control are available on Web site:
http://www.cdc.gov/HealthyYouth/health_and_academics/index.htm
ReferencesAiella, A.E., R,m. Coulborn, V. Perez and E.L. Larson. 2008. Effect of hand hygiene on infectious disease risk in the community setting: a meta-analysis. American Journal of Public Health. 98:1372-1381.
Blair SN, Tritsch L, Kutsch S. Worksite Health Promotion for School Faculty and Staff. Journal of School Health. 1987;57(10):469-473.
California Department of Education. California Physical Fitness Test: A Study of the Relationship between Physical Fitness and Academic Achievement in California Using 2004 Test Results. Sacramento, CA: California Department of Education; 2005.
California Department of Education. 2005. Getting Results:Developing Safe and healty Kids Update 5: Student Healthy, Supportive Schools, and Academic Success. www.gettingresults.org/ (accessed August 6, 2010)
Centers for Disease Control and Prevention. Healthy Youth! Student Health and Academic Achievement. www.cdc.gov/healthyyouth/health_and_academics/index.htm (accessed August 2, 2010)
Currie, J. 2005. Health Disparities and Gaps in School Readiness. The Future of Children. 15(1):117-138.
Davis, K., S.R. Collins, M.M. Doty, A. Ho and A.L. Holmgren. August 2005. Health and Productivity Among U.U. Workers. The Commonwealth Fund. www.commonwealthfund.org/usr_doc/856_ hlt_productivity_USworkers.pdf (accessed August 4, 2010).
Dilley, J. Research Review: School –based Health Interventions and Academic Achievement. (2009). Washington State Office of Superintendent of Public Instruction, and Washington State Board of Health .

References (continued)Dwyer T, Coonan WE, Worsley LA, Leitch DR. An Assessment of the Effects of Two Physical Activity Programs on Coronary Heart Disease Risk Factors in Primary School Children. Community Health Study. 1979;3:196-202.
Ejemont, R.I., E. Ehiri, M.M. Meremikwu and J.A. Critchley. 2008. Hand washing for preventing diarrhea. Cochrane Data base of Systematic Reviews. Issue 1, Article No: CD004265.
Evans, D., Clark N.M., Feldman CH, et al., A School Health Education Program for Children with Asthma Aged 8-11 Years. Health Education Quarterly. 1987:14(3):267-279.
Fiscella, K. and H. Kitzman. 2009. Disparities in academic achievement and health: the intersection of child education and health policy. Pediatrics 123: 1073-80.
Foster, GD, Sherman, S, Borradaile, KE, Grundy, KM, Vander Veur, SS, Nachmani J, Karpyn A, Kumanyika S. Shults, J. A Policy-Based School Intervention to Prevent Overweight and Obesity. Pediatrics. 2008;121(4), 794-802.
Gall, G., Pagano M.E., Desmond M.S., Perrin J.M., Murphy J.M. Utility of Psychosocial Screening at a School-Based Health Center. Journal of School Health. 2000; 70(7):292-298.
Harris, J.R., P.A. Lichiella and P.A. Hannon. 2009. Workplace health promotion in Washington State. Prevention Chronic Dis 6(1). www.cdc.gov/pcd/issues/2009/jan/07_0276.htmm.
Jarrett O.S. Maxwell, D.M, Dickerson C, Hoge P., Pavies G., Yetley A. Impact of recess on classroom behavior: Group effects and individual differences. Journal of Educational Research 1998; 92(2):121-126.
McCord M.T., Klein J.D., Foy J.M., Fothergill K. School-Based Clinic Use and School Performance. Journal Adolescent Health. 1993;14(2):91-98.

References (continued)Meadows, E. and N. LeSauz. 2004. A systematic review of the effectiveness of antimicrobial rinse-free hand sanitizers for prevention of illness-related absenteeism in elementary school children. BMC Public Health. 4(50).
Murphy J.M., Pagano M.E., Nachmani J., Sperling P., Kane S., Kleinman R.E. The Relationship of School Breakfast to Psychosocial and Academic Functioning: Cross-Sectional and Longitudinal Observations in an Inner-City School Sample. Arch Pediariatric Adolescent Medicine 1998;152(9):899-907.
Norlander T., Moas L., Archer T. Noise and stress in primary and secondary school children: noise reduction and increased concentration ability through a short but regular exercise and relaxation program. School Effectiveness and School Improvement 2005; 16(1):91-99.
O’brien L.M., Polacsek M., MacDonald P.B., Ellis J., Berry S., Martin M. Impact of a School Health Coordinator Intervention on Health-Related School Policies and Student Behavior. Journal of School Health. 2010;80(4):176-185.
O’Donnell J., Hawkins J.D., Catalano R.F., Abbott R., Day L.E. Preventing School Failure, Drug Use, and Delinquency Among Low-Income Children: Long-Term Intervention in Elementary School. American Journal of Orthopsychiatry. 1995:65(1):87-100.
Pellegrini A.D., Huberty P.D., Jones I. The effects of recess timing on children’s playground and classroom behaviors. American Educational Research Journal 1995;32(4):845-864.

References (continued)Pellegrini, A.D., Davis P.D. Relations between children’s playground and classroom behavior. British Journal of Educational Psychology 1993;63(1):88-95.
Pellegrini, A.D., Kato K, Blatchfor P., Baine E. A short-term longitudinal study of children’s playground games across the first year of school; implications for social competence and adjustment to school. American Educational Research Journal 2002; 39(4): 991-1051.
Polatschek, J.L., O’Hagan F.J. An investigation of the psycho-physical influences of a quality daily physical education programme. Health Education Research 1989; 4(3): 341-350.
Raviv, S., Low M. Influence of physical activity on concentration among junior high-school students. Perceptual and Motor Skills 1990; 70(1): 67-74.
Sallis, J.F., McKenzie T.L., Kolody B., Lewis, M., Marshall, S., Rosengard P. Effects of health-related physical education on academic achievement: Project SPARK. Research Quarterly for Exercise and Sport 1999; 70(2):127-134.
Taras H. Physical activity and student performance at school. Journal of School Health 2005; 75(6):214-218.
United States, Youth Risk Behavior Survey, 2009
Vinciullo, F. M., Bradley, B.J., A Correlation Study of the Relationship Between a Coordinated School Health Program and School Achievement: A Case for School Health. Journal of School Nursing, 2009:25, 453-465.

Physical Inactivityand
Unhealthy Dietary Behaviors
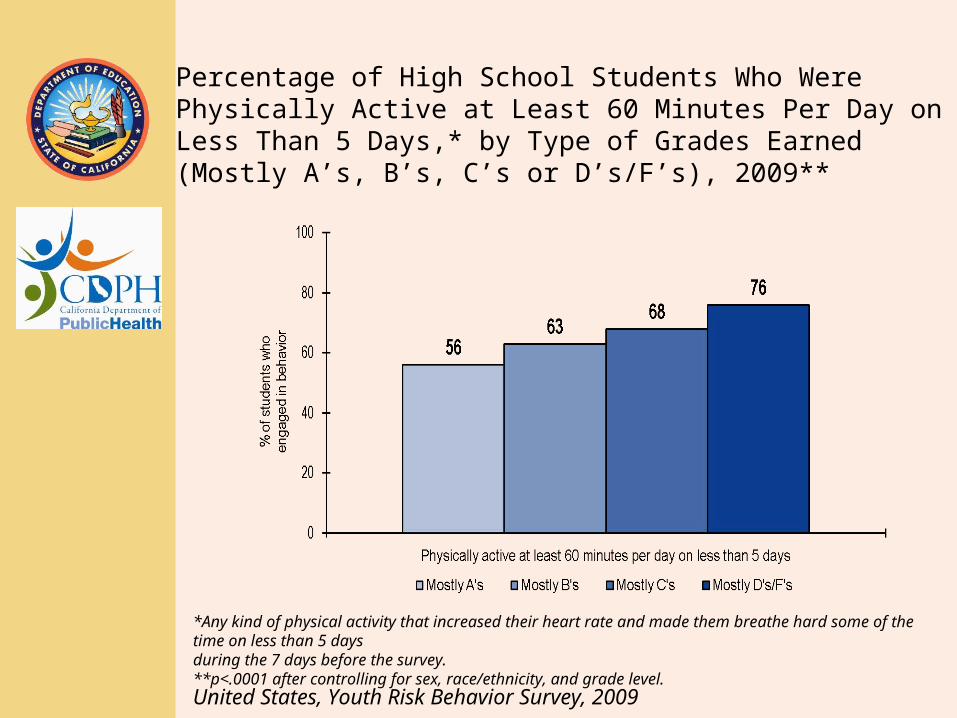
Percentage of High School Students Who Were Physically Active at Least 60 Minutes Per Day on Less Than 5 Days,* by Type of Grades Earned (Mostly A’s, B’s, C’s or D’s/F’s), 2009**
*Any kind of physical activity that increased their heart rate and made them breathe hard some of the time on less than 5 days during the 7 days before the survey.**p<.0001 after controlling for sex, race/ethnicity, and grade level.
United States, Youth Risk Behavior Survey, 2009

Percentage of High School Students Who Did Not Play on at Least One Sports Team,* by Type of Grades Earned (Mostly A’s, B’s, C’s or D’s/F’s), 2009**
*Run by their school or community groups during the 12 months before the survey.**p<.0001 after controlling for sex, race/ethnicity, and grade level.
United States, Youth Risk Behavior Survey, 2009

Percentage of High School Students Who Watched Television 3 or More Hours Per Day,* by Type of Grades Earned (Mostly A’s, B’s, C’s or D’s/F’s), 2009**
*On an average school day.**p<.0001 after controlling for sex, race/ethnicity, and grade level.
United States, Youth Risk Behavior Survey, 2009
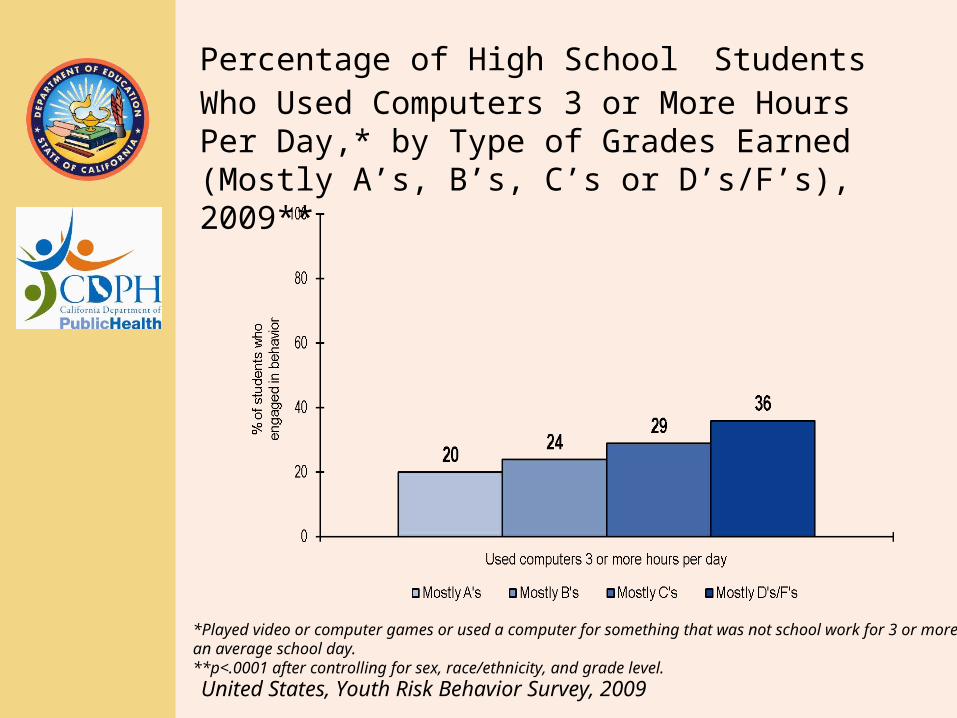
Percentage of High School Students Who Used Computers 3 or More Hours Per Day,* by Type of Grades Earned (Mostly A’s, B’s, C’s or D’s/F’s), 2009**
*Played video or computer games or used a computer for something that was not school work for 3 or more hours on an average school day.**p<.0001 after controlling for sex, race/ethnicity, and grade level.
United States, Youth Risk Behavior Survey, 2009

Percentage of High School Students Who Drank a Can, Bottle, or Glass of Soda or Pop at Least One Time Per Day,* by Type of Grades Earned (Mostly A’s, B’s, C’s or D’s/F’s), 2009**
*Drank a can, bottle, or glass of soda or pop (not including diet soda or diet pop) at least one time per day during the 7 days before the survey.**p<.0001 after controlling for sex, race/ethnicity, and grade level.
United States, Youth Risk Behavior Survey, 2009

Percentage of High School Students Who Did Not Eat for 24 or More Hours to Lose Weight or to Keep From Gaining Weight,* by Type of Grades Earned (Mostly A’s, B’s, C’s or D’s/F’s), 2009**
*During the 30 days before the survey.**p<.0001 after controlling for sex, race/ethnicity, and grade level.
United States, Youth Risk Behavior Survey, 2009

Percentage of High School Students Who Took Diet Pills, Powders, or Liquids Without a Doctor’s Advice to Lose Weight or to Keep From Gaining Weight,* by Type of Grades Earned (Mostly A’s, B’s, C’s or D’s/F’s), 2009**
*During the 30 days before the survey.**p<.0001 after controlling for sex, race/ethnicity, and grade level.
United States, Youth Risk Behavior Survey, 2009
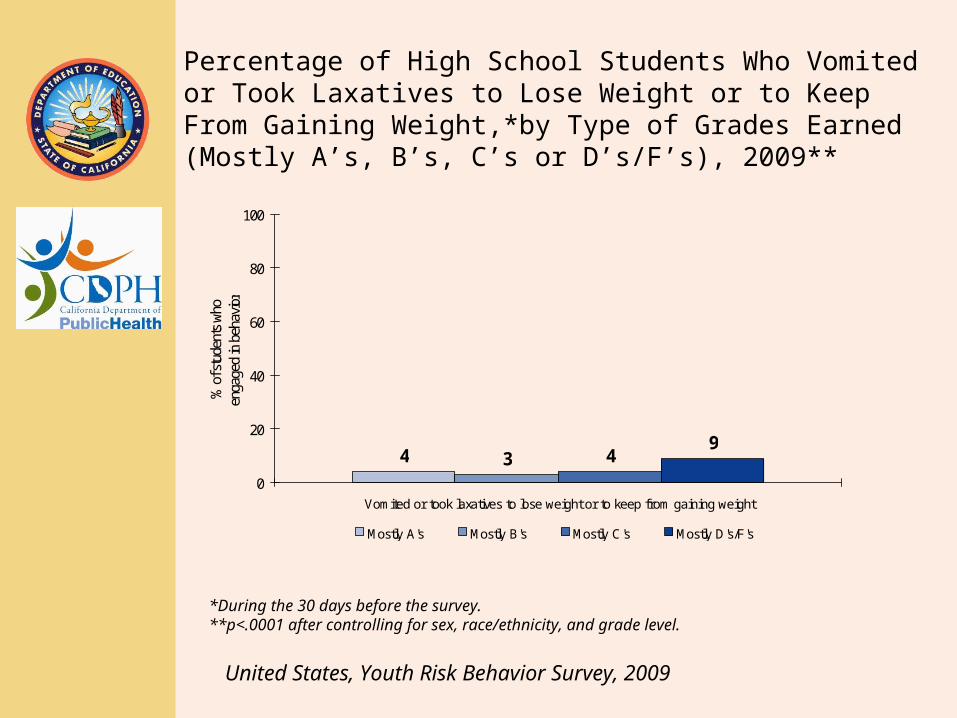
Percentage of High School Students Who Vomited or Took Laxatives to Lose Weight or to Keep From Gaining Weight,*by Type of Grades Earned (Mostly A’s, B’s, C’s or D’s/F’s), 2009**
4 3 49
0
20
40
60
80
100
Vomited or took laxatives to lose weight or to keep from gaining weight
% o
f stu
dent
s wh
oen
gage
d in
beh
avio
r
Mostly A's Mostly B's Mostly C's Mostly D's/F's
*During the 30 days before the survey.**p<.0001 after controlling for sex, race/ethnicity, and grade level.
United States, Youth Risk Behavior Survey, 2009

Alcohol and Other Drug Use
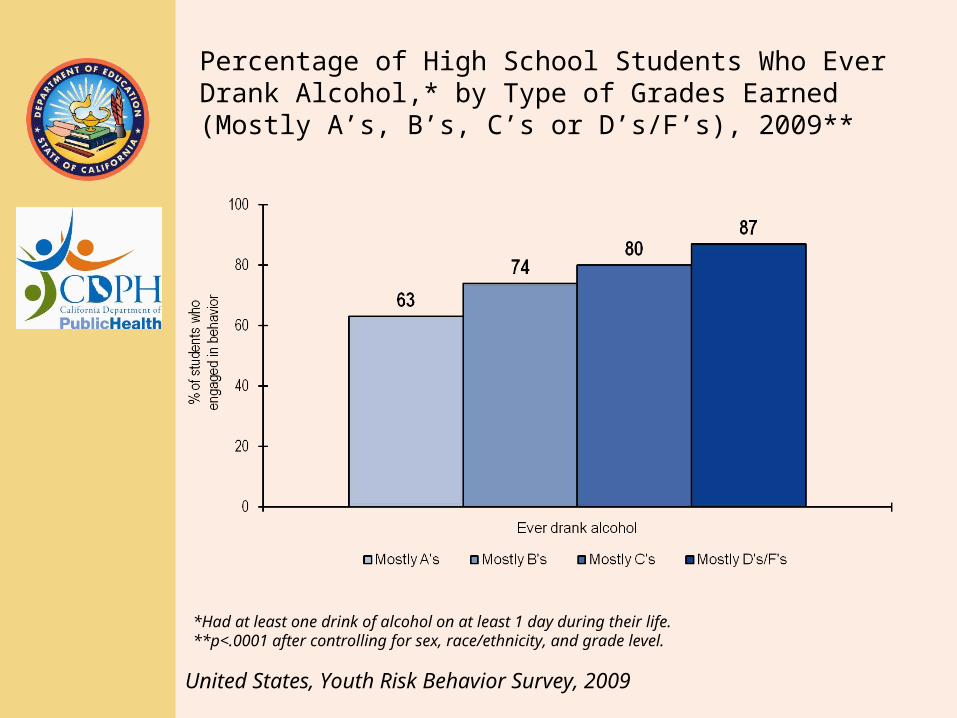
Percentage of High School Students Who Ever Drank Alcohol,* by Type of Grades Earned (Mostly A’s, B’s, C’s or D’s/F’s), 2009**
*Had at least one drink of alcohol on at least 1 day during their life. **p<.0001 after controlling for sex, race/ethnicity, and grade level.
United States, Youth Risk Behavior Survey, 2009
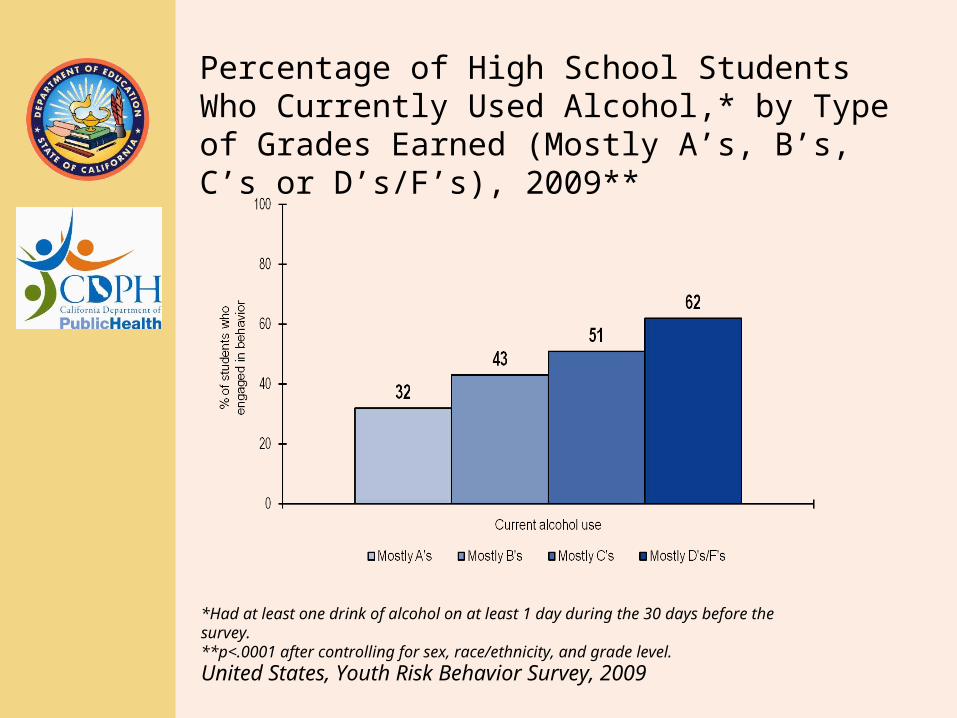
Percentage of High School Students Who Currently Used Alcohol,* by Type of Grades Earned (Mostly A’s, B’s, C’s or D’s/F’s), 2009**
*Had at least one drink of alcohol on at least 1 day during the 30 days before the survey. **p<.0001 after controlling for sex, race/ethnicity, and grade level.
United States, Youth Risk Behavior Survey, 2009

Percentage of High School Students Who Reported Current Binge Drinking,*by Type of Grades Earned (Mostly A’s, B’s, C’s or D’s/F’s), 2009**
1725 30
46
0
20
40
60
80
100
Current binge drinking
% o
f stu
dent
s who
enga
ged
in be
havio
r
Mostly A's Mostly B's Mostly C's Mostly D's/F's
*Had five or more drinks of alcohol in a row within a couple of hours on at least 1 day during the 30 days before the survey. **p<.0001 after controlling for sex, race/ethnicity, and grade level.
United States, Youth Risk Behavior Survey, 2009
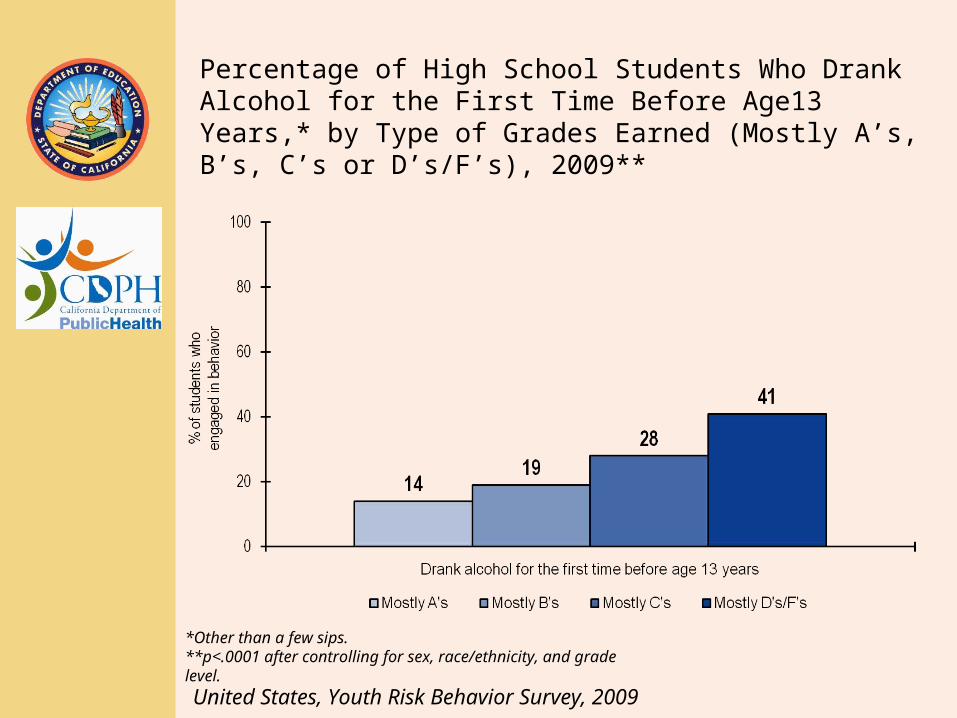
Percentage of High School Students Who Drank Alcohol for the First Time Before Age13 Years,* by Type of Grades Earned (Mostly A’s, B’s, C’s or D’s/F’s), 2009**
*Other than a few sips. **p<.0001 after controlling for sex, race/ethnicity, and grade level.
United States, Youth Risk Behavior Survey, 2009

Percentage of High School Students Who Drank Alcohol on School Property,* by Type of Grades Earned (Mostly A’s, B’s, C’s or D’s/F’s), 2009**
* At least one drink of alcohol on at least 1 day during the 30 days before the survey.**p<.0001 after controlling for sex, race/ethnicity, and grade level.
United States, Youth Risk Behavior Survey, 2009

Percentage of High School Students Who Ever Used Marijuana,*by Type of Grades Earned (Mostly A’s, B’s, C’s or D’s/F’s), 2009**
*Used marijuana one or more times during their life. **p<.0001 after controlling for sex, race/ethnicity, and grade level.
United States, Youth Risk Behavior Survey, 2009
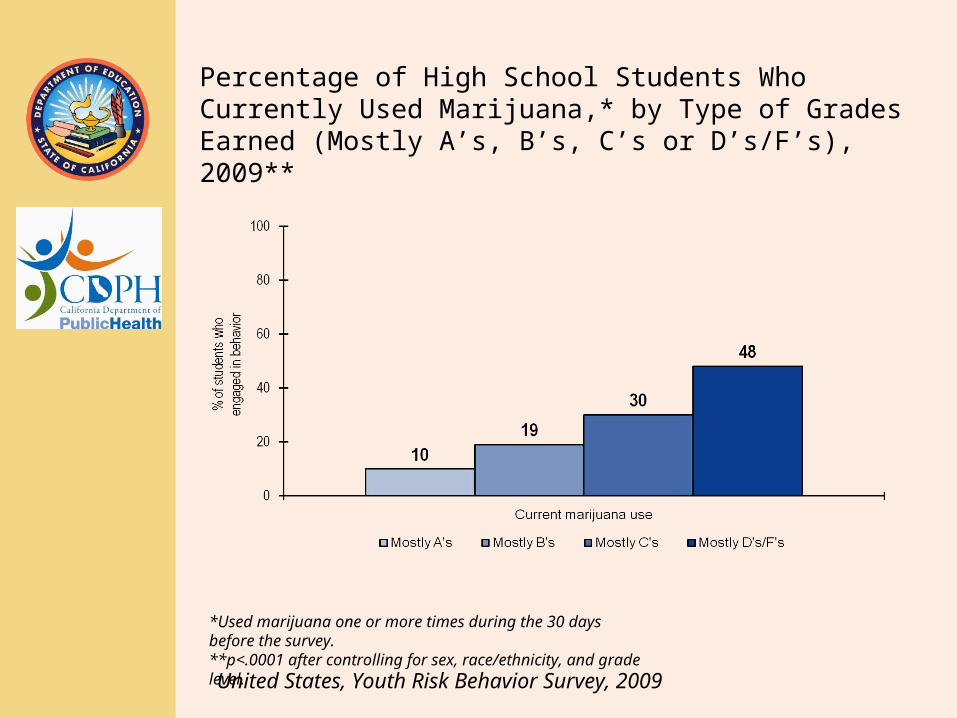
Percentage of High School Students Who Currently Used Marijuana,* by Type of Grades Earned (Mostly A’s, B’s, C’s or D’s/F’s), 2009**
*Used marijuana one or more times during the 30 days before the survey.**p<.0001 after controlling for sex, race/ethnicity, and grade level.
United States, Youth Risk Behavior Survey, 2009

Percentage of High School Students Who Tried Marijuana for the First Time Before Age 13 Years, by Type of Grades Earned (Mostly A’s, B’s, C’s or D’s/F’s), 2009*
3 512
24
0
20
40
60
80
100
Tried marijuana for the first time before age 13 years
% o
f stu
dent
s wh
oen
gage
d in
beh
avio
r
Mostly A's Mostly B's Mostly C's Mostly D's/F's
*p<.0001 after controlling for sex, race/ethnicity, and grade level.
United States, Youth Risk Behavior Survey, 2009

Percentage of High School Students Who Used Marijuana on School Property,*by Type of Grades Earned (Mostly A’s, B’s, C’s or D’s/F’s), 2009**
*One or more times during the 30 days before the survey.**p<.0001 after controlling for sex, race/ethnicity, and grade level.
United States, Youth Risk Behavior Survey, 2009
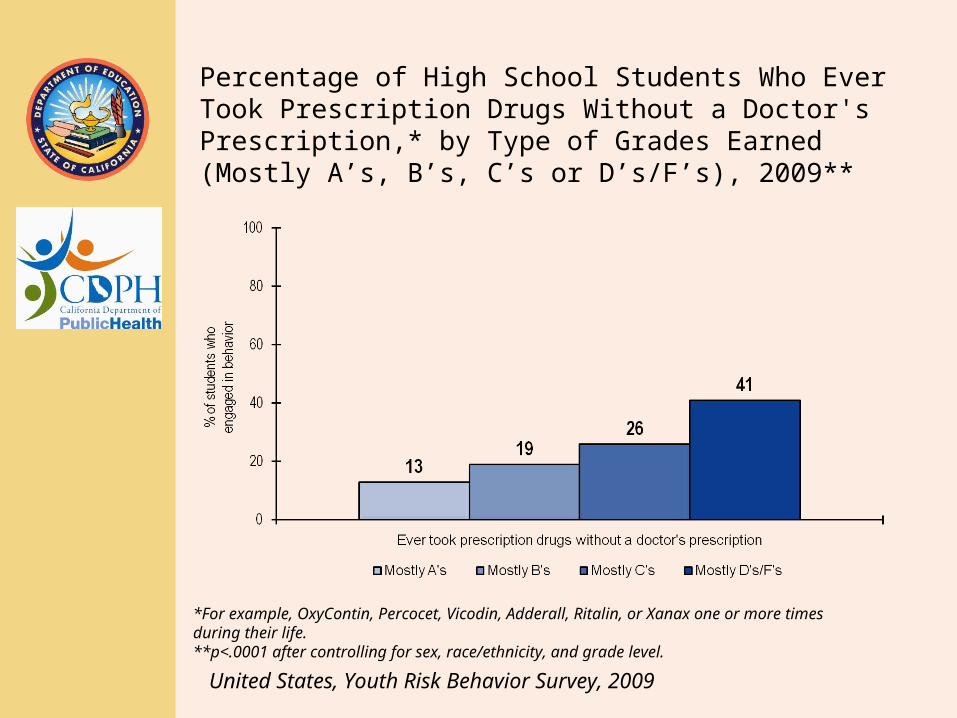
Percentage of High School Students Who Ever Took Prescription Drugs Without a Doctor's Prescription,* by Type of Grades Earned (Mostly A’s, B’s, C’s or D’s/F’s), 2009**
*For example, OxyContin, Percocet, Vicodin, Adderall, Ritalin, or Xanax one or more times during their life. **p<.0001 after controlling for sex, race/ethnicity, and grade level.
United States, Youth Risk Behavior Survey, 2009

Percentage of High School Students Who Ever Used Cocaine,* by Type of Grades Earned (Mostly A’s, B’s, C’s or D’s/F’s), 2009**
*Used any form of cocaine (e.g., powder, crack, or freebase) one or more times during their life. **p<.0001 after controlling for sex, race/ethnicity, and grade level.
United States, Youth Risk Behavior Survey, 2009

Percentage of High School Students Who Currently Used Cocaine,* by Type of Grades Earned (Mostly A’s, B’s, C’s or D’s/F’s), 2009**
*Any form of cocaine (e.g., powder, crack, or freebase) one or more times during the 30 days before the survey.**p<.0001 after controlling for sex, race/ethnicity, and grade level.
United States, Youth Risk Behavior Survey, 2009

Percentage of High School Students Who Ever Injected Illegal Drugs,* by Type of Grades Earned (Mostly A’s, B’s, C’s or D’s/F’s), 2009**
*Used a needle to inject any illegal drug into their body one or more times during their life . **p<.0001 after controlling for sex, race/ethnicity, and grade level.
United States, Youth Risk Behavior Survey, 2009

Percentage of High School Students Who Ever Used Inhalants,* by Type of Grades Earned (Mostly A’s, B’s, C’s or D’s/F’s), 2009**
*Sniffed glue, breathed the contents of aerosol spray cans, or inhaled any paints or sprays to get high one or more times during their life. **p<.0001 after controlling for sex, race/ethnicity, and grade level.
United States, Youth Risk Behavior Survey, 2009

Percentage of High School Students Who Ever Took Steroids Without a Doctor’s Prescription,* by Type of Grades Earned (Mostly A’s, B’s, C’s or D’s/F’s), 2009**
*Took steroid pills or shots without a doctor’s prescription one or more times during their life. **p<.0001 after controlling for sex, race/ethnicity, and grade level.
United States, Youth Risk Behavior Survey, 2009

Percentage of High School Students Who Ever Used Hallucinogenic Drugs,* by Type of Grades Earned (Mostly A’s, B’s, C’s or D’s/F’s), 2009**
*Used hallucinogenic drugs (e.g. LSD, acid, PCP, angel dust, mescaline, or mushrooms) one or more times during their life. **p<.0001 after controlling for sex, race/ethnicity, and grade level.
United States, Youth Risk Behavior Survey, 2009

Percentage of High School Students Who Ever Used Heroin,* by Type of Grades Earned (Mostly A’s, B’s, C’s or D’s/F’s), 2009**
2 2 210
0
20
40
60
80
100
Ever used heroin
% o
f stu
dent
s wh
oen
gage
d in
beh
avio
r
Mostly A's Mostly B's Mostly C's Mostly D's/F's
*Used heroin (also called smack, junk, or China White) one or more times during their life. **p<.0001 after controlling for sex, race/ethnicity, and grade level.
United States, Youth Risk Behavior Survey, 2009

Percentage of High School Students Who Ever Used Methamphetamines,* by Type of Grades Earned (Mostly A’s, B’s, C’s or D’s/F’s), 2009**
2 3 514
0
20
40
60
80
100
Ever used methamphetamines
% o
f stu
dent
s wh
oen
gage
d in
beh
avio
r
Mostly A's Mostly B's Mostly C's Mostly D's/F's
*Used methamphetamines (also called speed, crystal, crank, or ice) one or more times during their life. **p<.0001 after controlling for sex, race/ethnicity, and grade level.
United States, Youth Risk Behavior Survey, 2009

Percentage of High School Students Who Ever Used Ecstasy* by Type of Grades Earned (Mostly A’s, B’s, C’s or D’s/F’s), 2009**
*Used ecstasy (also called MDMA) one or more times during their life. **p<.0001 after controlling for sex, race/ethnicity, and grade level.
United States, Youth Risk Behavior Survey, 2009

Percentage of High School Students Who Were Offered,
Sold, or Given an Illegal Drug by Someone on School Property,* by Type of Grades Earned (Mostly A’s, B’s, C’s or D’s/F’s), 2009**
1522
27
44
0
20
40
60
80
100
Offered, sold, or given an illegal drug by someone on school property
% o
f stu
dent
s wh
oen
gage
d in
beh
avio
r
Mostly A's Mostly B's Mostly C's Mostly D's/F's
*During the 12 months before the survey. **p<.0001 after controlling for sex, race/ethnicity, and grade level.
United States, Youth Risk Behavior Survey, 2009

Tobacco Use

Percentage of High School Students Who Ever Smoked
Cigarettes,* by Type of Grades Earned (Mostly A’s, B’s, C’s or D’s/F’s), 2009**
*Ever tried cigarette smoking, even one or two puffs.**p<.0001 after controlling for sex, race/ethnicity, and grade level.
United States, Youth Risk Behavior Survey, 2009
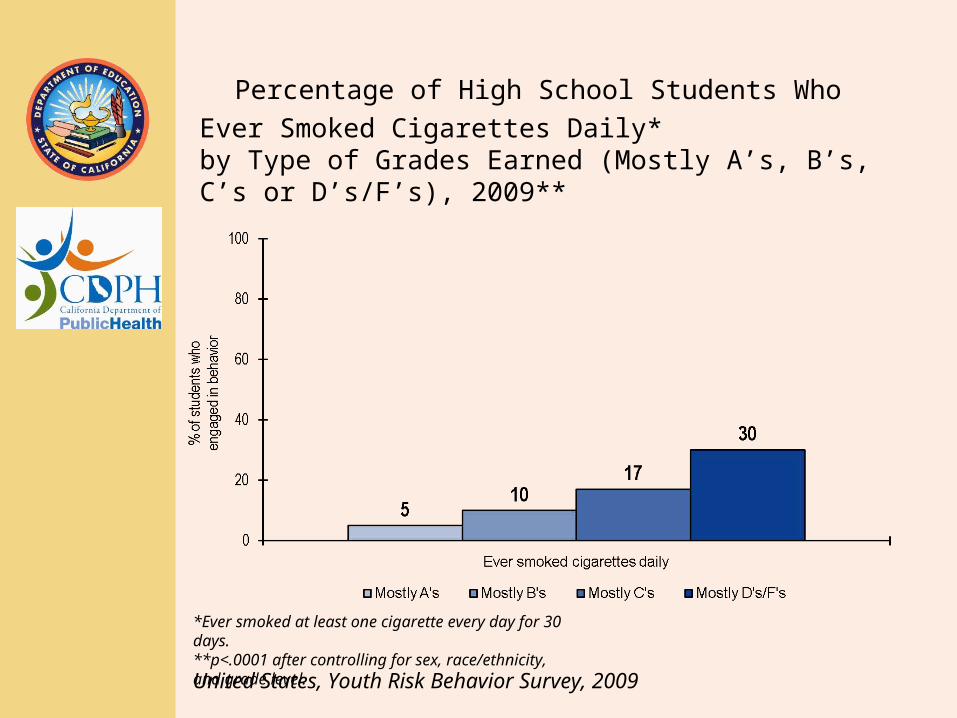
Percentage of High School Students Who Ever Smoked
Cigarettes Daily* by Type of Grades Earned (Mostly A’s, B’s, C’s or D’s/F’s), 2009**
*Ever smoked at least one cigarette every day for 30 days.**p<.0001 after controlling for sex, race/ethnicity, and grade level.
United States, Youth Risk Behavior Survey, 2009
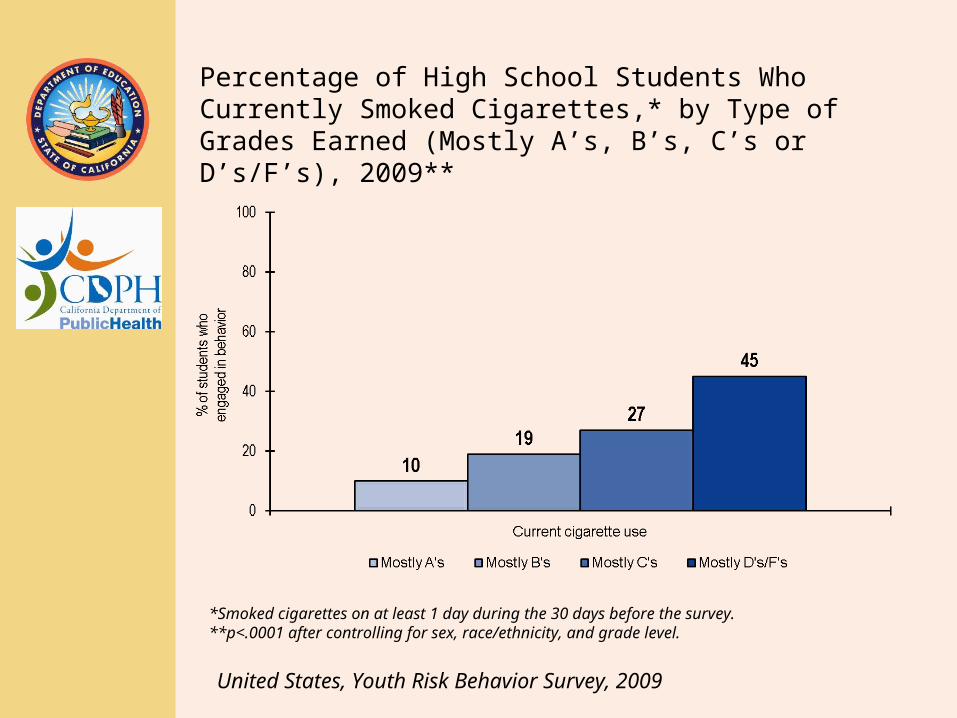
Percentage of High School Students Who Currently Smoked Cigarettes,* by Type of Grades Earned (Mostly A’s, B’s, C’s or D’s/F’s), 2009**
*Smoked cigarettes on at least 1 day during the 30 days before the survey.**p<.0001 after controlling for sex, race/ethnicity, and grade level.
United States, Youth Risk Behavior Survey, 2009

Percentage of High School Students Who Reported Current Frequent Cigarette Use,*by Type of Grades Earned (Mostly A’s, B’s, C’s or D’s/F’s), 2009**
*Smoked cigarettes on 20 or more days during the 30 days before the survey. **p<.0001 after controlling for sex, race/ethnicity, and grade level.
United States, Youth Risk Behavior Survey, 2009
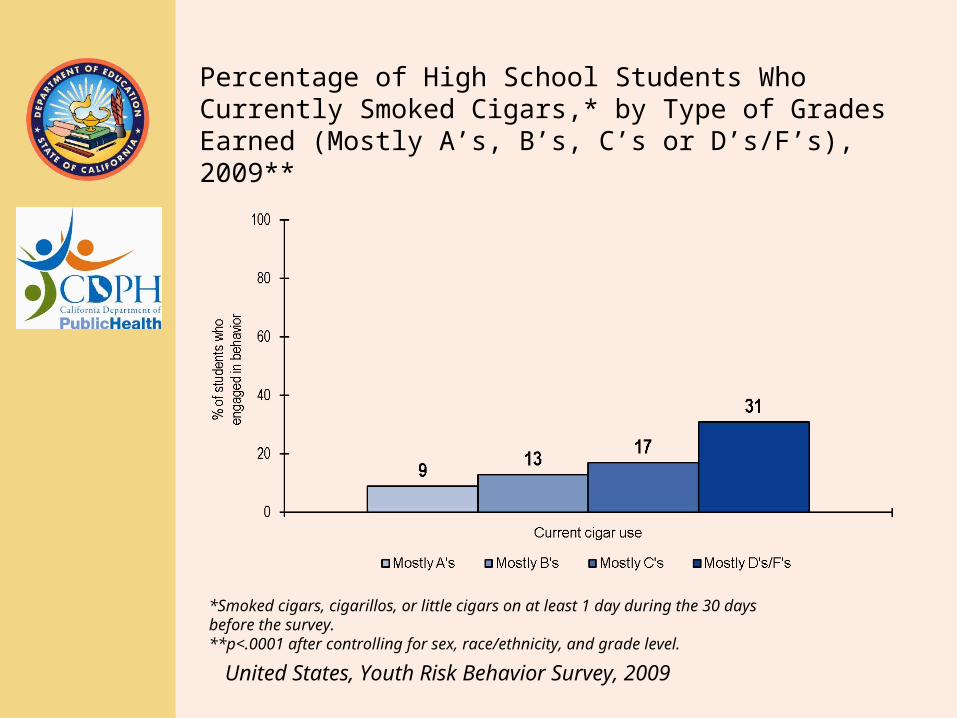
Percentage of High School Students Who Currently Smoked Cigars,* by Type of Grades Earned (Mostly A’s, B’s, C’s or D’s/F’s), 2009**
*Smoked cigars, cigarillos, or little cigars on at least 1 day during the 30 days before the survey. **p<.0001 after controlling for sex, race/ethnicity, and grade level.
United States, Youth Risk Behavior Survey, 2009

Percentage of High School Students Who Currently Used Tobacco,* by Type of Grades Earned (Mostly A’s, B’s, C’s or D’s/F’s), 2009**
*Smoked cigarettes, cigars, cigarillos, or little cigars; or used chewing tobacco, snuff, or dip on at least 1 day during the 30 days before the survey. **p<.0001 after controlling for sex, race/ethnicity, and grade level.
United States, Youth Risk Behavior Survey, 2009
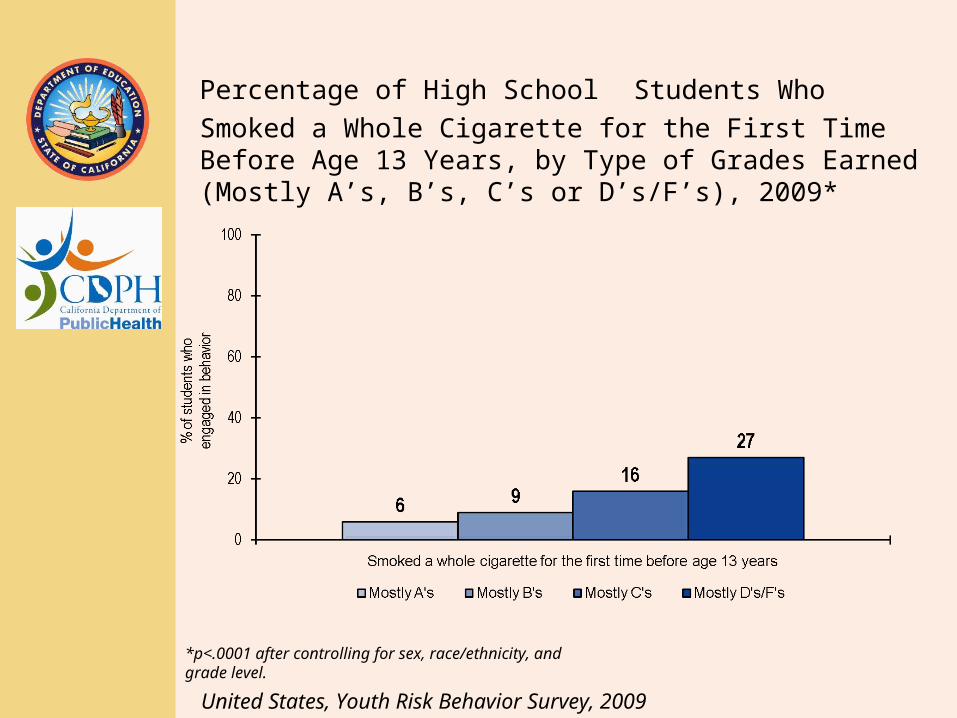
Percentage of High School Students Who Smoked a Whole
Cigarette for the First Time Before Age 13 Years, by Type of Grades Earned (Mostly A’s, B’s, C’s or D’s/F’s), 2009*
*p<.0001 after controlling for sex, race/ethnicity, and grade level.
United States, Youth Risk Behavior Survey, 2009

Percentage of High School Students Who Smoked Cigarettes on School Property,* by Type of Grades Earned (Mostly A’s, B’s, C’s or D’s/F’s), 2009**
* On at least 1 day during the 30 days before the survey. **p<.0001 after controlling for sex, race/ethnicity, and grade level.
United States, Youth Risk Behavior Survey, 2009

Percentage of High School Students Who Currently Used Smokeless Tobacco,* by Type of Grades Earned (Mostly A’s, B’s, C’s or D’s/F’s), 2009**
*Used chewing tobacco, snuff, or dip on at least 1 day during the 30 days before the survey.**p<.0001 after controlling for sex, race/ethnicity, and grade level.
United States, Youth Risk Behavior Survey, 2009

Percentage of High School Students Who Used Smokeless Tobacco on School Property,* by Type of Grades Earned (Mostly A’s, B’s, C’s or D’s/F’s), 2009**
* Used chewing tobacco, snuff, or dip on at least 1 day during the 30 days before the survey.**p<.0001 after controlling for sex, race/ethnicity, and grade level.
United States, Youth Risk Behavior Survey, 2009

Sexual Risk Behaviors

Percentage of High School Students Who Ever Had Sexual
Intercourse, by Type of Grades Earned (Mostly A’s, B’s, C’s or D’s/F’s), 2009*
32
46
5969
0
20
40
60
80
100
Ever had sexual intercourse
% o
f stu
dent
s wh
oen
gage
d in
beh
avio
r
Mostly A's Mostly B's Mostly C's Mostly D's/F's
*p<.0001 after controlling for sex, race/ethnicity, and grade level.
United States, Youth Risk Behavior Survey, 2009
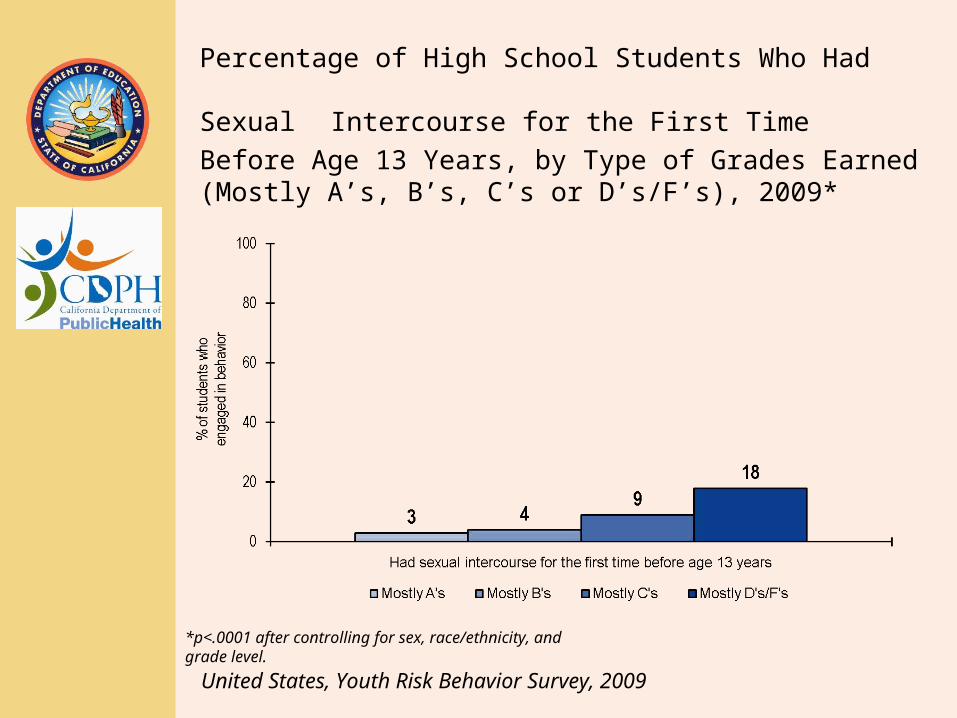
Percentage of High School Students Who Had Sexual Intercourse for the First Time Before Age 13 Years, by Type of Grades Earned (Mostly A’s, B’s, C’s or D’s/F’s), 2009*
*p<.0001 after controlling for sex, race/ethnicity, and grade level.
United States, Youth Risk Behavior Survey, 2009

Percentage of High School Students Who Had Sexual Intercourse With Four or More Persons During Their Life, by Type of Grades Earned (Mostly A’s, B’s, C’s or D’s/F’s), 2009*
*p<.0001 after controlling for sex, race/ethnicity, and grade level.
United States, Youth Risk Behavior Survey, 2009

Percentage of High School Students Who Were Currently
Sexually Active,*by Type of Grades Earned (Mostly A’s, B’s, C’s or D’s/F’s), 2009**
*Had sexual intercourse with at least one person during the 3 months before the survey.**p<.0001 after controlling for sex, race/ethnicity, and grade level.
United States, Youth Risk Behavior Survey, 2009
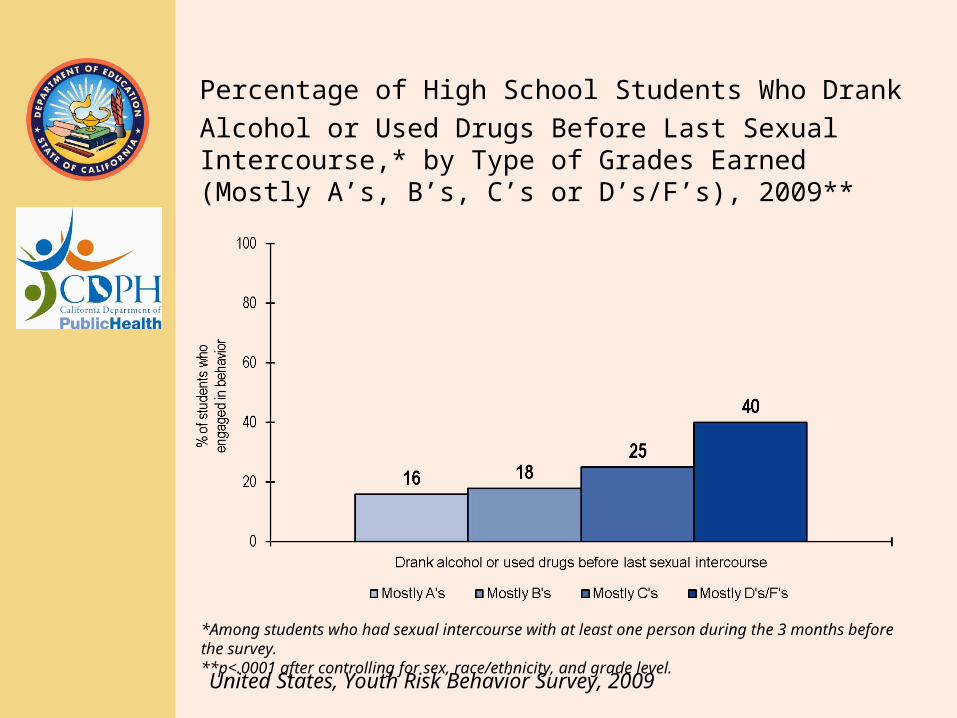
Percentage of High School Students Who Drank Alcohol or
Used Drugs Before Last Sexual Intercourse,* by Type of Grades Earned (Mostly A’s, B’s, C’s or D’s/F’s), 2009**
*Among students who had sexual intercourse with at least one person during the 3 months before the survey.**p<.0001 after controlling for sex, race/ethnicity, and grade level.
United States, Youth Risk Behavior Survey, 2009

Percentage of High School Students Who Did Not Use a Condom During Last Sexual Intercourse,* by Type of Grades Earned (Mostly A’s, B’s, C’s or D’s/F’s), 2009.**
*Among students who had sexual intercourse with at least one person during the 3 months before the survey.**p<.001 after controlling for sex, race/ethnicity, and grade level.
United States, Youth Risk Behavior Survey, 2009
Unintentional Injury and Violence-Related Behaviors

Percentage of High School Students Who Rarely or Never Wore a Seat Belt,*by Type of Grades Earned
(Mostly A’s, B’s C’s or D’s/F’s), 2009**
6 814
24
0
20
40
60
80
100
Rarely or never wore a seat belt
% o
f stu
dent
s wh
oen
gage
d in
beh
avio
r
Mostly A's Mostly B's Mostly C's Mostly D's/F's
United States Youth Risk Behavior Survey, 2009
*When riding in a car driven by someone else.**p<.0001 after controlling for sex, race/ethnicity, and grade level.

Percentage of High School Students Who Rode With A Driver Who Had Been Drinking Alcohol,* by Type of Grades
Earned (Mostly A’s, B’s, C’s or D’s/F’s), 2009**
*In a car or other vehicle one or more times during the 30 days before the survey.**p<.0001 after controlling for sex, race/ethnicity, and grade level.
United States, Youth Risk Behavior Survey, 2009

Percentage of High School Students Who Drove a Car or Other Vehicle When They Had Been Drinking Alcohol,* by Type of Grades Earned (Mostly
A’s, B’s, C’s or D’s/F’s), 2009**
*One or more times during the 30 days before the survey.**p<.0001 after controlling for sex, race/ethnicity, and grade level.
United States, Youth Risk Behavior Survey, 2009
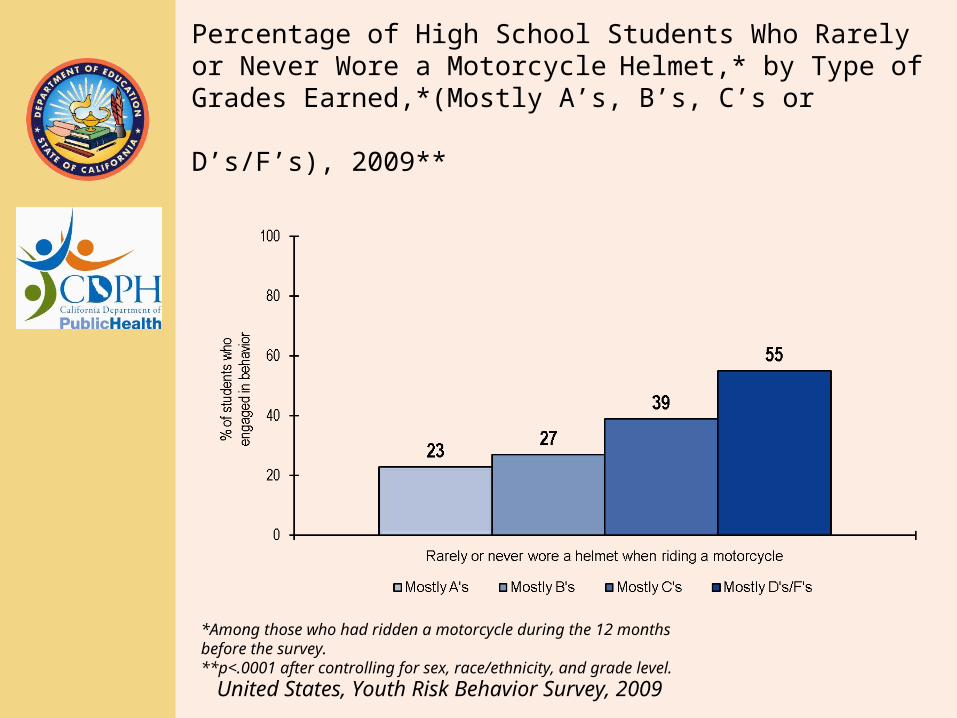
Percentage of High School Students Who Rarely or Never Wore a Motorcycle Helmet,* by Type of Grades
Earned,*(Mostly A’s, B’s, C’s or D’s/F’s), 2009**
*Among those who had ridden a motorcycle during the 12 months before the survey.**p<.0001 after controlling for sex, race/ethnicity, and grade level.
United States, Youth Risk Behavior Survey, 2009

Percentage of High School Students Who Carried a
Weapon,* by Type of Grades Earned (Mostly A’s, B’s, C’s or D’s/F’s), 2009**
* For example, a gun, knife, or club on at least 1 day during the 30 days before the survey.**p<.0001 after controlling for sex, race/ethnicity, and grade level.
United States, Youth Risk Behavior Survey, 2009

Percentage of High School Students Who Carried a Gun,* by Type of Grades Earned (Mostly A’s, B’s, C’s or D’s/F’s),
2009**
*On at least 1 day during the 30 days before the survey.**p<.0001 after controlling for sex, race/ethnicity, and grade level.
United States, Youth Risk Behavior Survey, 2009
Percentage of High School Students Who Were in a
Physical Fight,* by Type of Grades Earned (Mostly A’s, B’s, C’s or D’s/F’s), 2009**
*One or more times during the 12 months before the survey.**p<.0001 after controlling for sex, race/ethnicity, and grade level.
United States, Youth Risk Behavior Survey, 2009

Percentage of High School Students Who Were in a
Physical Fight on School Property,* by Type of Grades Earned (Mostly A’s, B’s, C’s or D’s/F’s), 2009**
*One or more times during the 12 months before the survey.**p<.0001 after controlling for sex, race/ethnicity, and grade level.
United States, Youth Risk Behavior Survey, 2009
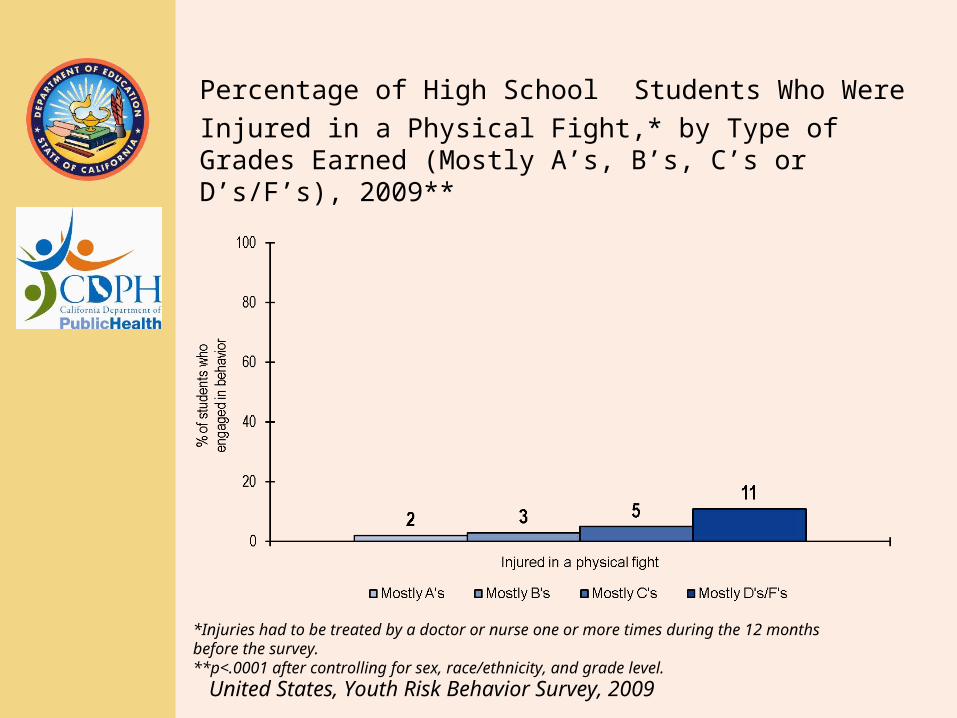
Percentage of High School Students Who Were Injured in a
Physical Fight,* by Type of Grades Earned (Mostly A’s, B’s, C’s or D’s/F’s), 2009**
*Injuries had to be treated by a doctor or nurse one or more times during the 12 months before the survey.**p<.0001 after controlling for sex, race/ethnicity, and grade level.
United States, Youth Risk Behavior Survey, 2009

Percentage of High School Students Who Experienced
Dating Violence,* by Type of Grades Earned (Mostly A’s, B’s, C’s or D’s/F’s), 2009**
*Hit, slapped, or physically hurt on purpose by their boyfriend or girlfriend during the 12 months before the survey.**p<.0001 after controlling for sex, race/ethnicity, and grade level.
United States, Youth Risk Behavior Survey, 2009
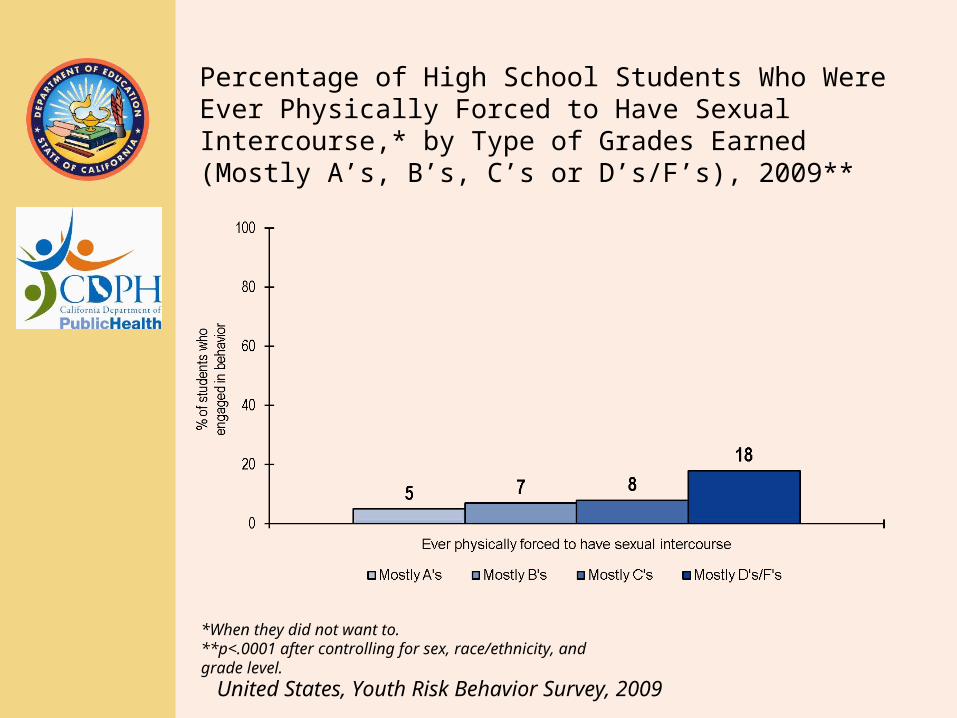
Percentage of High School Students Who Were Ever Physically Forced to Have Sexual Intercourse,* by Type of Grades Earned (Mostly A’s, B’s, C’s or D’s/F’s), 2009**
*When they did not want to.**p<.0001 after controlling for sex, race/ethnicity, and grade level.
United States, Youth Risk Behavior Survey, 2009

Percentage of High School Students Who Were Threatened
or Injured With a Weapon on School Property,* by Type of Grades Earned (Mostly A’s, B’s, C’s or D’s/F’s), 2009**
*For example, a gun, knife, or club one or more times during the 12 months before the survey. **p<.0001 after controlling for sex, race/ethnicity, and grade level.
United States, Youth Risk Behavior Survey, 2009

Percentage of High School Students Who Did Not Go to School Because They Felt Unsafe at School or on Their Way to or From School,* by Type of Grades Earned(Mostly A’s, B’s, C’s or D’s/F’s), 2009**
*On at least 1 day during the 30 days before the survey.**p<.0001 after controlling for sex, race/ethnicity, and grade level.
United States, Youth Risk Behavior Survey, 2009
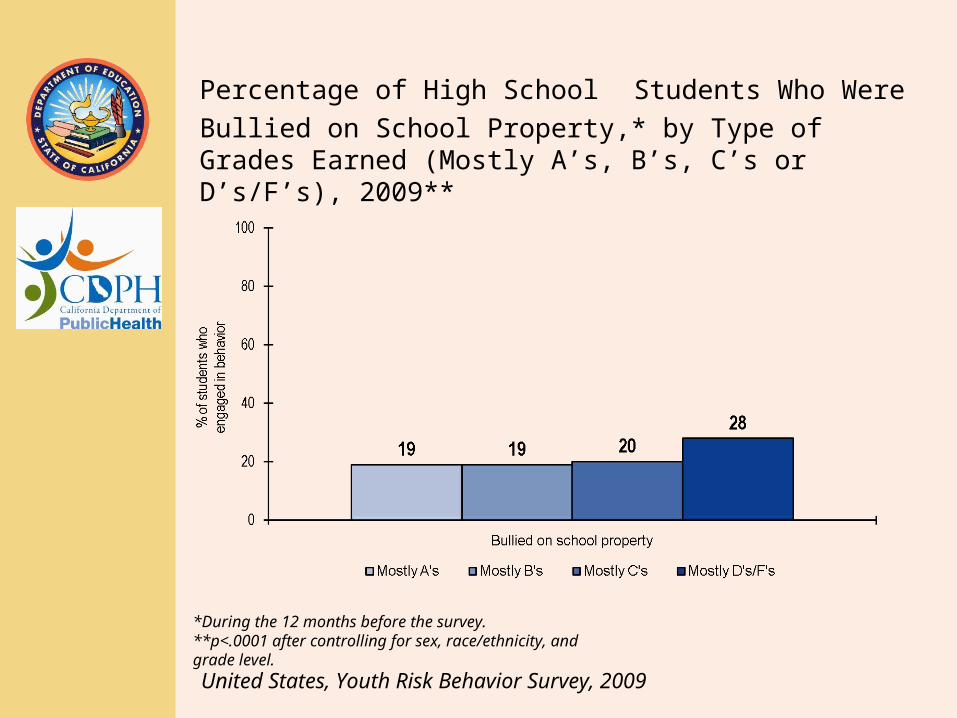
Percentage of High School Students Who Were Bullied on
School Property,* by Type of Grades Earned (Mostly A’s, B’s, C’s or D’s/F’s), 2009**
*During the 12 months before the survey.**p<.0001 after controlling for sex, race/ethnicity, and grade level.
United States, Youth Risk Behavior Survey, 2009

Percentage of High School Students Who Felt Sad or
Hopeless,* by Type of Grades Earned (Mostly A’s, B’s, C’s or D’s/F’s), 2009**
*Almost every day for 2 or more weeks in a row so that they stopped doing usual activities during the 12 months before the survey.**p<.0001 after controlling for sex, race/ethnicity, and grade level.
United States, Youth Risk Behavior Survey, 2009

Percentage of High School Students Who Seriously Considered Attempting Suicide,* by Type of Grades Earned (Mostly A’s, B’s, C’s or D’s/F’s), 2009**
*During the 12 months before the survey.**p<.0001 after controlling for sex, race/ethnicity, and grade level.
United States, Youth Risk Behavior Survey, 2009

Percentage of High School Students Who Made a Suicide
Plan,*by Type of Grades Earned (Mostly A’s, B’s, C’s or D’s/F’s), 2009**
*During the 12 months before the survey.**p<.0001 after controlling for sex, race/ethnicity, and grade level.
United States, Youth Risk Behavior Survey, 2009

Percentage of High School Students Who Attempted
Suicide,* by Type of Grades Earned (Mostly A’s, B’s, C’s or D’s/F’s), 2009**
*One or more times during the 12 months before the survey. **p<.0001 after controlling for sex, race/ethnicity, and grade level.
United States, Youth Risk Behavior Survey, 2009

Percentage of High School Students Whose Suicide Attempt
Resulted in an Injury, Poisoning, or an Overdose That Had to be Treated by a Doctor or Nurse,* by Type of Grades Earned (Mostly A’s, B’s, C’s or D’s/F’s), 2009**
*During the 12 months before the survey. **p<.0001 after controlling for sex, race/ethnicity, and grade level.
United States, Youth Risk Behavior Survey, 2009