android app for automatic web page classification thesis.pdfandroid app for automatic web page...
TRANSCRIPT
Imagem
Diego Salas Ugalde
Android app for Automatic Web Page Classification Analysis of Text and Visual Features
July 2015


Departamento de Engenharia Electrotécnica e de Computadores
Faculdade de Ciências e Tecnologia
Universidade de Coimbra
A Dissertation
For Graduate Study in MSc Program
Master of Science in Electrical and Computer Engineering
Android app for Automatic Web Page Classification
Analysis of Text and Visual Features
Erasmus Student: Diego Salas Ugalde
Research Developed Under Supervision of
Prof. Doutor Nuno Miguel Mendonça da Silva Gonçalves
Jury
Prof. Doutor Fernando Manuel dos Santos Perdigão
Prof. Doutor Nuno Miguel Mendonça da Silva Gonçalves
Prof. Doutor Paulo José Monteiro Peixoto
July 2015


Acknowledgements
After four years of study I would like to thank many people who supported me in
my professional career and in my staying at University of Coimbra as an
Erasmus student.
I would first really like to express my gratefulness to my parents who have been
always supporting me in every step I have wanted to take. They have been
really supportive to me and they let me come to Coimbra to write my final
dissertation which it was one of my professional dreams.
To my supervisor Nuno Gonçalves, I would like to express my appreciation for
helping me in every single step of this dissertation. His patience, rigor and
thoroughness have really helped me to believe more in work and learn how to
work in an appropriate way.
I also would like to acknowledge my huge gratitude to Samuel for being very
supportive to me and giving me the effort and courage to go on.
To my friends for being there taking care of me and to all the Computer Vision
lab for being just great lab mates to work with and help me to know another way
of working from I was used to do back in Spain.
And least but not last, I would like to thank my home university, Universidad
Pública de Navarra, for giving me the possibility of doing the final dissertation at
University of Coimbra.
Extending my sincere gratitude and appreciation to everyone who has made
this possible,
Diego Salas Ugalde


Abstract
Internet keeps growing everyday and with that, the creation of new web
pages. Due to this fact, web pages of many different categories can be found
such as News, Sports or Business. This issue has made investigators think
about one innovative concept: Webpage Classification. This new approach
implies the categorization of web pages to one or more category labels. Some
research has been done during the last years using text and visual content
extracted from the web pages to be able to classify. However, the need of being
able to do such a thing in an Android app has not been investigated yet, to the
best of our knowledge.
Consequently, this thesis is focused in the development of an Android
app which is able to classify web pages. First of all, text and visual features
have to be extracted from each webpage.
Four types of visual features were extracted from each web page to
construct a visual features vector of 160 attributes. Concerning to the text
features, a text features vector was also built for each of the webpage with 160
attributes. To do so, a “Bag-Of-Words” of one hundred and sixty words was set
up from the HTML code already extracted and filtered. Thus, we end up having
a full vector of 320 attributes for each webpage. A binary classification was
performed trying to distinguish web pages for Adults and for Kids.
Good results were obtained especially when using AdaBoost classifier
with text and visual features where a 94.44% of accuracy of correct
classifications was achieved.
Keywords: Web page classification, feature extraction, Adults, Kids, term
frequency-inverse document frequency, Android.


Contents
1 Introduction 1
1.1 Aims and objectives 3
1.2 State-of-the-art 4
1.3 Contribution 7
1.4 Thesis outline 8
2 Web page classification 9
2.1 Feature extraction 9
2.1.1 Visual Features 9
2.1.2 Text Features 11
2.2 Feature fusion 14
2.3 Machine Learning 14
2.3.1 WEKA 15
2.3.1.1 DataSet 17
2.3.1.2 Classifiers 20
2.3.1.3 Weka.filters 20
2.3.1.4 Weka.classifiers 21
3 Android 23
3.1 Android application 24
4 Results 32
5 Conclusions 44
References 46

List of Figures
1.1 Graphic of the grow of the number of web sites in this century. 1
2.1 WEKA toolkit’s interface. 16
2.2 Example of an ARFF file to train a classifier. 18
3.1 ARFF file used to test a classifier. 26
3.2 Two screenshots taken from the app. The left image shows how
the app is displayed to the user and the right one the screen the user
and see after clicking in one of the classifiers. 27
3.3 Screenshots taken from the app. 28
3.4 Screenshot of the app taken when the screenshot of the webpage
is being got. 29
3.5 Screenshot taken once the features are extracted and the results is
given to the user. 30
4.1 Screenshot taken with the app of an adult webpage called
www.cdc.gov . 33
4.2 Screenshot taken with the Android app of the kids webpage
www.capstonekids.com. 34
4.3 Graphic showing the results obtained with the three classifiers used
using text, visual and both features. 37
4.4 Screenshot of a kids web page classified as an Adults by the app. 42

List of Tables
4.1 The three confusion matrix obtained using J48 classifier. 38
4.2 The three confusion matrix obtained using Naive Bayes classifier. 39
4.3 The three confusion matrix obtained using Ada Boost classifier. 41

1
Chapter 1
Introduction
It is known that nowadays, the field of Information Technology is
constantly evolving. In this big field of study, many operating systems are
emerging and new are also appearing. Besides, the World Wide Web is
invariably growing and with that, the number of web pages is increasing
significantly as it is clearly shown in Figure 1.1.
Figure 1.1: Grow of the number of websites in this century. [1]
A web page is a document commonly written in Hyper Text Markup
Language (HTML) that is accessible through the Internet or other network using
a browser. Due to this fact, the concept of web pages classification has been
released and deeply investigated. Web page classification is essential for many

2
tasks such as focused crawling, which is a software application that
systematically browses the World Wide Web by collecting web pages that
satisfy some definite property; assistance in the development of web directories;
quality improvement of web search; aid in the analysis of the topical structure of
the web; spam avoidance or web filtering.
Web pages have improved significantly their appearance since the first
web pages were created 22 years ago. In the task of web pages classification
some of their content is critical. Web pages need to attract the attention of the
users to make them feel satisfying when using them. Thus, the design of a web
page is really important. The visual structure of web pages of a particular
subject or category tends to have similarities so that users feel familiar with
them. Hence, the visual content of the web page contains important information
and can help in web page classification.
A web page can contain various types of information, which is able to be
seen, heard or interacted with by the end user. Textual, non-textual and
interactive information can be directly perceived by the end user when using the
web page. Examples of these can be static images, audio or video. Anyhow, not
all of that information is crucial for web page classification. Visual features and
text features were used in this thesis to do the classification.
A typical web page classification process consists in the following steps:
extraction of visual and text features for the training web pages; creation of a
feature vector for each web page, one based on visual features and the other in
text features; reducing the dimensionality of the feature vectors if necessary;
create a classifier by learning over the training feature vectors and finally,
classify new web pages using that classifier.
As mentioned above, new operating systems are growing such as
Android. Android powers more than a billion devices across the globe including
mobile phones and tablets. This implies many users are familiarized with the
world of apps. Combining this idea with the web page classification one, it is

3
feasible to think about doing a web page classification application in Android.
Based on this concept this thesis work was done.
1.1 Aims and objectives
The aim of this dissertation is to build an Android application which enables
to perform web pages classification by analyzing the visual and text appearance
of web pages. Concerning to the visual appearance, a screenshot of each web
page is taken. That way we are able to get the web page as it appears to the
user. Regarding to the text appearance, HTML code is used. Both visual and
text are then used in this thesis to achieve the aim already mentioned above.
The motivation behind this dissertation is mainly based upon two works
[2] [3]. In these papers, the authors confirmed that by using generic visual
features, classifying web pages for several different types of tasks was viable.
Using a binary classification, they classified web pages by two different
subjective variables: their aesthetic value (whether one page is ugly or
beautiful) and by their recency (whether one page have an old or a new design).
They obtained good outcomes, mainly for the binary classification. This
dissertation is also based on the WEKA toolkit [4] in which two classifiers are
constructed: the Naive Bayes and a decision tree learning algorithm (J48). In
this thesis, both binary classification and the WEKA toolkit were used.
The web page classification problem can be divided in a multi-label
classification or in a binary classification problem, depending on the number of
categories in which web pages are intended to be classified. In this work binary
classification was implemented. The aim was to find out if a web page owned to
Kids or Adults category.
1.2 State-of-the-art
The task of Web page classification has been deeply investigated in the
last years, and many algorithms have been implemented to do such a process.
4
Web pages are text documents mostly written in HTML, which enclose
supplementary information, such as HTML tags, hyperlinks and anchor texts.
The features that are useful in web page classification can be classified into:
on-page features, which are directly located on the page to be classified, and
features of neighbors, which are located on the pages related in some way with
the page which is going to be classified [5].
Nevertheless, web page classification presents some problems which can
be divided into multiple sub-problems as they will be explained in this
paragraph. Firstly, subject classification. It involves about the topic of a web
page (i.e., news, blogs, kids, adults). Secondly, functional classification which
implies which is the role the web page plays (e.g., personal home page, course
page or admission page). Another sub-problem is sentiment classification. It is
directed to the opinion that is cited in a web page, (i.e., the author’s attitude
about some particular topic). And the last sub-problem which is claimed could
be referred as other types of classification. This includes genre classification
(e.g., [6]), search engine spam classification (e.g., [7]) and much more.
Due to the fact we are interested in the words which are contained in the
HTML code, web pages were preprocessed to discard the less important data
such as HTML tags, stop words and rare words.
However, recent studies have revealed that the information contained in
the HTML structure could also be useful in the web page classification. Besides,
also the URL of the web pages has been proved to contain information that is
useful to help in this task. This approach is investigated in M. Kan and H. Thi [8]
and M.Kan [9]. This proposal is quicker than the traditional approaches by
implying that full texts contained in the web pages are not needed to be
analyzed. Their results show that this method is not clearly better than using
full-text and links. On the other side, Riboni [10] exploits the information
provided by the HTML structure and by the presence of hyperlinks. To exploit
the HTML structure five different text sources were tested. These were the
body, meta, title, mt (meta and title) and bmt (body, meta and title). With these

5
tests, the meta tag and the title of the web page were found to be the most
helpful sources to the categorization process.
Once the words from HTML code are extracted, it is known that not all of
them have the same importance. To calculate the importance of a term, the
frequency of a document containing that word and the specific tag of the HTML
structure are used [11]. This weighting method was named as "Structure-
oriented Weighting Technique (SWT)". To use the hyperlink information, in
Riboni’s paper a new method was developed in which downloading the web
page was not necessary. It only used the anchor of the hyperlink, which is the
text presented to the user to identify the link. A new method was also developed
by combining the local and the hyperlink representation.
Using information derived from HTML tags can boost the classifiers
performance as it can be shown in [12]. Golub and Ardö determined how
significance indicators assigned to different web page elements (internal
metadata, title, headings and main text), influence automated classification.
They showed that the best results were achieved from a well-turned linear
combination of those four elements of the web page.
S. Tice [13] proposed another approach of classifying web pages by using
the Yioop search engine with active learning. Yioop search engine is a search
engine similar to Google and Yahoo search engine but in which only a data set
of web pages previously entered by the user was used. In this method a
function to the Yioop search engine was developed to automatically assign
labels to the web pages. The users could create multiple classifiers, which
would be trained first in a small set of labeled documents and then improved
after repeated rounds of active learning.
Vaghela et al. [14] approach the web page classification problem by using
Term Frequency (tf). They built a method that calculated the tf of the stem of a
term for each HTML tag. By combining the stemmed term frequency and each
of the tag, a feature could be formed.

6
Gonçalves and Videira [3] developed a method of web page classification
using visual features based in Boer et al. [2]. With features extracted from the
visual content of a web page, they classified the web pages by their topic,
aesthetic value and recency. Two different approaches were used. The first one
consisted in the creation of a descriptor of the web page by using its low-level
features extracted from a web page screenshot. Color and edge histograms, as
well as Gabor and Tamura features were extracted. The second approach
implied using a BoW (Bag Of Words) model to transform the SIFT local features
and build a dictionary to represent each web page.
A web page classification approach based on the visual content was also
implemented by Asirvatham et al. [15]. In this paper, a number of visual
features, as well as textual features, were used. They proposed a method for
automatic categorization of web pages into a few broad categories based on the
structure of the web documents and the images presented on them.
Another approach was proposed by Kovacevic et al. [16], where a page is
represented as a hierarchical structure, in which nodes represented simple
HTML objects, texts and images while directed edges reflected spatial relations
on the browser screen. Also using the visual information contained in that
structure, heuristics rules are able to be defined. This implies they are applied to
recognize multiple logical areas, which belong to different parts of the web
page. These studies and [17] prove that the visual representation is useful and
can be used in web page classification. It also implies and reinforces the idea
that there is one big disadvantage when using only text features. This is that, if
only text features are used, everything will depend on the language and
nowadays, it is a huge problem due to the fact the majority of classifiers are
built for the English Language.

7
1.3 Contribution
The first contribution is the construction of algorithms of feature extraction
in Java programming language using the OpenCV library in Eclipse as well as
Android Studio for the application. The extraction of well-known low-level
features was done. These features are the Edge and Color Histogram, Gabor
and Tamura Features. Also text features were extracted by taking the HTML
code of each webpage and removing from there some characteristics by using
the Jsoup library. Two datasets were created too in order to train and test the
classifiers. Different classifiers are evaluated using the WEKA toolkit directly
implemented in the Java code in Eclipse and also in Android Studio. Later on,
the results will be exposed.
1.4 Thesis outline
This thesis is organized in the following chapters. In chapter 2 the entire
theoretical basis behind the web classification process is explained including
feature extraction of both visual and textual information, feature fusion in order
to build a single vector for each web page, machine learning with WEKA toolkit
and the train and test phase. In chapter 3, Android is introduced as a new task
to this thesis. The construction of an Android application which is able to
perform web pages classification is explained. Subsequently, in chapter 4, the
results of the test phase after have trained the classifiers are exposed as well
as the accuracy of the app performance. Finally, in chapter 5, conclusions to
this thesis work are introduced as well as ideas to possible future work which
could be done.

8

9
Chapter 2
Web Page Classification
This chapter presents the main theoretical idea in which this work is
based. The fundamental concepts of web page classification will be deeply
detailed. This involves the description of how all the features are extracted from
each of the webpage and how the vectors are correctly built. Machine Learning
will also be introduced in this chapter due to the fact that it is highly important in
the classification process once the vectors are extracted and accurately
produced. To conclude, train and test phases made with different classifiers will
be analyzed.
2.1 Feature Extraction
Feature Extraction can be seen as the first step in the classification
process. Two main features are considered in this dissertation. These are
Visual and Text features. Thus, from each web page visual and text features will
be extracted. After that, a vector of 320 attributes for each of the web page is
built.
2.1.1 Visual Features
In [18] the concept of feature in computer vision and image processing is
referred to a piece of information which is relevant and distinctive. As it was
mentioned above, visual features are used in this thesis as one of the main
differences from other previous works since visual features have been rarely
applied when performing web page classification. In this dissertation, four
different features were extracted from the visual content of the web pages.
These are Color Histogram, Edge Histogram, Gabor Features and Tamura

10
Features. To achieve this, a screenshot of each of the webpage is needed.
Therefore, those features already mentioned can be extracted using OpenCV
library. A vector of a total of 160 attributes is built based only on these visual
features.
Color Histogram: It is a depiction of the distribution of the colors
presented in an image. In this thesis, that image is the screenshot
of each of the web pages. It can be built in any color space but the
one used in this work was the RGB color space. 32 bins were
extracted for this feature, what implies that 32 attributes of that
160-attribute-vector belong to this feature.
Edge Histogram: An edge is a curve that follows a path of rapid
change in image intensity. This Edge Histogram represents the
distribution of edges orientations in the image. To extract it, the
image is divided into a fixed number of sub-images and the local
edge distribution for each sub image is represented by a
histogram. The number of bins extracted was 80. In other words,
80 attributes of the vector correspond to Edge Histogram.
Gabor Features: they are obtained by convolving the image with a
Gabor filter. A Gabor filter is a linear band-pass filter whose
impulse response is defined as a Gaussian function modulated
with a complex sinusoid called the mother wavelet. It is used for
edge and texture detection. Gabor features are sensitive to
different scales and frequencies. These properties are useful
when texture analysis is required. For the Gabor features 36 bins
were extracted.
Tamura Features: Tamura et al. [19] propose six types of features
among Tamura. These were coarseness, contrast, directionality,
line-likeness, regularity and roughness. After several tests, that

11
work concluded that the first three mentioned above were the
most significant ones. However, in this dissertation only contrast
and directionality were used due to the fact coarseness dragged
out the process. Contrast aims to capture the dynamic range of
gray levels in the image together with the polarization of the
distribution of black and white. Directionality is a global property
over a region. It does not aim to differentiate between different
orientations or patterns, but it measures the total degree of
directionality. This is measured using the frequency distribution of
oriented local edges against their directional angles. 6 bins of
each Tamura feature were extracted which implies a total amount
of 12 bins. These are reflected in 12 attributes in the final visual
vector.
2.1.2 Text Features
Text features were also extracted from each of the web page. To
calculate those attributes represented in the vector, some concepts have to be
introduced. These concepts are TF-IDF [20], Bag Of Words (BoW) and Vector
Space Model (VSM) [21].
TF-IDF stands for term frequency-inverse document frequency, and its weight is
often used in information retrieval and text mining. This weight is a statistical
measure used to evaluate how important a word is to a document in a
collection. The importance rises equitably to the number of times a word
appears in the document but it is offset by the frequency of the word in the
corpus or collection of documents. Variations of the TF-IDF weighting scheme
are often used by search engines as a central tool in scoring and ranking a
document's relevance given a user query. One of the simplest ranking functions
is computed by summing the TF-IDF for each query term; many more
sophisticated ranking functions are variants of this simple model. TF-IDF can
also be successfully used for stop-words filtering in various subject fields
including text summarization and classification.

12
Typically, the TF-IDF weight is composed by two terms: the first computes
the normalized Term Frequency (TF). This is the number of times a word
appears in a document, divided by the total number of words present in that
document. The second term is the Inverse Document Frequency (IDF),
computed as the logarithm of the number of documents in the collection divided
by the number of documents where the specific term appears.
TF: Term Frequency, which measures how frequently a term occurs in a
document. Since every document is different in length, it is possible that
a term would appear more often in long documents than in shorter ones.
Thus, the term frequency is often divided by the document length as a
way of normalization:
(2.1)
Being:
IDF: Inverse Document Frequency, which measures how important a
term is. While computing TF, all terms are considered equally important.
However it is known that certain terms, such as "is", "of", and "that", may
appear a lot of times but have little importance. Thus we need to weigh
down the frequent terms while scale up the rare ones, by computing the
following:
(2.2)
Being:
TD = Total number of documents.

13
In this work, words with less than 3 letters were removed to avoid this
problem too.
Another important concept used in this thesis is Bag-Of-Words. It is a
clarifying representation used in natural language processing and information
retrieval. A text is then represented as a bag of its words, disregarding grammar
and even word order but keeping multiplicity.
As the name suggests, a “bag” is created with the words that have more
importance. Based on this “bag" (dictionary), the features are extracted. The
dictionary of text words can be built in diverse ways, like the most repeated
words of each category, the most repeated words in all the documents or even
using a threshold for the IDF values. After the dictionary creation or the “bag”,
the features are extracted from the documents. After that, the document is in
the VSM. It is a vector that can represent the absolute frequency of the words
(number of times), the presence or absence of the words (binary) and the
importance of the word in the document or sentence that is being evaluated
(TF-IDF). In this work absolute frequency of the terms is used. In other words, it
is the number of times a term of the Bag-Of-Words is in the document which the
vector is going to be extracted from.
The Vector Space Model (VSM) is an algebraic model to represent text
information as a vector. In other words, it is a space where the text is
represented as a vector of values instead of a text string. As it was explained in
last paragraph, in this work, each of the attribute of the text features vector
represent the absolute frequency of each word of the “bag” in the document.
These features are related to a single word and measure the importance
of that word in the document.
2.2 Feature Fusion
One of the main objectives of this dissertation was to show that visual
features have important information to help in the classification process. To

14
accomplish this, the features fusion of different types needs to be considered.
Once text features vectors as well as visual features were extracted, the fusion
of those was executed. All the features extracted were normalized to the [0,1]
scale.
Thus, a huge vector of 320 attributes for each web page was finally
achieved when doing test with both visual and text information. Obviously, a
vector only with text information will have 160 attributes and with visual
information 160 attributes.
2.3 Machine Learning
Machine Learning is a huge field in computer science and a subfield of
Artificial Intelligence (AI). It is devoted to the development of algorithms and
techniques that allow the machine to learn to recognize patterns or predict
future trends or behavior. At present, many machine learning algorithms are
used without even knowing.
In 1959, Arthur Samuel [22] defined Machine Learning as:
”Field of study that gives computers the ability to learn without being explicitly
programmed”. A recent and formal definition of Machine Learning was given by
Tom Mitchell [23]. In that paper the following was stated:
”A computer program is set to learn from an experience E with respect to some
task T and some performance measure P if its performance on T as measured
by P improves with experience E”
There are many ML problems, but this work is focused on classification
problems, which is the goal to categorize objects into a fixed set of categories
(e.g., optical character recognition, face detection, spam filtering, topic spotting,
medical diagnosis, weather prediction, webpage classification and much more).
The next sections approach the algorithm type of ML used in this work and
some of the algorithms built to do classification.
15
There are too many ways to realize machine learning. Next, some of
them are explained. There is supervising learning, where the computer is
exposed to a set of examples that are previously labeled, to establish a set of
characteristics or rules enabling it to later identify and classify new examples.
Another approach of machine learning is the unsupervised learning. In this type
of machine learning it is not given any type of indication to the computer about
some type of grouping. All the examples are given to the classifiers, without any
type of label. The classifier finds out common characteristics to group different
types of data.
Machine learning algorithms, when conducting the training phase, are
able to analyze the features and adjust their parameters to enhance their
performance. This process of parameter adjustment is the goal of the term
learning.
In this work, supervised learning was adopted. In this dissertation, WEKA toolkit
was implemented which will be explained in section 2.4.
2.3.1 WEKA
WEKA is a collection of machine learning algorithms for data mining
tasks. These algorithms, called Classifiers in WEKA, can either be applied
directly to a dataset or called from your own Java code. In this thesis they are
called form the Java code. WEKA also contains tools for data pre-processing,
classification, regression, clustering, association rules, and visualization. It is
well-suited for developing new machine learning schemes too.
WEKA (Waikato Environment for Knowledge Analysis) is also a popular
suite of machine learning software written in Java, developed at the University
of Waikato, New Zealand. WEKA is a free software available under the GNU
General Public License which is a free, copy left license for software.
Moreover, WEKA can be also defined as a workbench that contains a
collection of visualization tools and algorithms for data analysis and predictive

16
modeling, together with graphical user interfaces for easy access to this
functionality. The original non-Java version of WEKA was primarily designed as
a tool for analyzing data from agricultural domains, but the more recent
fully Java-based version (WEKA 3), for which development started in 1997, is
now used in many different application areas, in particular for educational
purposes and research. The main interface of WEKA toolkit is shown in Figure
2.1.
Advantages of WEKA include:
Free availability under the GNU General Public License.
Portability, since it is fully implemented in Java programming language and
thus runs on almost any modern computing platform.
A comprehensive collection of data preprocessing and modeling techniques.
Ease of use due to its graphical user interfaces.
It is available in platforms as Android Studio.
WEKA toolkit suppots several standard data mining tasks, more specifically,
data preprocessing, clustering, regression, visualization and feature selection.
All of WEKA techniques are declared on the assumption that the data is
available as a single flat file or relation, where each data point is described by a
fixed number of attributes.
In this work, WEKA was directly implemented in Java code. To
understand how this is developed, some basic concepts are needed to be
described such as dataset, classifier, weka.filters and weka.classifiers.

17
2.3.1.1 Dataset
A set of data items, the dataset, is a very basic concept of machine
learning. In WEKA toolkit, it is implemented by the weka.core.Instances class. A
dataset is a collection of examples, each one of the weka.core.Instance class.
Each Instance consists of a number of attributes, any of which can be nominal,
numeric or a string. Additional types are date and relational, which are not
covered here but they will be explained later in this section when covering
ARFF.
The external representation of an Instance class is an ARFF file, which
consists of a header describing the attribute types and the data as comma-
separated list. An ARFF (Attribute-Relation File Format) file is an ASCII text file
that describes a list of instances sharing a set of attributes. ARFF files have two
distinct sections. The first section is the Header information, which is followed
by the Data information. The Header of the ARFF file contains the name of the
relation, a list of the attributes (the columns in the data), and their types. An
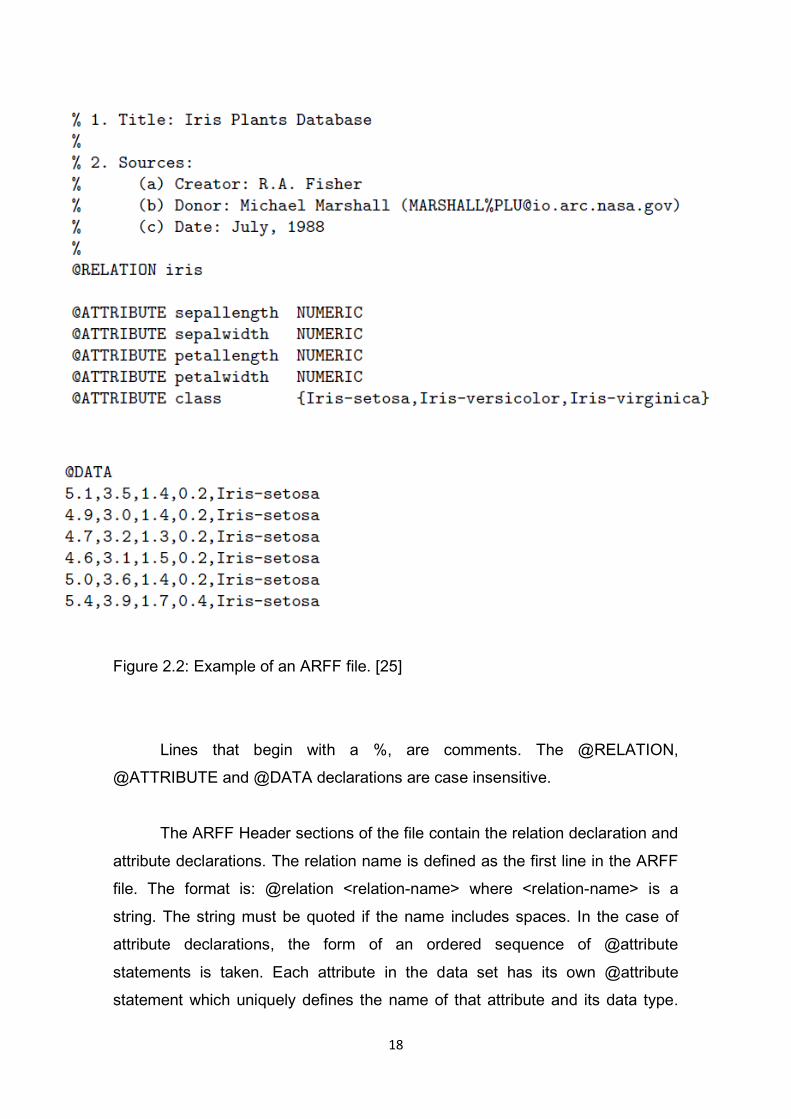
example header on the standard IRIS dataset looks as it is shown in Figure 2.2.
Figure 2.1: WEKA interface. [24]
18
Figure 2.2: Example of an ARFF file. [25]
Lines that begin with a %, are comments. The @RELATION,
@ATTRIBUTE and @DATA declarations are case insensitive.
The ARFF Header sections of the file contain the relation declaration and
attribute declarations. The relation name is defined as the first line in the ARFF
file. The format is: @relation <relation-name> where <relation-name> is a
string. The string must be quoted if the name includes spaces. In the case of
attribute declarations, the form of an ordered sequence of @attribute
statements is taken. Each attribute in the data set has its own @attribute
statement which uniquely defines the name of that attribute and its data type.

19
The order the attributes are declared indicates the column position in the data
section of the file. For example, if an attribute is the third one declared then
Weka expects that all that attributes values will be found in the third comma
delimited column. The format for the @attribute statement is: @attribute
<attribute-name> <datatype>, where the <attribute-name> must start with an
alphabetic character. If spaces are included in the name then the entire name
must be quoted. The <datatype> can be any of the four types supported by
Weka:
• numeric
• integer is treated as numeric
• real is treated as numeric
• <nominal-specification>
• string
• date [<date-format>]
• relational for multi-instance data (for future use)
<nominal-specification> and <date-format> are defined below.
The keywords numeric, real, integer, string and date are case insensitive.
Numeric attributes can be real or integer numbers and nominal values are
defined by providing a <nominal-specification> listing the possible values:
<nominal-name1>, <nominal-name2>, <nominal-name3>. For example, the
class value of the Iris dataset can be defined as follows:
@ATTRIBUTE class {Iris-setosa,Iris-versicolor,Iris-virginica}
2.3.1.2 Classifier
Any learning algorithm in WEKA is derived from the abstract
weka.classifiers.Classifier class. Surprisingly, little is needed for a basic
classifier: a routine which generates a classifier model from a training dataset
(buildClassifier) and another routine which evaluates the generated model on

20
an unseen test dataset (classifyInstance) or even generates a probability
distribution for all classes ( distributionForInstance).
A classifier model is an arbitrary complex mapping from all-but-one
dataset attributes to the class attribute. The specific form and creation of this
mapping, or model, differs from classifier to classifier. For example, ZeroR’s
(weka.classifiers.rules.ZeroR) model just consists of a single value: the most
common class, or the median of all numeric values in case of predicting a
numeric value ( regression learning). ZeroR is a trivial classifier, but it gives a
lower bound on the performance of a given dataset which should be
significantly improved by more complex classifiers. As such it is a reasonable
test on how well the class can be predicted without considering the other
attributes.
2.3.1.3 weka.filters
The weka.filters package is concerned with classes that transform
datasets by removing or adding attributes, resampling the dataset or removing
examples. This package offers useful support for data preprocessing, which is
an important step in machine learning.The weka.filters package is organized
into supervised and unsupervised filtering, both of which are again subdivided
into instance and attribute filtering.
2.3.1.4 weka.classifiers
Classifiers are at the core of WEKA. There are a lot of classifiers in
WEKA. In this work three of them were used which are defined below. We used
J48 tree, Naïve Bayes and AdaBoost which are explained as follows:
J48: It is an open source Java implementation of the C4.5 algorithm in
the WEKA data mining tool which is being explained in the current
chapter. C4.5 builds decision trees from a set of training data using the

21
concept of Information Entropy which basically is the expected value of
the information contained in one sample. The training data is a set of
already classified samples. At each node of the tree, C4.5 chooses the
attribute of the data that most effectively splits its set of samples into
subsets enriched in one class or the other. The splitting criterion is the
normalized information gain (difference in entropy). The attribute with the
highest normalized information gain is chosen to make the decision.
NAIVE BAYES: It is a family of simple probabilistic classifiers based on
Bayes’ theorem with strong independence assumptions between the
features. Bayes’ theorem is stated mathematically as the following
equation:
(2.3)
Where A and B are different events.
-P(A) and P(B) are the probabilities of A and B without regard to each
other.
- P(A|B) is the probability of A given that B is true.
- P(B|A), is the probability of B given that A is true.

22
ADABOOST: The word is an abbreviation of “Adaptive Boosting” and is a
machine learning meta-algorithm. It is usually referred to as the best out-
of-the-box classifier. It can also be used in combination with many other
types of learning algorithms to improve their performance. The output of
the other learning algorithms called weak learners, is combined into a
weighted sum that represents the final output of the boosted classifier.
AdaBoost is flexible in the sense that subsequent weak learners are
modified in favor of those instances misclassified by previous classifiers.

23
Chapter 3
Android
This chapter discusses one relevant part of this thesis work: Android.
Android is the name of a mobile operating system (OS) which is currently
developed by Google and based on the Linux Kernel. It is installed in more than
one billion devices in the whole world and it offers users access to Google’s
own services like YouTube or Gmail.
In this thesis, the main idea was to build an application based on Android
which is able to perform webpage classification with visual features. To do so,
Android Studio was found as the main solution. Android Studio is an integrated
development environment (IDE) for developing on the Android platform. It is
also based on JetBrains' IntelliJ IDEA software, Android Studio is designed
specifically for Android development. Besides, it is available for download
on Windows, Mac OS X and Linux, and replaced Eclipse Android Development
Tools (ADT) as Google's primary IDE for native Android application
development. In this work Windows was used. Finally, it can be said that it is
capable of building apps for Android phones, tablets, Android Wear, Android
TV, Android Auto and Google Glass.
3.1 Android application
In this section the application will be introduced and explained. First of
all, how the app was done and the tools needed to be applied in Android Studio
are going to be explained. Secondly, how the app looks like and how it works
will be described.

24
The name given to the application is WebClass and it weighs 47.08MB.
As it was mentioned above, the app was done to achieve an Android application
that performs web page classification. Three different classifiers have been
used in this dissertation: J48, Naive Bayes and AdaBoost. They were obviously
implemented in the application and each one is able to classify the webpage by
using text features, visual features or both of them.
For implementing the classifiers in Android, WEKA toolkit was needed as
it was explained in section 2.3.1. Thus, WEKA library was added to the Android
project as well as OpenCV library to be able to extract visual features. OpenCV
is a library of programming functions mainly aimed at real-time computer vision.
The library is cross-platform and free for use under the open-source BSD
license. Finally, for the text features Jsoup library was added. It is a Java library
for working with HTML words. It provides a very convenient API for extracting
and manipulating data, using the best of DOM, CSS and jquery-like methods.
Jsoup also allows many things such as to scrape and parse HTML form a URL,
file or string; find and extract data using DOM traversal or CSS selectors;
manipulate the HTML elements, attributes and text; clean user-submitted
content against a safe white-list to prevent XSS attacks or output tidy HTML. In
summary, Jsoup is designed to deal with all varieties of HTML found in the wild.
To extract the visual features, the application takes a screenshot of the
webpage. This is done using the concept of bitmap. That is to say, the app
loads the webpage in a WebView and it gets a screenshot of it by creating a
bitmap to get the height and weight of the screen. After this screenshot is taken,
using OpenCV library the visual features (Color Histogram, Edge Histogram,
Gabor and Tamura features) are extracted and therefore a 160 attribute-vector
is built.
To extract the text features HTML code is extracted from the URL that is
written by the user by using Jsoup library. After that, a filter is applied to be able

25
to extract the words of the HTML code. Once those words are saved in one file,
the 160 attribute-text-features-vector is built by using the BoW. This Bag Of
Words or BoW is used to extract the vector by using the concept of absolute
frequency. In other words, how many times a term, extracted from the html code
of a webpage, is in the BoW. This way, the vector is built.
Once visual vector and/or text vector are/is extracted, this feature vector
is included in the “@DATA” part of the ARFF extension test file used for
classification as explained above. The last attribute added instead of being the
name of the category is a “?” character letting WEKA “know” that this parameter
want to be guessed based on the training values the classifiers has. This
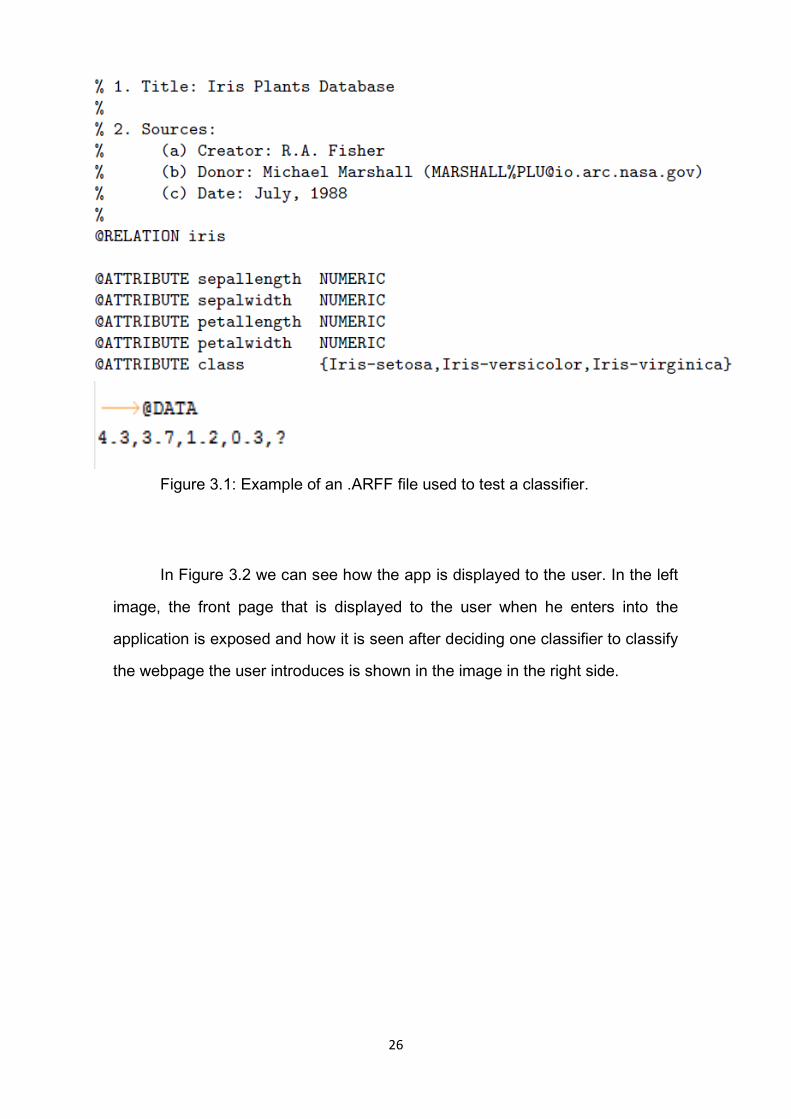
structure of the ARFF test file can be shown in Figure 3.1.
After this file is built and used to test the classifier selected by the user,
another ARFF file is obtained with the labeled value of the “?” character written.
So in that file, the result of the classification is shown. This value is showed to
the user in an Android Toast (a pop-up window which shows the result to the
user).
26
Figure 3.1: Example of an .ARFF file used to test a classifier.
In Figure 3.2 we can see how the app is displayed to the user. In the left
image, the front page that is displayed to the user when he enters into the
application is exposed and how it is seen after deciding one classifier to classify
the webpage the user introduces is shown in the image in the right side.

27
Figure 3.2: Two screenshots taken from the app. The left image shows how the
app is displayed to the user and the right one the screen the user can see after
clicking in one of the classifiers.
Once the user has chosen one of the classifier and has introduced one
URL in the field on the top of the screen; text features, visual features or even
both can be used to perform the classification.
28
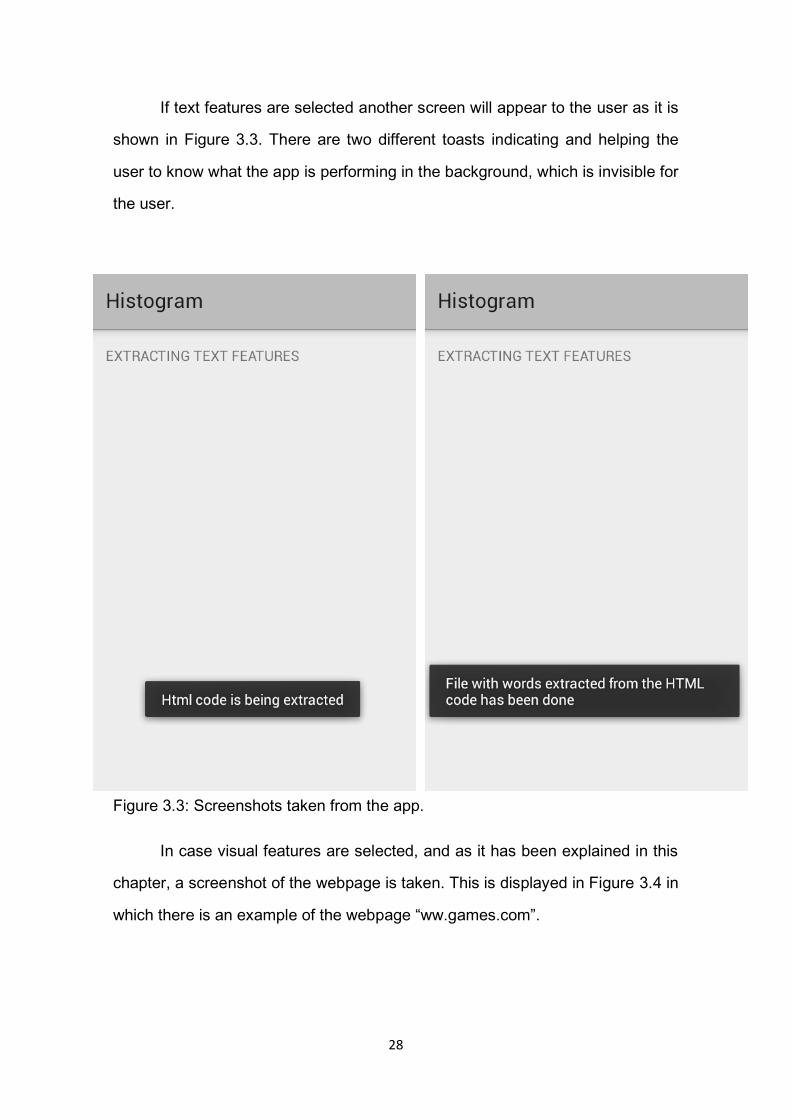
If text features are selected another screen will appear to the user as it is
shown in Figure 3.3. There are two different toasts indicating and helping the
user to know what the app is performing in the background, which is invisible for
the user.
Figure 3.3: Screenshots taken from the app.
In case visual features are selected, and as it has been explained in this
chapter, a screenshot of the webpage is taken. This is displayed in Figure 3.4 in
which there is an example of the webpage “ww.games.com”.

29
Figure 3.4: Screenshot of the app taken when getting the screenshot of the
webpage.
As we can see in Figure 3.4, the app enters the webpage and displays it
on the screen while advising the user with some Toast that he has to wait. This
webpage cannot be accessed, it is just an image showed to the user. However,
while extracting the visual features, the user can see the whole webpage due to
the fact it is a scrollable screen.
After the screenshot is taken, the user still sees the screen showed in Figure
3.4 but with different toasts telling that the app is extracting the visual features.
When this is done, the application goes back to the main screen already

30
showed in Figure 3.2 and new different toasts appear as it is shown in Figure
3.5.
It also has to be said that, when selecting Visual and Text features option to
classify, the visual part is performed before the text part. At the end, a result as
shown in Figure 3.5 is obtained.
Figure 3.5: Screenshot taken once the features are extracted and the result is
given to the user.

31
Those toasts indicate the last part of the classification process already
mentioned above as well as the result of the classification performance. As we
can see in Figure 3.5, www.nick.com has been classified as Kids (in a binary
classification between Adults and Kids). This toast with the correspondent
category will appear at the end of the classification.
Finally, in Figure 3.6, a flow chart of the app is shown to make it easier to
understand how the different steps of the app created in this dissertation are.
Figure 3.6: Flow chart of the application made.

32
Chapter 4
Results
In this dissertation, we tested the application with a binary classification.
This binary classification consists in distinguishing an Adult webpage from a Kid
webpage. To achieve that, two main steps can be identified: train and test
phase.
To perform this, a dataset is essential. To decide whether a webpage
belongs to Adults or Kids category there is not a gist, so they were decided
manually for the training dataset. It can be said that web pages for Adults were
selected among categories (not porn) such as news, banks and universities due
to the fact these web pages are not principally known to be for Kids.
In the other hand, Kids web pages were selected based on cartoons, TV
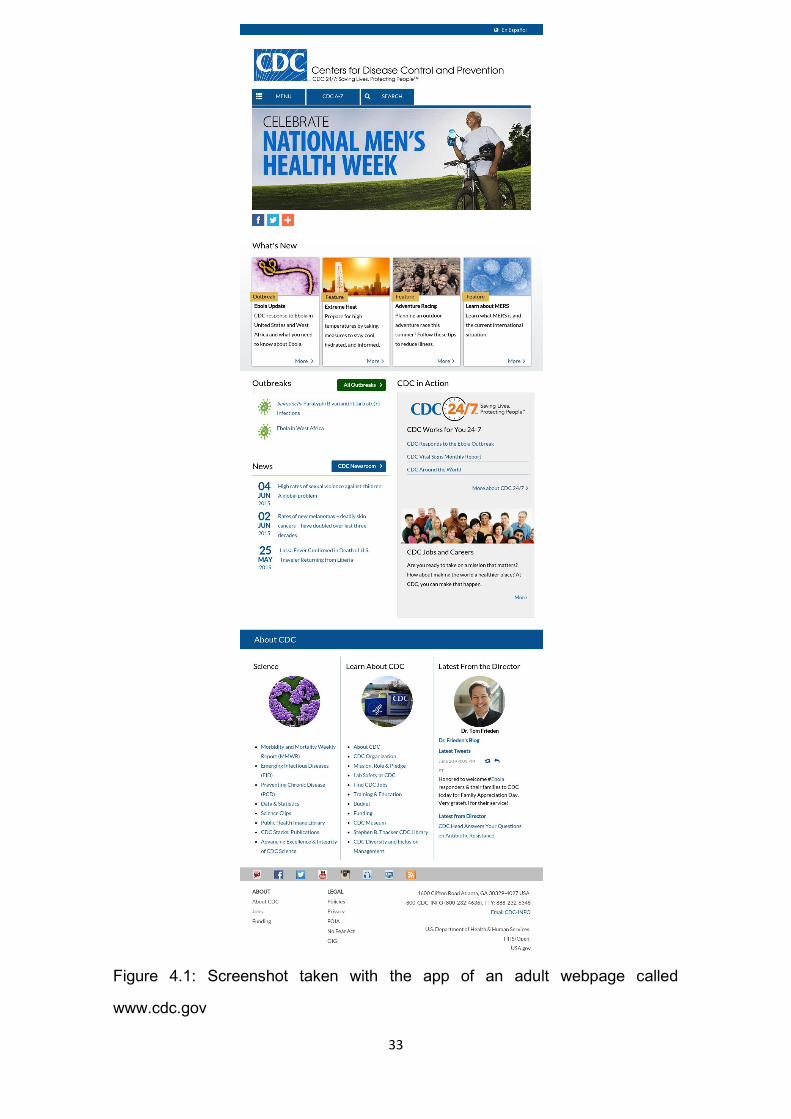
series and learning for Kids websites. In Figure 4.1, it can be seen how an adult
webpage looks like and in Figure 4.2 how a Kids webpage looks like. All of the
web pages used for the training phase were in English, something which is very
important for the classification to be more accurate and especially for the text
features when building the Bag-Of-Words.
33
Figure 4.1: Screenshot taken with the app of an adult webpage called
www.cdc.gov

34
Figure 4.2: Screenshot taken with the Android app of the kids webpage
www.capstonekids.com

35
On a first attempt, 208 web pages were used to train the classifier. 102
Kids web pages and 106 Adults web pages. Moreover, each one of the text-
vector had 2000 attributes. As it was mentioned before, we used three different
classifiers: J48, Naive Bayes and AdaBoost. After have trained the three
classifiers, 48 web pages were used to test those classifiers: 26 adults and 22
kids web pages. Evidently, those pages used for the test phase had also 160
attributes in the visual vectors and 2000 attributes in the text vectors. After
performing this, the results achieved were not good enough. As a solution, we
decided to increase the number of web pages used for the training phase.
Therefore, after doing research of URLs for kids and adults 174 more
web pages were added to train the classifiers. Thus, this second attempt
consisted in training the classifiers with 382 web pages being 189 kids and 193
adults sites. The length of the vectors was not modified. The outcomes of this
second attempt were better than the ones obtained in the first one but we were
not satisfied.
A third attempt consisted in reducing the textual features to a total
amount of 500. Once the features were reduced, we trained the classifiers
again and test with the same test database. Once again, results were not what
we expected so another approach was taken.
We decided then, that a good new solution could be reducing the amount
of text features to the same quantity of visual attributes.
That way, the last and fourth attempt consisted in reducing the textual
features to 160 so we had the same amount of features for visual and textual.
After training again the classifiers and performing the test with the 44 web
pages already mentioned, the results came up to be a little better than in
previous attempts.

36
Nevertheless, it was found out that some of the web pages used in the
test phase were not actually good to test and they were dragging out the final
outcomes of the attempt. For that reason those web pages were eliminated
from the test database having finally 36 web pages in the testing phase.
In summary, best results were achieved in this fourth attempt in which 36
web pages were used to test the classifiers being 18 of Adults and 18 of Kids.
Besides 160 attributes were extracted in both visual and text and, as it was
mentioned before, 382 web pages were used to train the classifiers being 189
from Kids and 193 from Adults category. Next, results are going to be described
and evaluated.
As it was already stated, three classifiers were trained with text features,
visual features and both of them together. We then tested with 36 web pages
and the results are detailed in Figure 4.3.
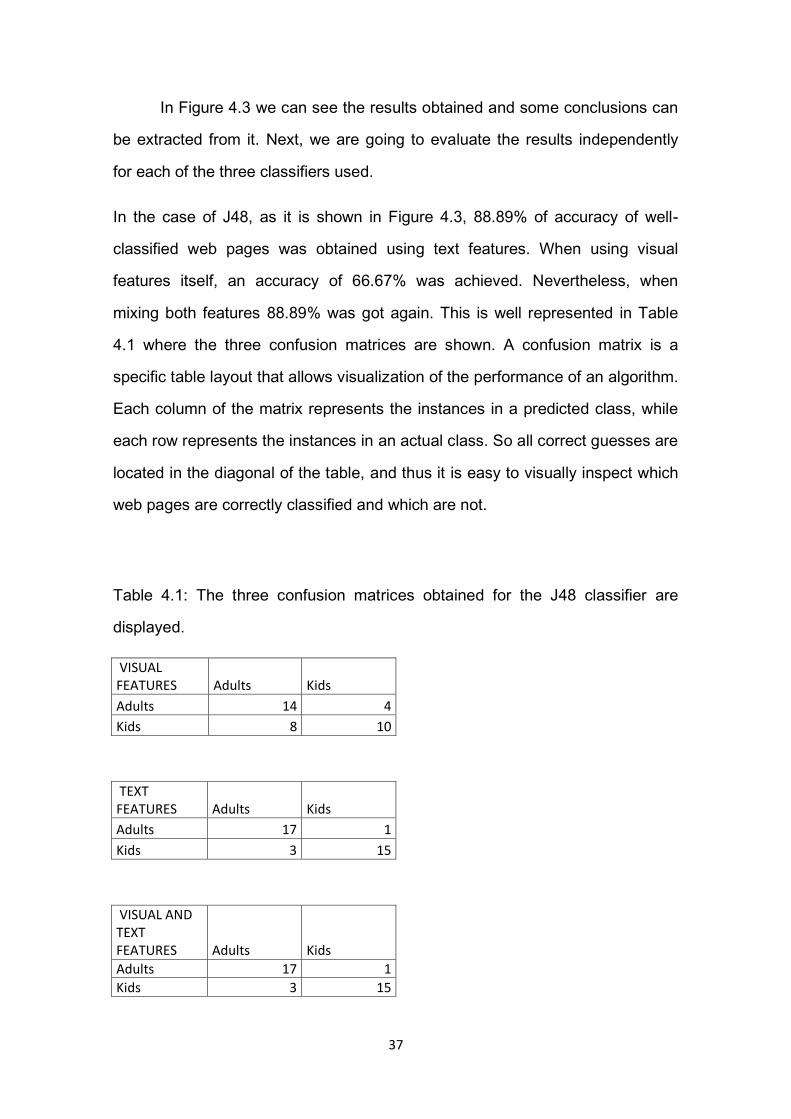
Figure 4.3: Graphic showing the results obtained when testing 36 web pages
with the 3 classifiers and using text, visual or both features to classify.
0
10
20
30
40
50
60
70
80
90
100
J48 Naive Bayes Ada Boost
Text Features
Visual Features
Text and Visual Features
Acurracy(%)
37
In Figure 4.3 we can see the results obtained and some conclusions can
be extracted from it. Next, we are going to evaluate the results independently
for each of the three classifiers used.
In the case of J48, as it is shown in Figure 4.3, 88.89% of accuracy of well-
classified web pages was obtained using text features. When using visual
features itself, an accuracy of 66.67% was achieved. Nevertheless, when
mixing both features 88.89% was got again. This is well represented in Table
4.1 where the three confusion matrices are shown. A confusion matrix is a
specific table layout that allows visualization of the performance of an algorithm.
Each column of the matrix represents the instances in a predicted class, while
each row represents the instances in an actual class. So all correct guesses are
located in the diagonal of the table, and thus it is easy to visually inspect which
web pages are correctly classified and which are not.
Table 4.1: The three confusion matrices obtained for the J48 classifier are
displayed.
VISUAL FEATURES Adults Kids
Adults 14 4
Kids 8 10
TEXT FEATURES Adults Kids
Adults 17 1
Kids 3 15
VISUAL AND TEXT FEATURES Adults Kids
Adults 17 1
Kids 3 15

38
For this classifier, the classification did not improve when adding visual
features to text features but, it did not get worse either so it is considered as a
good result. As we can see in Table 4.1, in general, this classifier is better
predicting Adults web pages than Kids web pages. In the case of using both
visual and text features the results were pretty good only having 4 web pages
bad classified. 1 from Adults category and 3 of them for Kids category.
On other hand and in the case of Naive Bayes classifier, the confusion
matrices are exposed in Table 4.2. As we already could see in Figure 4.3, for
this classifier, the accuracy improved an 8.33% when adding visual features to
text features.
Table 4.2: The three confusion matrices for Naive Bayes classifier are shown.
VISUAL FEATURES Adults Kids
Adults 17 1
Kids 13 5
TEXT FEATURES Adults Kids
Adults 14 4
Kids 3 15
VISUAL AND TEXT FEATURES Adults Kids
Adults 17 1
Kids 3 15

39
For this classifier we also come to the conclusion that Adults web pages
are better classified than Kids ones. As it is shown in Figure 4.2 and in Table
4.2 there is one improvement when comparing to J48 classifier. The
classification improved when adding visual features to text features. Only using
text features, the accuracy obtained of well classification was 80.56%, but once
visual features were added, 88.89% was obtained. So, although the accuracy
when using both features is the same for J48 and Naive Bayes classifiers, this
classifier showed an improvement and reinforces the aim of the dissertation
which is to show that visual features can help when performing web pages
classification.
Finally, we are going to expose the outcomes obtained for AdaBoost
classifier which were the best results obtained in this dissertation. In Table 4.3
we have the confusion matrices and with Figure 4.3, we can see that although
the improvement of accuracy of well classification when adding visual to text
features is 2.77% and therefore, less than the improvement obtained when
using Naive Bayes classifier, the percentage of accuracy when using both
features raises to 94.44% which is a very good result.

40
Table 4.3: The three confusion matrices obtained for AdaBoost classifier are
shown in this table.
VISUAL FEATURES Adults Kids
Adults 16 2
Kids 6 12
TEXT FEATURES Adults Kids
Adults 17 1
Kids 2 16
VISUAL AND TEXT FEATURES Adults Kids
Adults 18 0
Kids 2 16
Once again, it can be concluded for this classifier also that Adults web
pages are better classified than Kids ones. One of the possible reasons can be
that there are more fields among Adults web pages than in Kids ones, so when
testing a kid webpage can be classified as Adults. In other words, for Adults we
can find News, Universities, Sports or Games web pages which imply a huge
variety of colors in their pages. Nevertheless, for Kids web pages as we can say
according to the research made in this dissertation, most of them are from
cartoons or TV series and they are very colorful. But sometimes if they are less
colorful they can be classified as Adults and that was one of the reasons why
Adults web pages were better classified than Kids ones. There is an example in
Figure 4.4 where a Kids webpage classified as Adults is shown.

41
Figure 4.4: Screenshot of a Kids webpage which was classified as Adults when
using only visual features.

42
In summary, AdaBoost classifier was seen to be the best classifier with an
accuracy of 94.44% when using both features. It has been shown in this chapter
that although classifying only with visual features implies modest results, using
both features to classify improved webpage classification than only using text
features. This will be deeply discussed in chapter 5.
To end up this chapter, we will next show how the performance of the
app is and how it works. In Table 4.4 this is clearly stated where three different
web pages were tested. In that table, time of classification done by the app is
shown depending on the features used to perform that classification. It is also
displayed the weight of the web page’s screenshot as well as the number of
words extracted from the HTML code. It has to be said that it doesn’t matter
which classifier is chosen at the time of the performance. The only important
issue is which features are used to perform the classification. That is why in
Table 4.4 the time is considered to be the same for all classifiers. Some
conclusions can be subtracted from that table and next they will be explained.
First of all, the main difference between that can be seen is the weight of
the web pages’ screenshot. As it is shown, a heavier screenshot implies a slow
performance when using visual features and when using also text and visual
features together.
Secondly we can also see the words extracted from the HTML code of
each of the web page. It can be said that, in this case, how many words doesn’t
change a lot the time of the performance when using only text features.
Finally and as a conclusion, we can say that the only thing that matters
for the time of execution of the app is how much the screenshot of the web
page weighs.

43
Table 4.4: Performance of three different web pages in the application.
WEB PAGE www.nick.com www.games.com www.su.se
CLASSIFICATION
WITH TEXT
FEATURES
25sec 26sec 26sec
CLASSIFICATION
WITH VISUAL
FEATURES
46sec 105sec 159sec
CLASSIFICATION
WITH TEXT AND
VISUAL
FEATURES
61s 117sec 181sec
WEB PAGE www.nick.com www.games.com www.su.se
WORDS
EXTRACTED
FROM THE HTML
CODE
430 421 188
WEIGHT OF THE
SCREENSHOT
1.61KB 91.5KB 375KB

44
Chapter 5
Conclusions
In this dissertation an approach for automatic web page classification by
topic using the combination of text and visual features was described. A binary
classification was performed, which aimed at distinguishing between Adults or
Kids web pages. Good results were obtained which suggest that visual features
from web pages improve the classification and they should not be ignored. To
prove this and represented in a way it had not been represented yet, an Android
application was done based on this classification process.
As it was explained in Chapter 4, three different classifiers were used in
this work using text, visual or both features to perform classification. The results
obtained in this work were very positive and they help to reaffirm that visual
features complement the web page classification by topic that uses only text
features. When visual features were used alone, these features are strong
mainly for subjective variables, such as Gonçalves and Videira [3] already
concluded. More types of subjective variables can also be developed, such as
to distinguish if a web page transmits happiness or sadness for instance.
For future work about this thesis the main thing that could be said to do is
to enhance the Android application. A deep study in the time of performance of
classification could be made to reduce it and enhance the app to even be able
to upload the app to PlayStore.

45
References
[1] http://www.internetlivestats.com/total-number-of-websites/#ref-1 visualized
on <06/25/2015>.
[2] Viktor de Boer, Maarten van Someren, and Tiberiu Lupascu. Classifying web
pages with visual features. In WEBIST (1), pages 245-252, 2010.
[3] Nuno Gonçalves and Antonio Videira. Automatic web page classification
using visual content. In International Conference on Web Information Systems
and Technologies. WEBIST,2013.
[4] Mark Hall, Eibe Frank, Geoffrey Holmes, Bernhard Pfahringer, Peter
Reutemann, and Ian H. Witten.
The weka data mining software: an update. SIGKDD Explor. Newsl., pages 10–
18, 2009.
[5] Xiaoguang Qi and Brian D. Davison. Web page classification: Features and
algorithms. ACM Comput. Surv., 41(2):1–31, 2009.
[6] Sven Meyer Eissen and Benno Stein. Genre classification of web pages:
User study and feasibility analysis. In IN: BIUNDO S., FRUHWIRTH T., PALM
G. (EDS.): ADVANCES IN ARTIFICIAL INTELLIGENCE, pages 256–269.
Springer, 2004.
[7] Carlos Castillo, Debora Donato, Aristides Gionis, Vanessa Murdock, and
Fabrizio Silvestri. Know your neighbors: web spam detection using the web
topology. In Proceedings of the 30th annual international ACM SIGIR
conference on Research and development in information retrieval, SIGIR
’07, pages 423–430, New York, NY, USA, 2007. ACM.

46
[8] Min-Yen Kan and Hoang Oanh Nguyen Thi. Fast webpage classification
using url features. In Proceedings of the 14th ACM international conference on
Information and knowledge management, pages 325–326, 2005.
[9] Min-Yen Kan. Web page classification without the web page. In Proceedings
of the 13th international World Wide Web conference on Alternate track papers
& posters, pages 262–263, 2004.
[10] Daniele Riboni. Feature selection for web page classification. na, 2002.
[11] Gerard Salton and Christopher Buckley. Term-weighting approaches in
automatic text retrieval. Information processing & management, 24(5):513{523,
1988.
[12] Koraljka Golub and Anders Ardö. Importance of html structural elements
and metadata in automated subject classification. In Proceedings of the 9th
European conference on Research and Advanced Technology for Digital
Libraries, pages 368–378, Berlin, Heidelberg, 2005. Springer- Verlag.
[13] Shawn C Tice. Classification of Web Pages in Yioop with Active Learning.
PhD thesis, San José State University, 2013.
[14] Ms Sonal Vaghela, Mr MB Chaudhary, and Mr Devendra Chauhan. Web
page classification using term frequency. International Journal For
Technological Research In Engineering, 1:949{954, 2014.
[15] Arul Prakash Asirvatham, Kranthi Kumar Ravi, Arul Prakash, Asirvatham
Kranthi, and Kumar Ravi. Web page classification based on document
structure, 2001.
[16] Milos Kovacevic1, Michelangelo Diligenti, Marco Gori, and Veljko
Milutinovic1. Visual adjacency multigraphs, a novel approach for a web page
classification. Proceedings of the Workshop on Statistical Approaches to Web
Mining (SAWM), pages 38–49, 2004.

47
[17] M.W. van Someren V. de Boer and T. Lupascu. Classifying web pages with
visual features. WEBIST, 2010.
[18] Antonio Videira. Web page classification using visual features. Master's
thesis, University of Coimbra, 2013.
[19] Hideyuki Tamura, Shunji Mori, and Takashi Yamawaki. Textural features
corresponding to visual perception. Systems, Man and Cybernetics, IEEE
Transactions on, 8(6):460{473,1978.
[20] Juan Ramos. Using tf-idf to determine word relevance in document queries.
In Proceedings of the First Instructional Conference on MachineLearning, 2003.
[21] Gerard Salton, Anita Wong, and Chung-Shu Yang. A vector space model
for automatic indexing. Communications of the ACM, 18(11):613{620, 1975.
[22] Arthur L. Samuel. Some studies in machine learning using the game of
checkers. IBM Journal of Research and Development, 44(1):206–227, 2000.
[23] Thomas M. Mitchell. Machine Learning. McGraw-Hill, Inc., New York, NY,
USA, 1 edition, 1997.
[24] WEKA concepts and basic knowledge.
http://www.devmedia.com.br/mineracao-de-dados-no-mysql-com-a-ferramenta-
weka/26360
[25] Weka 3-6-12.zip WEKA manual file.