android application - theseus
TRANSCRIPT

Further development of Ceriffi Check’s
Android application
Improving quality of company’s processes
Diána Deregi
Bachelor’s thesis May 2017 School of Technology Bachelor's Degree Programme in Information and Communications Technology

Description
Author(s)
Deregi, Diána Type of publication
Bachelor’s thesis Date
May 2017
Number of pages
65 Language of publication: English
Permission for web
publication: x
Title of publication
Further development of Ceriffi Check’s Android application Improving quality of company’s processes
Degree programme
Bachelor's Degree Programme in Information and Communications Technology
Supervisor(s)
Lappalainen-Kajan, Tarja
Assigned by
Ceriffi Ltd.
Description
The companies often offer productions or services to the customers. Their aim is to meet the expectations to earn the customers’ satisfaction. The quality management is responsible for accomplishing these goals, earning and keeping the quality at a high level. Six Sigma is one of the usable tools, it focuses on reducing waste by making the products and services of a company better, faster, and cheaper.
The Ceriffi Ltd. is a management consulting company which provides support to accomplish Six Sigma projects. They realized that the data and its collection is an important part of the project because the data makes the decision making possible to improve the companies. To support this process, they have created the Ceriffi Check system. It is built into Six Sigma projects to help and manage the data collection.
The objectives were to learn how the Ceriffi Check works, what the connection is to Six Sigma and additionally, to learn about the background of the application followed by finding the weak points of the system, rethinking the functions and reforming them if necessary. The final goal was to accomplish the new ideas and new directions of the Android application and implement the new features.
The set goals were achieved well: the modernization of the application for their current customers and the implementation of new features and operational ways to increase the functionality. Most of the changes were evaluated by the customers and all suggestions were considered and applied. In most cases, the new features based on the customers' requirements and expectations. Thanks to the fast reaction for the requests, openness for the new ideas and understanding of tasks, the customers were satisfied and used the application with pleasure.
Keywords (subjects)
Android application, Ceriffi Ltd., Continuous improving, DMAIC, Quality management, Six Sigma Miscellanous

Contents
1 Introduction ............................................................................................................ 1
2 Objectives and scope ............................................................................................. 2
3 Ceriffi Ltd. ............................................................................................................... 2
4 Six Sigma ................................................................................................................. 3
4.1 DMAIC .............................................................................................................. 4
4.2 Tools ................................................................................................................. 5
4.2.1 Brainstorming ........................................................................................... 5
4.2.2 Seven Basic Tools of Quality ..................................................................... 5
4.2.3 5 Why ..................................................................................................... 10
4.2.4 FMEA ...................................................................................................... 10
4.2.5 Time series plot ...................................................................................... 11
5 Ceriffi Check ......................................................................................................... 12
5.1 Connections to DMAIC .................................................................................. 12
5.1.1 Define ..................................................................................................... 12
5.1.2 Measure.................................................................................................. 13
5.1.3 Analyze ................................................................................................... 13
5.1.4 Improve .................................................................................................. 14
5.1.5 Control .................................................................................................... 15
5.2 Introduce the system of Ceriffi Check ........................................................... 15
5.2.1 How to use Ceriffi Check ........................................................................ 15
5.2.2 Option types ........................................................................................... 19
6 Android application development ....................................................................... 24
6.1 Modernize the application ............................................................................ 24
6.1.1 Increase API and its problems ................................................................ 24
6.1.2 Remember the choices ........................................................................... 27

6.1.3 Settings activity ...................................................................................... 29
6.1.4 Missing properties .................................................................................. 32
6.2 Attach content to an error ............................................................................ 34
6.3 Save and load the actual measurement ........................................................ 36
6.4 Send messages during a measurement ......................................................... 38
6.4.1 Send SMS with Ceriffi Check .................................................................. 39
6.4.2 Possibilities to implement SMS sending ................................................ 39
6.4.3 Broadcast messages ............................................................................... 39
6.4.4 Send SMS with SmsManager .................................................................. 40
6.5 Offline working .............................................................................................. 42
6.5.1 Download and save the required information ....................................... 42
6.5.2 Upload the attached contents ............................................................... 43
6.5.3 Upload the measurements ..................................................................... 45
6.5.4 Feedback to the user .............................................................................. 46
6.6 Parallel Time option reports .......................................................................... 47
7 Conclusion ............................................................................................................ 52
7.1 Results ............................................................................................................ 52
7.2 Recommendation .......................................................................................... 53
7.3 Evaluate ......................................................................................................... 55
7.4 Summary ........................................................................................................ 55
References .................................................................................................................... 57

List of Figures
Figure 1. Fishbone Diagram Example ............................................................................. 7
Figure 2. Pareto chart example: Reasons for lateness ................................................... 9
Figure 3. Histogram example: Number of errors per hours .......................................... 9
Figure 4. Activities of the application ........................................................................... 16
Figure 5. Simple type example and the content selection ........................................... 20
Figure 6. Icon and dialog of String type ....................................................................... 20
Figure 7. Icon and dialog of Time type ......................................................................... 21
Figure 8. Icon and dialog of Parent type ...................................................................... 22
Figure 9. Icon and dialog of Instant message type ....................................................... 23
Figure 10. Missing properties: old and new version .................................................... 33
Figure 11. Context menu to attach content ................................................................. 35
Figure 12. Flowchart of the Splash Activity .................................................................. 44
Figure 13. The Menu and Background Activities ......................................................... 46
Figure 14. From left to right: the stop button, the Time dialog, and the expandable
menu button ................................................................................................................ 48
List of tables
Table 1. 7 QC Tools and description ............................................................................... 6
Table 2. Fishbone Suggested Categories ........................................................................ 7

Glossary
5 Why It is a technique of practice of asking to discover the root cause of a problem.
The aim is to discover why the event in question happened.
Activity Generally, one activity implements one screen in an Android application. It
makes the interaction possible for the users and the application draws the user
interface on it.
Attached content A content can be attached to every error report in order to show
the details effectively. It can be an image, video or other file.
Brainstorming It is performed by a group of people, with the goal to collect as many
ideas as possible without their evaluation.
Ceriffi Check The software consists from a website and an Android application. It can
make measurement and collect data to reveal the reasons of the failures. Created by
Ceriffi Ltd. company.
DMAIC This data-driven improvement cycle (define-measure-analyze-improve-
control) is used to improve, optimize business processes and services. The core
model of Six Sigma projects.
FMEA Failure Modes and Effects Analysis is a risk assessment tool. It assigns priority
number to the possible errors to reveal the biggest risk factors.
Ishiwaka diagram (or fishbone/cause-and-effect diagram) It shows the causes of a
specific event in order to identify the potential factors of an error or a defect in
question.
Long press A user interaction in the Android applications, when the user presses a
user interface element and holds it for a short time.
Measurement (or report) Usually it means one report session which can be made by
the users via the Ceriffi Check Android application. It can contain more error reports,
based on the grouping of options.
Option (or error option, process’s option) More of them are available inside one
measurement. They contain all the possible errors which can occur during a process
or a service. When an error happens, an error report will be created with the proper
option.

Pareto analysis Pareto Analysis is a bar graph which ranks the data from the largest
to the smallest. It reveals the biggest problems and organize them to the left side of
the graph.
Six Sigma Six Sigma is a data-driven approach which aims to decrease defects in any
process such as in production or service. It helps the companies to increase their
performance and quality, improve customer value and efficiency.

1
1 Introduction
The goal of this document is to introduce Ceriffi Check and its goals as well as the
background of the idea. Based on the analysis of the first version of Ceriffi Check, the
goal is to discover the development possibilities and document the implementation
processes. The final goal is to create the second version of the application which is
modernized, appropriate for today’s users and has the ability to accomplish its aims.
Ceriffi Check is a measurement system which was created by the Ceriffi Ltd.
company. Based on Six Sigma policy, the system’s aim is to provide support for the
customers to increase the quality of a production or service. The system is able to
measure the processes, collect its defects. It provides data for the customers to help
them to make appropriate decisions to improve the measured process. (Samuli
Muhonen 2017.)
The Ceriffi Ltd. is a management consulting company. One of their services is to
provide support to accomplish Six Sigma projects, understand the paradigm and
increase the quality. The company realized that the data and its collection is an
important part of the project because the data makes the decision making possible
to improve the companies. To support this process, they have created the Ceriffi
Check system. (ibid.)
The development of the system was started in 2014. It consists of a website, where
the customers can set the properties of the processes, and an Android application,
where the measurements can be created. The collected data is available on the
website where some analytics is also visible to get the proper information for the
decisions. The aim is the further development of the first version of the Android
application. (ibid.)
The document introduces the objectives and the scope of this piece of work and the
Ceriffi Ltd. Then it discusses the basics of Six Sigma and the way how the Ceriffi Check
connects to it. After this, the system of Ceriffi Check is described and how the
customers can use it. All the developments are introduced which were implemented
during the work. Finally, the results are summarized and evaluated. For the further
development, some recommendations are gathered to continue the work.
2
2 Objectives and scope
The first objective is to learn about the application, how it works, why it is created, to
learn about the background of the application, and where the idea for it comes from.
The second objective is to make a research about Six Sigma, how it works, what are
the best practices, try to get ideas for the application’s improvement. And the third
objective is to get to know the customers’ needs about the system, how can it be
simpler and easier to use for all kind of users but still effective and useful.
Another goal is to crawl the outdated visual elements, redesign the user interface
which satisfies today’s needs and expectations, and provide an attractive
appearance. Another goal is to rethink the functions, reform them if a new and more
logical way is available. If it is necessary, they should be made them simpler, more
understandable and easier to use.
The final goal is to implement the new features and functions, accomplish the new
ideas and new directions of the application which was revealed at the learning
phase. These changes can bring redesigning and learning the new technologies and
possibilities. During the work, it is important to ask the customers for their opinion
about the innovations or changes, refine the new functions based on the comments,
and consider the users’ ideas and use them to improve the application.
3 Ceriffi Ltd.
Ceriffi Ltd. is a management consulting company founded in 2013. The offices are
located in Kajaani and Jyväskylä but the company offers services around Finland. Its
slogan describes the main objectives: “Simplify. We help. We make complex things
simpler.” (Samuli Muhonen 2017.)
Ceriffi Ltd. is an expert of quality management systems; they provide several services
to their customers. They help to understand the standards, guide the preparations,
train the management and staff, obtain certificates in order to implement the quality
and environmental management systems, like ISO 9001, ISO 14001, and OHSAS
18001. They provide assistance in CE Marking: meet the product with the standards
and requirements, and get the CE mark. They offer guide to get to know the

3
principles of Lean Six Sigma activities, monitoring and measurement tools. They also
help in e-marketing: improve the sales, increase the efficiency, and improve the
visibility in the network. (Samuli Muhonen 2017.)
During the Lean Six Sigma projects, the company realized that the customers do not
possess the appropriate data to make effective decisions to improve their company.
To solve this problem, the company designed and created an application which offers
cost-effective and agile solutions. Ceriffi Check is a smart new tool for managers to
monitor the company’s operations. It makes the collection and analysis of the
necessary data easier than before. (ibid.)
The company produces digital contents that will help the customers to enhance their
business operations and processes. The company noticed how many companies
continue to spend time and money unnecessarily to create the required documents
from scratch. There are many ready-made solution in the world. Thus, Ceriffi Ltd.
decided to create a marketplace, a publishing platform, the Documented.Zone. Here
the ready-made solution providers can share their documents with the solution
seekers who want to reduce the production costs. The service started to work in
2016. (ibid.)
4 Six Sigma
Six Sigma is a data-driven approach which aims are to decrease defects in any
process such as in production or service. It helps the companies to increase their
performance and quality, improve customer value and efficiency. Six Sigma does not
think about the quality in the traditional sense but adds a new definition of quality.
This quality is split into potential and actual quality. Potential quality is the maximum
possible value which can be reached. The actual quality is the current value which is
reached. The difference between the potential and actual quality is waste. The
companies invest energy needlessly into the production of waste. Six Sigma focuses
on reducing waste by making the products and services of a company better, faster,
and cheaper. It is not a cost-cutting program which also reduces value and quality; it
identifies and eliminates costs which provide no value to customers: waste costs.
(Pyzdek & Keller 2010, 4.)

4
In favor of making a difference between companies, Six Sigma aggregates them into
six groups based on their performance. The one with the best performance is the Six
Sigma group. Its members create 3.4 problems per million opportunities. Most
companies have sigma level of three or four, which means 6,200-67,000 problems
per a million opportunities. The sigma group one is the most poorly organized. These
companies can produce more than 40% of waste. Costs are directly related to the
levels because sigma levels show how many errors are excepted, and the correction
of the errors demands money. General Electric estimated that the gap between
three or four sigma and Six Sigma was costing them between $8 billion and $12
billion per year. (Pyzdek & Keller 2010, 4-5.)
4.1 DMAIC
Six Sigma relies on tried and true methods that have been used for decades. Six
Sigma trains a small group in-house members of a company, known as Six Sigma
Black Belts, who can apply these techniques and instruct the other members what
and when to do. Many tools and methods are available inside Six Sigma, however, all
of them are organized around the DMAIC model. DMAIC is described as follows:
(Pyzdek & Keller 2010, 3.)
a) Define: define the problems and goals.
b) Measure: measure the existing system, collect data.
c) Analyze: considering the collected information, analyze the system and find
solutions to reduce the difference between the current performance and the
goals.
d) Improve: improve the system according to the found solutions.
e) Control: control and evaluate the new system.
The system of Ceriffi Check comes in at the data collection. Its aim is to prevent to
collect such data the processing of which is hard or impossible. It does not leave the
data become messy and impracticable, rather it collects and visualizes them
organically. It can frequently occur that the appropriate data is not available. Or if it
is, then it can be difficult to process it, and the improvement process turns into
torture. This data is important; it defines when it is possible to finish a phase and
step to the next one (e.g. from analysis to improvement). When enough data is

5
collected, the Black Belts can move the project to the next step. (Pyzdek & Keller
2010, 8-9.)
4.2 Tools
The presented tools below are applicable to Six Sigma projects, and they are used on
the DMAIC stages. These tools require creativity, and thorough knowledge about the
company’s processes. Thus, they cannot be automatized and Ceriffi Check cannot
provide help to accomplish them. Their usability is not limited to one specific level or
stage of the project; however, there are recommendations where and when they
should be used.
4.2.1 Brainstorming
Brainstorming is performed by a group of people with the goal to collect as many
ideas as possible. During the brainstorming, it is not allowed to discuss or assess the
thoughts, they are just written down. It is important to leave enough time for the
group to think about the question. The composition of the group is also significant.
The number of people, the qualification, and their personality are all relevant.
Brainstorming can be open or silent, structured or unstructured. (A Six Sigma
Eszköztára, Mérés fázis [Tools of Six Sigma, Measure] 2009.)
4.2.2 Seven Basic Tools of Quality
The Seven Basic Tools of Quality (or 7 QC Tools) comprise seven graphical analytical
tools efficiently useable to solve quality problems because of the tools’ simplicity.
Due to these properties, anyone not practiced in statistical tools on expert level is
also able to use them successfully. 7 QC Tools have spread successfully and their
popularity continues to this day. The tools in this group are useable in any kind of
phase of the project from product development to delivery. It is not by accident that
they are also used in Six Sigma projects. Table 1 contains the mentioned tools and
their short descriptions. Some of them are scrutinized in the next subchapters.
(Seven Basic Tools of Quality n.d.)

6
Table 1. 7 QC Tools and description
Name Description
Stratification (Divide and Conquer)
Divide the data into categories and conquer the meaningful information.
Histogram Study the density of data in any given distribution.
Check Sheet (Tally Sheet) List down the events in a metrics format and update the status on their occurrence to understand defect patterns and causes.
Cause-and-effect diagram (“fishbone” or Ishikawa diagram)
Identify the root causes behind a problem to avoid recurrent symptom elimination.
Pareto chart (80/20 Rule) Highlight the most important reasons of a failure.
Scatter diagram (Shewhart Chart)
Establish a relationship between problems.
Control chart Determine if the process is stable and capable within current conditions.
4.2.2.1 Ishiwaka diagram
Ishiwaka diagram is also known as fishbone diagram or cause-and-effect diagram and
it was created by Kaoru Ishiwaka. It shows the causes of a specific event in order to
identify the potential factors of an error or a defect in question. The causes are
organized into categories to identify the sources. The categories are optional: Table 2
shows some standards. (Kerri Simon n.d. a; Ishiwaka diagram 2017.)
The diagram resembles a fishbone. The first step is to define the main process, the
problem. It will appear in the head of the fishbone. The selected categories will be
the main lines, connected to the spine of the fishbone. Figure 1 shows an example of
a fishbone diagram. The main problem is Missed Deadline, visible on the right side of
the diagram. The causes are grouped by six categories: People, Method,
Measurement, Machine, Environment, Materials. (Tim van de Vall 2013.)

7
Table 2. Fishbone Suggested Categories
Service Industries
(The 4 Ps)
Manufacturing Industries
(The 6 Ms)
Process Steps
(for example)
a) Policies
b) Procedures
c) People
d) Plant/Technology
e) Machines
f) Methods
g) Materials
h) Measurements
i) Mother Nature
(Environment)
j) Manpower
(People)
k) Determine
Customers
l) Advertise Product
m) Incent Purchase
n) Sell Product
o) Ship Product
p) Provide Upgrade
After drawing the frame, a group of people collects the causes. During a
brainstorming process, the team members can freely collect ideas and group them by
the main categories. Every found cause connects to the appreciate category line as a
smaller arista. (Kerri Simon n.d. a)
Figure 1. Fishbone Diagram Example

8
It is possible to create more levels by using the 5 Why technique. Further
subcategories can be created to find elementary causes. In other words, keeping only
the main categories helps to dissect the causes and map the background of a cause.
The newly found causes are connected to the parent cause as graphs. (Kerri Simon
n.d. a)
The cause-and-effect diagram does not give an answer to which causes play the
biggest role in forming the problems. Other quality control tools such as Pareto
Analysis can be called for help. (ibid.)
4.2.2.2 Pareto Analysis
Pareto Analysis is a bar graph ranking the data from the largest to the smallest. With
this technique, the biggest problems are revealed and separated from the others.
According to the theory, 80% of the failures are caused by only the 20% of the
reasons. As Figure 2 shows, these failures are easy to see. (Kerri Simon n.d. c)
The analysis is practicable, when accurate data is available about the system and its
processes. It is always preceded by a measurement method while the necessary
information is collected. If the collection is successful and it reflects reality, then
probably the elimination of the biggest failures brings the greatest improvement to
the measured system. (ibid.)
Figure 2 shows a chart as an example of the reasons of lateness. It illustrates clearly
that two reasons cause the most problems: traffic and child care. The red line
diagram shows the summary of the respondents from left to right. With this
information, it is easier to find the main reasons and develop a plan to reduce their
significance. With the knowledge about the situation, an effective plan can be
created and improvement, i.e. decrease the number of lateness, can be earned.
(John McNamara n.d.)

9
Figure 2. Pareto chart example: Reasons for lateness
4.2.2.3 Histogram
Histogram is a bar graph that represents data with values in a specified range. The
range of the data is continuous (e.g. the work hours) and the values in the same
interval create a bar together. Figure 3 illustrates an example of a histogram. It
shows how many errors were reported per work hours by the employees. (Kerri
Simon n.d. b)
The range of the data is segmented into equal sized bins (1 hour), the horizontal axis
representing them. The vertical axis shows the incidence of individuals, such as the
number of errors. (ibid.)
Figure 3. Histogram example: Number of errors per hours
0
10
20
1 2 3 4 5 6 7 8
Number of errors per hours

10
4.2.3 5 Why
The 5 Why is a technique of practice of asking 5 times to discover the root cause of a
problem. A team whose members know the scope of the problem and the
organization can apply it. (5 Why’s n.d.)
The next example shows the procedure:
I left my laptop’s charger at home.
Why? Because I forgot to put it into my bag.
Why? Because I was in hurry.
Why? Because I did not get up in time.
Why? Because I did not sleep enough.
Why? Because I stayed awake too long.
The goal is to find out why this really happened. Are there other possible causes?
Instead of treating the symptoms locally, the cure of the disease can be found and
the problems may not return over and over again. The number of the ‘why’
questions is not important if the root cause is found. In the example above, the root
case might also be sleep disturbances, bad timing, or overload. (5 Why’s n.d.)
4.2.4 FMEA
Failure Modes and Effects Analysis (FMEA) is a risk assessment tool. It has an
advantage over others since it provides a quantifiable result about the problems. The
calculated priority numbers show the most urgent risks. Thus, after a descendant
order the problems at the beginning of the list have the biggest risk factor. If the
calculations are correct, there is no need for other methods, the created list reveals
the biggest risks. FMEA evaluates the risks according to three parameters: (Avoid
Failure When Using Failure Modes and Effects Analysis (FMEA) n.d.)
a) Severity of the potential failure (How severe is the problem to the customer?
1 = least severe, 10 = most severe);
b) The occurrence (How frequently is this failure likely to occur? 1 = low
occurrence, 10 = high occurrence);
c) The detection (How easy is this failure to detect?).

11
The team managing this analysis assesses the parameters to every single risk in the
list. With the numbers, the risk priority number (RPN) can be calculated: (Avoid
Failure When Using Failure Modes and Effects Analysis (FMEA) n.d.)
𝑅𝑃𝑁 = 𝑠𝑒𝑣𝑒𝑟𝑖𝑡𝑦 ∗ 𝑜𝑐𝑐𝑢𝑟𝑟𝑒𝑛𝑐𝑒 ∗ 𝑑𝑒𝑡𝑒𝑐𝑡𝑖𝑜𝑛
The maximum value of the RPN is 1000 (10*10*10). The highest RPN shows which
risks need a mitigation plan to reduce this value. After completing the improvement
actions, recalculations show the reduction of the failure risk. (ibid.)
FMEA can be used to develop and implement preventative actions too and provides
benefits such as “capturing the collective knowledge of a team, documenting and
tracking risk-reduction activities, and providing historical records for baseline
performance”. It does not only evaluate the risks but collects useful information also
e.g. what will be the effect of the failure (on the customer’s side), what are the
potential causes of the failure, what are the current process controls which can
detect the failure? (ibid.)
4.2.5 Time series plot
This view is useful, when some changes have already been taken on the system, and
some historical data is available. It is capable of showing the differences before and
after the changes. It helps to evaluate the quality of the endeavor to improve. It
reveals the changes over the time, seasonal changes, and trends. (A Six Sigma
Eszköztára, Mérés fázis [Tools of Six Sigma, Measure] 2009.)

12
5 Ceriffi Check
The aim of Ceriffi Check is to help with the application of Six Sigma and the quality
improvement of the companies’ processes or services. By using it, the companies can
collect data about the proceedings. With an analysis of the results, they can find
efficient solutions to optimization and reduce the cost and waste. After introducing
the changes, it is possible to control and value the system again with further
measurements. (Samuli Muhonen 2017.)
Even if the leader of the company wants to improve something, the appropriate data
is not always available for decision makings. The leaders do not get in contact with
the actual processes and services because they do not do the actual work. The
employees are the ones meeting the problems; however, they do not always
communicate about them to the leaders. In some cases, they do not have a
possibility to tell about them or they just do not care. Therefore, the leaders are
unable to get the data to make right decisions. (ibid.)
Ceriffi Check tries to bridge this information gap between the actors. The leaders can
define the possible errors because they can see the whole picture. The employees
can then report the occurred problems during their job. This way, the leaders will get
the required information to analyze and find solutions. At the end of the process, the
companies can reach their goals such as to increase quality or reduce waste or costs.
(ibid.)
5.1 Connections to DMAIC
Ceriffi Check is built according to the previously introduced DMAIC model. The
application defines its own operations at every stage of DMAIC and offers even
software support to perform them. Below, on each stage (Define-Measure-Analyse-
Improve-Control) the usage of Ceriffi Check is expounded. (ibid.)
5.1.1 Define
The companies want to improve and correct their processes or services. To do this,
they must collect all the errors and defects which can occur during the operations in
the define section. This is important because in the next section the frequency of the
collected errors will be measured. (ibid.)

13
The collection of the errors is a creative process which can be done with several
methods. It is a group brainstorming mostly in which the aim is to find and organize
the errors. Ceriffi Check does not offer a ready-made solution to perform the
collection, because it cannot be automated. The companies must have done this
independently since the leaders and workers are in the closest relationship with the
operations. Ceriffi Check helps to understand the task and offers tutorials and tips.
(Samuli Muhonen 2017.)
The best case is when the necessary data is collected according to the guidelines of
one or more well-established methods such as the Ishiwaka diagram and 5 Why.
After that, the errors can be added on the website of the application for a later use
to collect error tickets. (ibid.)
5.1.2 Measure
During Measure, the data is collected, which helps to improve the operations. The
data shows the frequency of the occurrence of the errors. The collected errors must
be added to the properties of the application in the website, thus, they are available
during the measurements. (ibid.)
To complete the measurements, Ceriffi Check’s website or Android application can
be used (Ceriffi Check n.d.; Ceriffi Check application n.d.). The measurements are
carried out by the employees because they are the ones who encounter the
problems during their daily work. Both website and application are easy to use,
designed to be simple in the interest of not to influence the operation of the
company. During the measurement, the occurrence of an error just needs to be
signed. Image, video, another content, or measured time can also be attached in the
interest of the accurate record of the error. (ibid.)
5.1.3 Analyze
After days, weeks or months with the possession of enough data, it is possible to
organize and analyze them. This period depends on what is measured and it varies in
every companies; usually 30 observations are the minimum to start the analysis. The
statistics visualize what the background of the problem is. At all measured processes,
the most common mistakes will be revealed and the right solution can be inferred.

14
This is the section where the leaders of a company can see the cause effect and make
appropriate decisions. (Samuli Muhonen 2017.)
One useful tool is the Pareto Analysis which states that 80% of the errors occur
caused by 20% of the error cases. It means, a small part of the reasons causes the
bigger part of the incidences of the defects. The bigger improvement will become
available when these reasons are eliminated, not the small ones. Before the use of
Pareto Analysis, it worth analyzing the scope of the errors in question (e.g. with
FMEA). It can occur that the growth is not the expected quantity. For example, the
eliminated error causes the most problems during a process, however, it does not
take too much effect in cost, quality, or schedule. Thus, the elimination is a waste of
resources because the rate of improvement will not be parallel to the result of the
Pareto Analysis. (A Six Sigma Eszköztára, Elemzés fázis [Tools of Six Sigma, Analyse]
2009.)
Pareto Analysis is available on Ceriffi Check website (Ceriffi Check, N.d.). The results
are readable from the pie chart where the biggest sectors show the errors occurring
most commonly. It may not provide enough help for every customer. There is a
variety of statistical tools available and useful to form ideas. For this reason, the
customers can export the collected data from the website and make their own
statistical analysis and use their own techniques. (Samuli Muhonen 2017.)
Just to mention some of them, the histogram is used to visualize the variance in the
process. With this, it can be defined if the aims of the process meet with the
requirement of the customers. The time series plot explores changes, seasonal
changes and trends during the time. It is capable of comparing the increased
performance of the new system with the old one. (A Six Sigma Eszköztára, Elemzés
fázis [Tools of Six Sigma, Analysis] 2009.)
5.1.4 Improve
This section provides possibilities to the companies to improve the measured system,
make decisions or change the company. The previously collected and analyzed data
plays a significant role. (Samuli Muhonen 2017.)
The biggest challenge is to introduce the changes. It is not enough only to find the
way to the improvement; the leadership’s vision and implementation plans have to

15
be understood by employees, shareholders, customers, and suppliers. It frequently
involves a cultural change, which can be frightening. Effective communication can
prevent rumors and morale reductions. Plenty of methods can be used to share the
Six Sigma message: internal newsletters and blog, updates in an annual report,
recognition events, mandatory staff meeting, two-way mail communication, etc. For
the best result, the commitment of the senior leadership is necessary. It is not
enough to hold some meetings every month to refresh the goals. The leadership
must prove that they take it seriously. (Pyzdek & Keller 2010, 39-41.)
5.1.5 Control
Of course, it is not enough to make changes without control. During this section, the
employees continue the measurements on the improved system. Later, the company
can compare the data before and after the improvement. In this way, the differences
between the old and new system and the success of the changes will be revealed.
(Samuli Muhonen 2017.)
If the results are satisfactory, there is nothing to do. If the changes brought some
betterment, yet, the problems are still present, more effort is needed. It is a good
idea to choose the biggest problems, partition them into smaller problems and then
start the whole measurement all over again. In some cases, it is not necessary to
jump to the first step, just consider the possible changes again, introduce them and
measure the differences. (ibid.)
To keep the improvements durable, change agents can be placed at the diverse
levels or in the groups throughout the company. They can supervise the
development and implementation of the future Six Sigma projects. (Pyzdek & Keller
2010, 42.)
5.2 Introduce the system of Ceriffi Check
5.2.1 How to use Ceriffi Check
The usage of the Ceriffi Check system can be divided into three parts. The first is the
configuration, the second is the data collection and the last one is the analysis. The
system’s configuration is available on the website and the measurement can be
performed with the Android application. (Ceriffi Check n.d.; Ceriffi Check application
n.d.)

16
Figure 4 introduces the activities of the Android application. Their function and role is
explained later. From left to right, from top to bottom: Splash Activity, Settings
Activity, Menu Activity, Quality Activity, Satisfaction Activity, Workload Activity,
Submission Activity and Background Tasks Activity. (Ceriffi Check application n.d.)
Figure 4. Activities of the application
5.2.1.1 Registration and settings
The account registration is available on the Ceriffi Check website (Ceriffi Check n.d.).
The website is available in Finnish and English. At the registration, beside some
general information, the account basic settings also have to be chosen. It means, that
according to the selected theme, the account will be configured by pre-added
processes and measurements. The descriptions of the themes are available on the
registration page. Of course, the blank account is also available without theme
specific items. (Samuli Muhonen 2017.)

17
The system has to be configured to be able to record error reports. After the
company finished the analysis of the company’s processes and the collection of the
error types, the types have to be added under the Properties menu. Processes stands
for the company’s processes, based on which they operate. Measures refer to the
error types which can occur during a process. For example, a process can be a
production of a commodity and an error can be a shoddy product. When the
employees meet an error, they classify it into an error type and create an error
report. This is the reason why it is important to collect the processes and measures
accurately. The Users mean the employees using the application to create the
reports. The Time period contains information on when the employees work, e.g.
morning, afternoon. The Other specifiers is a customizable property. It can be
anything, however, it frequently stands for the places where the employees can
work, e.g. factory locations. (Samuli Muhonen 2017.)
The Other settings contain the authentication key which identifies the account. It has
to be added at the application’s settings, this is the way how the application can be
connected to the account. After this step, the previously described properties will be
available inside the application and error reports can be created via the employees.
(ibid.)
5.2.1.2 Make measurements
When the properties are added and the application is connected to the account, the
measurement can be started. At the Menu Activity, the employees can set the
circumstances. What process will go on, who is the user, what is the time period, and
the chosen item of the customizable property. If every property is set, the
measurement can be launched. (ibid.)
The Quality Activity handles the measurement creation. If the time is measured
during the process, the measurement has to be started first. In other cases, it starts
automatically. When the employees meet a defect, an error occurs, they can press an
error option which belongs to the occurred problem. With this, they can record that
there was an error and it will be stored and used later for create analysis. (ibid.)
The recorded error can contain various information about the case. For example, it
can be a small description, or a measured time independent of the measurement’s

18
timer. One media file also can be attached to all of them. It can be an image, a video,
a text file, which can provide a more detailed report. (Samuli Muhonen 2017.)
When the measurement is finished, the users can give information on their feelings
regarding the work satisfaction and workload. This is just optional information; it is
not required to answer them. In the Settings Activity, they can be turned off and on.
(ibid.)
Finally, at the Submission Activity, the measurement can be reviewed. It shows some
statistics about how many reports were created. A description also can be added to
the measurement here. After the submitting, the measurement is sent to the
database and saved. The measurement ends here and a new one can be started at
the Menu Activity. This cycle continues until enough data is collected. (ibid.)
5.2.1.3 Analysis and improvement
The website provides possibilities to follow the reports. Under the Reports menu all
the measurement recorded by the application is available. The circumstances, the
measured time (if it exists) and the error reports can be viewed here. They are
editable with limits and deletable. (ibid.)
When enough data is available to analyze the reports and try to find information,
some statistical tools are ready to use at the Statistics menu. Three groups are
available. The first is the Processes, where it is noticeable how frequently the
processes and measures occurred in the measurements. A pie chart shows the
occurrence of the processes or the measures in percentage form. A line chart shows
how many reports arrived on each of the days. Filters can be used to narrow the data
set, such as choosing the process, user, customizable property or data range. The
details of the visualized data are also available in the Saves table. (ibid.)
The second and the third group are the Satisfaction and the Workload. Here are the
feelings of the users based on the measurements. With both of them, the pie chart
shows the quantity of each type of feelings and the Not defined when the user
skipped the question. The line chart shows what the average feeling on each of the
days was. (ibid.)
The previously mentioned tools help to visualize the collected data and find the
necessary information to make decisions and improvements. Fortunately, many

19
statistical tools are available, and it depends on the company which can be useful.
Thus, the website provides the possibility to download the collected data and use it
as the customers want. The data can be downloaded in Excel format in the Reports
menu. (Samuli Muhonen 2017.)
5.2.1.4 Incident handling
The website is useable to problem solving not only at the end of the measurement
period. Some errors mean serious defects in the system and need to be handled in a
short time. Every error report inside a measurement can be opened to deal with it
more seriously. At the opening process, it can be added how critical the error is, a
description for it, the acute and preventive actions, the costs, and even a user who
will be responsible for the handling. (ibid.)
The responsible user can add comments to the opened incidents, which can occur
because there are news about the problem or an action has been done and the
comment describes it. If it has nothing to do with the incident or it is solved, the
responsible user can close it and move to the Closed incidents. (ibid.)
5.2.2 Option types
The options are the error cases which are visible in the list of the Quality activity.
Every option has a type which is set in the website. The How to use Ceriffi Check
section tells more about how to set the properties. The types have different icons in
the interest of identify them easily. Most of the types are present in the first version
of the application. Later, the Time and the Instant message types were added. (ibid.)
5.2.2.1 Simple type
Simple type is the easiest, it carries the least information about the error. It is
capable only to show the presence of the error. Thus, if the aim is to indicate the
occurrence of an error, it is worth using Simple type. The users only have to press the
right option, the counter will be incremented by one, there is nothing else to do.
Therefore, the attachment of the contents is possible only if the option is pressed
long. After choosing the content, it is not necessary to press the option again, the
application increments the counter automatically and creates the error report
attached with the content. Figure 5 shows the icon of the option and the content
selection after a long press. (Samuli Muhonen 2017; Ceriffi Check application n.d.)

20
Figure 6. Icon and dialog of String type
Figure 5. Simple type example and the content selection
5.2.2.2 String type
String type stores not only the presence of the error but something plus information
given as a text. It gives possibility to the users to add a description to the error ticket.
With this type, more detailed circumstances of the error can be recorded. The icon of
the type is visible in Figure 6. (Samuli Muhonen 2017; Ceriffi Check application n.d.)

21
After clicking on the option with String type, a new dialog opens and is visible on the
right side of Figure 6. The text to attach can be typed here. To add the error ticket,
the button on the right bottom corner has to be pressed. If the users changed their
minds and do not want to add the ticket, the dialog can be closed with the X button
in the right top corner. (Samuli Muhonen 2017; Ceriffi Check application n.d.)
There are two ways to add a content. One is the long press introduced in the Simple
type section, thus, the content is chosen before the start of the measurement. With
String type with a dialog opening it is also possible to add a content after the start,
only the Attach content label in topside has to be pressed. The attached content can
be changed by choosing the content again, or even deleted by pressing the button
with X label next to the attachment’s name. (ibid.)
5.2.2.3 Time type
Time type makes it possible to measure the time needed for a sub process inside the
measurement. Useful measurements can be created, when there is a guess that a
sub process takes too much time and evidence is needed. Figure 7 shows the icon
and the dialog of the type. (ibid.)
Figure 7. Icon and dialog of Time type

22
It works like the String type, pressing the option with Time opens a full-screen dialog.
A timer is located here which can be started and paused by the red button in the
middle of the dialog. To finish the measurement of the sub process, the button in the
right bottom corner has to be pressed, it is not necessary to pause the stopper
before save it. (Samuli Muhonen 2017; Ceriffi Check application n.d.)
The attachment of a content also works like at String type. It can happen before the
start of the measurement by a long press on the option, or during the measurement
with the control panel in the upper side of the dialog. (ibid.)
5.2.2.4 Parent type
Parent type is different from the previously presented types. The options with this
type cannot be added as an error ticket. Its aim is the grouping; it helps to organize
the other options. Simple, String and Time options can be created that a Parent type
option includes them. More options can be added to a single parent, which can also
be called a folder. It is not the only group; however, it hides the included items,
which makes the interface more transparent. (ibid.)
By clicking on a Parent type option, a new dialog opens where the options stored by
the folder are visible. Here, as described at the different types, error tickets can be
created and contents attached. If there is not available option inside the folder, the
Figure 8. Icon and dialog of Parent type
23
No available sub options label is visible in the dialog. Figure 8 shows the icon of the
type and the mentioned dialog. (Samuli Muhonen 2017; Ceriffi Check application
n.d.)
Logically, content cannot be attached to an option with Parent type. The long press
operates like a normal press, only the dialog opens. (ibid.)
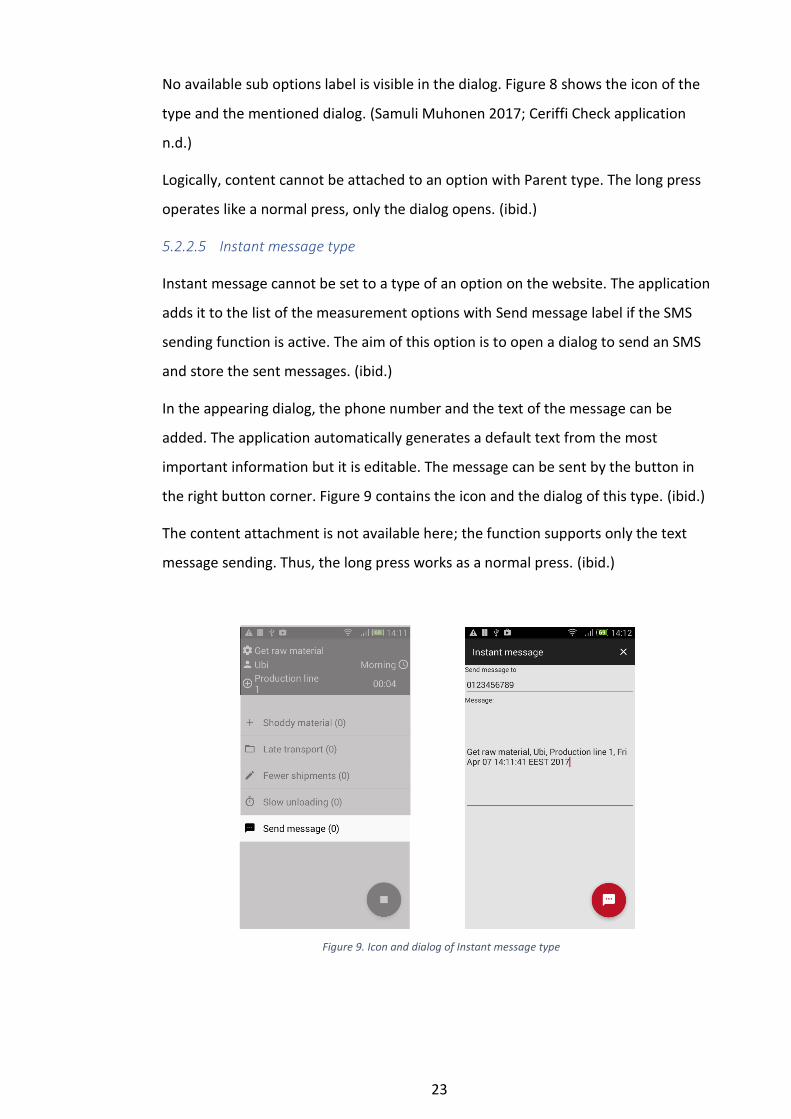
5.2.2.5 Instant message type
Instant message cannot be set to a type of an option on the website. The application
adds it to the list of the measurement options with Send message label if the SMS
sending function is active. The aim of this option is to open a dialog to send an SMS
and store the sent messages. (ibid.)
In the appearing dialog, the phone number and the text of the message can be
added. The application automatically generates a default text from the most
important information but it is editable. The message can be sent by the button in
the right button corner. Figure 9 contains the icon and the dialog of this type. (ibid.)
The content attachment is not available here; the function supports only the text
message sending. Thus, the long press works as a normal press. (ibid.)
Figure 9. Icon and dialog of Instant message type

24
6 Android application development
The main purpose was to improve Ceriffi Check and develop and increase the
usability, efficiency and simplicity. The sections below describe which kind of
features and new ways were created during the work.
6.1 Modernize the application
During the cognition of Ceriffi Check and the testing of the system, it was decided to
make some modernization steps before the innovative ideas can come to life. It was
necessary to go with the age, prepare the application to work with the newest
version of the Android system and devices, meet the users’ expectations, change the
design of the application and some functions’ way of operation to make them
simpler.
6.1.1 Increase API and its problems
The first version of the application supported the API 15 which release date is 18.
October 2011 (Android version history n.d.). Because very small percentage of the
customers use devices with this API, the first step of the modernization was the
increase the API support. The newest API 25 was the goal, however, the support of
the previous levels was desirable in order to keep the application available for the
customers who used older devices. According to 3 April 2017. data, 99% of the
Android machines use API 15 or higher (Dashboards n.d.); this means almost every
customer, thus, the API 15 is specified as the minimum API of the application.
After increasing the API, the differences between the APIs summoned some
problems. Some of them were visible immediately because the application crashed
until they were fixed. Some of them were revealed after several weeks in a
modification or development of the application, when it turned out the newer API
follows a different policy.
6.1.1.1 Send data asynchronously
One of the problems crashing the application was the method how the application
builds the connection with the server and database. In the first version, the
connection was created on the main thread, which handles the user interface. In
practice, it means that the user interface will be unusable, and the customer cannot

25
navigate on it while a picture is being uploaded to the database or a measurement is
being sent to the server, which makes the usability of the application and the user
experiment worse.
Because of similar reasons, Android is already supported with several tools to avoid
these processes running on the user interface thread, thereby relieving it from long
lasting work. Later, it became required to use these tools, thus, the application is not
working, while there is network operation on the main thread.
(NetworkOnMainThreadException n.d.)
The AsyncTask is well suited to perform operations taking only few seconds. It is a
helper class around Thread and Handler and not a generic threading framework. Its
aim is to perform short background processes and return the result. For example, a
picture can be downloaded from the network and showed on the screen while the
user interface does not become unusable during the downloading time. (AsyncTask
n.d.)
Three generic variables define the AsyncTask: (ibid.)
a) Params, the type of the parameters sent to the task upon the background
process execution.
b) Progress, the type of the progress units sent back to the caller during the
background process.
c) Result, the type of the result of the background process.
The Application uses this method to download the data required to start a
measurement. For example, the OptionListTask class is used to download the options
of a process, its definition is visible below. The type of Params is String, because the
object gets some data in String: the URL to connect to the server, the authentication
key to identify the client, the id of the process which options have to be downloaded.
If one of the parameters (Params, Progress, Result) is Void, it means no data is
passed to the AsyncTask object to work with or no data is waited back during or after
the AsyncTask process. It is not necessary to perform data during the download how
it stands; thus, the type of Progress is Void. In the source, the type of the Result is
List<Option>, i.e. the AsyncTask object returns the list of the options at the end of
the process.

26
public class OptionListTask extends AsyncTask<String, Void, List<Option>> { … }
Four processes are differentiated in the execution of the AsyncTask object:
(AsyncTask n.d.)
a) onPreExecute(), called on the UI thread before the background process starts.
It means a possibility for example to show a progress bar.
b) doInBackground(Params…), called right after the onPreExecute. It is used to
perform the background process, which takes a long time. The result of the
process is the return value of the function, it will be passed to
onPostExecute().
c) onProgressUpdate(Progress…), called when the publishProgress(Progress…)
method is called during the execution of the background process. It is used to
display any progress while the background process is still running. For
example, it can animate a progress bar.
d) onPostExecute(Result), called when the background process is finished. Its
parameter is the result of the process.
If the AsyncTask is not created inside the UI class, then there is no direct access to
the UI class inside the onPostExecute(Result) method, the result cannot be used. It
can occur when the AsnycTask class is used at multiple locations; however,
implemented only once to avoid the code duplication and the hard maintainability. In
this case, an interface is added to the AsyncTask class which looks like the
OptionListResponse in the following code:
public class OptionListTask extends AsyncTask<String, Void,
List<Option>> { public OptionListResponse delegate = null;
public interface OptionListResponse{
void processFinish(List<Option> result);
}
… }
It is the task of the caller class to implement the interface, i.e. the
processFinish(List<Option>) function. The caller also has to set itself as the
AsyncTask’s delegate object before the execution of the background process starts.
The launch of the AsyncTask process happens by the calling of the execute(Params…)
function, where the Params parameters will be passed to the
doInBackgorund(Params…) function. The execute(Params…) function will provide the

27
execution of the AsyncTask, it is not recommended to call the onPreExecute(),
onPostExecute(Result), doInBackground(Params...), onProgressUpdate(Progress...)
manually.
OptionListTask syncData = new OptionListTask(this);
syncData.delegate = this;
syncData.execute(url, authenticationKey, processId);
At the end of the background process, the AsyncTask object can identify the caller UI
object needing the downloaded data with the delegate variable. It can pass the
results via the processFinish(List<Option>) function which is implemented by the
caller class.
public class OptionListTask extends AsyncTask<String, Void,
List<Option>> {
…
@Override
protected void onPostExecute(List<Option> result) {
delegate.processFinish(result);
} }
Because of the modification of the project structure, the OptionListTask is separated
from the caller UI classes, thus, the transmission of the results is solved with
interfaces introduced above.
6.1.2 Remember the choices
The application is planned for longer use. The application installed on one device is
handled by one person, often under same conditions (e.g. The place or time of the
working does not change). In these circumstances, the constant setting of the
measurement’s properties is uncomfortable and time is wasted in long term. In the
interest of making the customer’s work easier, it is expected to remember the last
choices of the spinners in the Menu Activity.
At the first run of the application, there are no previously choices, thus, every spinner
offers the first option. With the setting of the AdapterView.OnItemSelectedListener,
it is possible to add an implementation to every spinner that saves the actually
selected option into the SharedPreferences.
SharedPreferences sp = PreferenceManager
.getDefaultSharedPreferences(getApplicationContext());
In the snippet above, the creation of a SharedPreferences object is visible with the
PreferenceManager. The object, returned via the

28
getDefaultSharedPreferences(Context) function, “points to the default file that is
used by the preference framework in the given context.” (PreferenceManager n.d.)
There is only one copy of the instance of the SharedPreferences, its aim is to read
and write the preferences. It avoids the situations where the values can become
inconsistent. For example, only the SharedPreferences.Editor object can write the
preferences and the read values must be treated as immutable objects.
(SharedPreferences n.d.)
SharedPreferences.Editor editor = sp.edit();
Process process = (Process) adapterView.getSelectedItem();
editor.putString(MENU_PROCESS, process.getName());
editor.apply();
The source code above visualizes how to create an editor object mentioned earlier
with the SharedPreferences object. The data can be saved with a key-value pair,
where the key has to be unique because it identifies the value to be saved. The
apply() function saves the changes in this case. The advantage of this function is that
it does not perform the saving immediately, the execution of the program continues
because the writing to disk is much slower, thus, it does not wait till the end of it. If
data needs to be saved on the disk before the program continues its working, the
commit() function has to be used to finalize the changes. (ibid.)
String process = sp.getString(MENU_PROCESS, ""); … for (int i = 0; i < processArrayAdapter.getCount(); i++) {
if (processArrayAdapter.getItem(i).getName().equals(process)) {
processesSpinner.setSelection(i);
}
}
In the snippet above, the name of the process is retrieved with the
SharedPreferences object selected by the user and saved with the MENU_PROCESS
id. After, the index of this process can be found and selected programmatically with a
for loop, thus, the user can see the previously chosen option. If there is no saved
data or the option is not available in the process’s list anymore, the first option will
be selected.
With the writing and reading introduced above, the selected options can be saved
when the user selects the circumstances at the start of the measurement, as well as,
according to the saved data, the options are adjustable to the previously selected
ones at the launch of the Manu Activity. With this technique, the quantity of the

29
settings right before the measurement are reducible, the measurements can be
smoother.
6.1.3 Settings activity
In the case of Settings Activity, not only the style but the logic was also changed,
which allows users to modify app features and behaviors, for example, change the
authentication key, turn on and off the SMS sending feature. The data visible on
Settings Activity is stored in the phone in the default SharedPreferences file, every
property is a preference. The PreferenceActivity started to be used which provides a
great amount of advantages: save and manipulate the preferences easily, generate
UI automatically, keep consistency with the user experience. The main things to do is
to create an XML file containing the settings’ properties, to implement the
SettingsActivity class which extends the PreferenceActivity, provides AppCompat
support and handles the changes of the preferences. (PreferenceActivity n.d.)
Every setting for the application is a subclass of the Preference class, each of which
provides properties to change, e.g. the setting’s title or default value and user
interface. A custom subclass can also be created. All settings are defined in an XML
file, which is easy to read and modify. Each setting is defined in an XML element the
name of which matches the class name. The root element is the PreferenceScreen, it
contains every setting element. The XML file is located in the res/xml/ directory with
any file name. The settings can be grouped in two different ways. The First is when
the group starts with a header and ends with a divider. In this case, the setting
elements are in a PreferenceCategory element which is in the root element. The
second solution to create groups is using sub screens. In this case, a group of setting
elements is located inside another PreferenceScreen element in the root. When the
user clicks on this group, only the settings in the group will be visible on the screen,
which is useful when there are several settings with a different goal and it can be
hard to find something and the user can lose in them. (Settings n.d.)
In the Ceriffi Check application, the category solution is used, the code snippet below
shows the general settings group with an EditTextPreference which manages the
authentication key. This is the first setting in the activity. At the first triple point,
there can be more elements belonging to the general settings group. And at the

30
second triple point, more categories or sub screens or single setting elements can be
added. (Settings n.d.)
<PreferenceScreen
xmlns:android="http://schemas.android.com/apk/res/android">
<PreferenceCategory android:title="@string/general_settings">
<EditTextPreference
android:defaultValue=""
android:key="authenticationKey"
android:summary="Please add authentication key."
android:title="@string/authentication_key" />
… </PreferenceCategory>
…
</PreferenceScreen>
The application uses the AppCompat, a set of support libraries providing the usage of
the application to devices with an older API than the target API version. The
PreferenceActivity cannot be used directly to create the settings activity because it
does not support the AppCompat. In this case, the use of AppCompatDelegate class
is needed which extends the AppCompat’s support to any Activity. The delegate can
be connected to an Activity with the create(Activity, AppCompatCallback) function.
The following snippet shows how it is created in the getDelegate() method.
(AppCompatDelegate n.d.)
public abstract class AppCompatPreferenceActivity extends PreferenceActivity {
private AppCompatDelegate mDelegate;
private AppCompatDelegate getDelegate() {
if (mDelegate == null) {
mDelegate = AppCompatDelegate.create(this, null);
}
return mDelegate;
}
}
When using an AppCompatDelegate, there are methods which must be called
instead of the Activity’s methods with the same name, for example findViewById(),
sentContentView(int). There are also methods which should be called with the
Activity’s methods at the same time, e.g., onCreate(Bundle), onStop(). The snippet
below shows an example of both cases. (ibid.)

31
public abstract class AppCompatPreferenceActivity extends
PreferenceActivity {
…
@Override
public void setContentView(@LayoutRes int layoutResID) {
getDelegate().setContentView(layoutResID);
}
@Override
protected void onStop() {
super.onStop();
getDelegate().onStop();
}
}
The SettingsActivity implements the settings, it extends the previously defined
AppCompatPreferenceActivity, thus, it provides AppCompat support for the activity.
At the onCreate(android.os.Bundle) function, a layout of views must not be called.
The class generates automatically an UI, thus, only the XML file can be added here
with the addPreferencesFromResource() function, where the preferences are
defined. The following snippet shows the previously described function. In this way,
the SettingsActivity’s screen will be generated and the application handles the
changes of the preferences.
public class SettingsActivity extends AppCompatPreferenceActivity { @Override
protected void onCreate(Bundle savedInstanceState) {
super.onCreate(savedInstanceState);
addPreferencesFromResource(R.xml.settings);
}
}
The changes of the preferences can also can be listened in the interest of reacting on
the user’s actions. For example, when the user wants to delete the authentication
key and leaves it empty, a toast message will appear to inform the user that it is not
allowed and the value will not be deleted, or when the user wants to turn on the
SMS sending feature on a device not supporting it (for example a tablet), a toast
message will inform the user about the problem and the function will not be
activated. The summary of the preferences is also updated in this way.

32
findPreference("authenticationKey").setOnPreferenceChangeListener(
new Preference.OnPreferenceChangeListener() {
@Override
public boolean onPreferenceChange(Preference preference,
Object value){
if (value.toString().length() == 0 ){
Toast.makeText(getApplicationContext(),
"Authentication key cannot be empty", Toast.LENGTH_LONG).show();
return false;
}
}
);
The snippet above shows how to add a listener to the authentication key Preference.
The findPreference(String) method returns a Preference based on its ID. To handle its
changes, a Preference.OnPreferenceChangeListener is added to the Preference,
where the action to be performed at a modification is defined in the
onPreferenceChange(Preference, Object) function. The Object contains the new
value. Because the type of the Preference is known, the new value can be cast to
String and checked if its length is zero or not. If it is, a Toast message informs the
user about the problem and the function returns with false value, so the Preference’s
value will not be changed. (Preference.OnPreferenceChangeListener n.d.)
With the usage of PreferenceActivity, the Settings Activity can be implemented in a
transparent way. New settings can be added, existing ones can be modified or
deleted easily only in the XML file because the application generates the user
interface from this file, thus, there is not layout which has to be changed. The custom
AppCompatPreferenceActivity class is extended with AppCompatDelegate, thus, it
provides AppCompat support for older versions.
6.1.4 Missing properties
To learn properly the first version of the application, a comprehensive test was
made. It helped to understand its operation and revealed defects which occurred
only in special cases but made the quality and professionalism of the application
worse.
When the customer creates an account on the website with any type, it has already
had some properties. It has an example process, time slot and case, as well as the
registered customer as a user. These are also visible in the application,
measurements can be created, although, they will not have many meanings yet. It is
easy to see that the customers will change the already created items or add new

33
ones; however, during the test, all the options were deleted or changed to inactive,
and the application was tried out with this setting. The Menu Activity was launched
but the spinners without any options was shrunk, which was annoying. The bigger
problem was the crash of the application when it was tried to start a measurement.
It makes the user experiment and the trust invested in it worse.
The solution adopted is simple and does not require much effort, though it resulted
in the improvement of the application. The aim is to refuse the start of the
measurement when there is a missing property, thus, the check of the spinners’ list
size is enough. If there is an empty list, an error message appears on the top of the
activity to ask the user to set the options on the website and the button starting the
measurement will be invisible, thus, it prevents the further operations of the
application.
Figure 10 shows the previous and the new version’s screenshots where the changes
mentioned above can be observed.
Figure 10. Missing properties: old and new version

34
6.2 Attach content to an error
In some cases, it is not enough to register an error or add a small description about
it. Hundreds of words would not be able to tell about an error such as an appropriate
image or video which can illustrate the defect much more. For example, when a
defective product arrives from the supplier or is damaged during the production, an
image can be taken of the product or a video can be recorded about the
circumstances.
In the first version of the application, only images were attached to the reports.
Before the start of the report, it was necessary to take a photo with a camera. After
this, the application attached it to the next report. The task was only to create this
error ticket. If the users changed their mind, it was possible to delete the image
before the creation of the ticket.
During the modernization of the application, a new way was researched to use this
function which is easy to use, does not take much of space needlessly on the screen
and does not require so much user operation. The context menu offers a great
solution to this problem. It is a local menu which is easy to show when the user
presses an element in the error list for a longer time. At the place of the press, a
context menu appears with any number of options. This way, only one press is
enough to select what media the user wants to attach.
This solution also offers benefits in the long term. Later, based on a customer
request, a new option was added where the user is able to attach any kind of content
freely to the report, which makes it possible to select and add a previously taken
image or recorded video; however, it is also possible to choose another file, e.g. a
PDF.

35
holder.itemView.setOnCreateContextMenuListener( new View.OnCreateContextMenuListener() {
@Override
public void onCreateContextMenu(ContextMenu contextMenu, View view, ContextMenu.ContextMenuInfo contextMenuInfo) {
contextMenu.setHeaderTitle("Select the action");
contextMenu.add(R.string.capture_image) .setOnMenuItemClickListener(new MenuItem.OnMenuItemClickListener() {
@Override
public boolean onMenuItemClick(MenuItem menuItem) {
onContextMenuClickListener.captureImage(option);
return true;
}
});
}
});
In the source code, the creation of a context menu is visible. The holder is a variable
with ViewHolder type. It is the descendant of the RecyclerView.ViewHolder and its
goal is to include all the information necessary to display an error list element on the
screen, i.e. an ImageView type variable to show the icon and a TextView type
variable to display the name of the error. The holder.imageView is the parent view of
the previous two items with View type.
If the settings are set as in the source, the Android API provides that after a long
press a context menu will appear as Figure 11 shows it. The necessary actions are to
a) create a new View.OnCreateContextListener and
b) register it to the holder.itemView.
Figure 11. Context menu to attach content

36
The display of the menu is specified inside the onCreateContextMenu function at the
creation of the listener. For example, set the title of the header or add new options.
The definition of the OnMenuItemClickListener controls what will happen when the
user selects an option. In this case, an intent will launch, which can take an image or
video or another which can select a content from the device. The last one can be a
file chooser, a recorder, or contacts chooser.
After the previously chosen intent finishes, the registration of the error ticket
continues. Thus, the error with Simple type will be added, and for the error with
Input or Time type a new dialog will open. Thus, needless actions from the user are
not necessary.
According to a customer feedback, it can occur that a user wants to attach a content
when the INPUT or TIME dialog is already open. The context menu is also available
on top of the dialog. It works with a similar logic as the list items.
6.3 Save and load the actual measurement
The measurements can last for a long time. The application’s staying in the
foreground or running in the background is not guaranteed. The normal practice of
the Android system is to kill the unused applications if the system needs more
memory to start and run another application with higher priority. The applications
can be locked to sign to the system not to kill it, however, it is still not guaranteed.
Furthermore, the lock requires one more step from the customers to do.
The first idea was to display a notification on the device when the application is sent
to the background. The system does not always close the application which is
connected to a notification. This solution was rejected because it does not work in
any cases and can be disturbing to the customer after a while.
Finally, the selected idea is to save the measurement data to the hard disk when the
run of the application is stopped, closed, sent to the background, or another
application starts to run. The saving of the data is hidden from the customers. It is
not necessary to lock the application to keep it alive, and there are no disturbing
notifications. When the application starts to run again, it loads the saved
measurement, and the user can continue the unfinished process.

37
The data is saved in JSON format. The right JSON representation of the Java Objects
is created with the Gson library which is also capable of creating a Java Object from a
JSON string. It also works with a pre-existing object, where the source of the objects
is not available. It is easy to use, and Java annotations are not needed, only two
functions as shown below: toJson() and fromJson().
Gson gson = new GsonBuilder().create();
String gsonString = gson.toJson(Measurement.getInstance()); …
instance = gson.fromJson(sb.toString(), Measurement.class);
The source code shows how to create a Gson object with the help of the
GsonBuilder. The Measurement class stores all the data about the actual
measurement. The Measurement.getInstance() static function returns only one
existing instance of the actual measuring. This is added as a parameter to the
toJson() function to create a JSON string from the object. After this, the string is
written to the hard disk with the help of a FileOutputStream object.
The measurement is saved when a new activity comes into the foreground instead of
the active one. Because of the higher priority applications, it can occur that Ceriffi
Check process dies. With this solution, the important data is safe. Later, when the
application reruns, it checks if there is a saved measurement. If the answer is yes, the
app reloads the measurement and continues the operation where it stopped.
Therefore, if the user exited during the measurement, it loads the quality activity. If
the user finished the process except the sending, then the submitting activity is
loaded.
To reload the data, the content of the file containing the measurement must be read
into a string type. After, the fromJson() function of Gson returns the Measurement
object with the help of the JSON string and the result class type parameters.
The Gson provides support to the most of the basic types and the classes which are
made from them. But the path of the contents (i.e. images, videos) is stored by Uri
objects. It is not supported by the Gson, however, at the initialization, a serializer and
a deserializer can be added to make it manageable in the following way:

38
public static class UriSerializer implements JsonSerializer<Uri> {
@Override
public JsonElement serialize(Uri src, Type typeOfSrc,
JsonSerializationContext context) {
return new JsonPrimitive(src.toString());
}
}
Gson gson = new GsonBuilder()
.registerTypeAdapter(Uri.class, new UriSerializer())
.create();
The example creates a JSON representation from a Uri object. The
registerTypeAdapter(Type, Object) function requires two parameters:
a) Type, where the serializer is used;
b) Serializer, which defines how to interpret the Type.
The UriSerializer writes down how to complete the interpretation. A Uri can be
produced by a string representation of the Uri. The toString() method of the Uri
returns this Uri string which can be handled by the Gson.
The operation of the deserializer is really similar to the previous example. In this
case, the JsonDeserializer<Uri> interface has to be implemented where the way of
the conversion is inside the overridden deserialize() function. As a Uri object can be
created by a string representation of the Uri, the return expression is the following:
return Uri.parse(src.getAsString());
Where the src variable is a JsonElement object, the parameter of the function.
6.4 Send messages during a measurement
Usually the measurements form a longer process. The responsible member of the
company sets the properties of the website, then the employees make reports about
the detected errors and deficiency with the application, during their work. To make
the right conclusions, more data may be necessary than what can be recorded during
some days. It is visible that the constant monitoring of the reports is not
remunerative in every case.
It is possible that the employee meets with a problem that is worth paying more
attention to. It can be critical to react in a few hours, instead of days or weeks. Of
course, several tools are available. The Ceriffi Check application offers sending of
instant messages, SMS.

39
6.4.1 Send SMS with Ceriffi Check
Basically, the service is not turned on, however, it can be changed easily in the
settings. A default phone number can also be added, where the message will be sent.
The application offers this number before the sending, however, it is possible to
change it.
After the activation of the service, during a measurement, the option with Send
message name in the list starts the message sending process. The appearing dialog
shows a pre-generated text created from the main information of the measurement.
It is only a help to collect what the user wants to send, and it is changeable, erasable,
and expandable.
Inside the options list, the option with Send messages name counts the number of
the sent messages during the actual measurement. It is visible only when the SMS
sending service is active. In other cases, its presence is unnecessary and
embarrassing.
6.4.2 Possibilities to implement SMS sending
There are two ways to implement the SMS sending inside an application. The first is
when another application is entrusted to send the message to the specified phone
number. This can be configured by parameters. The benefit of it is that no permission
requirements are needed in the main application because the outer application is
responsible for the sending. Its disadvantage is that there is no feedback on the
success of the sending request. There is no information how the message has been
sent or how it arrived to the addressee.
Another possibility is when the application manages the sending of the message. The
benefits and disadvantages turn around because asking for permission from the user
is required; however, feedback is available about the success.
6.4.3 Broadcast messages
The feedback sending is solvable with broadcast messages. Broadcasts are sent when
the application expects a notification when a specified event occurs. For example,
when an SMS was sent successfully, a broadcast message can inform the applications
registered to this broadcast type. System broadcasts are available when various
system events occur (for example, the airplane mode turns on and off); however,

40
custom broadcasts are also registerable. The application creates a custom broadcast
in the interest of getting a notification from the system when the SMS, sent by the
application, was sent to the addressee successfully or failed. (Broadcasts n.d.)
6.4.4 Send SMS with SmsManager
The android.telephony.SmsManager class performs the sending of data, texts, SMSs.
To create an object, the call of the getInstance() static function is needed. In the
source below is visible that the sendMultipartTextMessage(String, String,
ArrayList<String>, ArrayList<PendingIntent>, ArrayList<PendingIntent>) function can
be applied to send a text message. It requires five parameters: (SmsManager n.d.)
a) Address, where to send the message, a valid phone number.
b) Service center address, an address or null to use the default SMSC.
c) The list of the messages, if the text is too long to send it in one message, then
the divideMessage() function can split it into smaller messages.
d) Sent intents, if not null, an ArrayList of PendingIntents (one for each message
part) that is broadcast when the corresponding message part has been sent.
e) Delivery intents, if not null, an ArrayList of PendingIntents (one for each
message part) that is broadcast when the corresponding message part has
been delivered to the recipient.
SmsManager sms = SmsManager.getDefault();
ArrayList<String> dividedMessage = sms.divideMessage(textMessage);
…
PendingIntent piSent = PendingIntent.getBroadcast(context, 0,
new Intent("SMS_SENT"), 0);
sentIntents.add(piSent);
sms.sendMultipartTextMessage(phoneNumber, null, dividedMessage,
sentIntents, null);
In the snippet above, the application tries to cut the messages into parts in every
case. Because if the message is too long, it cannot send it. A sent intent can be added
to every part, in other words, broadcasts can be registered to the pieces, thus, the
application will be notified about the result of the SMS sending. In this case, only the
last part has a registered broadcast represented by the piSent object. There are not
broadcasts for the other parts, their intent is null. Thus, the application reacts only to
the sending of the last part of the message, i.e. when it was sent successfully, the
counter of the Send messages option increases.

41
The mentioned piSent is created as a PendingIntent object. The PendingIntent
contains an Intent and its target action, the target action describes when the
broadcast message must be sent. The SmsManager will register the broadcast intent
according to this object. There are four ways to create an instance, one of them is
the calling the getBroadcast(Context, int, Intent, int) function. The created object can
be given to other applications which can perform the defined operations. In other
words, a PendingIntent can be added with SMS_SENT identification and operations
can be connected to this intent which describes what to do when an SMS has been
sent. (PendingIntent n.d.)
The source code below shows how to connect the operations to the SMS_SENT
Intent.
BroadcastReceiver smsSentReceiver = new BroadcastReceiver() {
@Override
public void onReceive(Context context, Intent intent) {
if (getResultCode() == Activity.RESULT_OK){
// successfully sent the SMS } else {
// failed to send the SMS
}
}
}; registerReceiver(smsSentReceiver, new IntentFilter("SMS_SENT"));
The smsSentReceiver is a BroadcastReceiver type object. At the creation of the
object, its onReceive(Context, Intent) method has to be overridden. The system will
call this method when a new broadcast message has arrived. The getResultCode()
method returns the result of the sending process. In this way, the application can
react to any cases. If it was successful, it increases the counter. In other cases, it can
show a Toast message to inform the user about the problem and ask for another try.
With the registerReceiver(BroadcastReceiver, IntentFilter) function, the created
smsSentReceiver can be registered to the SMS_SENT broadcast. Thus, when the
application gets a broadcast message with SMS_SENT id, it will call the previously
defined onReceive(Context, Intent) method to react to the event.
This type of broadcast receiver registration is valid until its creation environment
exists. In this case, this environment is the Quality Activity. If the activity pauses, its
receivers will be deleted. Thus, the receivers have to be unregistered before the
activity pauses. The following source shows how to unregister a broadcast receiver in
the onPause() function.

42
@Override
protected void onPause() {
super.onPause();
… if (smsSentReceiver != null)
unregisterReceiver(smsSentReceiver);
}
With the introduced sending method and broadcast messages, the application can
send SMSs and manage what should happen according to the successfulness of the
sending.
6.5 Offline working
The first version of the application depended on the fact whether the device was
connected to the internet or not. At the launch, it downloaded the required
information to start a measurement: the processes, the users, the time slots, and
other information. After this, the user set the wanted circumstances, and at the
beginning of the measurement, the application downloaded the error options of the
selected process. During the measurements, at the capture of an image or video or
at the choosing of a content, the application uploaded the chosen content to the
database. At the end of a measurement, it sent the collected reports to the server. If
the internet connection had terminated during the process, error messages would
have been visible and the process would have stopped until the connection was
fixed.
The customers may not want or they are not able to connect to the network while a
measurement is under preparation. The fact that they can use the application only
when the conditions are met restricts the users. It can lead to dissatisfaction and loss
of the customers. Due to these reasons, the reorganization of the operation of the
application was needed with special attention to preserve the recorded data.
6.5.1 Download and save the required information
To launch a measurement, some information is needed, such as what kind of
processes exist, what kind of measures they have, who the users are, what the time
slots and the cases are. The first version of the application just retrieved the
information that was needed at that moment. At the launch of the application,
during the Splash Activity, it downloaded the data which appears in the Menu
Activity: processes, users, time slots, cases. And at the start of the measurement, it

43
downloaded only the options of the selected process. It is effective because it
downloads only the necessary information, however, it is not really useful when
working offline.
The operations rethought, the Splash Activity can be used to download all the data
that is needed to launch the application, not only the data for the Menu Activity but
also the options of the processes. The loading time increases with this solution;
however, all data can be saved. Thus, at every online start of the application, the
necessary data is saved, and the freshest data is always stored. If the application
works offline, the most accurate data is available. The process which takes place in
the Splash activity is shown in Figure 12. It can be seen as the saving refreshes at
every start. However, if the device is not online and there is no saving, it can show
only an error message, where it informs the user about the cause of the problem and
workable solutions (e.g. connect to the internet).
The Launch the next activity label is not completely clear. In this case, the application
checks if there is an active measurement which was interrupted earlier. If there is,
and it is still in progress, then the Quality Activity launches with the saved
measurement. If there is an active measurement which is finished but not saved to
the server, then the Submission Activity launches. If there is no saved measurement,
the Menu Activity launches.
6.5.2 Upload the attached contents
The second phase of the redesign was to provide the upload of the contents.
Because the user can interrupt the measurements, it is not required to upload it
anyway, therefore it is not logical to upload the contents during the measurement. If
the measurement is interrupted but the content is uploaded, it takes place with no
reason, waste is produced. Thus, the uploading of the contents is moved exactly in
front of the measurement upload. To do this, the OptionAnswer class was modified
which represents one error report. The mentioned class stored the type of the error,
the description of the occurred error, the date, and the identification of the attached
content. It was expanded with the Uri and the size of the attached content.
Unique URI identifies the images, videos, and other files. They are created according
to the content scheme which is shown below as follows: content://authority/path/id
(ContentUris n.d.)

44
Figure 12. Flowchart of the Splash Activity
The parts of the content scheme can be described as follows: (ContentUris n.d.)
a) Content, the scheme portion of the URI.
b) Authority, identifies the entire content provider.
c) Path, identify some subset of the provider's data.
d) Id, unique numeric identifier.
With the two new members, the files connected to an error ticket are exactly
identified. At the upload, timed later, reaching the contents does not mean a
problem.

45
6.5.3 Upload the measurements
The idea was to avoid the online communication during a measurement, and the
upload had to be replaced from its end. To perform it, the application was expanded
with the SavedMeasurements class. Its function is to store the finished and sent
measurements in a list. When a customer sends a measurement, in truth it is added
to this list. Furthermore, the class is written to the hard disk when a new
measurement comes. It works with the Gson library introduced in the Save and load
the actual measurement chapter. The preserve of the measurements is assured.
The upload of the measurements is hidden from the customers, and it locates in the
background. As often as the Menu activity loads (i.e. at the launch of the application
or at the end of a measurement), the application checks the internet connection of
the device. If it works, it then starts the upload in a different thread.
The MeasurementSenderThread class is responsible for the upload, the descendant
of the Thread class. The object uploads the items one after another, it always gets
the first element of the list. This is important because if a new measurement is
created, it will be added to the end of the list. Thus, it is not possible to delete the
newly created measurement from the list at the end of the upload process.
The class takes the error reports one after the other from the previously selected
measurement. Where it finds attached content, it uploads it to the database. If the
uploading process has finished successfully, it notes the fact in a Boolean variable. If
the process has failed, then there is a great chance that the content is already
deleted, and therefore the application deletes the URI from the error report in the
interest of avoiding the further uploading attempts of the content. If the process was
terminated because of an error (e.g. no internet connection), it will try to upload the
content again at the next uploading of the measurement. With the help of the
Boolean variable the successfully uploaded contents are identified easily, and they
will not be uploaded for a second time.
If the uploading of the contents is finished, the application sends the measurement
in question to the server. To do it, it builds a JSON string that the server can
understand and converts it to its database. If it finishes, the measurement will be
deleted from the list of the saved measurements. If it does not finish successfully, it
means the server is not available or the internet connection is gone. In this case, the

46
application cannot continue the uploading process, thus, the whole process stops. In
every two case the SavedMeasurements object is written to the hard disk to save the
changes.
6.5.4 Feedback to the user
Because the offline function works in the background, the users do not get notices
about its job or do not even know that it exists. To change it, on the Menu Activity’s
Toolbar a menu item shows the number of the saved measurements if at least one is
stored. It provides information to the users that the saving was successful and they
can track how the sending is standing.
By clicking on the menu item, a new activity starts which only shows the number of
the saved measurements and some information for the user. If the device is offline, it
informs the user that in order to send the measurements, they should connect to the
internet. If the device is online and the sending is already in progress, the layout
changes: the puck of the number starts animating and the “Uploading…” text will be
visible. This two type of layouts can provide enough details for the users about the
sending process. Figure 13 shows the activities.
Figure 13. The Menu and Background Activities
With this solution, the application can work without internet connection when the
data to start a measurement is available. The users can create reports continuously
without interruption. The application collects the created reports in offline mode and

47
when the connection exists, it sends them to the server. It runs in the background,
thus, the users are not disturbed.
6.6 Parallel Time option reports
While a user makes a Time type report, something unexpected can happen and the
user has to pause the actual report in order to react to the event. For example, when
a user measures a process where a machine creates a product, they notice there is a
fault in the machine that they have to fix immediately, or replace a fixture or
material. These failures interrupt the Time type report because the user has to stop it
and register the occurred errors as well. The user can register them later, after the
Time type report has finished, however, this way brings unnecessary difficulty to the
user.
The applied solution in the application are the parallel reports. According to the idea,
the user can start a Time type report and when it is necessary, it can be sent to the
background. After this, the user can create other error reports or even start more
Time type reports. When the users want to carry on a report, they can find it in the
background tasks and continue it where they finished.
To send the actual report to the background, the report’s data is saved in the
Measurement object which stores the actual measurement. The object’s
backgroundOptionsList variable contains the background tasks and its type is
List<JsonElement>. The TimeOptionDialog class (extends DialogFragment) is
responsible for manage the timing: it opens the dialog to perform the time
measurement, operates the stopper, and stores the accessibility of the attached
content. To save the report, only the necessary information has to be saved and not
the whole class. Thus, the backgroundOptionsList stores the JSON representation of
the dialog object.
This JSON string contains the information required to build the Time dialog again: the
data to manage the stopper which measures the time, the data about the attached
content if it exists and the option to which the dialog belongs. With this solution, not
only the Time type reports but any type can also be added to the background tasks
list. The newly added report’s class only has to implement the JsonSerializer<Object>
and JsonDeserializer<Object> interfaces. Then, the Gson library introduced earlier
can convert them from and to JSON strings.

48
To send the actual Time type report to the background, only the saving button has to
be pushed in the left bottom corner in the dialog. The application converts the dialog
object with the Gson into a JSON string and adds it to the previously introduced
backgroundOptionsList list. Then the dialog dismisses it in order to show the Quality
Activity, thus, the user can make more parallel reports. Figure 14 contains a
screenshot of the dialog and the changed activity.
Figure 14. From left to right: the stop button, the Time dialog, and the expandable menu button
The activity’s floating action button in the right bottom corner provides the main
control of the activity. During a measurement, when there are no background tasks,
the button’s function is only to stop the measurement. In this case, the button is the
regular FloatingActionButton; however, when one or more background tasks are
available, this button is replaced with a custom RapidFloatingActionButton
(hereinafter RFAB) providing a local menu. When the user presses the button, it
opens a menu to show the background tasks and the stop button. This way, the users
can return to the previously started report or finish the measurement. Figure 14 also
shows this case. (RapidFloatingActionButton n.d.)
The setup of the RFAB starts in the activity’s layout file. The button must be placed in
a layout element as the code example shows below. The RapidFloatingActionLayout
also contains other visual components visible in the activity. In normal cases, this
layout element should be the root. But this button does not support the normal

49
function of a FloatingActionButton, thus, it was needed to separate the cases when
only a stop button is visible, and when some background task and the stop button
together are visible. In order to place the two buttons in the same place, the root
element must have been a CoordinatorLayout which can contain the
RapidFloatingActionLayout element first with the menu button and then the
FloatingActionButton for the stop button. The example below shows the final
structure of the layout file. (RapidFloatingActionButton n.d.)
<android.support.design.widget.CoordinatorLayout>
…
<com.wangjie.rapidfloatingactionbutton.RapidFloatingActionLayout>
…
<com.wangjie.rapidfloatingactionbutton.RapidFloatingActionButton />
</com.wangjie.rapidfloatingactionbutton.RapidFloatingActionLayout>
<android.support.design.widget.FloatingActionButton />
</android.support.design.widget.CoordinatorLayout>
The RapidFloatingActionContentLabelList solution is responsible for filling and
assigning content of RFAB when it expands. The example below shows how to add
items. It iterates through the background tasks’ list and adds every task to the items.
Because the list contains JsonElement objects, the application can check its type and
configure the appearance of the item when the menu expands: the text of label, the
icon, the normal and pressed colors. In this way, the reports with different types can
be distinct. As the last item, the stop item is also added to the content to make the
finish of the measurement possible. (ibid.)
RapidFloatingActionContentLabelList rfaContent = new
RapidFloatingActionContentLabelList(getApplicationContext());
rfaContent.setOnRapidFloatingActionContentLabelListListener(this);
List<RFACLabelItem> items = new ArrayList<>();
for (int i = 0; i < m.getBackgroundOptionsList().size(); i++){
JsonElement element = m.getBackgroundOptionsList().get(i);
if (element.getAsJsonObject().getAsJsonPrimitive("type") .getAsString().equals("TIME")) {
items.add(new RFACLabelItem<Integer>() /*set properties*/ );
}
}
items.add(new RFACLabelItem<Integer>()/*set properties of stop item*/);
rfaContent.setItems(items); /*can set also visual properties*/
Finally, the components have to be combined in a RapidFloatingActionHelper object:
the context of the application, the layout and button from the layout file and the
previously configured content. The object’s build() function makes it ready to use the
menu. The code snippet below shows the building method. (ibid.)

50
RapidFloatingActionOwnLayout rfaLayout =
(RapidFloatingActionOwnLayout) findViewById(R.id.activity_main_rfal);
RapidFloatingActionButton rfaBtn = (RapidFloatingActionButton)
findViewById(R.id.activity_main_rfab);
RapidFloatingActionHelper rfabHelper = new RapidFloatingActionHelper(
getApplicationContext(),
rfaLayout,
rfaBtn,
rfaContent
).build();
At the content configuration, the Quality Activity was set to listen the clicks on the
items. In order to perform it, the activity implements the functions with name
onRFACItemLabelClick(int, RFACLabelItem) and onRFACItemIconClick(int,
RFACLabelItem). When the user clicks on the stop item, the application starts to
finish the measurement; however, when a report item is clicked, the application
checks its type. If it is a Time option, then with the data stored in the selected
background task item and the Gson library, the application creates a
TimeOptionDialog and shows it. Thus, the user can continue the operation of the
paused report. With the type checking, reports with another type can also be
reactivated. The code example below shows the described functionality.
(RapidFloatingActionButton n.d.)
public class QualityControlActivity extends AppCompatActivity
implements RapidFloatingActionContentLabelList
.OnRapidFloatingActionContentLabelListListener{
…
@Override
public void onRFACItemLabelClick(int position, RFACLabelItem item){
if (position == m.getBackgroundOptionsList().size()){
onStopClicked(null); /* finish the measurement */
} else {
Gson gson = new GsonBuilder().registerTypeAdapter(
TimeOptionDialog.class, new TimeOptionDialog()).create();
TimeOptionDialog timeOptionDialog =
gson.fromJson(m.getBackgroundOptionsList().remove(position),
TimeOptionDialog.class);
… /* show the dialog in full screen mode */
}
}
}
This solution is also used when the user sends the whole application in the middle of
a measurement to the background. The actual measurement is saved in the device
and reloaded when the application restarts. When a Time type report is in progress
when the application disappears, it is sent to the background tasks automatically.
This way, the report will be saved, it does not get lost. When the application restarts,
it loads the interrupted report: the last started report is in the end of the background

51
tasks list, thus, when a Boolean variable in the SharedPreferences with name
isTimeOptionDialogShowed is saved with true value, the application creates a dialog
based on the last added report. The operation of the measurement can continue
smoothly.
The parallel reports function is still in testing phase when this document is written,
thus, there is no information from the users what they think about it, how useful
they find it; however, the expectations are positive, hopefully it will make the
promises and increase the functionality of the application.

52
7 Conclusion
7.1 Results
It was succeeded to learn about Six Sigma, introduce the basic approaches needed to
fully understand how Six Sigma projects work and why they are useful for the
companies. One of its main models, the DMAIC and its stages were used to
demonstrate how Six Sigma looks in the practice. Some tools used during the
projects are also described, in particular those which are well useable at the DMAIC
stages where the Ceriffi Check application does not provide support, such as the
Define or Improve stages. It has become visible that several tools are easily usable
even for beginners.
It was successfully described how Ceriffi Check connects to Six Sigma and how it is
integrated into the DMAIC model. It was introduced how the system was created and
how it works in practice: the configuration on the website, the measurement making
in the Android application, and the collected data analysis and evaluation.
The goals set was achieved well. In the first round, the modernization of the
application was accomplished, and it is usable also in the newer devices. During this
process, there were some important tasks, e.g. increasing the API number and
building an asynchronous connection with the server. There was also some comfort
innovation, such as remembering the user's choices at the measurement starting.
After the modernization, some new features have been implemented. The content
attachment to the reports got a new robe, now not only images but videos and other
contents can also be added. Sending SMS inside the application became available,
thus, the users can inform the managers about the key details of an error
immediately. In addition, some new ways have been implemented in order to change
the functionality of the application and to expand its abilities. When the application
goes to the background, it saves the measurement in progress and loads it when the
application continues the work again. Now the application can also work in offline
mode: it saves the measurements in the mass storage and when the device is online,
they will be sent to the server. Finally, the users can pause, send the timing reports
to the background and create other reports parallelly.

53
The users’ feedback is valuable because it shows how successfully the application
met with the expectations and requirements. Fortunately, the customers were in
daily connection with the company, thus, their requests and ideas were transmitted.
Sometimes the requests were simple but useful, e.g. making an input field multiline,
or that a button covers an input field and it is annoying. Sometimes there were
slightly bigger challenges to accomplish an idea, for example, when a customer asked
for a time measuring possibility inside a measurement and based on this, the Time
option was created. Thanks to the fast reaction for the requests and the openness for
the new ideas, the customers were satisfied and used the application with pleasure.
7.2 Recommendation
It is often said that the development of an application never finishes but only stops.
Therefore, there are some ideas also in this project which had to be left out from this
document because of the lack of time. Some of them are planned to be implemented
in the future, however, out of the scope of this document.
There are plans to accomplish a check list feature. Before the start of the
measurement, the customer can check that everything is available to perform the
measurement and if there is anything to do before the start. For example, when
truck drivers leave for a transport, they can go through a check list to see that
everything is ready: cargo is loaded, GPS is working, food is in the truck, or when a
specialist goes to repair a device 100 km away, he/she can check that every
necessary tool is loaded and ready to use. This feature can prevent the interrupted
measurements and some failures (e.g. missing tools).
When sending an SMS, the users have to write the phone number where they want
to send the message. It can be hard for them because they may not know the
number by heart. Thus, they have to search for it in the device, then enter it to the
application’s input field. It could be easier if a content chooser would be available
inside the application. This way, the users could choose the contact person by name
and they would not need to keep the phone number in mind.
At the submission activity, the user can review the recorded reports once again
before the sending. Right now, only the name of the options and the number of the
created reports per options is visible. If the options are in a Parent option, their total
number is visible only next to the Parent option. This summary table can be

54
improved, for example to show these child options separately. They can also be
editable to correct a spelling error or even removable to delete them when the user
notices that an option with Check type was pushed twice by accident. It is only an
idea; to realize it, a concrete plan should be elaborated with a survey, for example
what the users need.
The creation of account management in the application with different privileges can
be considered. For example, there would be two different types of accounts: one for
the employees which provides the same functionality as the present application. One
account would be for the managers, which also makes it possible to track the already
created measurements via the application, not only the website. It can help the
managers to see and follow the reports easily.
The options can be created with incident handling. When a report is created with this
option type, a new incident is opened. This incident means a serious problem which
has to be treated as soon as possible. Thus, an idea was to send a notification email
from the phone or from the server to the person responsible for handling the error.
This idea also can be connected with the previously introduced one, to show the
newly created incidents inside the application for the responsible managers.
During a meeting, a question came up: is it possible to configure the settings via the
application instead of the website? This can be useful because the users do not need
to visit the website to make this work. Finally, the idea was deferred because it
requires more feature in the application. Now the website also provides information
about how to use and configure the Ceriffi Check system. The users should learn first
why this program is useful for them and how to use it; however, in the future this
idea can be actual and it is worth keeping in mind.
The application is now available only for Android devices, which means a large group
of users; however, not almost everyone. If the users want to use Ceriffi Check and
they do not own a device with Android system, they have to buy one. This problem
can be a cause for someone to choose another tool, and it can prevent that a
company starts using Ceriffi Check. Thus, the development of the application into
different systems and devices (e.g. iOS) is planned.

55
7.3 Evaluate
When the development of a new function had been finished, it was tested
thoroughly before the version in the Google Play was refreshed. After many
functions, it was tiring to test all of them. It would have been better to make unit
tests to evaluate the functions one by one and make automated tests to verify the
correct operation of the whole application.
The new design of the application is satisfactory; however, there are some elements
which might have been solved better. For example, at the Submission Activity, the
send button covered the input panel of the notice. The beginning of the panel was
visible well; however, the end of it not. The panel is multiline; however, when a line
was too long, it was not visible because of the button. These solutions are not the
best and they would have been avoidable with better design.
The connection with the customers was more than good. They provided feedback
after every version change which made it much easier to track the users’ satisfaction
with the developments. In the future, this process can be even improved, for
example if they tell about their problems and ideas more frequently and not only
when they are asked; a questionnaire can be useful to collect and manage the
feedback.
The improvement of the application was not problem free. Fortunately, almost all
the developments were finished in good order without any additional defect;
however, there was a bug: when the user creates two or more background timing
reports, the user interface becomes unusable. It took plenty of time to find a solution
and it was only a temporary, not a nice one. Because of the lack of time, there was
no possibility during the work to fix it and find a final solution. Of course, it works
and the users can use it but it is not satisfying.
7.4 Summary
All in all, the development of Ceriffi Check brought many possibilities. First, it
introduced the main direction of quality management, and it showed how important
it is to reach and maintain the high quality. It also introduced one of the most
powerful management tools: Six Sigma. It is not only successful but it emphasizes the
utility of the practical tools beside the theory. The aim was not to become a

56
professional in quality management but learn the basics and add it to the personal
toolbar to keep in mind the best practices.
The project provided possibilities to work in a larder Android application with real
customers. It was invaluable to keep the contact with the users, hear the feedback
on the new functions and try to follow the wishes. In most cases, there was no exact
specification how to implement a task, the developments excepted planning and
creativity in order to find a good solution.
The writing of the document revealed an important thing. It is always a good idea to
evaluate what has been done, how the solution was implemented. During the writing
of a new function, it was forced to go over the source code thoroughly in the interest
of making an appropriate description. This action sometimes brought some illogical
things and prospective bugs to the surface. It turned out, it was really worth
inspecting the work that had been done multiple times.
Thanks to the project, it was possible to work on a challenging but enjoyable
application. It always showed something new and required the improvement of
personal and developer skills.

57
References
5 Why’s. N.d. Page on iSixSigma’s website. Accessed on 5 April 2017. Retrieved from https://www.isixsigma.com/dictionary/5-whys/
A Six Sigma Eszköztára, Elemzés fázis [Tools of Six Sigma, Analyse]. 2009. Page on Sixsigma.hu - Hazai Szakmai Portál’s website. Accessed on 6 April 2017. Retrieved from http://www.sixsigma.hu/six-sigma-eszkoztara-analyse-elemzes-fazis
A Six Sigma Eszköztára, Mérés fázis [Tools of Six Sigma, Measure]. 2009. Page on Sixsigma.hu - Hazai Szakmai Portál’s website. Accessed on 28 March 2017. Retrieved from http://www.sixsigma.hu/six-sigma-eszkoztara-measure-meres-fazis
Android version history. N.d. Page on Wikipedia’s website. Accessed on 12 April 2017. Retrieved from https://en.wikipedia.org/wiki/Android_version_history
AppCompatDelegate. N.d. Page on Android Developers’ website. Accessed on 1 May 2017. Retrieved from https://developer.android.com/reference/android/support/v7/app/AppCompatDelegate.html
AsyncTask. N.d. Page on Android Developers’ website. Accessed of 12 April 2017. Retrieved from https://developer.android.com/reference/android/os/AsyncTask.html
Avoid Failure When Using Failure Modes and Effects Analysis (FMEA). N.d. Page on iSixSigma’s website. Accessed on 5 April 2017. Retrieved from https://www.isixsigma.com/tools-templates/fmea/avoid-failure-when-using-failure-modes-and-effects-analysis-fmea/
Broadcasts. N.d. Page on Android Developers’ website. Accessed on 10 April 2017. Retrieved from https://developer.android.com/guide/components/broadcasts.html
Ceriffi Check. N.d. Page on Ceriffi Check’s website. Accessed on 17 January 2017. Retrieved from http://www.cerifficheck.fi/
Ceriffi Check application. N.d. Page on Google Play’s website. Accessed on 17 January 2017. Retrieved from https://play.google.com/store/apps/details?id=fi.ceriffi.mobileqc
ContentUris. N.d. Page on Android Developers’ website. Accessed on 6 April 2017. Retrieved from https://developer.android.com/reference/android/content/ContentUris.html
Dashboards. N.d. Page on Android Developers’ website. Accessed on 12 April 2017. Retrieved from https://developer.android.com/about/dashboards/index.html
Ishiwaka diagram. 2017. Page on Wikipedia’s website. Accessed on 5 April 2017. Retrieved from https://en.wikipedia.org/wiki/Ishikawa_diagram
John McNamara. N.d. Example: Pareto Chart. Page on XlsxWriter’s website. Accessed on 5 April 2017. Retrieved from http://xlsxwriter.readthedocs.io/example_chart_pareto.html
Samuli Muhonen. 17 January 2017. Personal communication.
NetworkOnMainThreadException. N.d. Page on Android Developers’ website. Accessed on 18 April 2017. Retrieved from

58
https://developer.android.com/reference/android/os/NetworkOnMainThreadException.html
PendingIntent. N.d. Page on Android Developers’ website. Accessed on 10 April 2017. Retrieved from https://developer.android.com/reference/android/app/PendingIntent.html
Preference.OnPreferenceChangeListener. N.d. Page on Android Developers’ website. Accessed on 1 May 2017. Retrieved from https://developer.android.com/reference/android/preference/Preference.OnPreferenceChangeListener.html
PreferenceActivity. N.d. Page on Android Developers’ website. Accessed on 1 May 2017. Retrieved from https://developer.android.com/reference/android/preference/PreferenceActivity.html
PreferenceManager. N.d. Page on Android Developers’ website. Accessed on 11 April 2017. Retrieved from https://developer.android.com/reference/android/preference/PreferenceManager.html#getDefaultSharedPreferences(android.content.Context)
Thomas Pyzdek & Paul A. Keller. 2010. The Six Sigma Handbook. 3rd ed. New York: McGraw-Hill Professional Publishing
RapidFloatingActionButton. N.d., Page on Github’s website. Accessed on 10 May 2017. Retrieved from https://github.com/wangjiegulu/RapidFloatingActionButton
Settings. N.d. Page on Android Developers’ website. Accessed on 1 May 2017. Retrieved from https://developer.android.com/guide/topics/ui/settings.html
Seven Basic Tools of Quality. N.d. Page on WhatIsSixSigma.NET’s website. Accessed on 28 March 2017. Retrieved from http://www.whatissixsigma.net/7-qc-tools/
SharedPreferences. N.d. Page on Android Developers’ website. Accessed on 11 April 2017. Retrieved from https://developer.android.com/reference/android/content/SharedPreferences.html
Kerri Simon. N.d. a. The Cause and Effect (a.k.a. Fishbone) Diagram. Page on iSixSigma’s website. Accessed on 5 April 2017. Retrieved from https://www.isixsigma.com/tools-templates/cause-effect/cause-and-effect-aka-fishbone-diagram/
Kerri Simon. N.d. b. Histogram. Page on iSixSigma’s website. Accessed on 5 April 2017. Retrieved from https://www.isixsigma.com/tools-templates/graphical-analysis-charts/histogram/
Kerri Simon. N.d. c. Pareto Chart. Page on iSixSigma’s website. Accessed on 27. April 2017. Retrieved from https://www.isixsigma.com/tools-templates/pareto/pareto-chart-bar-chart-histogram-and-pareto-principle-8020-rule/
SmsManager. N.d. Page on Android Developers’ website. Accessed on 7 April 2017. Retrieved from https://developer.android.com/reference/android/telephony/SmsManager.html
Tim van de Vall. 2013. Fishbone Diagram Example. Page on Tim’s Printables’ website. Accessed on 5 April 2017. Retrieved from http://www.timvandevall.com/printables/templates/fishbone-diagram-example/