ani, ngozi peace pg/m.sc./08/49246 project current page_0.pdf · pg/m.sc./08/49246 a dissertations...
TRANSCRIPT

1
ANI, NGOZI PEACE
PG/M.Sc./08/49246
Ogbonna Nkiru
Digitally Signed by: Content manager’s Name DN : CN = Webmaster’s name O= University of Nigeria, Nsukka
OU = Innovation Centre
FACULTY OF BIOLOGICAL SCIENCES
DEPARTMENT OF MICROBIOLOGY
EVALUATION OF SOME NIGERIA CORN
VARIETIES FOR FUEL ETHANOL
2
EVALUATION OF SOME NIGERIA CORN
VARIETIES FOR FUEL ETHANOL PRODUCTION.
BY
ANI, NGOZI PEACE
PG/M.Sc./08/49246
DEPARTMENT OF MICROBIOLOGY
UNIVERSITY OF NIGERIA, NSUKKA
SUPERVISOR: PROF .J. C. OGBONNA
APRIL, 2014.
3
TITLE PAGE
EVALUATION OF SOME NIGERIA CORN VARIETIES FOR FUEL
ETHANOL PRODUCTION.
BY
ANI, NGOZI PEACE
PG/M.Sc./08/49246
A DISSERTATIONS SUBMITTED IN PARTIAL FULFILLMENT OF
THE REQUIREMENT FOR THE MASTER OF SCIENCE (M.SC)
DEGREE IN MICROBIOLOGY
TO
DEPARTMENT OF MICROBIOLOGY
UNIVERSITY OF NIGERIA, NSUKKA
SUPERVISOR: PROF .J. C. OGBONNA

4
APRIL, 2014.
CERTIFICATION
ANI, NGOZI PEACE, a postgraduate student in the Department of Microbiology, majoring in Industrial Microbiology and Biotechnology, with a registration number PG / M.Sc / 08 / 49246, has satisfactorily completed the requirement for the degree of Master of Science (M.Sc) in Microbiology. The work embodied in this research project is original and has not been submitted in part or full for any diploma or degree of this or any other University. ---------------------- --------------------------- Prof. J. C. Ogbonna Prof A.N. Moneke Supervisor Head, Department of Microbiology, Department of Microbiology, University of Nigeria, Nsukka University of Nigeria, Nsukka

5
DEDICATION
This project is dedicated to my Lord and personal Saviour Jesus Christ, my beloved father, Mr. S.C. Ani, my sister Charity and my brother, Great.

6
ACKNOWLEDGEMENT
My sincere regards and special thanks go to my project supervisor, Prof J.C. Ogbonna for his
concern and encouragement during this work. He was not just a supervisor, but a father and adviser
I wish to express my joy to Prof A.N. Moneke, Head of Department, lecturers and all members of
staff of Microbiology Department, fellow colleagues and the management of the University of
Nigeria Nsukka (UNN) for their immense contributions.
My special regard and appreciation also go to my fellow brethren of Amazing Love Assembly for
their spiritual support. Mr. Chijioke Eze a doctoral student has been good to me in the area of
statistical analysis.
I am greatly indebted to my Father (Mr. S. C. Ani), my sister Charity and my little brother Great for
their tireless and sacrifice efforts which made my stay here a success.
7
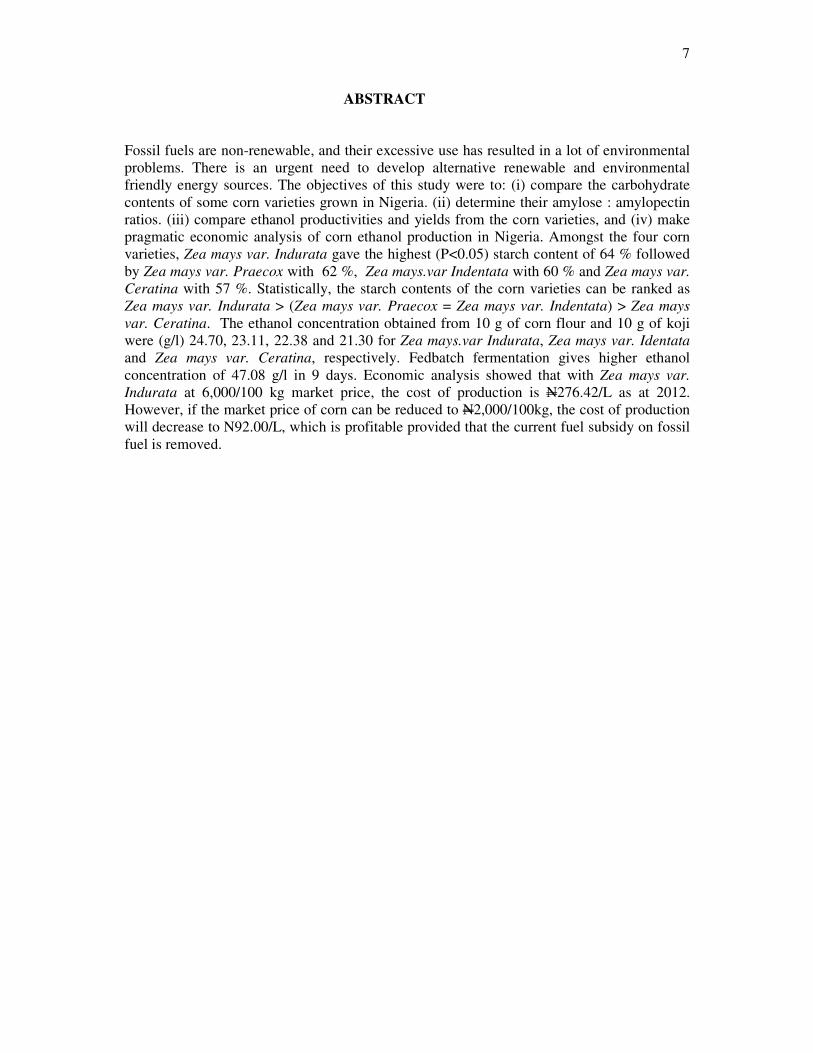
ABSTRACT
Fossil fuels are non-renewable, and their excessive use has resulted in a lot of environmental problems. There is an urgent need to develop alternative renewable and environmental friendly energy sources. The objectives of this study were to: (i) compare the carbohydrate contents of some corn varieties grown in Nigeria. (ii) determine their amylose : amylopectin ratios. (iii) compare ethanol productivities and yields from the corn varieties, and (iv) make pragmatic economic analysis of corn ethanol production in Nigeria. Amongst the four corn varieties, Zea mays var. Indurata gave the highest (P<0.05) starch content of 64 % followed by Zea mays var. Praecox with 62 %, Zea mays.var Indentata with 60 % and Zea mays var.
Ceratina with 57 %. Statistically, the starch contents of the corn varieties can be ranked as
Zea mays var. Indurata > (Zea mays var. Praecox = Zea mays var. Indentata) > Zea mays
var. Ceratina. The ethanol concentration obtained from 10 g of corn flour and 10 g of koji were (g/l) 24.70, 23.11, 22.38 and 21.30 for Zea mays.var Indurata, Zea mays var. Identata and Zea mays var. Ceratina, respectively. Fedbatch fermentation gives higher ethanol concentration of 47.08 g/l in 9 days. Economic analysis showed that with Zea mays var.
Indurata at 6,000/100 kg market price, the cost of production is N276.42/L as at 2012. However, if the market price of corn can be reduced to N2,000/100kg, the cost of production will decrease to N92.00/L, which is profitable provided that the current fuel subsidy on fossil fuel is removed.
8
TABLE OF CONTENTS
Title page - - - - - - - - i
Approval page - - - - - - - ii
Dedication - - - - - - - - - iii
Acknowledgement - - - - - - - - iv
Abstract - - - - - - - - - v
Table of contents - - - - - - - - vi
List of figures - - - - - - - - - ix
List of Tables - - - - - - - - - x
CHAPTER ONE: INTRODUCTION AND LITERATURE REVIEW
1.1 Introduction - - - - - - - 1
1.2 Raw materials used for Ethanol - - - - - - - 1
1.3 Methods used for bio – ethanol production - - - - - 2
1.4 Energy Balance in bio – ethanol / Energy Efficiency - - - - 4
1.6 Criticisms on bio - fuel production - - - - 6
1. 7 Ethanol production cost (Economic Efficiency) - - - - 7
1.8Statement of problem - - - - - - - - 8
1.9 Aims and Objectives - - - - - - - - 8
1.9.1 Literature Review - - - - - - - 9
1.9.2 Biochemistry of hydrolysis and fermentation - - - - 10
1.9.3 Fermentation Techniques - - - - - - - - 12
1.9.4 Ethanol and the Environment - - - - - - - 13
CHAPTER TWO: MATERIALS AND METHODS

9
2.0 Microorganisms - - - - - - - 25
2.1 Preparation of Reagents - - - - - - - 25
2.2 Media preparation and Inoculation of microbes - - - - - 25
2.3 Methodology - - - - - - - - - 27
CHAPTER THREE: RESULTS
3.1 Starch, amylose and amylopectin contents of the corn varieties - - 31
3.2 Ethanol production from corn varieties - - - - - - 35
3.3 Alpha and gluco-amylase activities during ethanol production. - - 35
3.4 Effect of ratio of koji to corn flour on ethanol production - - - 37
3.5 Fed – batch ethanol production from Zea mays var. Indurata - - 37
3.6 Economic analysis of corn ethanol production - - 41
CHAPTER FOUR: DISCUSSION AND CONCLUSION
4.1 Discussion - - - - - 45
4.2 Conclusion - - - - - 46
REFERENCES - - - - 47
APPENDIX - - - - 48

10
LIST OF FIGURES
Figure 1: Fate of pyruvate of yeast (anaerobic condition).
Figure 2: Starch contents of raw corn varieties.
Figure 3: Amylose contents of raw corn varieties.
Figure 4: Amylopectin contents of raw corn varieties.
Figure 5: Simultaneous hydrolysis and ethanol production from gelatinized Zea mays
var.Indurata.
Figure 6: Simultaneous hydrolysis and ethanol production from gelatinized Zea mays var.
Praecox.
Figure 7: Simultaneous hydrolysis and ethanol production from gelatinized Zea mays var.
Indentata.
Figure 8: Simultaneous hydrolysis and ethanol production from gelatinized Zea mays var.
Ceratina.
Figure 9: Alpha-amylase enzyme activities in koji during fermentation.
Figure 10: Gluco-amylase enzyme activities in koji during fermentation.
Figure 11: Effect of ratio of koji to flour on ethanol production from Zea mays var. Indurata.
Figure 12: Effect of ratio of koji to flour on ethanol production from Zea mays var. Praecox.
Figure 13: Fed – batch production of ethanol from Zea mays var. Indurata.
11
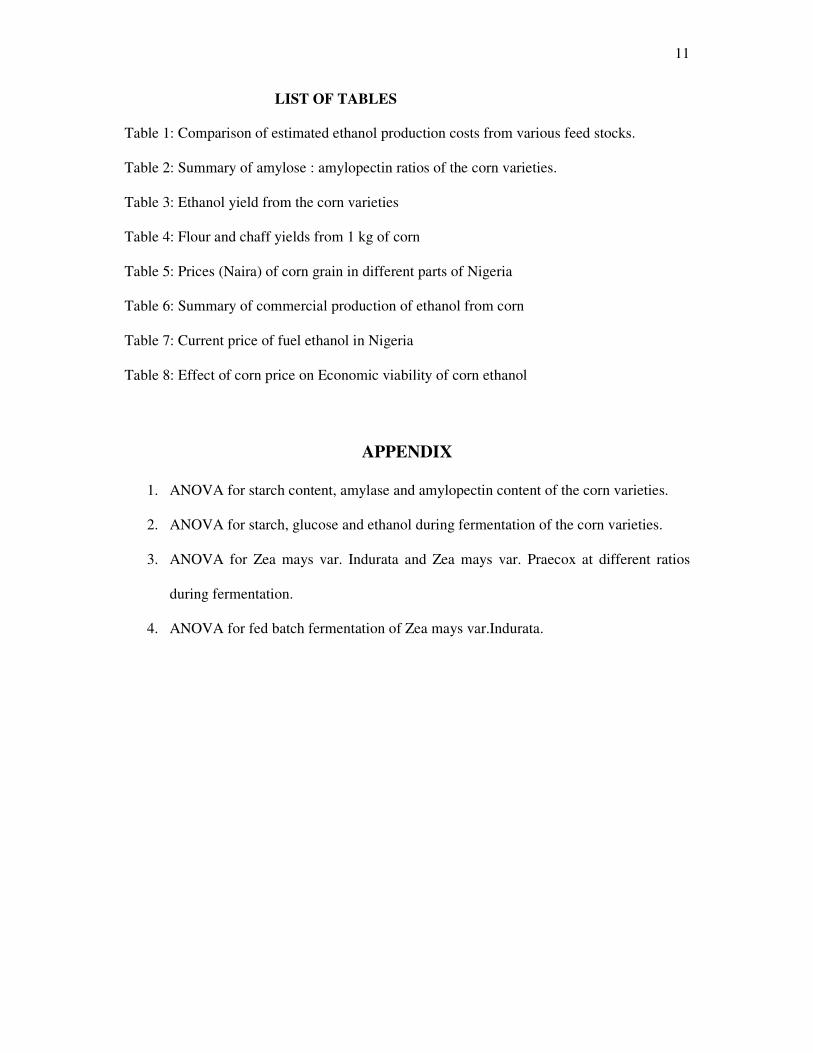
LIST OF TABLES
Table 1: Comparison of estimated ethanol production costs from various feed stocks.
Table 2: Summary of amylose : amylopectin ratios of the corn varieties.
Table 3: Ethanol yield from the corn varieties
Table 4: Flour and chaff yields from 1 kg of corn
Table 5: Prices (Naira) of corn grain in different parts of Nigeria
Table 6: Summary of commercial production of ethanol from corn
Table 7: Current price of fuel ethanol in Nigeria
Table 8: Effect of corn price on Economic viability of corn ethanol
APPENDIX
1. ANOVA for starch content, amylase and amylopectin content of the corn varieties.
2. ANOVA for starch, glucose and ethanol during fermentation of the corn varieties.
3. ANOVA for Zea mays var. Indurata and Zea mays var. Praecox at different ratios
during fermentation.
4. ANOVA for fed batch fermentation of Zea mays var.Indurata.
12
CHAPTER ONE
1.0 INTRODUCTION AND LITERATURE REVIEW
1.1 INTRODUCTION
Fuel ethanol is an alcohol produced for use as fuel. It is either used as a main source
of energy or as an octane enhancer (Rausch et al; 2006). Some vehicles can run on 100%
ethanol while others use blends of ethanol and gasoline (gasohol) in various proportions
(Farrell et al; 2006). It is a very important agricultural product. It burns cleaner for the
environment (Lubert et al; 2005). Fuel ethanol is a renewable energy source produced mainly
by the fermentation process but can be synthesized by chemical processes such as reacting
ethylene with steam (Anuj et al; 2007). Fuel ethanol produced from different biomass
materials is called bio-ethanol. It is renewable and it has lower energy density that gasoline
and availability of feedstock for bio- ethanol can vary considerably from season to season.
Fossil fuels are non-renewable, and their excessive use has resulted in a lot of environmental
problems. Thus, there is an urgent need to develop alternative renewable and environmental
friendly energy sources (Adenola et al; 2008). Furthermore, the current cost of production is
still very high due to high cost of raw materials. Selection of raw materials for bio ethanol
production is based on availability and cost which may vary from region to region (Van
Ejantten, 2005). There is therefore a need to look for cheap and easily available raw material
in Nigeria for bio-ethanol production. Fuel ethanol can be produced from different starch
sources such as corn and cassava.
1.2 Raw Materials used for Ethanol production.
Different raw materials are used for ethanol production such as bee, sugar cane, sweet
sorghum and fruits. Starchy materials such as corn, milo, wheat, rice, potatoes, cassava, sweet
potatoes etc. Cellulose materials like wood, used paper, crop residues (Krishan et al; 2011).
Corn is commonly used because of the high starch contents it has in order to yield more
ethanol. Corn is produced in almost all parts of the country. It is an important cereal being
cultivated in the rainforest and the derived savannah zones in Nigeria. There are different
uses of corn which include cornmeal, popcorn, corn flakes, starch, cooking oil, corn syrup
and ethanol (Van Ejantten, 2005). In order to sustain corn production in Nigeria, it is
necessary to expand markets for corn by developing methods of processing the corn into
value-added products in the country. The interest in production of bio-ethanol as an
alternative fuel is increasing due to the non-renewable nature of fossil fuels and the
13
environmental problems associated with their use. In order to produce bio-ethanol as bio-fuel,
the production cost has to be as low as possible. The cost of raw material (carbon source)
represents more than 70 % of the total production cost (Krishan et al; 2011). Therefore
production of bio-ethanol at competitive price requires the use of cheap raw material. Ethanol
yield from corn depend on such factors as starch contents as well as on their amylase and
amylopectin ratios.
1.3 Methods used for bio-ethanol production
Corn ethanol is ethanol produced from corn. There are two processes by which corn
ethanol can be produced. There are Wet Milling and Dry Milling.
Wet Milling Method
In wet milling the grain is soaked or “steep” in water and dilute with sulfurous acid (65
%) for 24 to 84 hours. This steeping facilitates the separation of the grain into its many
component pats. After steeping the corn slurry is processed through a series of grinders to
separate the corn germ. The corn oil from the germ is either extracted on site or sold to
crushers who extract the corn oil. The remaining fiber gluten and starch components are
further segregated using centrifugation screen and hydrochloric separators.
The steeping liquid is concentrated product, heavy steep water, is co-dried with the
fiber component and is then sold as gluten feed to the livestock industries. Heavy steep water
is also sold by itself as a feed ingredient and is used as a component of Ice Ban, an
environmentally friendly alternative to salt for remaining Ice from road (Singh, 2008). The
glutton component (protein) is filtered and dried to produce corn gluten meal co-product. The
starch and any remaining water from the mash can processed in one of the three ways;
fermented into ethanol dried and sold as dried and modified corn starch, or processed into
corn syrup.
Dry Grind Method
In the dry-grind ethanol process, the whole grain is processed; the residual components are
separated at the end of the process. There are five major steps in the dry-grind method of
ethanol production.
These Includes:
• Milling
• Liquefaction
• Saccharification

14
• Fermentation
• Distillation and recovery
Milling
Milling involves processing corn through a hammer mill (with screens between 3.2 to 4.0
mm) to produce a corn flour (Raush et al; 2006). This whole corn flour is slurried with water.
Liquefaction.
This slurry is cooked, also known as “Liquefaction”. Liquefaction is accomplished using a
beaker that injects steam into the corn flour slurry to cook it at temperatures above 100 0C
(212 0F). The heat and mechanical shear of the cooking process break apart the starch
granules present in the Kernel endosperm, and the allowed to cool to 80 – 90 0C (175-195
0F), additional enzyme (alpha amylase) is added, and the slurry is allowed to continue
liquefying for at least 30 minutes.
Saccharification
After liquefaction, the slurry, now called “corn mash,” is cooled to approximately 30 OC (86
OF), and the koji enzyme is added to complete the breakdown of the starch into simple sugar
(glucose). This step, called “saccharification” often occurs while the mash is filling the
fermentor in preparation for the next step (fermentation) and continues throughout the next
step.
Fermentation
In the fermentation step, yeast cells grown in the conical flask (S. cerevisiae) are added to the
corn mash to being the process of converting the simple sugars to ethanol (Wang, 2008). The
other components of the corn Kernel (Protein, oil etc) remain largely unchanged during the
fermentation process.
In most dry-grind ethanol plants, the fermentation process occurs in batches. A fermentation
tank is filled, and the batch ferments completely before the tank is drained and refilled with a
new batch.
The up-stream processes (grinding, liquefaction, and saccharification) and downstream
processes (distillation and recovery) occur continuously (grain is continuously processed
through the equipment). Thus, dry-grind facilities of this design usually have three
fermentors (tanks for fermentation) where, at any given time, one is filling, one is fermenting
(usually for 48 hours), and one is empting and resetting for the next batch (Farrell et al;
2006). Carbon-dioxide is also produced during fermentation. Usually, the carbon-dioxide is
not recovered and is released from the fermenters to the atmosphere. If recovered, this

15
carbon-dioxide can be compressed and sold for carbonation of soft drinks or frozen into dry
ice sold product storage and transportation.
Distillation and Recovery
After fermentation, the liquid portion of the slurry has 8-12 % ethanol by weight. Because
ethanol boils at a lower temperature than water does, the ethanol can be separated by a
process called “distillation”.
Conventional distillation/rectification systems can produce ethanol at 92 – 95 % purity. The
residual water is then removed using molecular sieves that selectively adsorb the water from
an ethanol/water vapor mixture, resulting in nearly pure ethanol (99 %). The residual water
corn solids that remain after the distillation process are called “stillage”. This whole stillage
is then centrifuged to separate the liquid (thin stillage) from the solid fragments of the kernel
(wet cake or distillers’ grains). Some of the thin stillage (backset) is recycled to the beginning
of the dry-grind process to conserve the water used by the facility.
The remaining thin stillage passes through evaporators to remove a significant portion of the
water to produce thickened syrup (Farrell et al; 2006). Usually, the syrup is blended with the
distillers’ grains and dried to produce an animal feed called “distillers’ dried grains with
soluble” (DDGS). When markets for the feed product are close to the plant, the byproduct
may be sold without drying as distillers for the feed product are close to the plant, the
byproduct may be sold without drying as distillers’ grains or wet distillers’ grains.
The advantage of dry-grind process over wet-milling process is that plants can be built at a
smaller scale for smaller investment. It is also less expensive (i.e lower costs because less
energy is required), lower emissions and greater co-product output because the mash is more
highly concentrated.
1.4 Energy Balance in Bio-ethanol Production/Energy Efficiency
Fossil energy inputs and emissions levels from bio-fuel production are sensitive to
process and feedstock, to energy embedded in fertilizers, and to local condition. Production
of ethanol from sugar cane (Brazil) is energy – efficient since the crop produces high yields
per hectare and the sugar is relatively easy to extract. If bagasse is used to provide the heat
and power for the process, and ethanol and bio-diesel are used for crop production and
transport the fossil energy input needed for each ethanol energy unit can be very low
compared with 60 % - 80 % for ethanol from grains. As a consequence, ethanol well – to
wheels Co2 emission can be as low as 0-2 – 0.3 kg Co2 / liter ethanol compared with 2.8 kg

16
Co2 / liter for conventional gasoline (90 % reduction). Ethanol from sugar beet requires more
energy input and provides 50 % - 60 % emission reduction compared with gasoline (Wang,
2008).
Ethanol production from cereals and corn (maize) can be even more energy intensive
and debate exists on the net energy gain (Krishan et al; 2011). Estimates, which are very
sensitive to the process used, suggest that ethanol from maize may displace petroleum use up
to 95 % but total fossil energy input currently amounts to some 60 % - 80 % of the energy
contained in the final fuel (20 % diesel fuel, the rest being coal and natural gas) and hence in
comparison with gasoline, the Co2 emissions reduction may be as how low as 15 % (Mueller
et al; 2008).
1.5 Ethanol from lingo-cellulosic feedstock. At present, the total energy input needed may
be even higher than that of bio-ethanol from corn. However in some cases most of such
energy can be provided by the biomass feedstock itself. Net Co2 emission reduction from
lingo-cellulosics ethanol can therefore be close to 70 % and could approach 100 % if
electricity co-generation displaced gas or coal-fired electricity. Current R & D aims to exploit
the large potential from improving efficiency in enzymatic hydrolysis. (Singh, 2008). Energy
input and overall emissions for bio-diesels production also depend on feedstock and process.
Typical values fossil fuels inputs of 30 % and Co2 emission reductions of 40 % - 60 % in
comparison with diesel using recycled oils and animal fats reduces the Co2 emission.
Cost of production of bio-fuels: Costs of bio-fuels are highly dependent on feedstock,
process land and labour costs, credits for byproducts, agricultural subsidies, food (sugar) and
oil market. Ethanol energy content by volume is two thirds that of gasoline, so costs should
be based on liter of gasoline equivalent.
Ethanol is a fuel with a high octane number and a low tendency to create knocking in
spark ignition and engines. Oxygen in its molecule permits low temperature combustion with
reduction of CO and Nox emissions. Low percentage ethanol gasoline blends (5% - 10 %)
can be used in conventional spark-ignition engine with almost no technical change (David et
al; 2005). New flex fuel vehicles of which there are over 6 million running mainly in Brazil,
United State and Sweden, can run on up to 85 % ethanol blends having had modest changes
made during production. Ethanol combustion offers fuel and emissions savings due to the
high octane number, the high compression ratio and the combustion benefits from ethanol
vapour cooling which partly offsets its lower energy content per liter. Further hydrolysis,
microorganisms and to improve conversion of 5-carborn sugar to ethanol. Securing sufficient
17
low cost biomass supply over a long period will need to be resolved. Ethanol could
experience rapid expansion in North American and Europe by leap fogging a number of
traditional barriers faced by alternative fuels for transport. In the period 2004-2005 global
ethanol production increases by 8 % a year from 30.5 to 33 billion liters (Gabby, 2007). The
end of 2005, there were 95 operating plants in the United State with total capacity of 16.4
billion liters per year (bnl per year). In mid 2000, 35 additional plants were under constitution
with further capacity of 8 bnl per year. Brazil has over has 3000 plants in operation, of which
8 licensed in 2005, and is expected to increase sugar cane production by 40 % by 2009 as a
part of a new national plan. The potential market for bio-ethanol is estimated at around 45 EJ
by 2050.
Several countries have adopted policies such as tax exemptions, mandates and
incentives for bio-fuels in 2005-2006. For example targets 5.75 % bio fuels by 2008 and 10
% by 2015; Germany requires 2 % ethanol and 4.4 % bio-diesel in 2007, increasing to 5.75 %
by 2012; Italy mandates 1 % blend for both ethanol and bio-diesel in 2006; and in the
beginning of 2007, the European Commission proposed at 10 % target by 2020. In U.S, fuel
distribution are required to increase the annual volume of bio-fuels up to nearly 30 bnl by
2012 with the target for “renewable and alternative fuels” raised in 2007 to 140 bnl by 2017.
Target and mandates also exist in non OECD countries (e.g; Brazil, China).
1.6 Criticisms on bio –fuel production
Ethanol, o ethyl alcohol, is an alcohol made by fermenting and distilling simple
sugars. As a result, ethanol can be produced from any biological feedstock that contains
appreciable amount of sugar or materials that can be converted into sugar such as starch or
cellulose sugar beets and sugar cane are examples of feedstock that contain sugar. Corn
contains starch that can relatively easily be converted into sugar. In the United State, corn is
the principle ingredient used in the production of ethanol; in Brazil (traditional the world’s
largest ethanol producer), sugar cane is the principle feedstock. A significant percentage of
trees and grasses are made up of cellulose which can also be converted to sugar, although
with more difficulty than required to converted starch. In addition, sorghum and potatoes as
well as crop residues and animal wastes, are potential feed stocks. Ethanol production has
shown rapid growth in the United States in recent years.

18
1.7 Ethanol Production Cost (Economic Efficiency).
Ethanol’s primary fuel competitor is gasoline. Whole sale ethanol prices, before incentives
from the federal state governments, are generally significantly higher than those of their fossil
fuel counter parts (Gabby, 2007). Apart from government incentives the economics
underlying corn-based ethanol market competitiveness hinge on the following factors:-
• The price of feedstock.
• The price of processing fuel, primary natural gas or electricity, used at the ethanol
plant.
• The cost of transporting feedstock to the ethanol plant and transporting the finished
ethanol to the user.
• The price feedstock co-products (for dry-milled con: distillers dried grains; for wet-
milled corn. Corn gluten feed, corn gluten meal, ands corn oil).
Higher prices for corn, processing fuel and transportation hurt ethanol’s market for
competitiveness, while higher prices for corn by product and gasoline improve ethanol’s
competitiveness in the marketplace. Feedstock cost is the largest single cost factor in the
production of ethanol (Lubert et at; 2005). Each kilogramme of corn yield approximately 2.7
liter of ethanol. As a result, the relative relationship of corn to gasoline prices provides a
strong indicator of the ethanol industry’s well-being.
Government support: - There is a need for Government support in terms of research,
income tax credit and incentives for research on renewable fuels.
Energy Efficiency: The net energy balance (NEB) of a fuel can be expressed as a ratio of the
energy produced from a production process relative to the energy used in the production
process (Haefele et at; 2004). An output/input ratio of 1.0 implies that energy output equals
energy input. The critical factors underlying ethanol energy efficiency or NEB include:
• Corn yield per acre.
• The energy efficiency of corn production, including the energy embodied in inputs
such as fuels, fertilizer, pesticides, seed corn, and cultivation practices.
• The ethanol yield from the raw material for the case of corn, the yield is 2.64 gallons /
bushel (for dry mill) and 2.68 gallons / bushel (for wet mill).
19
1.8 STATEMENT OF PROBLEM
• Fossil fuels are non-renewable. Although ,Nigeria is a major fossil oil producing
country in the world. It is estimated that the present Nigeria oil reserve will last for
less than 40 years.
• At Global level, on the average, the oil reserve will be depleted in less than 50 years.
• Combustion of fossil fuels leads to increase in atmospheric Co2 which is a major
cause of global warming.
• Bio-ethanol is renewable and environmental friendly. Fuel ethanol is already
commercially- produced in many countries but there is no commercial production yet
in Nigeria and most other African countries.
• To make production of bio-ethanol economically viable, it is necessary to select cheap
and readily available raw material because the cost of raw material represents more
than 60 % of the total production cost.
• Nigeria has a lot of potential raw materials for fuel ethanol production but there is yet
no detailed evaluation in terms of productivities and yields.
1.9 AIMS AND OBJECTIVES
• To compare the carbohydrate content of some corn varieties growth in Nigeria.
• To determine the amylose: amylopectin ratio in some corn varieties grow in Nigeria.
• To compare ethanol production and yields from the some varieties.
• To make pragmatic economic analysis of corn ethanol production in Nigeria.

20
1.9.1 LITERATURE REVIEW
Microorganisms for production of fuel ethanol: Many organisms have been found to
produce ethanol (i.e. yeast and bacteria). Saccharomyces cerevisae, Saccharomyces exiguous.
Saccuharomyces florentinus, Saccharomyces markii, Sacchramyces diastatics, pichia
burtonii, Cadida Sp., including cadida mycoderma; C. tropicalis, (Swings and Deley, 2006).
Besides yeasts, it is known that several bacteria produce ethanol from palm wine and
carbohydrate (Olawale et al; 2010), especially species belonging to the genera Lactobacillus,
Streptococcus, Zymomonas, Pedococcus, Sacrina, Corynebacterium, Micrococcus and
Klebsiella. During the ‘70s’ oil was cheap, and fuel ethanol was produced industrially from
this source. Today, this production is not economical.
Although many microorganisms can be employed to produce fuel ethanol,
Saccharomyces cerevisiae is still the main industrial and predominant ethanol producing
yeast. It is largely responsible for the alcohol contents and for the frothing because of carbon
(IV) oxide formation. In fact, specific strains that are able to overproduce fuel ethanol in
different types of fermentation process have been developed. The theoretical yield is 90 %
and 40 g/l ethanol tolerance.
The advantage of Saccharomyes cerevisiae over other microorganisms with respect to
ethanol yields and productivities includes:
• It is capable of producing ethanol reliably in larger bioreactors.
• It is robust.
• It is well suited to fermentation.
• It ferments mannose and after adaptation, also galactose.
• It has high ethanol tolerance and high rate of fermentation activity (Xiang-yang et al;
2005).
1.9.2 Biochemistry of Hydrolysis and fermentation.
Hydrolysis and fermentation are the two basic bio-reactions that take place during the
productions of bio-ethanol. This is so because the enzyme (gluco-amylase) produced by some
microbes such as Aspergillus niger and Aspergillus awamori help carryout hydrolysis which
makes the sample easily accessible by the yeast strain (Saccharomyces cerrevisiae) during
the fermentation sate of the entire production process.

21
HYDROLYSIS
Hydrolysis reaction is the addition of molecule of water to a peptide bond.
O
C
The above reaction renders the starch/protein held by this peptide bond to become lose
thereby making the starch accessible by other substances (yeast strain).
Microbial enzymes are often used in the hydrolysis of starch in the hydrolytic stage of the
entire process. The enzyme gluco-amylase or acid resistant amylase which is produced by
Apergillus niger and A. awamori is used in the hydrolysis of starch.
BIOCHEMISTRY OF FERMENTATION BY YEAST
Fermentation is a general term for anaerobic degradation of glucose and other wort
carbohydrates to obtain fermented products (Ethanol) and energy conserved as ATP.
Yeast
Glucose + N2 Source _________________ Ethanol + Co2 + Energy
Anaerobic Condition
Anaerobic breakdown of glucose is probably the most ancient biological mechanism
obtaining energy from fuel molecules. The biochemistry behind the conversion of glucose
and other glucose related nutrients is termed Glycolysis. The thermodynamic principle and
the types of regulatory mechanism that governs glycolysis are common to all pathways of
cells metabolism (Gabby, 2007).
An overview of glycolysis shows that it has three (3) stages. The breakdown of glucose
into two molecules of the 3-carbon pyruvate occurs in ten (10) stages. In stage one, glucose is
trapped and destabilized; In stage two, two inconvertible 3- carbon molecules are generated
by cleave of the 6-carbon fructose; and in stage three ATP is generated and pyruvate is
formed which will further break down depending the condition it further finds itself. The fate
of the pyruvate thus formed in yeast is broken down to Ethanol as shown in the pathway
below.
R2 + H2O
R1 N
R1 – C C-D + R2—NH3+
O
O
H
I

22
Pyruvate Dehydrogenase
Alcohol Dehydrogenase
Fig. 1: Fate of pyruvate in yeast (anaerobic condition).
The above breakdown (Glycolysis and fate of pyruvate in yeast) to yield ethanol is the result
expected from yeast fermentation of glucose related nutrients simple sugar that are found in
the corn meal.
Substrates for Ethanol production
Several raw materials such as starch materials, sugar e.t.c. have been employed as substrate
for submerged fuel ethanol production. However, fuel ethanol is mostly produced from starch
or sucrose base medium using submerged fermentation. Some other substances such as
molasses, hard and soft woods and Jerusalem Artichoke Tubers have also been investigated
(Xiang – Yang Get et al; 2005).
Starchy materials are preferably used as the source of sugar for microbial production
of ethanol due to high sugar contents. According to Oyeleke and Jibrin, (2009) reported on
guinea corn husk and millet husk; ethanol yield from guinea corn husk (26.83 g/1) and millet
husk (18.31 g/1) were obtained. S.A. Ado, 2009 reported on corn cobs using S.cerevisiea and
A.niger. The corn cobs used gave 4. 17 % maximum yield. Nwachukwu et al; 2008 reported
on high – ethanol yield. S.cerevisiea using protoplast fusion and obtained 16 % v/v maximum
yield. However, Nathan et al; 2005 have investigated work on corn also among others but
Pyruvate
Ethanol
H+
Co2
Acetaldehyde
NADH + H+
NDA+

23
there has not been works on different corn varieties with A. niger hydrolyzing the starch and
S.cerevisiae producing the ethanol.
1.9.3 Fermentation Techniques.
Various fermentation techniques, such as submerged, solid state and surface cultures,
and modes of fermentation operation such as batch, fed-batch and continuous, have been
developed and used for the improvements of various fermentation processes (Mathew et al;
2003).
Submerged fermentation:
The submerged fermentation processes is widely used for ethanol production. Mixing
in submerged processes can be by mechanical agitation on by air circulation (Rokem et al;
2011). It is estimated that 90 % of world production of ethanol is obtained by submerged
fermentation. Submerged fermentation can be carried out in batch, fed-batch or continuous
system, although the batch mode is more frequently used. Ethanol fermentation is normally
concluded in 6 to 10 days, depending on the conditions of process.
However, composition surface culture, submerged cultures are somewhat less
sensitive to changes in the composition of media, that is an advantage when using starch
having a highly variable composition, simpler, requires lower volumes of waste water and
requires low cost for downstream processing (Rokem, 2011). On the other hand, a typical
problem of submerged culture is the formation of foam, which can be avoided using antifoam
agents and chambers with volume up to one third of the total fermentation volume and more
sophisticated technology and the high cost of energy, which in turn requires expertise in the
field.
Solid State fermentation
Solid Substrate fermentation (SSF) is defined as the growth of microorganisms on moist solid
substrates (termed solid substrate fermentation) or on inert substrate used as solid support. In
both cases enough water is present to maintain microbial growth and metabolism (Olawale et
al; 2010). There is free – moving water is and air is the continuous phase. SSF technology
provides many new opportunities as it allows for the use of agricultural waste products as
fermentation substrates without the need for extensive pretreatment. Solid state culture is
characterized by the development of microorganism in a low-water activity environment on
an insoluble material that acts as physical support and source of nutrient.

24
As compared to submerged fermentation, solid substrate fermentation offers these
advantages:
• High surface exchange for air/substrate.
• Limited consumption of water.
• Low energy consumption.
Although, various fermentation techniques can be applied for ethanol production, it was
proven that, the submerged fermentation gives the highest efficiency in terms of yield,
maximum ethanol concentration and also overall productivities. The main disadvantage of
solid state fermentation is that they are hard to reproduce compared to submerged
fermentation (Olawale et al; 2010).
1.9.4 Ethanol and the Environment
Increasing industrial activity and population growth has resulted in a rising concentration of
‘greenhouse gases’ in the atmosphere that contribute to the ‘Greenhouse Effect’. These gases
include carbon dioxide, methane, and nitrous oxide. The term ‘Greenhouse Effect’ refers to
the Earth’s trapping of the sun’s incoming solar radiation, causing warming of the Earth’s
atmosphere. This offsets the Earth’s natural climatic equilibrium, and results in a net increase
in global temperatures. ‘Global Warming ‘is a term used to describe the increasing average
global temperature. The term ‘Climate Change’ refers to a wide range of changes in weather
patterns that result from global warming. A substantial increase in the Earth’s average
temperature could result in a change in agricultural patterns and melting of polar ice caps,
raising sea levels and causing flooding of low-lying coastal areas. The Earth’s climate is
ready adjusting to past greenhouse gas emissions, and the average global temperature is
expected to rise by 1OC to 3.5OC by the year 2100 (This increase in average temperature is
larger than that which has been experienced). By 2100, the Earth’s average sea level is
predicted to rise by approximately 50 cm. These phenomena could have serious repercussions
on the natural and physical environments as well as on human health with the threat of global
warming &energy crises in today’s environment the need for clean, “green” fuels is quickly
becoming a necessity. The U.S. Environmental protection Agency considers ozone to be the
most wide spread air pollution problem. To combat this problem, ethanol is widely used in
reformulated gasoline’s to help urban cities meet public health standards for ozone. Because
it’s produced form renewable resources, ethanol is the only transformation fuel that reduces
greenhouse gas emissions from cars. Fossil fuels release carbon dioxide, a greenhouse gas

25
that traps the earth’s heat, contributing to global warming. Ethanol is made from agricultural
crops, which “breathe” carbon dioxide and give off oxygen. This maintains the balance of
carbon dioxide in the atmosphere.
Increased use of renewable fuels ethanol will help counter the pollution and global
warming effects of burning gasoline (Lubert et al; 2005) under current conditions, use of
ethanol blended fuels as E85 can reduce the net emissions of greenhouse gases by as much 30
– 36 % and can further contribute by decreasing fossil energy use by 42-48 %. Ethanol
blended fuel as E10 reduces greenhouse gases by 2.4-2.9 % and fossil energy use by 3.3-3.9
%. The E10 blend reductions are lower because a smaller fraction of the blend is ethanol.
With improved Technologies and use of ethanol made from cellulose, these reductions in
emissions will increase (Iken et al; 2002).
Environmental Benefits of Fuel Ethanol
Carbon Dioxide
Carbon dioxide from the burning of fossil is the largest single source of greenhouse gases
from human activities, representing about half of all greenhouse gas emissions. Use of 10 %
ethanol-blended fuels results in a 6-10 % CO2 reduction and higher levels of ethanol can
further reduce the net quantity of CO2 emitted into the atmosphere (Farrel et al; 2006) More
CO2 is absorbed by crops growth than is released by manufacturing and using ethanol. The
carbon dioxide produced during ethanol production and gasoline combustion is extracted
from the atmosphere by plants for starch and sugar formation during photosynthesis. It is
assimilated by the crops in its roots, stalks and leaves, which usually return to the soil to
maintain organic matter, or to grain, the portion currently used to produce ethanol. Only
about 40 percent or less of the organic matter is actually removed from the farm field for
ethanol production. The rest is returned to the soil as organic matter, increasing fertility and
reducing soil erosion. With modern conservation farming practices, this soil organic matter
will build up, representing a net removal of carbon dioxide from the atmosphere. An increase
of only 1% in the soil organic matter level means an atmospheric reduction of over 40 tones
of CO2 per hectare of farmland (/Heafele et al; 2004). Canada has vast areas of agriculture
cropland. Most of these soils could benefit from increasing soil organic matter by several
percentage points. Ethanol use in gasoline has tremendous potential for a net reduction in
atmospheric carbon dioxide levels.

26
Carbon Monoxide
Carbon monoxide, formed by the incomplete combustion of fuels, is produced most readily
from petroleum fuels which contain no oxygen in their molecular structure. Because ethanol
and other “Oxygenated” compounds contain oxygen, their combustion in automobile engines
is more complete. The result is a substantial reduction in carbon monoxide emissions.
Research shows that reductions range up to 30 %, depending on type and age of automobile
emission system used, and the atmospheric conditions in which the automobile operates
(Watson et al; 2000).
Nitrous Oxide (N2O)
Agricultural grain production for ethanol may generate a slight increase in nitrous (N2O)
emissions resulting from heavy fertilizer use. However, research and advances in agricultural
technology in grain production are resulting in a reduction of these emissions, often to levels
below other common crops.
Other Octane Additives
Because of its high octane rating, adding ethanol to gasoline can permit the reduction or
removal of aromatic hydrocarbons (such as benzene), and other hazardous high-octane
additives commonly used to replaced tetra-ethyl lead in Canadian gasoline.
Ozone.
Because of its effects in reducing hydrocarbons and carbon monoxide in exhaust (that causes
respiratory problems), adding ethanol to gasoline results in an overall reduction in exhaust
ozone-forming potential (Krishan et al; 2011). Adding ethanol to gasoline can potentially
increase the volatility of gasoline. This potential is controlled if all ethanol-blended gasoline
sold in Canada meets the volatility standards required for other types of gasoline. In contrast,
the U.S. Clean Act allows gasohol (gasoline plus 10 % ethanol) to have a higher volatility
than that of gasoline. This results in greater “volatile organic compounds” emissions.
Therefore, the Canadian ethanol blend has less potential to form ozone than the American
counterpart.
Adding of ethanol to gasoline does create slightly greater amounts of aldehydes during fuel
combustion. Yet the resulting concentrations are extremely small and are effectively reduced
by the three-way catalytic converters in the exhaust systems of all recent-model cars. The
27
Royal society of Canada termed the possibility of negative health effects caused by aldehyde
emissions with the use of ethanol blended gasoline as being “remote”.
Environmental Behavior
Recent reviews of the environmental behavior of gasoline oxygenates generally note that
ethanol is not likely to accumulate or persist for long in the environment. For example, the
interagency Assessment of Oxygenated Fuels observes that ethanol is expected to be rapidly
degraded in groundwater and is not expected to persist beyond source areas (Watson et al;
2000). Ethanol in surface water is also expected to undergo rapid biodegradation, as long as it
is not present in concentrations directly toxic to micro-organisms. The half-life of ethanol in
surface water is reported to range from 6.5 to 26 hours. Atmospheric degradation is also
predicted to be rapid.
Health Effects
Ethanol, the active ingredient of alcohol beverages, has been part of the human diet and the
human environment – for thousands of years. It is produced by fermentation by fungi and
other micro-organisms, and is found at low levels in the blood and breath of persons who do
not drink alcohol. Ethanol is widely ingested in alcoholic beverages, usually with only mild
effects. However, at sufficiently high doses, ethanol can cause toxic effects in humans, both
short-term (such as inebriation) and long-term (such as cirrhosis of the liver). If ethanol
becomes a common fuel additive, there may be opportunities for exposure by inhalation:
ethanol vapors might be inhaled at gasoline stations or in automobiles, for example. Thus,
concern has been raised about the possible health consequences of using of ethanol for this
purpose.
Energy Values
When evaluating the energy value many areas need to be researched including Carbon
Monoxide, Ozone, Octane Enhancement, Carbon Dioxide, and Aldehydes.
An example of the reductions that can be observed when using ethanol blends in your engine
is the following (per vehicle mile). Current Corn and Ethanol Production case for Corn-based
Ethanol Use of E10 (10 % ethanol and 90 % gasoline by volume) achieves:
• 6 % reduction in petroleum use,
• 1 % reduction in GHG emissions, and
• 3 % reduction in GHG in fossil energy use.
28
Use of E85 (85 % ethanol and 15 % gasoline by volume) achieves:
• 73 – 75 % reduction in petroleum use,
• 14 – 19 % reduction in GHG emissions, and
• 34 – 35 % reduction in fossil energy use.
Use of E95 (95 % ethanol and 5 % gasoline by volume) achieves:
• 85 – 88 % reduction in petroleum use,
• 19 – 25 % reduction in GHG emissions, and
• 42 – 44 % reduction in fossil energy use.
Energy Balance of Ethanol
Many questions have been raised as to the net energy efficiency of ethanol production from
corn. Over the last decade, mush progress has been made in terms of energy-efficient ethanol
production methods. Ethanol contains about 32,000 (high heating value) BTUs per litre. It
takes about one quarter of that amount to grow the corn and about one third of that amount to
process the corn in a modern ethanol production facility. Based on the ethanol “life-cycle”,
the net energy balance is positive.
Ethanol around the World
Today, many countries around the world are testing both oxygenated and neat (near 100 %)
alcohol fuels.
Brazil
Brazil is the world leader in the use of ethanol as an automobile fuel. More than 11 billion
liters of ethanol for fuel are produced each year. About 15 % of the vehicles with spark
ignition engines (the types normally fueled by gasoline) run on neat ethanol and the rest use a
blend of 20 % ethanol in gasoline. Ethanol was introduced to reduce Brazil’s dependence on
expensive foreign oil, and provides an additional market for domestic sugar producers.
Beneficial effects on air quality have been an added bonus (Kim et al; 2003).
United States
The U.S, ethanol blends make up about 12 % of the total gasoline market. In some part of
America, projects are underway to test the viability of replacing diesel fuel with ethanol; a
project by greater Peoria Transit is documenting ethanol’s usefulness in fighting urban air
pollution with its fleet of 14 ethanol-powered buses. Support for fuel ethanol is a key

29
component in the current U.S. “Clean Air act” because of its beneficial effect on air quality.
“Oxygenated fuels,” such as ethanol blends, are mandated in certain regions to reduce carbon
monoxide emissions and/or one. Today there are more than 55 domestics fuel ethanol
production facilities located in 22 states across the country with annual capacity of
approximately 1.8 billion gallons (Singh, 2008). Ethanol production facilities are largely
modular, should certain demand for ethanol arises, and expansions could be done quickly by
simply adding new equipment to existing production facilities. Expansion to existing
facilities could easily add 600 million gallons of production could be available in the near
term. Furthermore, the U.S. department of Agriculture has suggested that grain-based ethanol
production could grow to as high as 3.3 billion gallons a year by 2004.
In addition, the next generated of ethanol production facilities will include production
from cellulose and biomass feedstock. Earlier this year, there was a ground breaking for a
new ethanol production plan in Jennings, Lousiana which, when completed, will produce
ethanol from rice hulls and bagasse (Kohl, 2004). Three other plants are currently planned in
California that will produce ethanol from rice straw. Already, ethanol is being produced from
wood waste by Georgia pacific in Washington State and production from forest residues is
not far behind.
Canada
In Canada, the ethanol industry is developing momentum, now that ethanol’s environmental,
economic; energy rural development and renewable attributes are being more widely
recognized. Although the industry still in its infancy, with only a few small scale plants
producing ethanol consumer demand has prompted several gasoline retailing chains to feature
ethanol blends, with demand for ethanol exceeding our domestic production. Ethanol-blended
gasoline now available at over 700 gas bars across Canada from Quebec to the pacific,
including the Yukon Territory. In many regions, ethanol blends are available for bulk
delivery for farm and fleet use. The federal government and server provinces offer tax
incentives based on environmental, economic development and/or energy diversity benefits,
for the production and /or marketing of ethanol-blended gasoline to encourage development
of an alternative fuel industry. Also, Environment Canada has designated ethanol blended
gasoline, which meets their specifications, as an Environmental Choice trade; product on the
basis of reduced toxic emissions, reduced use of non-renewable resources, and reduced
carbon dioxide emissions. However, a firm and road-base (i.e., multiple
departments/ministries) commitment to procurement and incentives for ethanol in the near-

30
term is essential to ensure the successful establishment of this fledging renewable energy
industry.
Canada typically produces fewer than 50 million tones of grain (wheat, barley, corn
oat, and rye) annually, and exports about half of this. If all Canadian gasoline consumption
(presently about 33 – 35 billion liters annual) contained 10 % ethanol, the maximum grain
requirement would be 8 – 9 million tones. Canada would remain a major grain exporter.
Canada is a major importer of high- protein animal feed ingredients. The value of import is
typically about $200 million annual. The by-product resulting from ethanol production from
Canadian grain would serve to reduce this importation (Wang, 2008). How much fuel ethanol
is being produced? Canada’s current annual ethanol production, for all markets (1998) is
approximately 234 million liters a year. With additional proposed development of ethanol
production plants, Canadian potential production in the next few years is at 664 million liters
per year. How much fuel ethanol is being used? It is difficult to ascertain current levels of the
fuel ethanol use in Canada. In the U.S., it now represents about 90 % of total gasoline sales,
or the equivalent of the total Canadian gasoline consumption. Over two trillion kilometers
have been traveled using ethanol blends.
BENEFITS FROM ETHANOL TO THE ECONOMY
• There are many benefits to the economy when ethanol is involved. The following is a
list of some these benefits.
• Ethanol can substitute for aromatic hydrocarbons, which include the carcinogen
benzene. Ethanol can also replace MMT.
• Canada’s growing dependence on imported light crude oil needed for gasoline and
diesel fuel manufacture.
• The cost (financial and environmental) of mega-projects for enhancing Canadian
domestic supplies of light oil crude oil.
• The abundant, and renewable, supply of Canadian grain available foe fuel ethanol
production.
• The by-product ethanol production from grain, which is a high-protein livestock feed
ingredient.
• The effect of adding ethanol to gasoline on environmental quality.
• Many societal costs associated with petroleum energy, such as respiratory and other
health problems, crop yield losses and damage to vegetation, environmental disasters
(e.g tanker misshapes), etc.

31
1.9.5 Already Done Works on Economic Analysis
A descriptive engineering spreadsheet model (DM model) was developed to model the dry
mill ethanol production process. This model was created to better understand the economics
of the ethanol dry mill production process and hoe the profitability of dry mill plants is
affected under different conditions. It was also developed to determine the economic and
environmental costs and benefits of utilizing new and different technologies in the dry mill
process. Specifically, this model was constructed to conduct an economic analysis for novel
process of obtaining greater alcohol yields in the dry mill process (Rhys et al; 2006)
The Dm model is more technically precise, and more transparent, and then other
models of the dry mill process that have been constructed for similar purposes. The Tiffany
and Eidman model (TE model) uses broad generalities of the dry mill process, based on the
current state production, to approximate the sensitivities of the process to changes in
variables. The TE model parameters were well researched, but the model suffers from several
drawbacks. The main limitations of this model are that the results are very sensitive to the
input values chosen by the user. Unlike the DM model, complex manipulations, such as
determining the effect of new technologies would require accurate parameter estimates using
the TE model.
The McAloon model uses highly technical engineering software (ASPEN) that acts
essentially as a “black box” in the dry mill production process. This very exact model does
not aloe for a more general examination of the dry mill process. Changes in the production
process would necessitate precise engineering plans.
Similar to the TE and McAloon models, the DM model is a spreadsheet model, but unlike
the McAloon model it is completely self-contained. The DM model is a feed backward model
input requirements (corn, enzymes, chemicals, utilities etc) are calculated based on the user
entered values for annual production and process parameters.
However, according to Krishan et al; 2011 the ethanol production from dry mill corn
starch using the fluidizing – bed bioreactor (FBR) in a separate hydrolysis fermentation
(SHF) savings are very sensitive to the residence time in the bioreactor or, in other words, to
size of the bioreactor. The other sensitive parameters are ethanol concentration and ethanol
yield. This analysis also shows that lowering the residence time in the FBR to 20 mins (by
improvements in biocatalyst activity) would allow a higher cost savings of 3 – 12 cents/gal.
32
Comparison with other studies
Quite a number of assessments of corn based ethanol have been performed during the past
decade (Shapouri et al; 2003), Patzek (2004) and pimentel (2003) use “energy balances” as
basis for comparison and the present study has included this indicator to make comparison of
energy results possible. “Displacement method”, “Replacement value method” and “System
expansion method” refers to the same principle when handling of co-products is considered,
and all studies except (Patzek, 2004) apply the same principle that environmental impacts
from the products that co-products of corn ethanol displace are subtracted. (Patzek, 2004)
sees co-products from ethanol factory as waste and gives zero credit to the co-products. With
respect to conclusions, the present study is in agreement with (Wang, 2008) at points where
the results are comparable, namely use of fossil fuels and apparently also global warming.
Other indicators cannot be compared directly because (Wang, 2008) provide results as
emission of selected substances and the present study apply recalculation of a broader
spectrum of emissions into environmental impact potentials. Fossil energy input determined
in the present study is about the same level as thermal energy content of ethanol, and the
results of the present study in terms of energy balance study ends Emissions considered by
(Wang, 2008) all contribute to the environmental impact categories considered in this study.
As recommended in the ISO standards for LCA up between (Shapouri et al; 2004) who find a
positive energy balance and those who find a negative energy balance (Patzek, 2004) and
(Pimentel, 2003). Essential inputs and outputs in corn ethanol’s product chain in terms of
energy have been addressed in a review by Shapouri, 2003) for a number of studies from the
past decade.
Corn ethanol conversion rate has increased gradually over the past decade and it is not
surprising that the conversion rate applied in the present study is among the highest because
the most recent and efficient technology intentionally has been applied. It is more surprising
that energy input per produced unit of ethanol recorded in the present study is quite high
compared to most other studies. Explanations can be different calculation principles, different
background data and many other things and cannot be revealed without digging deep into
each study.
The total energy use calculated for corn ethanol production in the present study is at the same
level as in most other studies. Significant variation exists between different studies when it
comes to co-product energy credits. This can be explained by application of different
assessment principles in different studies, ranging from various allocation principles to
differences in system expansion basis. In the present study, application of DDGS as

33
replacement for corn in swine diet has been used as basis for system expansion and energy
credit comes out in the lower end of the interval reported in the literature. Sensitivity analyses
where DDGS displaces soy meal in cattle’s diet indicate, however, that energy credit can vary
significantly depending on the specie considered and the suggested energy credit can in fact
be overestimated significantly.
ESTIMATED PRODUCTION COST OF ETHANOL FROM DIFFERENT RAW
MATERIALS.
The cost of ethanol production and its value depends on plant location, feedstock, production
scale, and end use. It also depends on the availability of feedstock, plant location, feedstock
transportation cost, method of pretreatment, hydrolysis, fermentation techniques and ethanol
market price. Most of the ethanol produced from North America is from cereal grains such as
corn and wheat. In a corn-based ethanol industry, the cost of feedstock would be about 50-60
% of the total production cost (Kaylen et al; 2001). The price of corn was estimated to
increase by US $ 1.20 – 2.00/ton for every 2.5 million tones of corn used to make ethanol
(Elander and putsche 2006). The cost of biomass feedstock will be in the range of US $
25/ton to US $ 40/dry ton. (Sokhansanj et al; 2002) estimated that the cost of corn Stover
feedstock delivered to an intermediate storage facility could range from a low of US $ 23/dry
t (US $ 21/dry ton) to a high of US $ 45/dry t (US $ 41/dry ton). Therefore, the utilization of
cellulosic biomass as feedstock for ethanol production reduces the operating cost of ethanol
plants. The biomass feedstock cost will be about 21 % of the total production cost compare to
corn which costs 50 – 60 % of total ethanol production cost (Kaylen et al; 2001).
McAloon and co-workers (2000) reported the comparative cost of corn and cellulosic
biomass on ethanol production. The cost is much a larger part of the production cost that
Stover. A reduction in cost of ethanol can be also achieved by reducing the cost of cellulose
enzyme. It is predicted that the use of genetically engineered raw materials with higher
carbohydrate content combined with efficient conversion technology can reduce the cost of
ethanol production by US $ 0.11 per liter over the next 10 years (Wooley et al; 2006). The
cost of ethanol production from shelled corn is about US $ 0.88 per gallon. Whereas the cost
of ethanol production from cellulosic biomass was about US $ 1.50 per gallon (McAloon et
al; 2000). Although biomass conversion to ethanol involves several processes, selecting
appropriate pretreatment method, efficient hydrolysis process and fermentation technique can
reduce the ethanol price competitive to gasoline price. Integration of process operations, such
as utilization of lignin for steam production in boilers and the production of furfural from

34
hemicelluloses, could reduce the cost of ethanol production from biomass. Furfural is the
valuable chemical solvent often used in the production of furfural alcohol, refining
lubricating oils, butadiene extraction and furfural-based production of tetra-hydrofuran.
Furfural alcohol is the major feedstock for the production of furan resins, which in turn are
used to produce foundry sand binders. Kaylen and co-workers (2000) reported that co-
production of ethanol and furfural would make ethanol production profitable. This represents
a step toward the development of a biomass refinery, which could be used to produce various
product combinations, depending on market demand, price and other factors. They also
indicated that crop residues were the choice feedstock for ethanol production because of their
low cost and relatively high percentage of hemicelluloses, a source of furfural production.
Improvements in pretreatment processes and breakthrough in enzyme technology will have
an impact on the competitive industrial production of fuel ethanol in processes such as
continuous process without or with cell recycling. Simultaneous saccharification and co-
fermentation, utilization of immobilized cells, etc. enable higher yield of ethanol and reactor
productivity (Kosaric et al; 2005). Economic conversion of cellulosic biomass to ethanol will
also reduce the production cost that can be achieved by making ethanol fermentation process
faster, particularly xylose fermentation, reducing the formation of by-products and
developing genetically engineering yeasts to produce various high-value by-products (Ho et
al; 2009).
However, ethanol costs could be reduced dramatically if efforts to produce ethanol
from biomass are successful. Biomass feedstock, including forest residue, agricultural
residue, and energy crops, are abundant and relatively inexpensive, and they are expected to
lower the cost of producing ethanol and provide stability to supply and price. Biomass has to
be fractionated into cellulose, hemicelluloses and lignin and the integration of the process
byproducts will lead to economically feasible production of ethanol. Enzymatic hydrolysis of
cellulose appear to have the most potential for achieving the goals, but substantial reductions
in the cost of producing cellulose enzymes and improvements in the fermentation of non-
glucose sugars to ethanol still are needed. Significant barriers to the success of cellulose-
derived ethanol remain. For example, it may be difficult to create strains of genetically
engineered yeast that are hard enough to be used for ethanol production on a commercial
scale. In addition, genetically modified organisms may have to be strictly contained. Recent
work by (Ho et al; 2009) on successful development of genetically reengineered
Saccharomyces yeast for effective co-fermentation of glucose and xylose to fuel ethanol, and

35
(Nigam, 2001) work on hydrolysis of wheat straw hemicelluloses strengthen the economic
feasibility ethanol production.
Table 1: Comparison of estimated ethanol production costs for various feed stock
(s/gal.)
Cost item U.S corn wet milling
U.S corn dry milling
U.S sugar cane
U.S sugar beets
U.S molasses
U.S raw sugar
U.S refined sugar
Brazil sugar cane
E.U sugar beets.
Feed stock
cost
0.04 0.53 1.48 1.58 0.91 3.12 3.61 0.30 0.97
Processing
costs
0.63 0.52 0.92 0.77 0.36 0.36 0.36 0.51 1.92
Total cost 1.03 1.05 2.40 2.35 1.27 3.48 3.97 0.81 2.89

36
CHAPTER TWO
Materials and Methods
2.0 Microorganisms
Aspergillus niger was used for the production of amylase enzyme. It was obtained from pure
stock culture of Prof. J. C Ogbonna, Department of Microbiology, University of Nigeria,
Nsukka. The Aspergillus niger was used for starch hydrolysis while the yeast Saccharomyces
cerevisae was used for ethanol production. The S.cerevisae was isolated from palm wine. It
was isolated by inoculation of palm wine into Yeast Peptone Glucose (YPG) agar plates in
Petri dish and incubated at 37 0C for 24 hr. It was when stained with lacto phenol cotton blue
stain and viewed under (X 40) microscope for proper identification.
2.1 PREPARATION OF REAGENTS.
Acid Dichromatic solution (0.01 mol/1 in 5.0 mo/1 sulphuric acid):
A 125 ml of water was added to a 500 ml conical flask and then 70 ml of concentrated
sulphuric acid was added to a 500 ml conical flask carefully with constant swirling. The flask
was allowed to cool in water and 0.75 g of potassium dichromate was added and made up to
250 ml with distilled water.
Starch indicator solution (1.0 % solution):
A 1 g of starch was dissolved in 100 ml of boiled water.
Sodium thiosulphate solution (0.03 mol/1)
A 7.44 g of sodium thiosulphate was added to a 1L volumetric flask, dissolved in
distilled water and diluted up to the mark.
Potassium Iodide Solution (91.2mol/L)
A 5 g of KI was dissolved in 25 ml of distilled water.
2.2 MEDIA PREPARATION AND INOCULATION OF MICROBES.
Potato Dextrose Agar (PDA)
The fungi Aspergillus niger was grown in potato Dextrose Agar (PDA) medium. PDA
powder (3.9 g) was mixed with 100 ml of water and then autoclaved. The medium was
aseptically poured into several test tubes (15 ml each) which were then slanted and allowed to
cool and solidify. Aspergillus niger was then inoculated from the stock culture into the
prepared PDA media using a wire loop under aseptic condition. After this, it was incubated
for 48 hr at 37 0C.
37
Preparation of YPG medium and inoculation of yeast
The yeast extract peptone glucose agar medium was prepared measuring 1 g of
glucose, 3 g of yeast extract, 5 g of peptone and 1.5 g of agar agar and dissolving them in 100
ml of distilled water. It was then autoclaved for 1.5 minutes. The medium was aseptically
poured into test tubes (15 ml each) which were then slanted and corked with cotton wool or
foam and allowed to cool and solidify.
Saccharomyces cerevisiae were then inoculated from the stock culture into the
prepared YPG medium using a wire loop and this was done with great caution in front of the
Bunsen burner flame to prevent contamination. After inoculation, it was then incubated for
48 hours at 37 0C.
Yeast Peptone Glucose Broth (for yeast cells).
A broth of the YPG medium (1 g of glucose, 0.3 g of yeast extract, 0.5 g of peptone without
the agar agar in 100 ml of distilled water) containing 250 mg of chloramphenicol was
prepared in 250 ml conical flask and autoclaved at 121 0C for 15 mins. It was allowed to cool.
Three loops of the yeast were inoculated and incubated for 72. hrs. The medium was
decanted and the cells left in the flask.
Nutrient Broth (for yeast cells)
A broth of the nutrient medium (2.5 g of nutrient broth in 100 ml of distilled water)
containing 250 mg of chloramphenicol was prepared in a 250 ml conical flask and autoclaved
at 1210C for 15 mins. It was allowed to cool. Three loops of the yeast were inoculated and
incubated for 72 hrs. The medium was decanted and the cells left in the flask.
Sample Collection
Different corn varieties were soured from the department of crop science, University of
Nigeria Nsukka They includes:
Yellow corn-flint maize – Zea mays var. Indurata
Igbo corn – Dent maize – Zea mays var. Indentata
Popcorn – Zea mays var. Praecox
White corn –waxy maize – Zea mays var. Ceratina
The rice was purchased from Ogige Market, Nsukka.

38
2.3 METHODOLOGY
PREPARATION OF CORN FLOUR
A 1 kg of flint maize – Zea mays var. Indurata, waxy maize – Zea mays var. Ceratina,
Popcorn – Zea mays var. Praecox and dent maize – Zea mays var. Indentata were measured
and grinded and the chaff was sieved off.
PREPARATION OF ENZYME FOR HYDROLYSIS
A cup of rice was steam to cook and allowed to cool. After cooling, 2000 g was weighed out
of the cooked rice and poured into the slant of Aspergillus sp and wire loop was used to
harvest (suspend or scup) the spores. The spore suspension was poured into 200 g of the
cooked rice and mixed very well to ensure that the spores were evenly distributed in the rice.
The rice was wrapped with the spores in a clean and sterilized cloth and then incubated for 24
hrs after which it was mixed again with a spoon to ensure that the spores were well
distributed. It was wrapped again and left for another 24 hrs.
Heavy productions of black spores were observed at the end of 3 days. The wrapped clean
clothes containing the produced enzyme was then stored in the refrigerator. The resulting
solid state culture (koji) was used as a source of enzyme for starch hydrolysis.
DETERMINATION OF STARCH CONTENT USING KI-I METHOD by (Bailey &
Olis, 1986)
A 1 g of starch sample was weighed and homogenized in 100 ml distilled water. It was boiled
for 30 mins, allowed to cool, made up to 100 ml distilled water and filtered. The filtrate (0.1
ml) was added in a test tube mixed with 0.5 ml of potassium iodide and iodine, was up to 10
ml with water. The absorbance was taken at 680 nm. The starch concentration was calculated
from the absorbance, using a calibration curve.
Determination of Amylose : Amylopetin Ratio using solubilization method by (Evan
Heisman, 1999)
A 10 g of corn was weighed and homogenized in 100 ml of distilled water and gelatinized for
30 min at 70 0C – 3 ml of Cacl2 was added and allowed to stand for 10 min after which 5
Iodine was added and diluted- the blue color was read at 620 nm. The amylopectin was
obtained by subtracting the amylase content from the starch content for each of the corn
variety. They amylase was calculated from the absorbance reading as follows.
Mean x df
Slope = mg/ml

39
Then to convert to percent from mg/ml
100 = %
Where df = dilution factor.
Gelatinization of corn varieties
A 10 g of the various corn varieties was weighed and homogenized in 100 ml of distilled
water. It was mixed while heating under low flames. After gelatinization; it was allowed to
cool before adding the yeast inoculums and the koji enzyme.
Hydrolysis
The gelatinized starch (corn flour) was poured into a conical flask, then the enzyme was
added to the gelatinized starch and this was done to hydrolyze the gelatinized starch.
Fermentation
The hydrolysates of the corn varieties were in conical flasks and then inoculated with
S.cerevisiae cells from the decantation of YPG broth prepared earlier. Samples were taken
every 24 hrs for 6days and the starch, glucose and ethanol concentrations were determined.
Determination of starch concentrations by k1 – method
A 0.5 ml of the sample was taken into test tube and then made up to 5 ml with water. 0.5 ml
of iodine was added and finally made up to 10 ml with. The absorbance was read at 680 nm.
The starch concentration was calculated as follows:
Using y
a = g/1
Where y = mean of the absorbance reading
A = slope of the standard
g/l = unit
Determination of glucose concentration using DNSA method by (mollies, 1959)
A 0.3 g of sample was added to 0.3 ml of DNSA in a test tube. It was allowed to stand with
the test tube in boiling water for 10 mins. 3 mls of water was added and the absorbance read
at 540 nm. The glucose concentration was calculated as follows:
using y/a = g/l
where y = mean of absorbance reading

40
a = slope of the standard
g/l = unit.
Determination of ethanol concentration using AO – AC Titration method
A 10 ml of acid dichromate was transferred to a 250 ml conical flask with matching rubber
stopper and 1 ml of sample was pipette into the sample holder which was suspended over the
dichromate solution and held with rubber stopper at 25oC-30oC. The stopper was loosed,
removed after the incubation and the walls of the flask were rinsed with 100 ml distilled
water. KI solution (1 ml) was added and mixed. Titration with sodium thiosulphate was done,
1ml starch was added and titration continued till the blue colour disappeared. The ethanol
concentration was calculated as follows:
Using y/a x 10/1 = g/l
Where y = mean of titre value
a = slope of standard
g/l = unit
DETERMINATION OF ENZYME ACTIVITIES
Gluco-Amylase Enzyme Activity: The amylase assay was carried out by incubating a
reaction mixture containing 0.5 ml of 1 % soluble starch, 0.2 ml of 0.1 mg sodium acetate
buffer (ph 5.6) and 0.3 ml crude enzyme soluble from koji at room temperature for 30
minutes. After this, 1 mg of DNSA was added to terminate the reaction, and the tubes were
boiled in boiling water for 10 minutes. After cooling, 4 ml of distilled water was added and
readings were taking at 540 nm. The amount of reducing sugar was calculated as follows:
Mean x 100
Slope 1 = mol/dl (it’s divided by 100 because it’s in mg/ml)
S.I units = 0.0555
= mg/dl x 0.055 = mol/L
Gluco- amylase activity was defined as the amount of enzyme that releases one micromole
sugar in 1 min under the assay condition.
Alpha – Amylase Enzyme Activity: The assay was carried out by incubating a reaction
mixture containing 0.5 ml of 1 % soluble starch, 0.2 ml of 0.1 mg sodium acetate buffer (ph

41
5.6) and 0.3 ml crude enzyme from koji at room temperature for 30 mins. After this, 1M
acetic acid was added to stop the reaction, followed by the addition of 8 ml distilled water
and 1 ml iodine solution. The absorbance readings were taken at 680 nm. The amount of
starch was calculated as follows:
Mean x df
Crude-enzyme x time = mg/ml/min
:. Mg/ml/min x 1000
162 = micromole
Where df = dilution factor.
162 = molecular weight of starch.
Alpha amylase activity was defined as the amount of enzyme that releases 1micromole of
sugar in 1 minute under the condition of assay
STATISTICAL ANALYSIS
The experimental were done in triplicates. The results were subjected to Analysis of Variance
(ANOVA). The means where there were significance differences, the means were separated
using Least Significance Difference (LSD).

42
CHAPTER THREE
3.0 RESULTS
3.1 Starch, amylose and amylopectin contents of the corn varieties. In figures 2, 3, and 4; the starch, amylose and amylopectin contents of the corn varieties were
shown. The Zea mays var. Indurata gave the highest (P<0.05) starch content of 64 %
followed by Zea mays var. Praecox with 62 %, Zea mays var. Indentata with 60 % and Zea
mays var. Ceratina with 57 %. However, the Zea mays var. Indurata also gave the highest
amylose and amylopectin while Zea mays var. Ceratina has the lowest content. Table 2,
shows the amylose : amylopectin ratios of each of the corn varieties; Zea mays var. Indurata
gave the highest ratio while Zea mays var. Ceratina gave the lowest ratio. In fig 9 and 10, the
amount of starch liberated and the glucose utilized were analyzed during the solid – state
fermentation of the koji enzym
Fig. 2: Starch contents of Raw Zea mays var. Indurata, Praecox, Indentata and Ceratina
varieties.
52
54
56
58
60
62
64
66
Zea mays var.Indurata
Zea mays var.Praecox
Zea mays var.Indentata
Zea mays var.Ceratina
sta
rch
co
nte
nts
(%
)
Corn varieties
Starch contents(%)
Starch contents(%)

43
Fig. 3: Amylose contents of Raw Zea mays var. Indurata, Praecox, Indentata and
Ceratina varieties.
Amylose content(%)
19
20
21
22
23
24
25
26
Zea mays
var.Indurata
Zea mays
var.Praecox
Zea mays
var.Indentata
Zea mays
var.Ceratina
CORN VARIETIES
AM
YL
OS
E C
ON
TE
NT
S(%
)
Amylose content(%)

44
Fig.4: Amylopectin contents in Zea mays var. Indurata, Praecox, Indentata and Ceratina
varieties.
Amylopectin contents(%)
33
34
35
36
37
38
39
40
Zea mays
var.Indurata
Zea mays
var.Praecox
Zea mays
var.Indentat
Zea mays
var.Ceratina
CORNVARIETIES
AM
YL
OP
EC
TIN
CO
NT
EN
TS
(%
)
Amylopectin contents(%)

45
Table 2: Summary of Amylose : Amylopectin Ratios of the corn varieties.
3.2 Ethanol Production from the corn varieties.
The results of production of ethanol from the different corn varieties under submerged
culture condition are shown in figures 5, 6, 7, and 8. The ethanol concentrations increased
with the fermentation time up to 72 hours and started to decline. Zea mays var. Indurata was
the best substrate for ethanol production, giving a concentration of 24.70 g/l in 72 hours. This
compares with 23.11 g/l, 21.30 g/l and 22.38 g/l obtained from the other corn varieties within
the same cultivation period. Production of ethanol can be ranked statistically as follows. Zea
mays var. Indurata > (Zea mays var. Praecox = Zea mays var. Indentata) > Zea mays var.
Ceratina.
Corn varieties Amylose Amylopectin Amylose: Amylopec
(%) (%) tin ratios
Zea mays va. Indurata 25.0 39 1.1.56
Zea mays var. Praecox 24.3 37.7 1.1.55
Zea mays var. Indentata 23.8 36.2 1.1.52
Zea mays var. Ceratina 21.6 35.4 1.1.53
46
3.2 Ethanol production from the corn varieties.
The results of production of ethanol from the different corn varieties under submerged
culture condition are shown in figures 5, 6, 7 and 8. The ethanol concentrations increased
with the fermentation time up to 72 hours and started to decline. Zea mays var. Indurata was
the best substrate for ethanol production, giving a concentration of 24.70 g/l in 72 hours. This
compares with 23.11 g/l, 21.30 g/l and 22.38 g/l obtained from the other corn varieties within
the same cultivation period. Production of ethanol can be ranked statistically as follows, Zea
mays var. Indurata > (Zea mays var. Praecox = Zea mays var. Indentata) > Zea mays var.
Ceratina.
3.3 Alpha and gluco- amylase activities during ethanol production.
The results of enzyme activities from koji are shown in figures 9 and 10. The results show
that as the days of the fermentation progressed, the starch was broken down to glucose and
the glucose was utilized immediately while ethanol production increased and later started to
decline when the starch finished. This shows also the amount of enzyme that degrades one
micromole of starch in one minute and the amount of enzyme that releases one micromole
sugar in one minute under condition of assay.
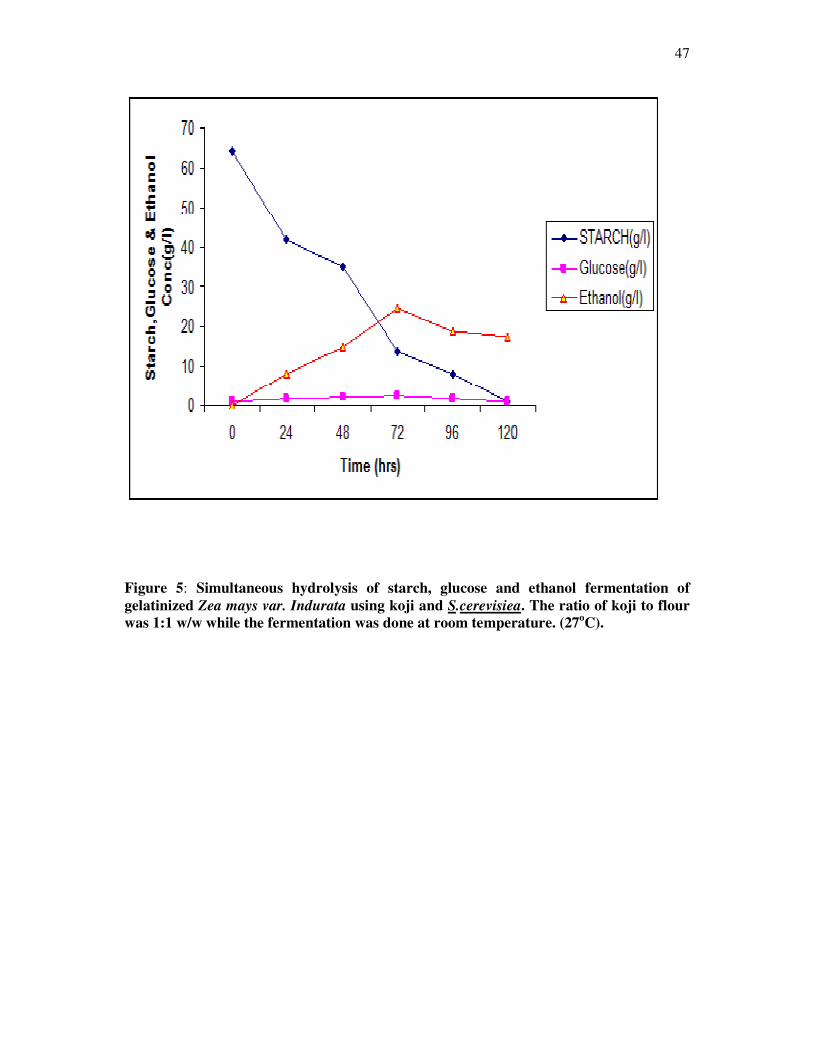
47
Figure 5: Simultaneous hydrolysis of starch, glucose and ethanol fermentation of
gelatinized Zea mays var. Indurata using koji and S.cerevisiea. The ratio of koji to flour
was 1:1 w/w while the fermentation was done at room temperature. (27oC).

48
0
10
20
30
40
50
60
70
0 24 48 72 96 120
Time (hrs)
Sta
rch
,Glu
co
se
& E
tha
no
l(g
/l)
STARCH(g/l)
Glucose(g/l)
Ethanol(g/l)
Figure 6: Simultaneous hydrolysis of starch, glucose and ethanol fermentation of
gelatinized Zea mays var. Praecox using koji and S.cerevisiea . The ratio of koji to flour
was 1:1 w/w while the fermentation was done at room temperature. (27oC).

49
0
10
20
30
40
50
60
0 24 48 72 96 120
Time (hrs)
Sta
rch
, G
uc
os
e &
Eth
an
ol
Co
nc
(g/l
)
STARCH(g/l)
Glucose(g/l)
Ethanol(g/l)
Figure 7: Simultaneous hydrolysis of starch, glucose and ethanol fermentation of
gelatinized Zea mays var. Indentata using koji and S.cerevisiea . The ratio of koji to flour was 1:1 w/w while the fermentation was done at room temperature ( 27
oC).
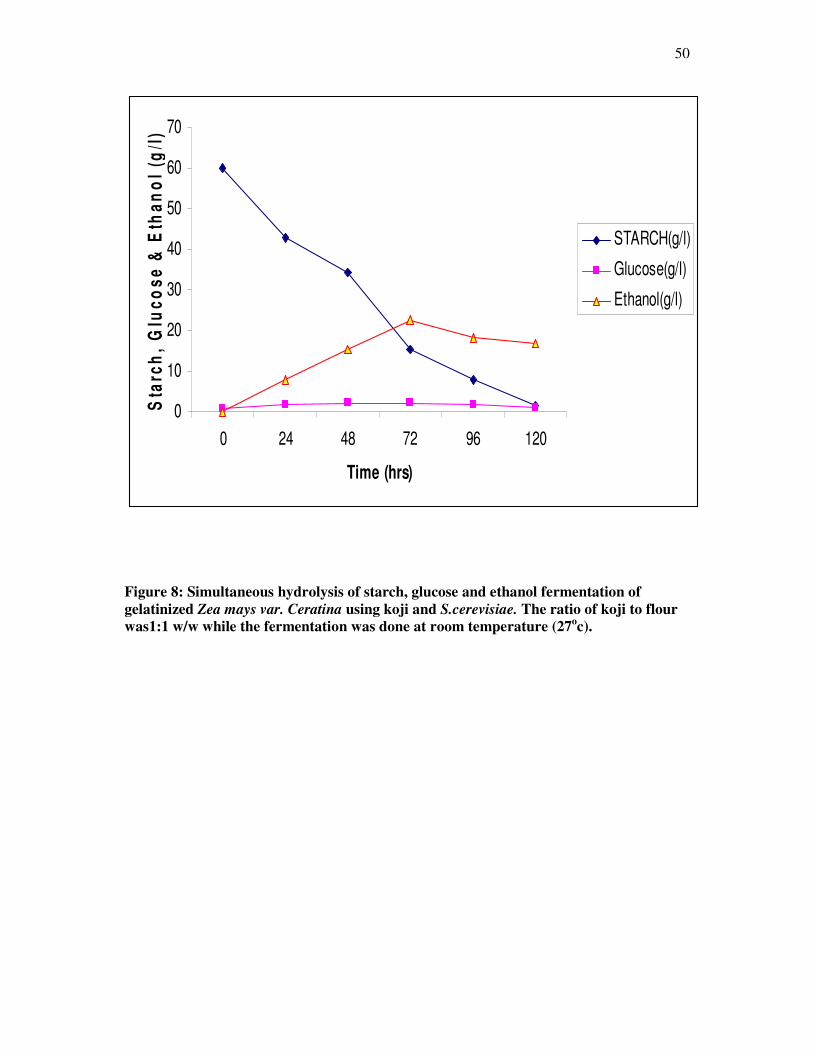
50
0
10
20
30
40
50
60
70
0 24 48 72 96 120
Time (hrs)
Sta
rch
, G
luc
os
e &
Eth
an
ol
(g/l
)
STARCH(g/l)
Glucose(g/l)
Ethanol(g/l)
Figure 8: Simultaneous hydrolysis of starch, glucose and ethanol fermentation of
gelatinized Zea mays var. Ceratina using koji and S.cerevisiae. The ratio of koji to flour
was1:1 w/w while the fermentation was done at room temperature (27oc).
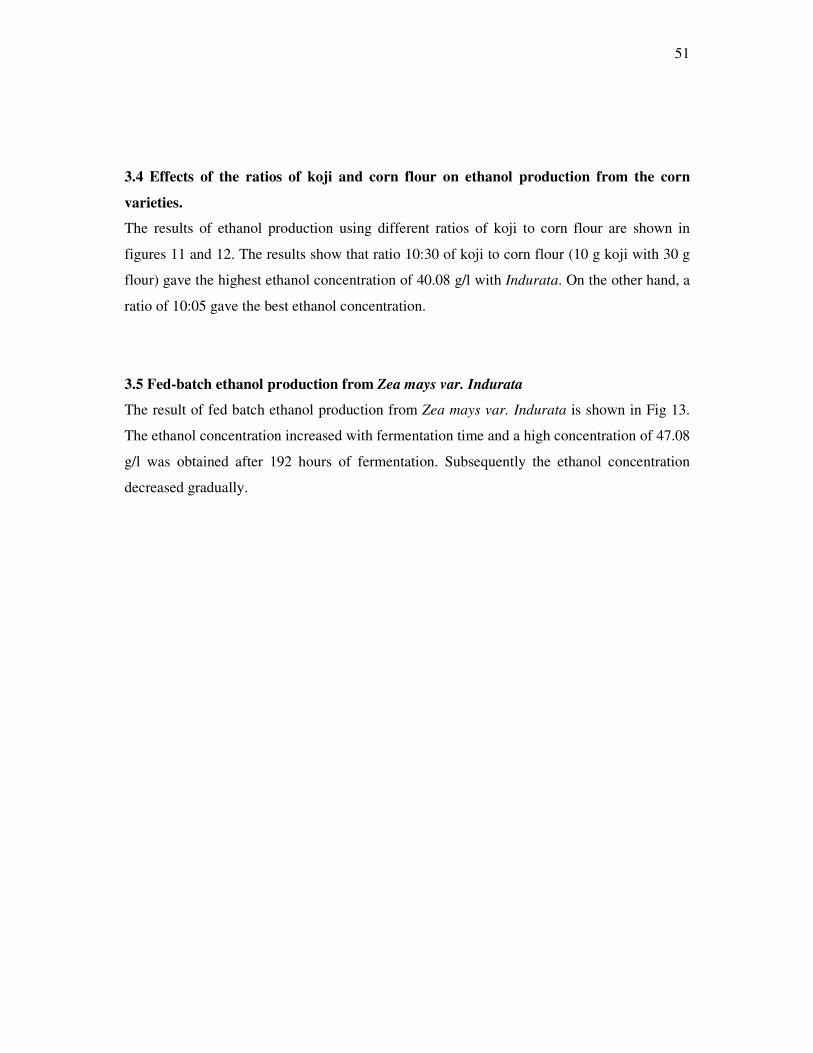
51
3.4 Effects of the ratios of koji and corn flour on ethanol production from the corn
varieties.
The results of ethanol production using different ratios of koji to corn flour are shown in
figures 11 and 12. The results show that ratio 10:30 of koji to corn flour (10 g koji with 30 g
flour) gave the highest ethanol concentration of 40.08 g/l with Indurata. On the other hand, a
ratio of 10:05 gave the best ethanol concentration.
3.5 Fed-batch ethanol production from Zea mays var. Indurata
The result of fed batch ethanol production from Zea mays var. Indurata is shown in Fig 13.
The ethanol concentration increased with fermentation time and a high concentration of 47.08
g/l was obtained after 192 hours of fermentation. Subsequently the ethanol concentration
decreased gradually.

52
Table 3: Ethanol Yield of the Corn Varieties
s
3.6 Economic analysis of corn ethanol production
Tables 4 to 9 show economic analysis of the corn ethanol production. Table 4 shows the
yields of corn flour from the corn varieties while table 5 shows the cost of the various corn
varieties in different markets within Nigeria.
Corn Varieties Ethanol Flour Ethanol Yield(g
Concentrations(g/l) Concentrations(g/l) Ethanol/g flour)
Zea mays var. 4.70 100 0.247
Praecox
Zea mays var. 23.11 100 0.231
Indentata
Zea mays var. 22.38 100 0.223
Indentata
Zea mays var. 21.30 100 0.213
Ceratina
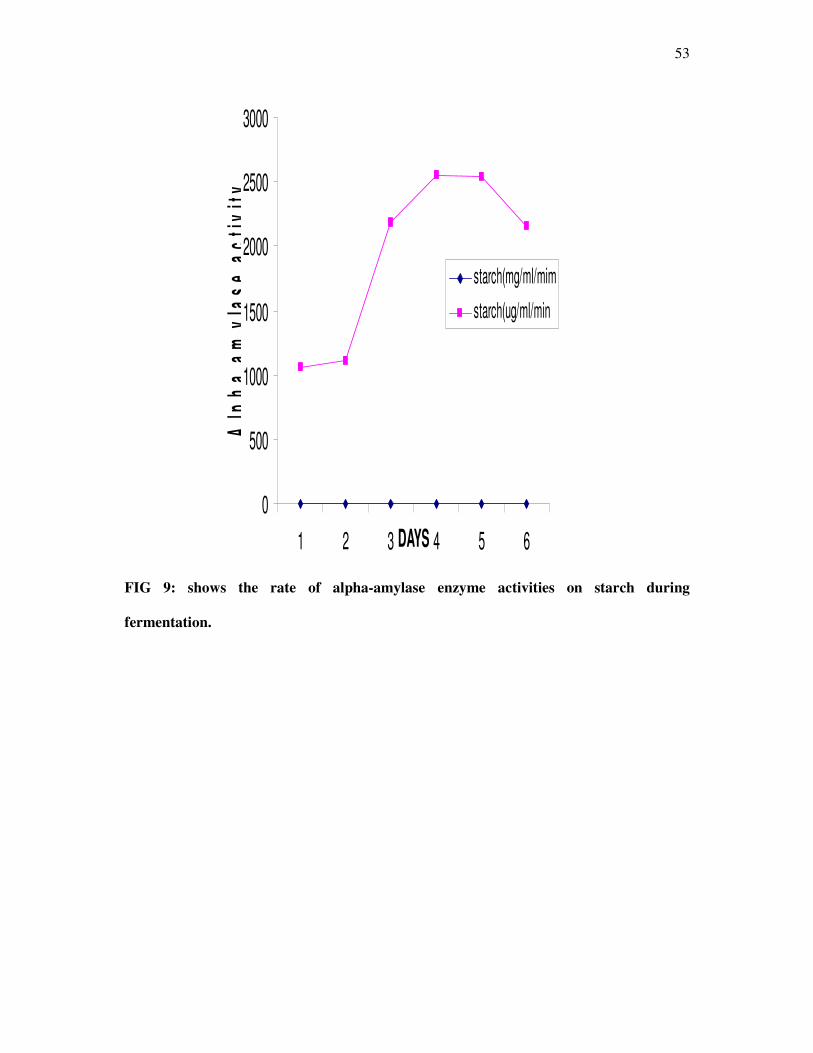
53
0
500
1000
1500
2000
2500
3000
1 2 3 4 5 6DAYS
Alp
ha
am
yla
se
ac
tiv
ity
starch(mg/ml/mim
starch(ug/ml/min
FIG 9: shows the rate of alpha-amylase enzyme activities on starch during
fermentation.

54
0
100
200
300
400
500
600
700
800
1 2 3 4 5 6
DAYS
Glu
co
-am
yla
se
ac
tiv
ity
Glucose(mg/ml/min
Glucose(ug/ml/min)
FIG 10: shows the rate of gluco-amylase enzyme activities on glucose during
fermentation.
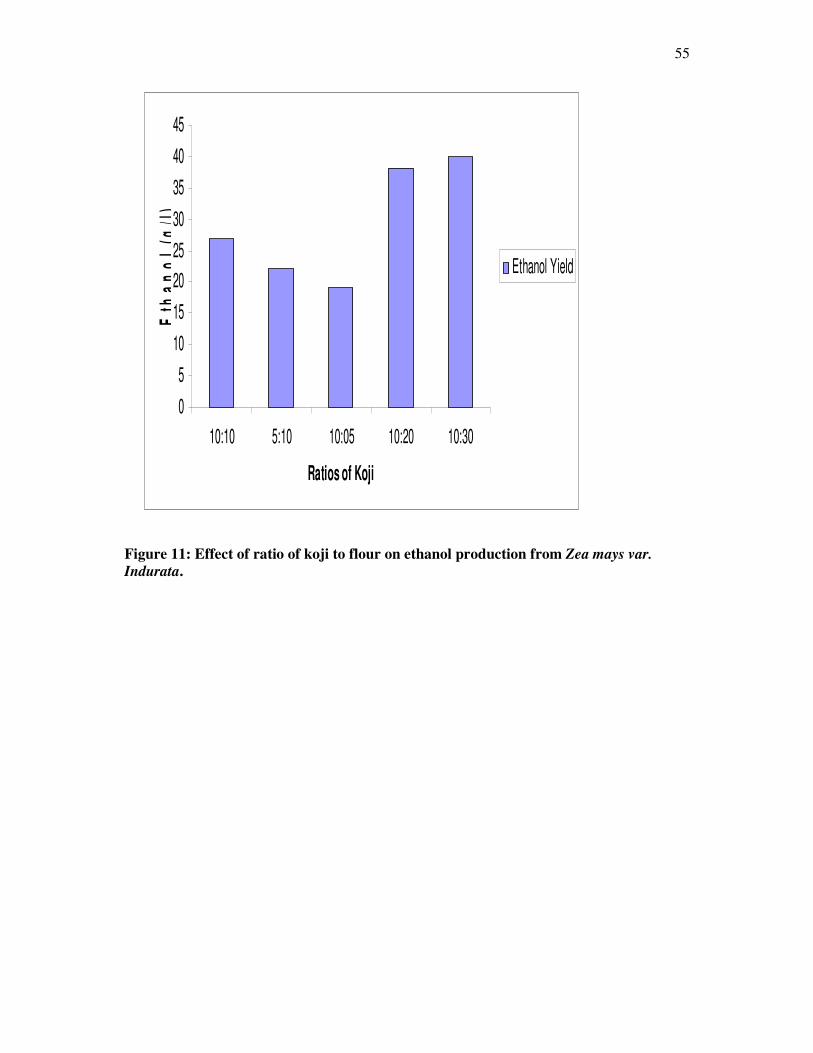
55
Figure 11: Effect of ratio of koji to flour on ethanol production from Zea mays var.
Indurata.
0
5
10
15
20
25
30
35
40
45
10:10 5:10 10:05 10:20 10:30
Ratios of Koji
Eth
an
ol
(g/l
)
Ethanol Yield
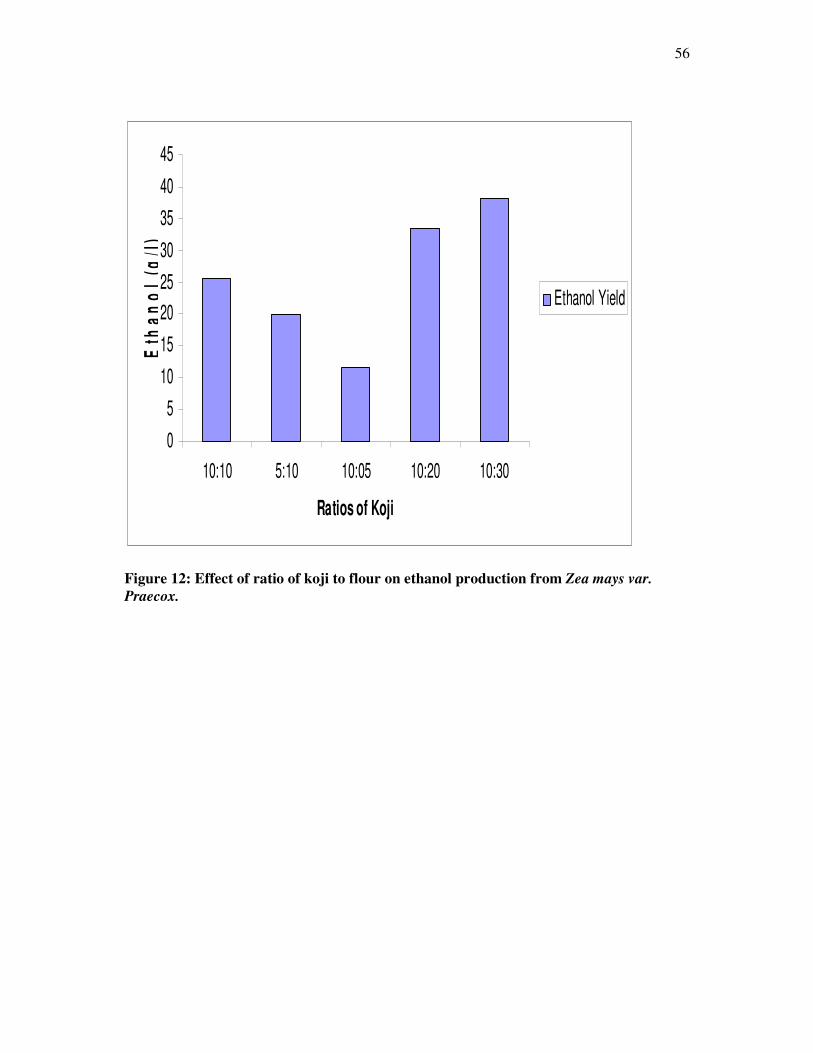
56
Figure 12: Effect of ratio of koji to flour on ethanol production from Zea mays var.
Praecox.
0
5
10
15
20
25
30
35
40
45
10:10 5:10 10:05 10:20 10:30
Ratios of Koji
Eth
an
ol
(g/l
)
Ethanol Yield

57
0
10
20
30
40
50
60
70
80
0 24 48 72 96 120 144 168 192 216 240
Time (hrs)
Sta
rch
, G
luc
os
e &
Eth
an
ol
Co
nc
.(g
/l)
STARCH(g/l)
Glucose(g/l)
Ethanol(g/l)
FIG 13: Fed - Batch production of ethanol from Zea mays var. Indurata

58
3.6 Economic analysis of corn ethanol production
Tables 4 to 9 show economic analysis of the corn ethanol production. Table 4 shows the
yields of corn flour from the corn varieties while table 5 shows the cost of the various corn
varieties in different markets within Nigeria.
As shown in Figure 5, 24. 70 g/l of ethanol was obtained from 100 g/l of Zea mays var.
Indurata flour. This means that 24.70 g of ethanol was obtained from 100 g of flour. Since
the total amount of flour obtained from 1.0 kg of Zea mays var. Indurata was 993.57 g, the
total amount of ethanol from 1.0 kg of Zea mays var. Indurata is 245.41 g. Using a density of
99.5 % ethanol which is 0.789, the volume of ethanol produced from 1.0 kg of Zea mays var.
Indurata is 311.0 ml (0.31 L).
Based on the cost of Zea mays var. Indurata at Nsukka (N6, 000/100 kg), it can be estimated
that the cost of Zea mays var. Indurata used to produced 1 L of ethanol is N193.5. The cost
raw materials usually represent about 70 % of the total production cost. Thus the cost of bio-
ethanol from Zea mays var. Indurata can be estimate to N276.42.00 / L.
As shown in Figure 6, 23.11 g/l of ethanol was obtained from 100 g/l of Zea mays var.
Praecox flour. This means that 23.11 g of ethanol was obtained from 100 g of flour. Since the
total amount of flour obtained from 1.0 kg of Zea mays var. Praecox was 992.78 g, the total
amount of ethanol from 1.0 kg of Zea mays var. Praecox is 229.43 g using a density of 99.5
% ethanol which is 0.789, the volume of ethanol produced from 1.0 kg of Zea mays var.
Praecox is 290.78 ml (0.29 L).
Based on the cost of Zea mays var. Praecox in Nsukka (N9, 000/100 kg), it can be
estimated that the cost of Zea mays var. Praecox used to produced 1 L of ethanol is N309.6.
the cost of raw materials usually represents about 70 % of the total production cost. Thus the
cost of bio-ethanol from Zea mays var. Praecox can be estimated to be N442.28 / L.
As shown in Figure 7, 22.38 g/l of ethanol was obtained from 100 g/l of Zea mays var.
Indentata flour. This means that 22.38 g/l of ethanol was obtained from 100 g of flour. Since
the total amount of flour ethanol from 1.0 kg of Zea mays var. Indentata was 993.48 g, the
total amount of ethanol from 1.0 kg of Zea mays var. Indentata is 222.38 g using a density of

59
99.5 % ethanol which is 0.789, the volume of ethanol produced from 1.0 kg of Zea mays var.
Indentata is 281.7 ml (0.28 L).
Based on the cost of Zea mays var. Indentata in Nsukka (N7, 000/100 kg), it can be
estimated that the cost of Zea mays var. Indentata used to produce 1 L of ethanol is N249.9.
The cost of raw materials usually represents about 70 % of the total production cost. Thus the
cost of bio-ethanol from Zea mays var. Indentata can be estimated to be N357.00 / L.
As shown in Figure 8, 21. 30 g/l of ethanol was obtained from 100 g of Zea mays var.
Ceratina flour. This means that 21.30 g/l ethanol was obtained from 100 g of flour. Since the
total amount of flour ethanol from 1.0 kg of Zea mays var. Ceratina was 992.55 g, the total
amount of ethanol from 1.0 kg of Zea mays var. Ceratina is 211.41 g using a density of 99.5
% ethanol which is 0.789, the volume of ethanol produced from 1.0 kg of Zea mays var.
Ceratina is 267.9 ml (0.26 L).
Based on the cost of Zea mays var. Ceratina in Nsukka (N5,800/100 kg), it can be
estimated that the cost of Zea mays var. Ceratina used to produce 1 L of ethanol is N222.7.
The cost of raw materials usually represents about 70 % of the total production cost. Thus the
cost of bio-ethanol from Zea mays var. Ceratina can be estimated to be N318.14/L.
In summary, the costs of ethanol production (N/L) from the flour corn varieties were
276.42, 442.28, 357.00 and 318.14 naira per liter for Indurata, Praecox, Indentata and
Ceratina, respectively (Table 7).

60
Table 4: Flour and chaff yield from 1 kg of corn obtained in one gram
Corn Varieties Flour (g) Chaff (g)
Zea mays var.Indurata 993.57 6.23
Zea mays var.Praecox 992.78 6.12
Zea mays var.Indentata 993.48 6.22
Zea mays var.Ceratina 992.55 6.15

61
Table.5: prices (Naira) of Corn Grain in Different part of Nigeria.
Table 6: Summary of Commercial Production of Ethanol from Corn
Weight Zea mays var. Zea mays var. Zae mays var. Zea mays Var. Part of Nigeria
(kg) Indurata Indentata Ceratina var. Praecox
100 N5,900 N6,700 N5,600 N8,800 New Market, Enugu
State
100 kg N6,000 N6,800 N5,700 N8,900 Ogbete Market,
Enugu State
100 kg N6,000 N7,000 N5,800 N9,000 Ogige Market
Nsukka.

62
Table 6: Summary of Commercial Production of Ethanol from Corn.
CORN VARIETIES COST OF PRODUCTION (NAIRA)
Zea mays var. Indurata 276.42/L
Zea mays var. Praecox 442.28/L
Zea mays var. Indentata 357.00/L
Zea mays var. Ceratina 318.14/L

63
Table 7: Current price of fuel ethanol in Nigeria
The content of gasoline are 32MJ/L for LHV and 35MJ/L for HHV. In the case of ethanol,
the energy contents are 21.1MJ/L for LHV and 32.4MJ/L for HHV
(www.ocean.washington.edu 2005). The energy content of fuel ethanol is 66-67% of gasoline
(Joss Goldbemberg, 2008). Thus energy content of IL ethanol = energy content in 0.67 of
gasoline. IL of gasoline = N97.
Price of 1.0L of ethanol = 0.67 x 97 = 64.99 = N65. Thus equivalent current price of
ethanol is N65.Production cost = N276.42. Thus with this current subsidy; there will be a loss
of N32 per 1 of ethanol. However, with total removal of subsidy, the cost of IL of ethanol
will be 0.67 x 141 = N94.47. Even without considering sales from byproducts there will be a
profit of N181.95 per L of corn ethanol. However, if the market price of corn can be reduced
to N2, 000/100kg, the cost of production will decrease to N92.00/L; which is profitable
provide that the subsidy is removed. These results are summarized in Table 9.
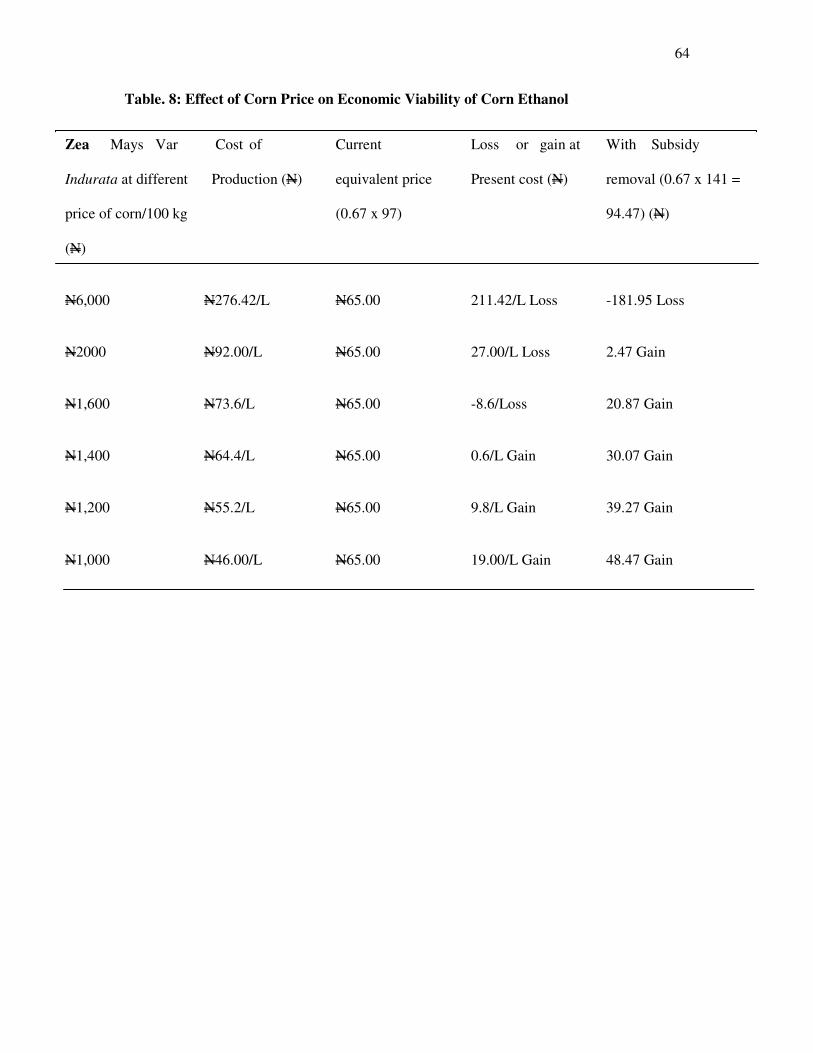
64
Table. 8: Effect of Corn Price on Economic Viability of Corn Ethanol
CHAPTER FOUR
Zea Mays Var Cost of Current Loss or gain at With Subsidy
Indurata at different Production (N) equivalent price Present cost (N) removal (0.67 x 141 =
price of corn/100 kg (0.67 x 97) 94.47) (N)
(N)
N6,000 N276.42/L N65.00 211.42/L Loss -181.95 Loss
N2000 N92.00/L N65.00 27.00/L Loss 2.47 Gain
N1,600 N73.6/L N65.00 -8.6/Loss 20.87 Gain
N1,400 N64.4/L N65.00 0.6/L Gain 30.07 Gain
N1,200 N55.2/L N65.00 9.8/L Gain 39.27 Gain
N1,000 N46.00/L N65.00 19.00/L Gain 48.47 Gain

65
CHAPTER FOUR
4.1 DISCUSSION
From the above observation, it can be deduced that most of the starch content of the
corn flour was converted to ethanol by Saccharomyces cerevisiae within 7 days while A.niger
was capable of hydrolyzing the starch. The maximum ethanol (47.08 g/l) produced from Zea
mays var. Indurata at 72 hours is in agreement with Curtis et al; (2004) who also reported
maximum ethanol yield (89.6 %) at 72 hours from raw corn using Saccharmoyces cerevisiea.
Furthermore, the production cost of 1 L of ethanol was deducted and confirmed to be 33 e
(N50.33) (McCain, 2007). Though US Government still pays subsides to large corporations
that produce ethanol in USA. (McCain, 2007).Brazil the largest producer of ethanol in the
world use sugarcane to produce ethanol and sugar cane is a more efficient raw material for
ethanol production than corn grain but the Brazilian government still subsidizes the ethanol
industry to continue its production in their country. (McCain, 2007) because they know that
fossil fuel will deplete soon and also sugarcane is more readily available and the cheap raw
material in their country.
The Federal Government of Nigeria should see reasons with those developed countries
that still against all odds continue to embark on ethanol production using the available
renewable raw materials. The corn varieties used in this study were all developed by the
Department of Crop Science University of Nigeria Nsukka and are cultivated in various parts
of Nigeria. Since the cost of corn represents more than 70 % of the total ethanol production
cost from corn (Krishan et al, 2011; Zhang et al, 2003), efforts must be made to increase both
corn yield and starch contents of corn varieties in Nigeria. Nigerians should be encouraged to
go into agricultural production (i.e corn production) the more and in that case the corn will
serve both for human consumption and fuel ethanol production.

66
4.2 CONCLUSION
Amongst the four varieties of corn investigated, Zea mays var.Indurata is the best
substrate for bio-ethanol production. The total starch as well as the amylose content was
higher than those of the other three corn varieties. It also gave the highest ethanol
productivity and yield. The cost of production with a market price of corn at N6, 000/100 kg
is N276.42/L. This is not profitable with the current equivalent price of N65.00/L.
However, if the subsidy is completely removed or the same subsidy extended to fuel
ethanol, it will be profitable at the price of N2, 000/ 100 kg. Reducing the cost of corn will
make corn ethanol profitable.

67
REFERENCES
Adenola, O.A., Akinwumi, J.A. and Alika, J.E. (2008). Maize Production and Utilization in Nigeria: Biofuels Production. African Journal of Biotechnology 65 (2):223 – 232.
Ado, S.A., Kachalla, G.U., Tijjani, M.B. and Aliyu, M.S. (2009). Ethanol Production from Corn cobs by co-cultures of Saccharomyces cerevisae and Aspergillus niger. Bayero
Journal of Pure and Applied Sciences 2 (2): 99 – 101.
Anuji, K.C., Chan, E.S., Ravinder, R. and Lakshmi, N.M. (2007).Economics of
Environmental Impact of Biotechnology and Molecular Biology Review.2 (1): 14-32.
Curtis, W., Steinberg, M.P. and Rodda, E.D. (2004). Fuel Ethanol from Raw corn. Biological
Systems Engineering. International Journal of Food Microbiology 4 (13): 177-184.
David,K.C., Pimentel, D.A. and Patzek, T.W. (2005). Ethanol production using Corn,
Switchgrass and Wood; Biodiesel Production using Soybean and Sunflower. Journal of
Natural Resources Research 14. (1): 100-112.
Elander, R.T. and Hsv, T. (2006). Processing and Economic Impacts of Biomass Delignition
for Ethanol Biotechnology. Pakistan Journal of Nutrition. 4 (7): 463-478.
Elander, R.T. and Putshe, S.A. (2006). Structure and Composition Corp: Chemistry and
Technology. Biology Bioenergy. Nigerian Journal of Biotechnology 5 (3): 82-84.
Fakorede, M.B., Kim, S.K., MAreck, J.H. and Iken, J.E. (2003). Breeding Strategies and
potentials of available varieties in relation to attaining self sufficiency in maize
production in Nigeria . African Journal of Biotechnology 3 (6): 15-39.
Farrell, A.E., Plevin, R.J., Turner, B.T., Jones, A.D., O’Hare, M. and Kammen, D.M. (2006).
Ethanol can Contribute to Energy and Environmental Goals. African Journal of
Biotechnology 311 (5): 506-508.

68
Gabby, C.O., Bruz, B.K. and Owens, K.A. (2007). Energy Economics. National
Development and Reform Commission: Institute for Energy Economics. Journal of
Applied Microbiology 6 (4): 73-77.
Haefele, D.F., Owens, K.A., O’ Bryan, C.T. and Sevenich, D.A. (2004). Selection and
Optimization of Corn Hybrids for Fuel Ethanol Production. Industrial Microbiology 2nd
Edition. P. 72.
Ho, NWY., Chen, Z., Brained, A. and Sedlak, M. (2009). Successful Design and
Development of Genetically Engineered Saccharomyces yeasts for Effective
Fermentation of Glucose and Xylose from Cellulosic Biomass to Fuel Ethanol, Journal of
Adv. Biochemical Engineering and Biotechnology 65 (3): 164-192.
Iken, J.E., Amusa, N.A., Obatolu, V.O. and Efron, Y.S. (2002). Evaluation of Some Newly
Developed Maize Varieties in Nigeria: Food Technology. Journal of Food Technology 65
(7): 25 – 28.
Joss Goldbemberg, F., Pederson, C.S. and Owen, D.A. (2008). Microbiology of Food
Fermentation: Industrial Microbiology. 2nd Edition. P. 84.
Kaylen, M., Van Dyne, D.L., Choi, Y.S. and Blaise, M. (2001). Economic Feasibility of
Producing Ethanol from Lignocellulosic Feed Stocks. Journal of Bioresource Technology
72 (2): 19-32.
Kim, T.H. and Kim, J.S. (2003). Pretreatment of Corn Stover by Aqueous Ammonia. Journal
of Bioresource Technology 55 (3): 110-111.
Kohl, S. (2004), Techanical Conversions on Ethanol: Food Insights. World Journal of
Microbiology and Biotechnology 26 (8): 10 – 17.
Kosaric, N., Duvnjak, Z. and Stewart, G.G. (2005). Fuel Ethanol from Biomass: Production
Economics and Energy. Journal of Advanced Biochemical Engineering 20 (2): 119-151.
Krishan, M.S., Taylor, F., Davison, B.H. and Nghiem, N.P. (2011). Economic Analysis of

69
Fuel Ethanol Production From Corn Starch using Fluidized-bed Bioreactor. Journal of
Bioresources Technology 75 (6): 99-105.
Lubert, W.H., Stryer, S.A., Obi, I.U. and Klim, S.K. (2005). Biochemistry of Ethanol
Fermentation. World Journal of Microbiology and Biotechnology 21 (3):731-733.
Mathew, C., Rendlemon, U. and Hosein Shapouri, S. (2003). New Technologies in Ethanol
Production Phytochemical Analysis. Journal of Biological Sciences 34 (2): 79-85.
McCain, S. (2007). The Chemical Analysis of Food: Food Insights. African Journal of
Biotechnology 26 (3): 10 – 17.
McALoon, P., Benjack, U. and Klim, A.O. (2000). Fuel Ethanol from Biomass: Production
Economics and Energy. Journal of Advanced Biochemical Engineering 20 (4): 119-151.
Mueller, N., Claire, Z. and Jackson, G.H. (2008). Ethanol from Biomass Production:
Economics and Energy. Journal of Advanced Biochemical Engineering 64 (1): 94-99.
Nathan, S., Moser, E. and Klein, I. (2005). How Fuel Ethanol is made from Corn:
Department of Agriculture. Journal of Biological Sciences 32 (8): 91-98.
Nigam, J.N. (2001). Ethanol Production from Wheat Straw Hemicelluloses Hydrolystate by
Pichia stipitis. Journal of Biotechnology 87 (1):17-27.
Nwachukwu, I.N., Ibekwe, I.V., Nwabueze, R.N., Anyawu, B.N., Kalu, I. and Chinakwe, E.
(2008). Production of High Ethanol Yielding Saccharomyces cerevisiae of Palm Wine:
Origin by Protoplast Fusion. Journal of Bioresource Technology 5 (4): 64-68.
Olsson, L., Hahn-Hagerdal, J.E. and Zacchi, G. (2004). Kinetics of Ethanol Production by
Recombinant Escherichis coli k011. Journal of Biotechnology and Bioengineering 45 (2):
336-365.
Oyeleke, S.B. and Jibrin, N.M. (2009). Production of Bioethanol from Guinea Corn Husk and
70
Millet Husk. African Journal of Microbiology Research 3: (4): 147-152.
Patzek, T.W. (2004) Sustainability of the Corn-Ethanol Biofuel Cycle: College of
Engineering Submitted. Critical Reviews of Plant Science 65 (3): 416-421.
Pimentel, D. (2003). Ethanol Fuels: Energy Balance, Economics and Environmental impacts.
Journal of Natural Resources Research 12 (2): 720-728.
Rausch, K.D., Belyea, R.L., Ellersieck, M.R., Zingh, V., Johnston, D.B. and Tumbleson,
M.E. (2006). Particle Size Distributions Ground Corn and DDGS from Dry Grind
Processing. Journal of Agricultural and Biological Engineering 48 (1): 273 – 277.
Rhys, T.D. and Wallace, E.T. (2006). Economic and Technical Analysis of Ethanol Dry
Milling: Model Description. Journal of Applied Microbiology 95 (4): 470-475.
Rokem, J.S. (2011). Molecular Genetics and Biotechnology: Food Fermentation. Journal of
Biotechnology 6 (2): 10-14.
Shapouri Hosein, S., Gallagher, E.C. and Michael S. G. (2003). Ethanol Cost of Production
Survey United State: Department of Agriculture. Journal of Food Science and
Agriculture 77: (1) 127-132.
Singh, C., Ken, A.D and Klein E.U. (2008). National Oil Seeds and Vegetable Oils
Development Board India. Journal of Food Technology 76 (6): 82-88.
Sokhansanji, S., Turhollow, E.C. and Perlack, R. (2002). Stochastic Modeling of Cost of
Corn Stover: Costs Delivered to and Intermediate Storage Facility Review 20 (2):40- 44.
Swings, D. and Deley, J. (2006). Ethanol Fuels: Energy Economics and
Environmental Impacts: Journal of Biotechnology 34 (4): 110-119.
Szczodrak, J. (2008). The Enzymatic Hydrolysis and Fermentation of Pretreated Wheat Straw
to Ethanol. Journal of Biotechnology and Bioengineering 32 (6): 771-776.

71
Van Eijnathen, L.M., Lale, N.E. and Kang, B.T. (2005). Improvement of Maize in Nigeria.
Bioscience Research Communication Review 11 (2): 79 – 84.
Wang, M.Q. and Greet, M.U. (2008). Transportation Fuel-cycle Model: Methodology,
Development, Use and Results, enter for Transportation Research, Argone National
Laboratory. Food Control Review. 19 (2): 829-832.
Watson, S.A., Nathan, S.M. and Klein, C.Y. (2000). Structure and Composition Corp:
Chemistry and Technology. Biology Bioenergy and American Association of Cereal
Chemistry. Pp. 53 – 82.
Wooley, A.C., Robert, H., Mark,O., Ruth, N., David, D.E., Glassner, G. and John S.P.
(2006). Process Design and Costing of Bioethanol Technology: A Tool for Determining
the Status and Direction of Research and Development. African Journal of
Biotechnology Progress 15 (5) : 794-803.
Xiang-Yang Ge, H. and Wei-Gw Zhang, J.U. (2005). A Shortcut to the Production of High Ethanol Concentration from Jerusalem Artichoke Tubers. Journal of Biotechnology 43 (3): 241 – 246.
Zhang, J.G., Wei-Gw Zhang, J.U., Glassner, G. and Claire, Y.S. (2003). Evaluation of some
Newly Developed Maize Varieties in Nigeria. African Journal of Food Technology 7 (4):
25 – 28.