animal anesthesia monitoring guidelines · pdf fileanimal anesthesia monitoring guidelines . 2...
TRANSCRIPT

1
ANIMAL ANESTHESIA MONITORING GUIDELINES

2
ECG MONITORING REASONS FOR MONITORING ECG
Diagnosing arrhythmias or conduction abnormalities As part of preoperative work-up in senior patients Routine or indicated screens During surgery and to evaluate effects of cardiac drugs Assess patients with breathing problems or that are in
shock Assess patients with cardiac murmurs To help decide on further diagnostic tests (thoracic
radiography or echocardiography) Periodic assessments of arrhythmia prone breeds
- Boxers (myocarditis), - Doberman pinschers (ventricular arrhythmias or cardiomyopathy), - German shepherds (congenital ventricular
arrhythmias), and - Miniature schnauzers (sick sinus syndrome and sinus
arrest/block)

3
ECG TECHNIQUE For veterinary patients, especially small ones, following the tips below will allow for the optimal measurement of ECG.
Place animal in right lateral recumbence Hair should not be clipped over lead site. If matted, only lightly clip, but not down to skin Prepare the lead sites w/ alcohol first, then apply
ultrasound gel or KY jelly if desired. Caution: ECG paste may corrode metal skin clips
For cats, place a thin layer of alcohol-saturated cotton over site, apply gel and attach skin clips
Do not allow the metal clips to come in contact with metal (each other, metal exam table, etc)
Increase GAIN setting on monitor for small complexes Insure that skin clips have adequate spring tension If electrical interference is encountered move electrical
equipment away from the monitor and check ECG filter setting on monitor (High or Low) Note: Operating monitor with battery will reduce interference

4
SETTING UP ECG LEADS
Prepare site with alcohol Use figures below for lead selection Connect lead wires to patient cable Connect patient cable to monitor Turn monitor on Metal clips must not contact metal table or each other
Note: LA above is reference electrode. Reference electrode can also be placed on right hind leg. This electrode is Green in USA standard

5
TEMPERATURE MONITORING
Better temperature management was cited as one of the three major factors in improving general anesthesia mortality rates. During anesthesia, hypothermia is a frequent, serious risk, although hyperthermia is also a risk in some Nordic breeds ADVERSE EFFECTS OF HYPOTHERMIA
Immune system depression; triple the post-operative infection rate
Coagulopathy and increased blood viscosity leading to sludging
Increased systemic vascular resistance and afterload Hypocapnia that may lead to alkalemia if positive pressure
ventilation is not adjusted Physiologic response to hypoxemia and hypercarbia is
blunted Effect on central nervous system delays recovery and
causes confusion, stupor or coma Hypovolemia and/or hyperglycemia Minimum alveolar concentration decreases 5%/Cº below
normal: anesthetic overdose may occur Delayed drug metabolism, decreased liver metabolism
leading to drug toxicity Post operative shivering increases intraocular pressure,
intracranial pressure and wound pain

6
ANIMAL BLOOD PRESSURE MONITORING
DURING SURGERY
Assess anesthetic depth* Monitor trends to provide:
- an index of a patient’s cardiovascular status - the depth of anesthesia - response to therapeutic intervention - an indication for adjusting fluid therapy, and - titrating drug doses.
Monitor adequacy of circulation Discover hypotension* (SAP<80mmHg; MAP<60mmHg) Use MAP for the best determinant of good organ perfusion Monitor the effect of pre-anesthetic agents that can cause
hypotension* Compare SAP to normal intraoperative pressure between
110-160mmHg. Detect inadequate anesthesia and resulting pain by
increase in heart rate
* Studies have shown that >25% of surgery patients are hypotensive and that hypotension is a major risk factor in 1 year post-surgery mortality
IN THE EXAM ROOM HYPERTENSION
Suspected if systolic pressure >150 mmHg Confirmed if systolic >160 mmHg; or Diastolic >100 mmHg 60-70% of animals w/renal disease are hypertensive Hypertension often accompanies hyperthyroidism Blood pressures rise slowly but steadily with age Overweight animals have higher blood pressures Baseline BP should be established (annual/semi-annual)

7
AIRWAY C02 CAPNOGRAPHY
Capnography: “The Anesthesia Disaster Early Warning System” Because all three components of respiration (metabolism, transport, and ventilation) are involved in the appearance of CO2 in exhaled gas, capnography gives an excellent picture of the respiratory process. Nicknamed the “Anesthesia Disaster Early Warning System,” it is greatly responsible for the reduction in death rates during general anesthesia in human medicine from 1 in 5,000 in 1983 to 1 in 300,000 in 2005.
Factors that affect CO2
• Metabolism - Substrate metabolism, drug therapy, and core temperature • Transport - Cardiac output and pulmonary perfusion. • Ventilation - Obstructive and restrictive diseases, and breath rate • Ventilation/Perfusion ratios - Shunt perfusion and dead space ventilation
Animal C02 monitors provide digital read out of end-tidal CO2 only or with a waveform (capnograph). The digital read out of ETCO2 can be in mm Hg (partial pressure of CO2 in exhaled gas) or as % in exhaled gas. Most of the commonly used devices use ‘infra red absorption of CO2 as principle of operation.

8
Capnometry measures the amount of end-tidal (exhaled) carbon dioxide during ventilation. The end-tidal level of carbon dioxide is generally less but is reflective of carbon dioxide in arterial blood and can serve as an indirect noninvasive method of assessing the adequacy ventilation. A more complete picture of carbon dioxide transfer can be obtained from a capnogram, similar to an ECG tracing. A capnogram provides a continuous waveform that reflects the changes in airway carbon dioxide levels throughout inspiration and expiration. In contrast, capnometry simply reports the maximum and minimum carbon dioxide levels associated with expiration and inspiration respectively; similar to the heart rate output from an ECG.
Capnography is a useful monitoring tool in mammals with normal lungs. In reptiles, however, capnography has not been evaluated and the presence of right-to-left intracardiac shunts and dead space ventilation associated with the unique structure of many reptilian lungs makes this technology prone to inaccuracies. The end-tidal carbon dioxide will not necessarily reflect arterial carbon dioxide levels and the gradient between arterial and end-tidal carbon dioxide cannot be predicted.
Capnometers and capnographs measure carbon dioxide tension (ETCO2) in exhaled gases. Endotracheal intubation is not required for sample collection when a side-stream analyzer is used. Samples may be collected from tubing placed in the nasal passage. The value represents the concentration in the alveoli which approximates arterial carbon dioxide tension (PaCO2). ETCO2 tends to underestimate PaCO2 by 2 - 5 mm Hg. This difference is usually not clinically significant though may increase in patients with respiratory and/or circulatory compromise. Ventilation is defined by PaCO2, with a normal range of 35 - 45 mm Hg; thus, ETCO2 provides continuous, noninvasive quantitation of adequacy of ventilation. Values above 40 - 45 mm Hg for ETCO2 indicate inadequate ventilation.

9
The information provided will direct the need for ventilatory assistance and will provide the fine-tuning necessary if mechanical ventilation is in place. Capnometers provide an ETCO2 value and respiratory rate, while capnographs also provide a waveform of every breath. Display of a normal capnogram requires cellular metabolism, blood circulation and alveolar ventilation; abnormalities detected in the capnograph may provide an early indication of developing cardiopulmonary problems.
The measurement of C02 in the expired air directly indicates changes in the elimination of C02 from the lungs. Indirectly, it indicates changes in the production of C02 at the tissue level and in the delivery of C02 to the lungs by the circulatory system. Therefore, capnography constitutes an important non-invasive technique that can monitor C02 production, pulmonary perfusion and alveolar ventilation as well as respiratory patterns.
10
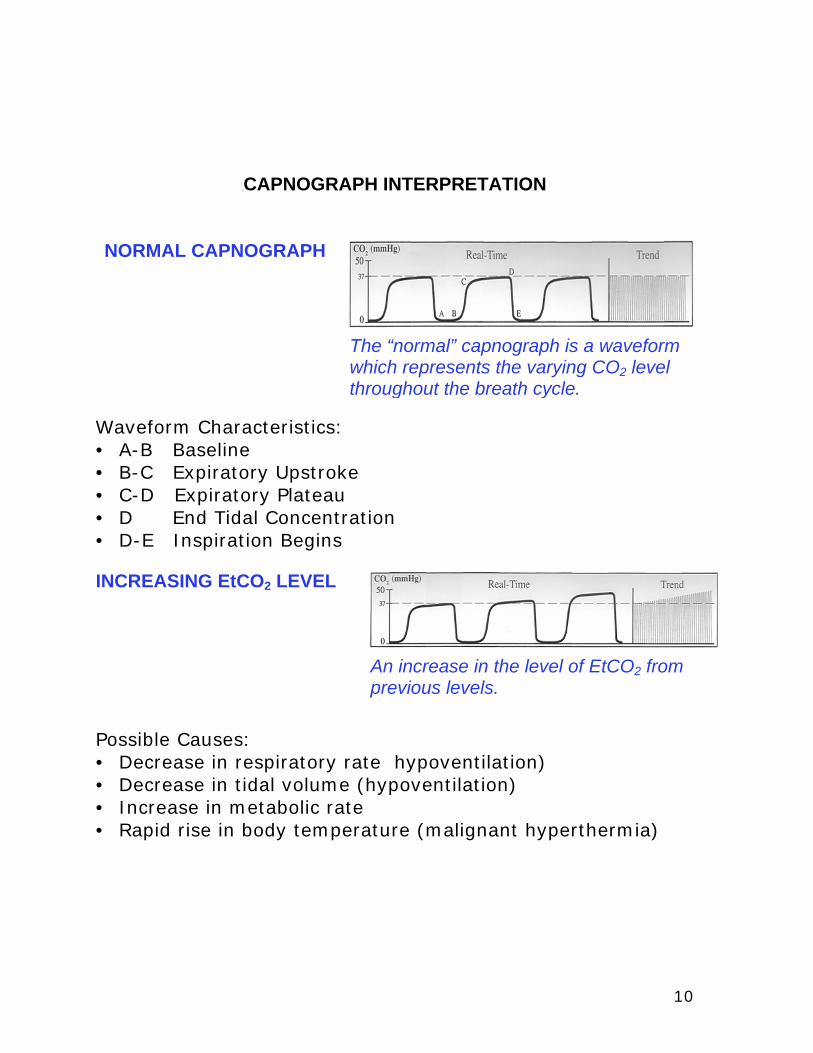
CAPNOGRAPH INTERPRETATION
Waveform Characteristics: • A-B Baseline • B-C Expiratory Upstroke • C-D Expiratory Plateau • D End Tidal Concentration • D-E Inspiration Begins INCREASING EtCO2 LEVEL
Possible Causes: • Decrease in respiratory rate hypoventilation) • Decrease in tidal volume (hypoventilation) • Increase in metabolic rate • Rapid rise in body temperature (malignant hyperthermia)
The “normal” capnograph is a waveform which represents the varying CO2 level throughout the breath cycle.
NORMAL CAPNOGRAPH
An increase in the level of EtCO2 from previous levels.

11
Possible Causes: • Increase in respiratory rate (hyperventilation) • Increase in tidal volume hyperventilation) • Decrease in metabolic rate • Fall in body temperature
Possible Causes: • Faulty expiratory valve • Inadequate inspiratory flow • Malfunction of a CO2 absorber system • Partial rebreathing circuits • Insufficient expiratory time
Elevation of the baseline indicates rebreathing (may also show a corresponding increase in EtCO2).
REBREATHING
A decrease in the level of EtCO2 from previous levels.
DECREASING EtCO2 LEVEL

12
Possible Causes: • Obstruction in the expiratory limb of the breathing circuit • Presence of a foreign body in the upper airway • Partially kinked or occluded artificial airway • Bronchospasm
Characteristics: • Depth of the cleft is inversely proportional to the degree of drug activity • Position is fairly constant on the same patient but not necessarily present with every breath
Clefts are seen in the plateau portion of the capnograph. They appear when the action of the muscle relaxant begins to subside and spontaneous ventilation returns.
MUSCLE RELAXANTS
Obstructed expiratory gas flow is noted as a change in the slope of the ascending limb of the capnograph (the expiratory plateau may be absent).
AIRWAY OBSTRUCTION

13
A normal capnogram is the best available evidence that the ET tube is correctly positioned and that proper ventilation is occurring. When the ET tube is placed in the esophagus, either no CO2 is sensed or only small transient waveforms are present.
Possible causes: • A leaky or deflated endo-tracheal or tracheostomy cuff • An artificial airway that is too small for the patient
The downward slope of the plateau blends in with the descending limb.
Waveform Evaluation:
ET TUBE IN ESOPHAGUS
INADEQUATE ET TUBE SEAL

14
• Baseline elevated • Abnormal descending limb of capnogram • Allows patient to rebreathe exhaled gas
FAULTY VENTILATOR CIRCUIT VALVE
Waveform evaluation:

15
PULSE OXIMITRY REASONS FOR USING PULSE OXIMETRY
Cardiac arrest warning system - pulse to pulse sensitivity seen before ECG
Determine whether patient is receiving enough oxygen Monitor patient’s ability to maintain oxygenation during recovery Extremely sensitive in detecting pneumothorax Warns of need to evacuate air or blood during postoperative
thoracotomy Asses response to treatment in shocky, hypothermic or
hypotensive patients
OPTIMIZE SENSOR ACCURACY Clean with alcohol Store fully-extended (don’t wrap) Reposition periodically Use on cuff and catheter-free extremity Place close to heart level Cover site with opaque material to minimize ambient light Keep patient and extremity warm to minimize shivering If slippage occurs on tongue, use one layer of gauze over tongue
to place the sensor Note: Normal Sp02 values are 95-100% depending on area and placement of sensor. Check placement and probe security before reacting to abnormal readings.

16
17
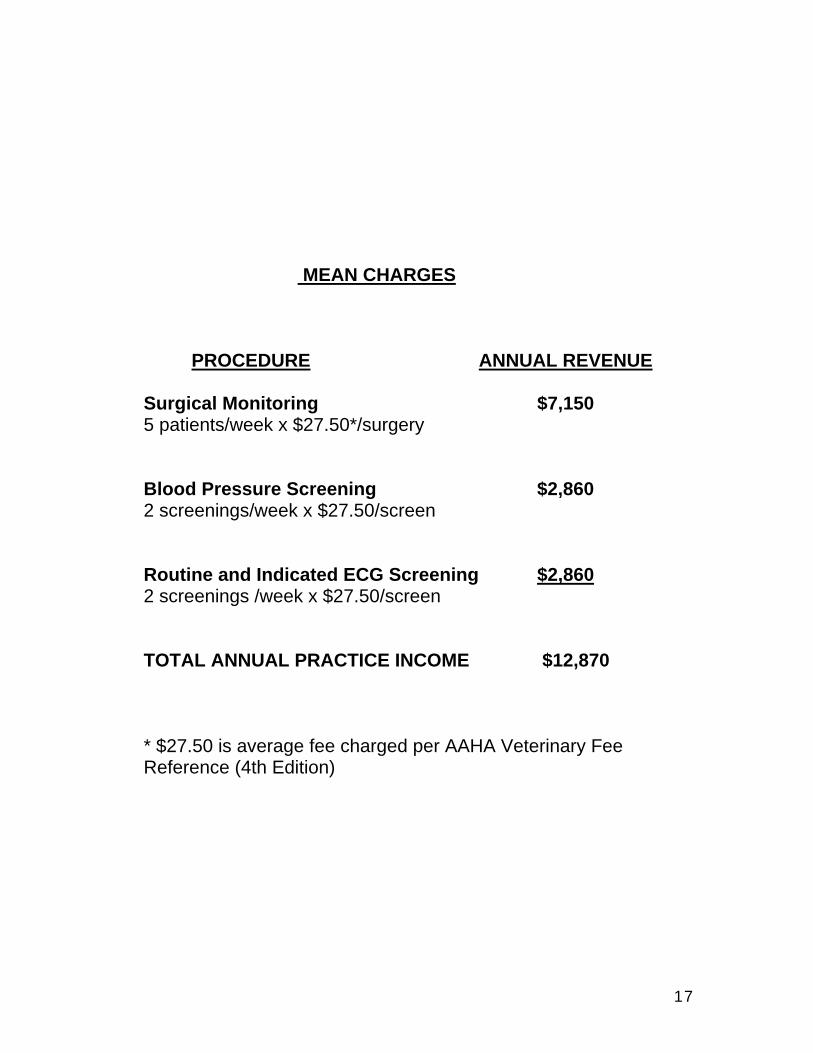
MEAN CHARGES
PROCEDURE ANNUAL REVENUE
Surgical Monitoring $7,150 5 patients/week x $27.50*/surgery
Blood Pressure Screening $2,860 2 screenings/week x $27.50/screen
Routine and Indicated ECG Screening $2,860 2 screenings /week x $27.50/screen
TOTAL ANNUAL PRACTICE INCOME $12,870
* $27.50 is average fee charged per AAHA Veterinary Fee Reference (4th Edition)

18