animal tracking: lesson plan - american geosciences institute · animal tracking: lesson plan...
TRANSCRIPT

Animal Tracking: Lesson Plan
Overview
This five-part lesson prompts children to consider how they fit in to the Earth's ecology. It asks them to look at themselves as animals, by asking two basic questions: Where do you live? And what do you eat? The goal is not to convince them that they are just like other animals (they are not), but to make them learn and think about the similarities and differences between humans and other animals, and to consider how they and other organisms affect each other. You can also address nutrition in this lesson, and steer children away from junk food, obesity, and so forth. Are their food pyramids are on a sound base, or top-heavy with junk?
This lesson is divided into five "days," each of which could be covered in a single class period or over several periods.
• Day One: "I am an Animal" Discuss, over a slideshow, how people are animals, and are both similar to and different from other animals. Introduce the Tracking Reports and help students record what they ate and where they went that day.
• Day Two: "Natural and Artificial Foods" Update Tracking Reports. Discuss, over a slideshow, what food is, and the revolution from natural to artificial foods. Help students classify their foods by source (hunting, gathering, herding, or planting.) Read one or two short passages on American Indian hunting and gathering, and/or view a short video recounting an American Indian boy’s first buffalo hunt.
• Day Three: "Natural and Artificial Habitats" Update Tracking Reports. Discuss, over a slideshow, what habitat is, and how animals need multiple habitats. View another slideshow with satellite images of habitats that are a mix of artifice and nature.
• Day Four: "Food Statistics" Update Tracking Reports data for the last time. Tally the foods by production method, food group, and species, and calculate per-day averages. Pie-chart the foods by production method and food group. Make a food-pyramid chart of the food groups.

• Day Five: "Habitat Statistics" Students use a bar chart to graph and document the number of hours they spent in various locations and doing various activities. Map each student's daily range, and calculate a class average. Assign a written summary.
Suggested Lesson Sequence
See the Earth Systems and Humans module description.
Lesson Level Extended Mathematics Connections (Keywords in bold)
• Students calculate percent fractions, and daily and group averages.
• Students make tallies, bar charts, and pie charts.
Science Connections (Keywords in bold)
• Students recognize that artificial foods and habitats are different from natural ones.
• Students will consider "artificial" and "natural" as a graded scale, not as separate categories.
• Students recognize that food and mobility distinguish animals from plants.
• Students learn that animals' energy comes from food, which comes from photosynthesis.
• Students recognize how one animal may use several habitats, so edge habitats are often best.
• Other specific topics touched on: deserts, weeds, tame and wild, bunch and sod grasses, bobwhite quail.
Technology Connections (Keywords in bold)
• Students may optionally use a spreadsheet program to make calculations and charts.
Human Connections • Students investigate how hunting and gathering peoples developed agriculture (planting and herding), which led to civilizations.
• Students investigate how humans build artificial habitats including farms, roads, and cities.

Lesson Assessment Tools
• Assessment and Standards Table (Word) • Assessment Activity Description • Authentic Assessment
Materials
Entire lesson
• Powerpoint Reader (download: Windows / Mac), and preferably a projector • Microsoft Excel • Computer with speakers • Quicktime Player software
Day 1: I am an Animal
• "I am an Animal" slideshow (PowerPoint) • Tracking Report (Excel)
Day 2: Natural and Artificial Food
• "Natural and Artificial Food" slideshow (PowerPoint) • Reading on gathering, by Charles Eastman (Word) • Reading on hunting, by Luther Standing Bear (copyrighted; see below) • "Meet Leonard Little Finger" movie (QuickTime) • "Hunting Tatanka" movie (QuickTime-- large file, may take a minute to load)
Day 3: Natural and Artificial Habitat
• "Natural and Artificial Habitat" slideshow (PowerPoint) • "Habitat from Space" slideshow (PowerPoint)
Day 4: Food Statistics
• Tracking Report (Excel)
Day 5: Habitat Statistics
• Tracking Report (Excel)

• Downloaded map of your city / area • Wall map of your city / area (optional)
Optional
• Animal Population Modeling spreadsheet (Excel) • Pie Chart Activity Sheet (Word)
Vocabulary
Agriculture: The raising and breeding of animals and plants for food
Art or artifice: Human processes of intentionally reshaping things, making them artificial to some degree.
Bobwhite quail: A small chunky bird which mostly walks
Civilization: A human society and culture with cities, farms, and roads as its most important habitats
Desert: A place not covered by plants, either partly or completely. This is often, but not always, caused by dryness.
Edge habitat: A habitat which lies at the border between different types of vegetation
Energy: Capacity for doing work.
Food: An organism that gets eaten
Habitat: A place where animals or plants can live
Hunting and gathering: A lifestyle of getting food from natural sources
Natural: Formed only slightly by human artifice
Organism: An individual living thing

Photosynthesis: A process through which plants convert sunlight energy into food (e.g. sugar and starch) energy
Plants and animals: The two best known kingdoms of organisms, distinguished here by mobility and photosynthesis
Vocabulary Note: students will likely be unfamiliar with other vocabulary presented in this lesson. This is done intentionally, to spur additional conversations and discussion about these words and their meanings. Encourage your students to ask about words they may be unfamiliar with.
I. Assessing Prior Knowledge
Begin this lesson by asking students questions such as where they think their food comes from, and what people have in common with plants and other animals. Then, after some discussion, jump right in to this lesson by starting the procedure for Day One (“I am an Animal”) below.
II. Student Activities
Procedure for Day One: I am an Animal or, Back in My Day, Plants was Plants and Animals was Animals
1. Contextual Preparation: You might start with a dramatic announcement: "Students, each of you will spend this week tracking an animal, and making a report with data and statistics on where that animal went, and what it ate. That animal is . . . YOU! And you are a fascinating animal." This point is also made in the "I am an Animal" slideshow.
2. About the slideshows: These slideshows are not meant for students to read through on their own. They are intended to be viewed together, to merely outline and illustrate a discussion of the day's themes, led by the teacher. You might have a different student read the text on each slide. The "notes" section of the Powerpoint file has some suggestions and background information for the teacher.

3. Discussion: This slideshow simply lays out the kingdoms of plants and animals, locates the students in the animal kingdom, and asks them to think about how they are different from, but also similar to, other animals. This is to set up this lesson's theme of thinking about ourselves as animals. The slideshow also deliberately sets up the two simple themes of the week-- moving and eating.
4. Tracking Reports: After the discussion, hand out the "Food Data" and "Habitat Data" sheets. Go through the forms and help students record what they ate and where they went since waking up that day. Start (and end) at midnight, for easy averaging later. The best way is probably for teachers to demonstrate, logging their day on an overhead projector. You may want to have them use pencils. (Note: It may be simplest to hand out all of the handouts for the week at once, stapled together into a notebook.)
5. "Food Data" sheet:
• The "Day" and "Time" columns are organizational aids. The "Main Species" column is where some mental connections are made, and students may require help from the teacher. Encourage students to read food labels.
• "J M M V F G" stands for the food groups in shorthand: junk, milk, meat, vegetables, fruit, and grain. Students will complete these headers and check boxes column on Day Four. Let it remain a mystery for now.
• "H G H P" likewise stands for hunting, gathering, herding, and planting, which you will introduce and students will fill in on Day Two.
• The key to success here is to not bog down in too much detail. One line per food is fine, though if a student wants two lines for a ham omelet, he or she can certainly use two lines. We are just trying to capture the big picture, with reasonable accuracy. Too much detail will make the following "statistics" days tedious. An appropriate example is illustrated below.
Day Time Food eaten J
M
M
V
F
G
Main species H
G
H
P
Mon bfst cereal oats " " milk cow " " OJ orange " lunc
h hotdish cow
" " " potato
" " Coke corn
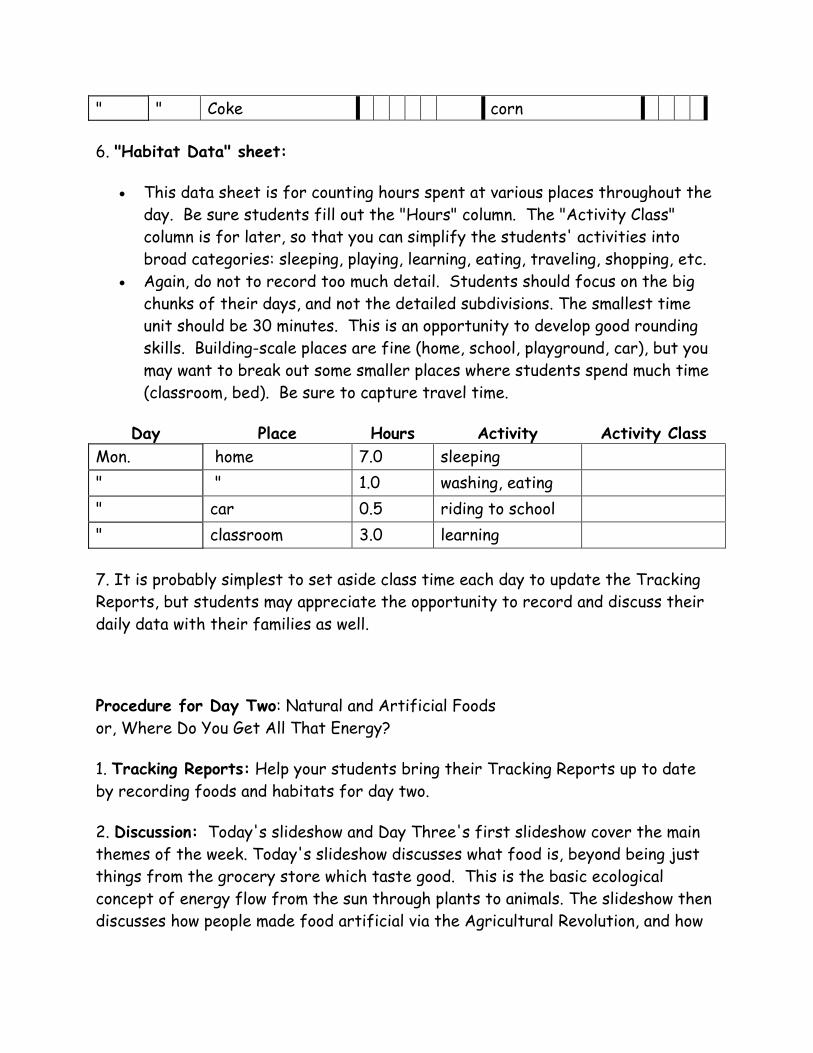
6. "Habitat Data" sheet:
• This data sheet is for counting hours spent at various places throughout the day. Be sure students fill out the "Hours" column. The "Activity Class" column is for later, so that you can simplify the students' activities into broad categories: sleeping, playing, learning, eating, traveling, shopping, etc.
• Again, do not to record too much detail. Students should focus on the big chunks of their days, and not the detailed subdivisions. The smallest time unit should be 30 minutes. This is an opportunity to develop good rounding skills. Building-scale places are fine (home, school, playground, car), but you may want to break out some smaller places where students spend much time (classroom, bed). Be sure to capture travel time.
Day Place Hours Activity Activity Class Mon. home 7.0 sleeping " " 1.0 washing, eating " car 0.5 riding to school " classroom 3.0 learning
7. It is probably simplest to set aside class time each day to update the Tracking Reports, but students may appreciate the opportunity to record and discuss their daily data with their families as well.
Procedure for Day Two: Natural and Artificial Foods or, Where Do You Get All That Energy?
1. Tracking Reports: Help your students bring their Tracking Reports up to date by recording foods and habitats for day two.
2. Discussion: Today's slideshow and Day Three's first slideshow cover the main themes of the week. Today's slideshow discusses what food is, beyond being just things from the grocery store which taste good. This is the basic ecological concept of energy flow from the sun through plants to animals. The slideshow then discusses how people made food artificial via the Agricultural Revolution, and how
that changed more than just our diet. This slideshow also shows a line graph (with an option to view more than one), to start students thinking about charts.
3. Your Food's Origins: Point out to students the "H G HP" on their Food Data sheets. Can they guess what that stands for? Have them complete the words, "Hunting - Gathering - Herding - Planting," on their Tracking Reports (on all pages). Then take an example of a food someone ate, discuss its main species, and ask whether we got that food from hunting, gathering, herding, or planting. Have each student who ate that food check the appropriate "HGHP" box(es) on his or her Tracking Report. Take more examples, again discussing where each food came from. A few species should make up the majority of their diets. Have them check one only box for each line.
4. Readings and video: Did the students notice how much of their diet came from agriculture (i.e. herding and planting)? Did any of their food come from hunting and gathering? Do they have any experience with hunting and gathering? On the other hand, do they have experience with gardening, or with raising crops on a farm? (Keep in mind that almost all modern planters have stopped breeding their plants. They buy seeds from corporations which do the breeding.)
To give students an idea of how humans lived for most of time, we have one video and two short passages on hunting and gathering. Both written passages were written by Sioux Indians who were alive in the late 1800s. You may have them read one or both in class, or as homework.
• Luther Standing Bear, My People, The Sioux (Boston: Houghton Mifflin, 1928), pp. 60-66, the end of chapter 5, "My First Buffalo," starting at "Did you ever stop to think . . ." Copyright prevents us from reproducing this text here, but this is a wonderful and informative reading. This book has been reprinted and is easily available from many libraries, in print or as electronic text from services such as Net Library.
• Charles Eastman, My Indian Boyhood (Charlottesville, Va.: University of Virginia Library, 1996), pp. 233-240. This public-domain document is available here as a Word document.
Standing Bear's text has a better plot and easier words. Notice that both authors are "apologists" for American Indian culture, stressing its order and morality, and writing decades after these childhood events. Also notice that Eastman's gathering was just before the Sioux were forced into an agricultural lifestyle on

reservations, while Standing Bear's hunting was actually after they were on the reservation, but still desiring wild buffalo.
The only danger in these readings-- designed to familiarize them with hunting and gathering-- is that students may conclude that pre-contact Native Americans did not practice agriculture. This is completely untrue, disproved by facts that students probably know-- that Europeans gained many domesticated, agricultural foods (like corn/maize, tomatoes, potatoes, peanuts, and cocoa) from natives of North and South America. The point here, however, is that hunting and gathering still provided a large part of their diet.
Sample questions on the Eastman passage on gathering:
1. What do you notice about Eastman's writing style? Was it different from what you usually read? How?
Eastman and Standing Bear both used very proper and learned language of the time. This included the writing style of the time, which we often find stuffy and difficult. This may be a good time to encourage simplicity and brevity in your students' own writing.
2. Write down the title, publisher, and date of the dictionary you are using to help you read this. Then list five words you had to look up in this dictionary. Then for each word, write a good definition in your own words.
Children often have a notion of "the" dictionary, as a single, official, and unchanging rulebook assigning meanings to words. This is a good time to talk about what dictionaries are best for them, and the value of gaining vocabulary.
3. Describe in your own words how the rice was harvested by the Native Americans.
4. Have you eaten any of the foods Eastman described? What similar foods have you eaten?
5. Did you see any mention of hunting in this story?
Sample questions on the Standing Bear passage on hunting:

1. Does this story give you hints that the Sioux used tools that did not just come from hunting and gathering?
The most important technology here is the horses, which were herded and bred by Europeans, and then herded and bred by American Indians. Students may have also noticed industrial products: guns and steel-pointed arrows, the very crux of the buffalo hunt. The beginning of the story also deals with herded cattle, and presumably planted rations, starting to replace the hunter-gatherer diet.
2. What are some signs that buffalo hunting was an organized activity?
3. Why was this the last buffalo Luther Standing Bear ever killed?
Again, remind students that this was a people in forced transition from mostly hunting as away of living, to agriculture and industry.
In addition to the above readings, you may wish to display a 17-minute movie to your students. It is a fascinating oral account of a buffalo hunt that occurred in the late 1800s by the grandfather of Mr. Leonard Little Finger, a member of the Lakota Sioux tribe. This movie is an excellent way to complement the above readings, or, if you are not able to locate a copy of the Standing Bear passage, it will serve well to describe a buffalo hunt. The sample questions listed above (pertaining to the Standing Bear passage) also apply nicely to the story told by Mr. Little Finger. Note that throughout the story, buffalo (bison) are referred in the Lakota language as “Tatanka”. You will need speakers, and Quicktime viewer software. (Note: you may also wish to play the "Meet Leonard Little Finger" movie prior to showing the buffalo hunt movie.) View this movie together as a class.
Procedure for Day Three: Natural and Artificial Habitats or, Pigs in Straw Houses Should Not Throw Bricks
1. Discuss habitat: The first slideshow for today introduces the concept of habitat, and introduces bobwhite quail as a comparison species. Bobwhite quail need at least three different habitats to thrive, for three different purposes. Modern humans also need various habitats. Finally, the slideshow presents plant-clearing as a key to civilization, for smooth roads, productive agriculture, and stable buildings.

2. Update Tracking Reports: Update Food and Habitat data. Ask the students if their own habitats are artificial or natural-- they will all be fairly or heavily artificial. Unlike the food columns for "H G H P," there are no columns here for artificial vs. natural, because it is always a gradual mix. This develops the concept of natural/artificial habitat, and it leads to the second slideshow activity.
3. Rate habitats: To engage students in the "Habitat from Space" exercise, you may want to use a large number line from 1 (natural) to 10 (artificial) on the board or marked on the floor, or have students hold up signs with scores, like Olympic judges. Have them justify their ratings by sharing clues from the images. Make it clear that these ratings are not definite, right-and-wrong answers, nor "just opinions," but rather reasonable judgments.
Procedure for Day Four: Food Statistics or, I Can't Believe I Ate the Whole Thing
1. Complete Tracking Report data: Complete "Food Data" and "Habitat Data" through the end of "Day Three" (at midnight). Stopping there, so that you have a whole number of days, will make the daily averages simpler.
2. Discuss Food Groups: Explain that for the rest of the time students will be working through this set of lesson activities, they will be analyzing and presenting the data they have already collected on their eating and living habits. Collecting data is only part of the job! The sequence often goes: data, classification, calculation, charting. One basic process in creating information out of raw data is classification. The students have done this already, first classifying foods by main species, then classifying the species into even broader classes (categories) by source: hunting, gathering, herding, and planting.
A "food group" classification is common, medium-detail (between source and Main Species), and focused on nutrition, a critical issue for American children. You can find a great deal of information on food groups over the Internet, searching for keywords like "food group" and "pyramid". This classification is clearly aimed at raising children's nutrients while lowering their total calories (yet another byproduct of the Agricultural Revolution). The first task is simply to have students fill in the words Junk Milk Meat Veg Fruit and Grain where the "Food Data" sheets say J M M VF G. Then have students check one box for each food.

As in Day Two, you might start by taking examples until students can continue on their own. This classification goes by Food, not by Main Species. Discuss the example of a can of soda; the main ingredient may be corn (as sweetener), but the food group is not vegetables, but junk.
3. Tally foods: Tallies are rough bar charts. Demonstrate on the chalkboard how tallies work. Show them the example on the "Food Tallies" sheet and emphasize that the slash represents the fifth item counted, not the sixth. Keeping the tallies neat and rather small works best. Let students start by counting how many junk food items they ate, then making a tally for that number, and writing down the number in the space provided. Then move on to the rest of the food groups, then to production method and species.
4. Make pie charts: From this point on, the activities are math-intensive. Before starting, you should consider how well your students can calculate percentages, and calculate averages such as servings per day. You should also look at page 9 of the Tracking Report ("Habitat Map"), and consider whether you want to calculate and chart the animals' average daily ranges, which involves radii and areas of circles. You could do page 9 with just step 1, or eliminate that page altogether.
You may also want to have students do the Pie Chart Activity, as a "warm-up" before charting their food and habitat data.
To make pie charts following the Tracking Report's directions, students must calculate percentages from their Food Group and Production Method tallies. (This is outlined starting on page 3 of the Tracking Report.) Students should round these off to the nearest percent. The dotted-line pie charts are for students to trace over and color in. Demonstrate how a student would size contiguous pie-slices for, say, 28% and then 13% more. Pie charts are even more helpful if the percentages are written next to their pie-slices. You may warn students that because of rounding off they may not come exactly to 100%-- or you can let them discover this on their own.
This is a fun time for students to start comparing their diets with each other. Who had the lowest percentage of junk? Who ate the most fruits and vegetables combined?
5. Make Pyramids: Beginning on Page 5, students will compare their own eating with general USDA guidelines. The difference here is that for each food group,

students will calculate servings-per-day instead of percent-of-diet. If students are already familiar with averages, you may compute the class averages now, and then encourage students to compare their own data to the class average. (For a conceptual introduction to finding averages, please see the lesson entitled Finding the Balance.) The dotted lines again provide a framework; because the USDA advises a range for every group (except "fats, oils and sweets," which we interpreted here as 2 servings), each dotted box has two outer limits. Students should put their filled-in bars in the center, not on the far left or right. The students' colored bars may of course extend outside the dotted lines of the guidelines.
8. Look at Charts: This may be a good time to have the students look at their charts (and perhaps those of others), and talk about what charting accomplishes. If they look at the Food Datasheet of a friend, can they draw conclusions about that friend’s overall diet? If they look at someone's Tallies, Piecharts, or Pyramids, is it easier to draw conclusions? How about comparing one chart to another? The Pyramid, for example, tells about the absolute size of someone's diet, whereas the Piechart only tells about the relative portions. On the other hand, if you had to know some detail-- how many vegetables someone ate on Day 2-- where should you look?
Procedure for Day 5: Habitat Statistics or, Feets Don't Fail Me Now!
1. Classify Habitats and Activities: To finish the Habitat Data sheet, excess detail should be simplified. Places are not as discrete as foods, so the places column may need a few entries crossed out and replaced with simpler labels. This will have to be done by the teacher's judgment as the week goes on, but this is the last chance to clean things up before charting. Activities also fray into detail, so a separate column for classifying is provided. You may choose to do both by listing on the board, preferably early in the week, all places (home, cafeteria, stores, etc.) and activities (learning, transportation, playing, etc.), and have the students use only those terms that are on the board. Finally, check that students rounded all time measurements to the nearest half hour.
2. Tally habitats: The half-hours make this slightly different from the "Food Tallies" sheet. Students could total a Place or Activity arithmetically and then plot

the total, but it is easier to "count" the hours geometrically, by adding a bar for each time amount.
3. Piechart habitats: This is the same as the Food Piecharts. Again, percents must be calculated for each Place and Activity.
4. Map habitats: For each student's individual map, download a free map of your area from a web site like Mapquest, Topozone, or Expedia. A black-and-white (or grayscale) map may print more clearly than a color map. Be sure to include the scale bar. Copy and paste the map image to the Habitat Map spreadsheet. (Or save the map to disk and in Excel select Insert > Picture > From File...)
After the students draw the stars, lines and dots on their maps, the easiest way to measure the farthest they traveled each day is with a paper ruler that you or they draw from the scale bar. Measure "as the crow flies," not along the route traveled. Have each student put his or her range on the board, and calculate a class average. If you have a wall map of your city or area, you can then have each the students put pins, stickers, or dots on it to graphically show the places they went, and let them compare with each other. This might be a natural time for a discussion: How far do you walk from home? Drive? What's the farthest you've ever been from home? What animals are you like in terms of home range? Other animals' ranges also vary widely by habitat, population, etc.; here are a few rough statistics:
Mountain lion, male: 100 sq mi Mountain lion, female: 20-60 sq mi Skunk: 0.5 to 1.5 sq mi Grey squirrel: 0.004 sq mi (1 hectare)
5. Written summary: You may have students write a 1-2 page summary of their findings. This may take several directions, and may refer to or include some of the charts the students made. The Summary sheet attached here promotes writing from an outline, and even suggests an outline for you and your students, but you may rewrite the outline, have students write their own, or simply assign a particular theme such as artificiality or nutrition. You might choose to display or discuss summaries which come to different conclusions.

III. Assessment
To assess the students’ work, you may wish to repeat the questions for each day and have students answer them orally or in written form. Furthermore, you might have students write their own story of where their food comes from (modeled after the Eastman story, for example). Finally, you may provide students with a list of the vocabulary words provided at the top of this lesson plan for them to define on their own, using key phrases and concepts from this lesson.
Lesson Extensions for Authentic Assessment
1. You may incorporate computers into several steps of this lesson. Students can use a search engine such as Google Image Search to find their own satellite images to assess. Students can make charts of all kinds using a program such as Microsoft Excel. They could even enter the data in spreadsheets, and do charts and calculations comparing their own data with those of their peers.
2. Students may be interested to explore a spreadsheet that allows them to model population growth. After manipulating the Animal Population Modeling spreadsheet, students may be asked to write a response to a question such as:
• What is likely to happen to food production as the world's human population rapidly increases?
• How might human population growth affect habitat for humans and other animals?
Acknowledgements
Thanks to Dr. Kerri Vierling of the University of Idaho for her advice and assistance.
Our thanks also to the agencies and organizations that supplied the public-domain images used in the slideshows.

Earth Systems Connections: Animal Tracking: Science Assessment and Standards Correlation
Assessment Activity ESC Performance Criteria National Science Standards Formative Food Data Activity Sheet Habitat Data Activity Sheet Readings/Questions on Hunting and Gathering Summative Animal Tracking Questions Authentic Lesson Extensions: Web Search
Science Connections Students recognize that artificial foods and habitats are different from natural ones. Students will consider "artificial" and "natural" as a graded scale, not as separate categories. Students recognize that food and mobility distinguish animals from plants. Students describe how animals' energy comes from food, which comes from photosynthesis. Students recognize how one animal may use several habitats, so edge habitats are often best.
Science as Inquiry Ask a question about objects, organisms, and events in the environment. Use data to construct a reasonable explanation. Life Science Organisms have basic needs. For example, animals need air, water, and food: plants require air, water, nutrients, and light. Organisms can survive only in environments in which their needs can be met. The world has many different environments, and distinct environments support the life of different types of organisms. An organism's patterns of behavior are related to the nature of that organism's environment, including the kinds and numbers of other organisms present, the availability of food and resources, and the physical characteristics of the environment. Humans depend on their natural and constructed environments. Humans change environments in ways that can be either beneficial or detrimental for themselves and other organisms

Earth Systems Connections: Animal Tracking: Science Assessment and Standards Correlation
Assessment Activity ESC Performance Criteria National Science Standards Formative Food Data Activity Sheet Habitat Data Activity Sheet Readings/Questions on Hunting and Gathering Summative Animal Tracking Questions Authentic Lesson Extensions: Web Search
Human Connections Students investigate how hunting and gathering peoples developed agriculture (planting and herding), which led to civilizations. Students investigate how humans build artificial habitats including farms, roads, and cities. Technology Connections Students may optionally use a spreadsheet program to make calculations and charts.
Science and Technology Tools help scientists make better observations, measurements, and equipment for investigations. They help scientists see, measure, and do things that they could not otherwise see, measure, and do. Some objects occur in nature; others have been designed and made by people to solve human problems and enhance the quality of life. Personal and Social Perspectives Resources are things that we get from the living and nonliving environment to meet the needs and wants of a population. Changes in environments can be natural or influenced by humans. Some changes are good, some are bad, and some are neither good nor bad. Some resources are basic materials, such as air, water, and soil; some are produced from basic resources, such as food, fuel, and building materials; and some resources are non-material, such as quiet places, beauty, security, and safety. History and Nature of Science. Science and technology have been practiced by people for a long time.

Earth Systems Connections: Animal Tracking: Mathematics Assessment and Standards Correlation Assessment Activity ESC Performance Criteria National Mathematics Standards
Formative Food Data Activity Sheet Habitat Data Activity Sheet How to Make a Pie Graph Activity Pyramid Activity Habitat Statistics Activity Summative Animal Tracking Questions
Math Connections Students calculate percent fractions, and daily and group averages. Students will make tallies, bar charts, and pie charts. Students will calculate the area of circles from a radius.
Number & Operations. Select appropriate methods and tools for computing with whole numbers from among mental computation, estimation, calculators, and paper and pencil according to the context and nature of the computation and use the selected method or tools. Algebra Represent and analyze patterns and functions, using words, tables, and graphs; model problem situations with objects and use representations such as graphs, tables, and equations to draw conclusions; investigate how a change in one variable relates to a change in a second variable, and identify and describe situations with constant or varying rates of change and compare them. Geometry Recognize geometric shapes and structures in the environment and specify their location. Measurement Recognize the attributes of length, volume, weight, area, and time; compare and order objects according to these attributes. Data Analysis and Probability Pose questions and gather date about themselves and their surroundings; sort and classify objects according to their attributes and organize data about the objects; represent data using concrete objects, pictures, and graphs. Problem Solving Build new mathematical knowledge through problem solving; solve problems that arise in mathematics and in other contexts; apply and adapt a variety of appropriate strategies to solve problems; monitor and reflect on the process of mathematical problem solving. Connections. Recognize and apply mathematics in contexts outside of mathematics. Representations. Create and use representations to organize, record, and communicate mathematical ideas; select, apply, and translate among mathematical representations to solve problems; use representations to model and interpret physical, social, and mathematical phenomena.