anisimov/sengers research group - 2012. how pure water can unmix mikhail anisimov institute for...
TRANSCRIPT
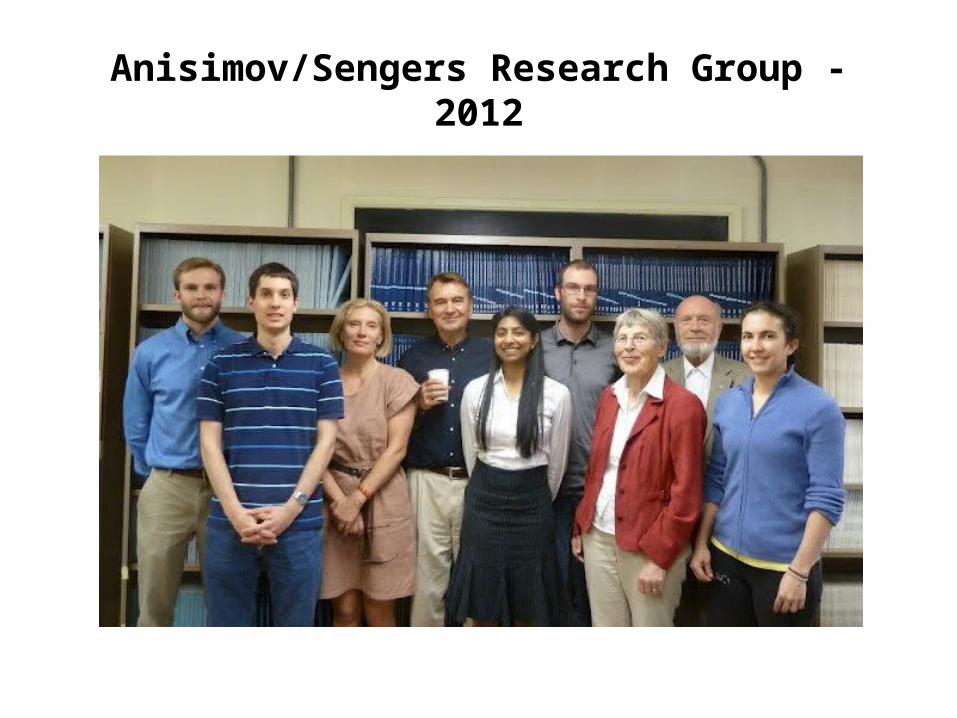
Anisimov/Sengers Research Group - 2012
HOW PURE WATER CAN UNMIXMikhail Anisimov
Institute for Physical Science &Technology and Department of Chemical & Biomolecular Engineering, University of Maryland, College Park
108th StatMech , Rutgers University December 16, 2012
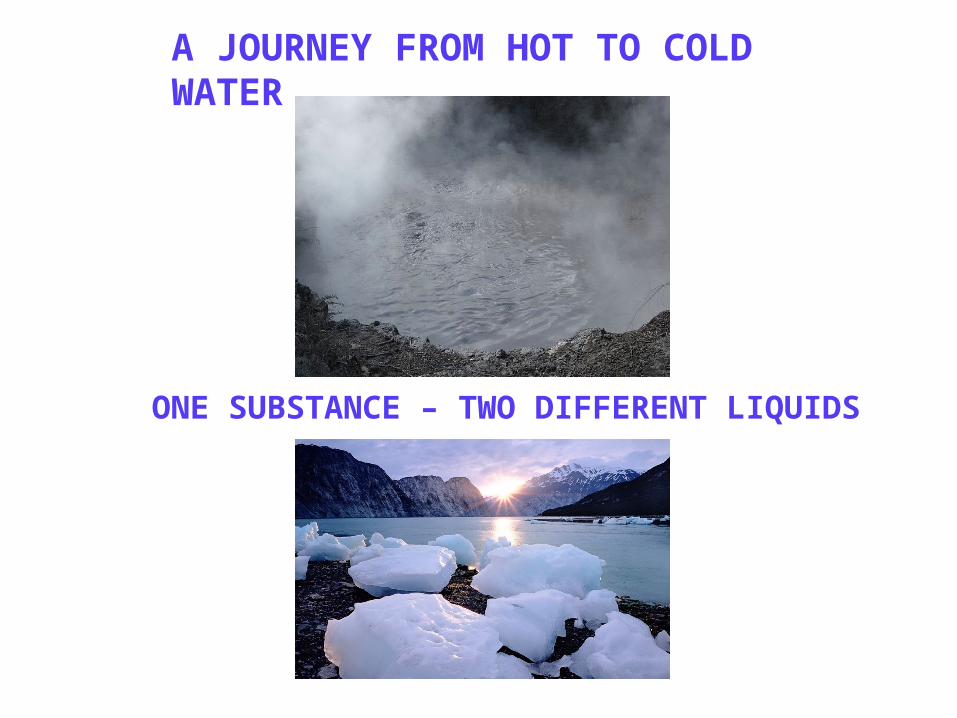
ONE SUBSTANCE – TWO DIFFERENT LIQUIDS
A JOURNEY FROM HOT TO COLD WATER
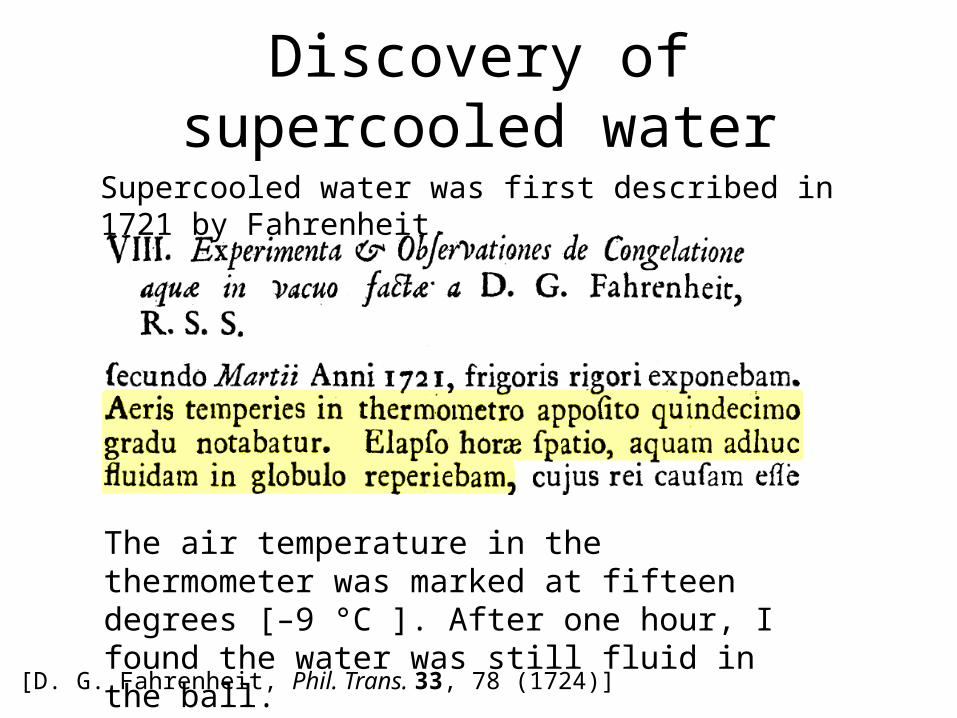
Discovery of supercooled water
The air temperature in the thermometer was marked at fifteen degrees [–9 °C ]. After one hour, I found the water was still fluid in the ball.
Supercooled water was first described in 1721 by Fahrenheit.
[D. G. Fahrenheit, Phil. Trans. 33, 78 (1724)]
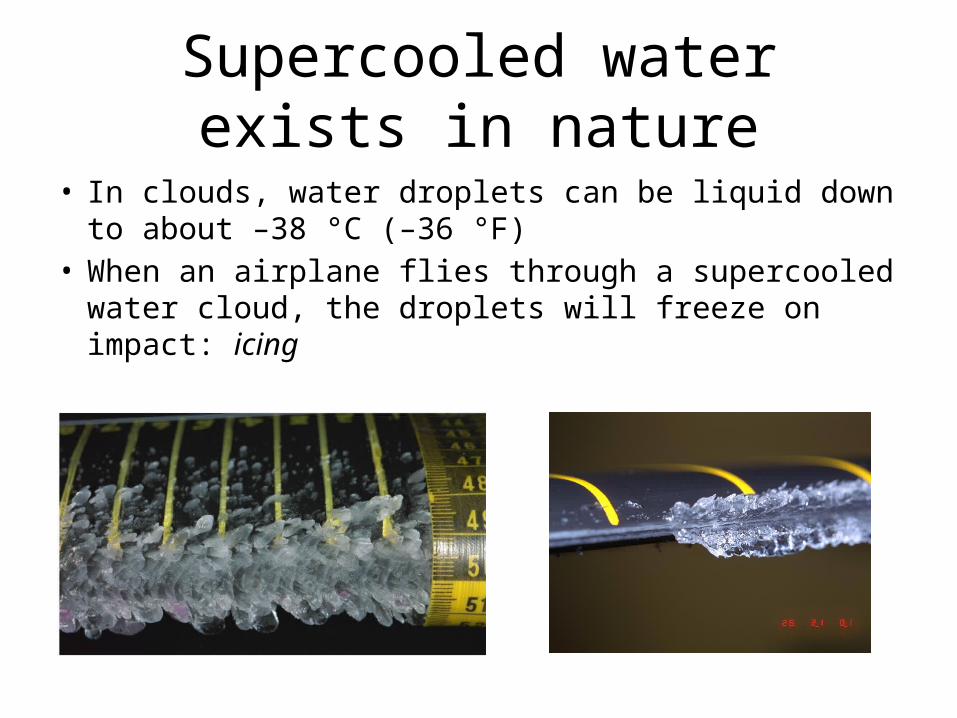
Supercooled water exists in nature
• In clouds, water droplets can be liquid down to about –38 °C (–36 °F)
• When an airplane flies through a supercooled water cloud, the droplets will freeze on impact: icing
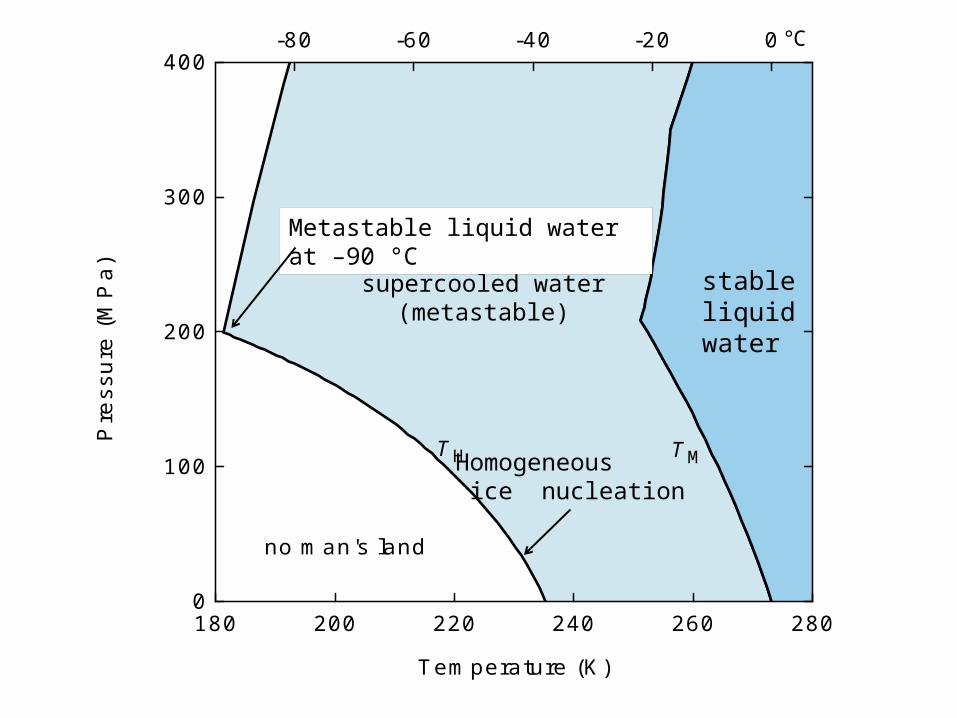
180 200 220 240 260 2800
100
200
300
400
TH
Pre
ssur
e (M
Pa)
Temperature (K)
no man's land
TM
-80 -60 -40 -20 0°C
stableliquidwater
supercooled water(metastable)
Metastable liquid water at –90 °C
Homogeneous ice nucleation
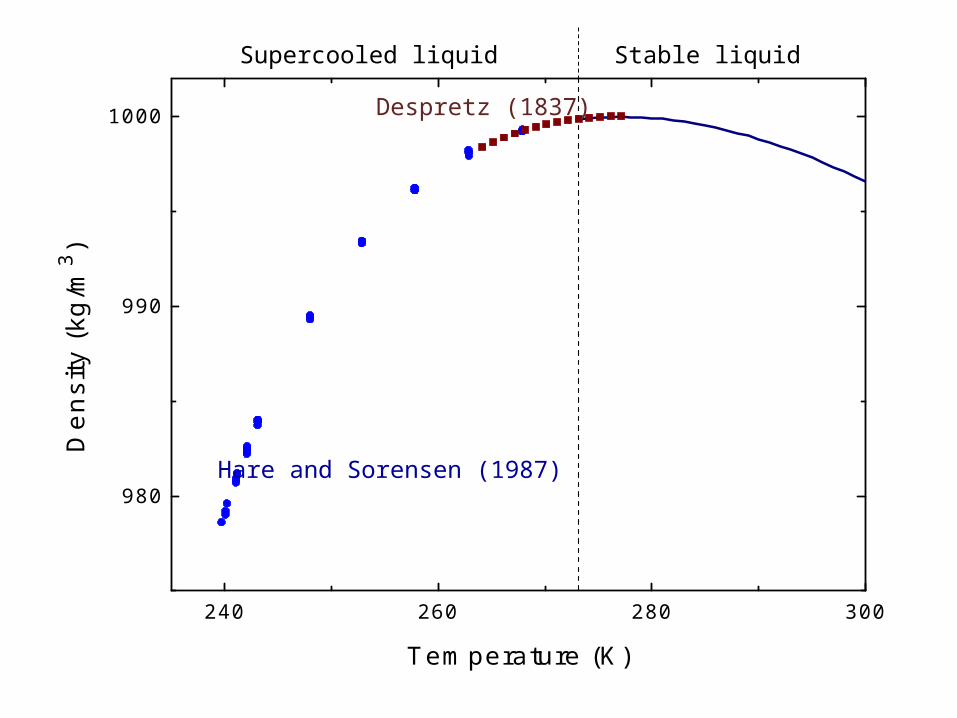
240 260 280 300
980
990
1000
D
en
sity
(kg
/m3 )
Temperature (K)
Despretz (1837)
Hare and Sorensen (1987)
Stable liquidSupercooled liquid
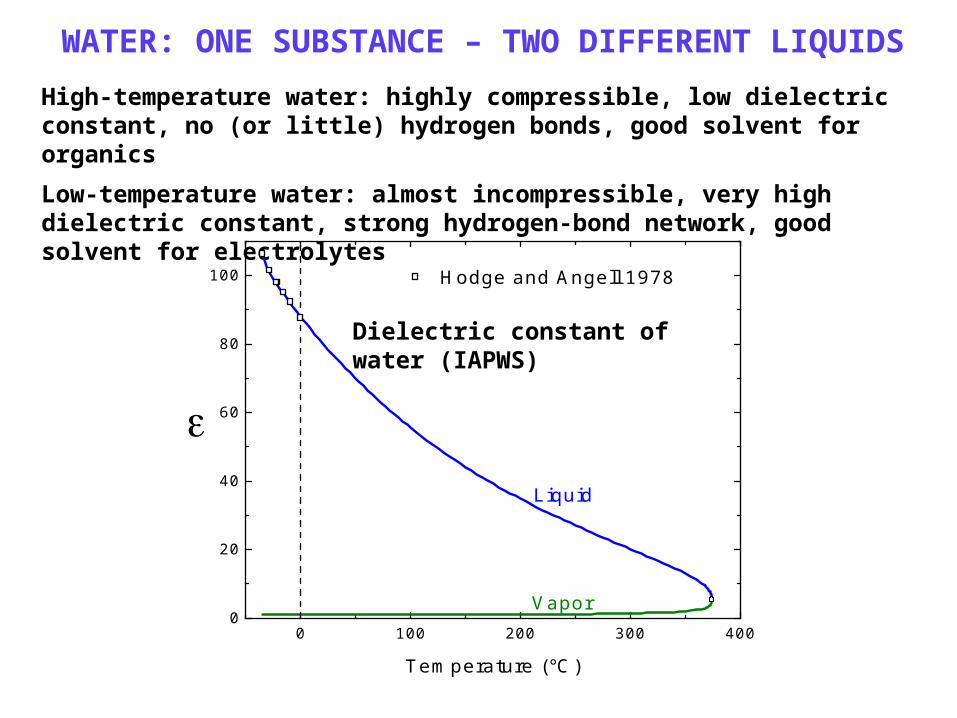
WATER: ONE SUBSTANCE – TWO DIFFERENT LIQUIDS
High-temperature water: highly compressible, low dielectric constant, no (or little) hydrogen bonds, good solvent for organics
Low-temperature water: almost incompressible, very high dielectric constant, strong hydrogen-bond network, good solvent for electrolytes
Dielectric constant of water (IAPWS)
0 100 200 300 4000
20
40
60
80
100 Hodge and Angell 1978
Temperature (°C)
Liquid
Vapor
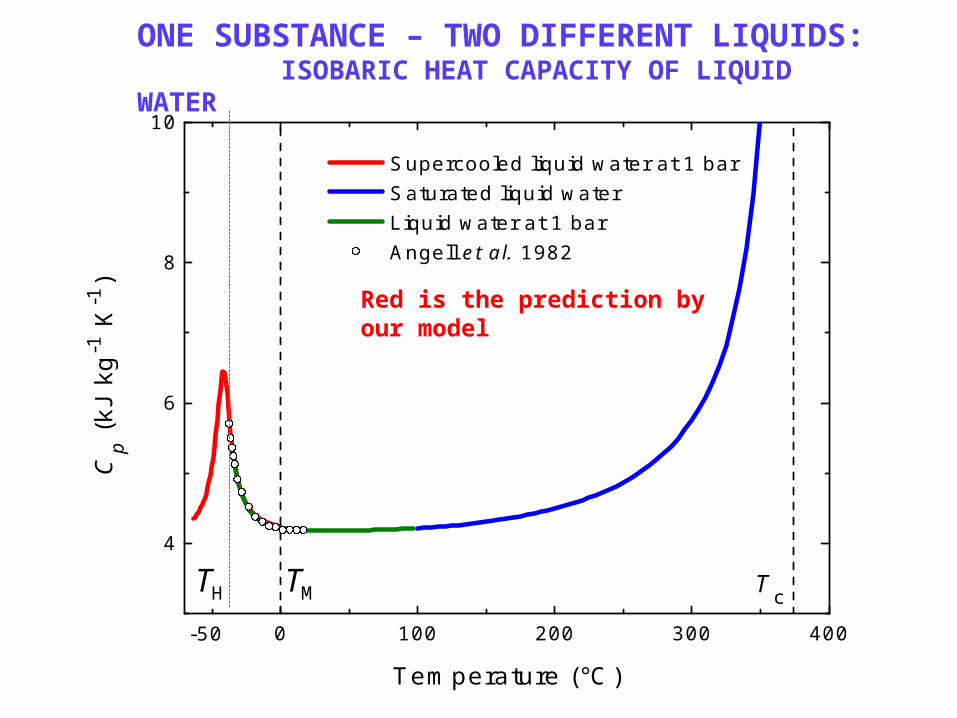
ONE SUBSTANCE – TWO DIFFERENT LIQUIDS: ISOBARIC HEAT CAPACITY OF LIQUID WATER
0 100 200 300 400
4
6
8
10
Supercooled liquid water at 1 bar Saturated liquid water Liquid water at 1 bar Angell et al. 1982
Cp
(kJ
kg-1
K-1
)
Temperature (°C)
-50
Tc
Red is the prediction by our model
TH TM
240 260 280 300 320 340 3604.0
4.5
5.0
5.5
6.0
He
at c
ap
aci
ty C
P (
kJ k
g-1
K-1
)
Temperature (K)
Stable liquidSupercooled liquid
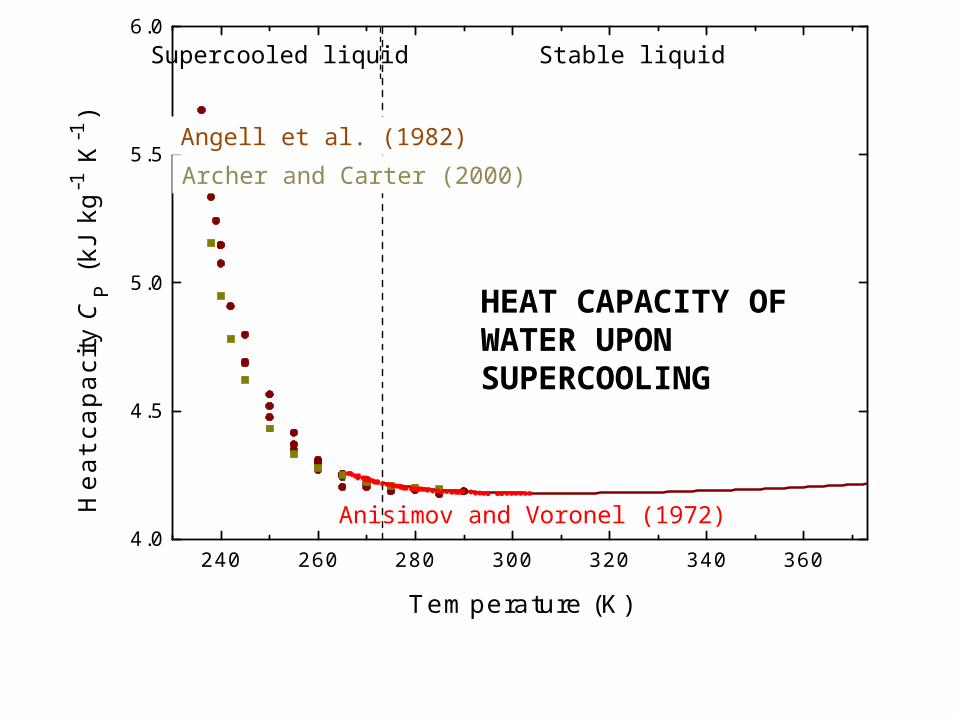
Anisimov and Voronel (1972)
Angell et al. (1982)
Archer and Carter (2000)
HEAT CAPACITY OF WATER UPON SUPERCOOLING
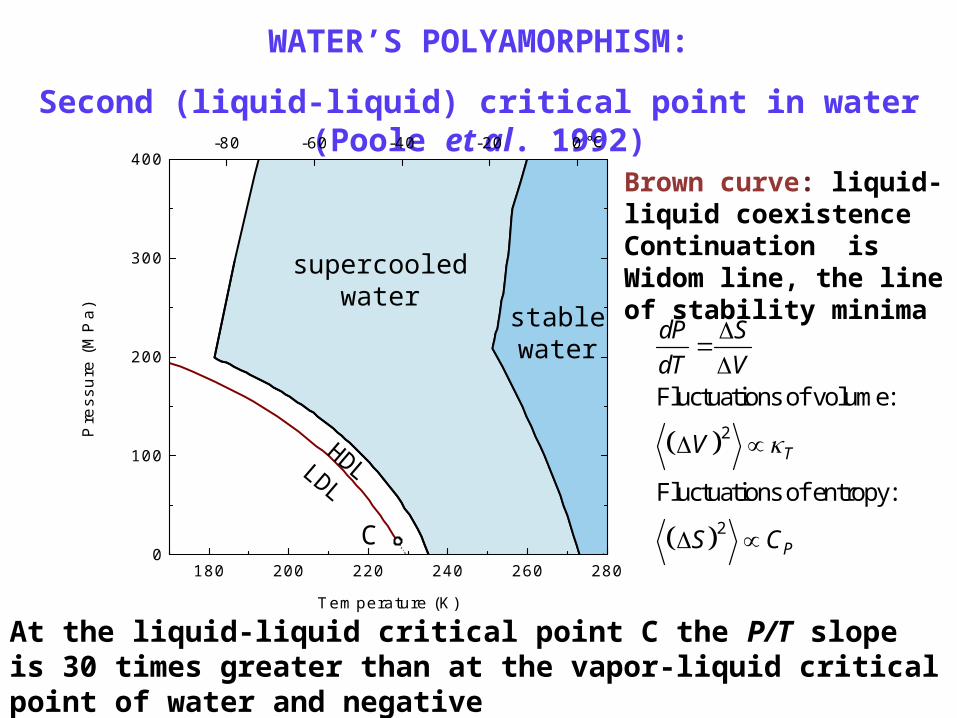
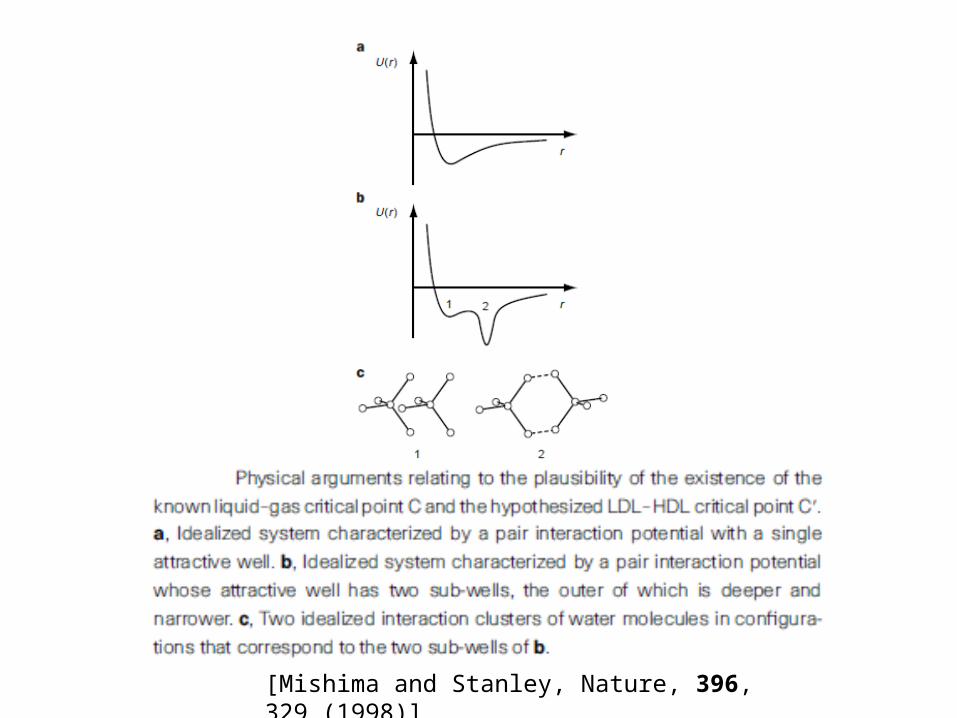
WATER’S POLYAMORPHISM:
Second (liquid-liquid) critical point in water (Poole et al. 1992)
2
2
Fluctuations of volume:
Fluctuations of entropy:
T
P
dP S
dT V
V
S C
At the liquid-liquid critical point C the P/T slope is 30 times greater than at the vapor-liquid critical point of water and negativeC the location of LLCP as recently suggested by Holten and Anisimov, 2012
Brown curve: liquid-liquid coexistenceContinuation is Widom line, the line of stability minima
180 200 220 240 260 2800
100
200
300
400
Pre
ssur
e (M
Pa)
Temperature (K)
-80 -60 -40 -20 0°C
supercooledwater
stablewater
LDL
HDL
C
180 200 220 240 260 2800
100
200
300
400
TH
Pre
ssur
e (M
Pa)
Temperature (K)
TM
-80 -60 -40 -20 0°C
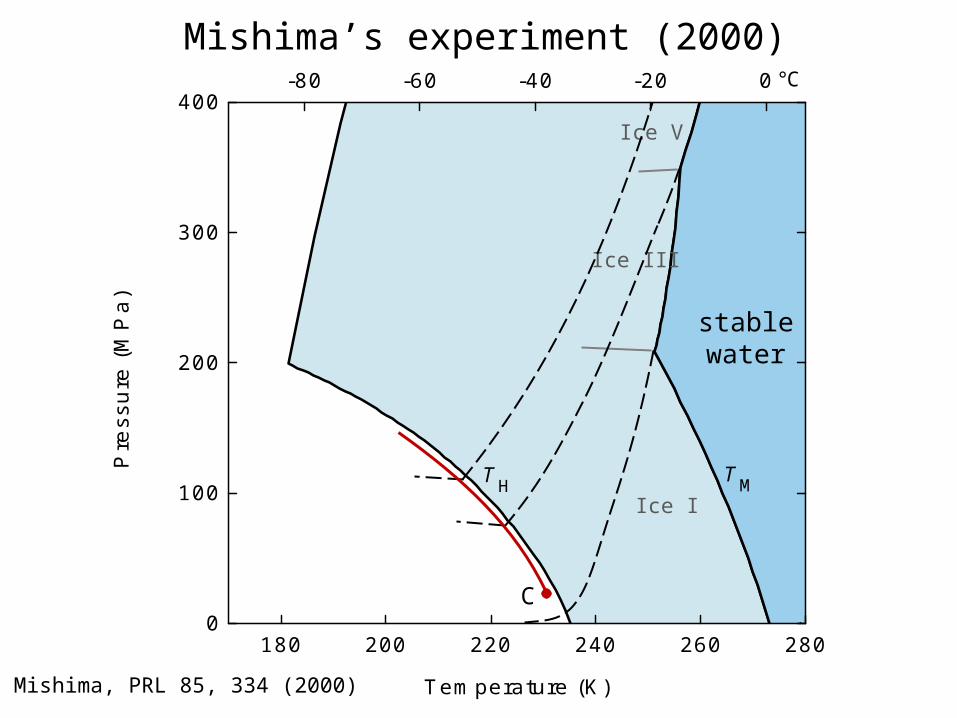
Mishima’s experiment (2000)
stablewater
Ice III
Ice V
Ice I
C
O. Mishima, PRL 85, 334 (2000)
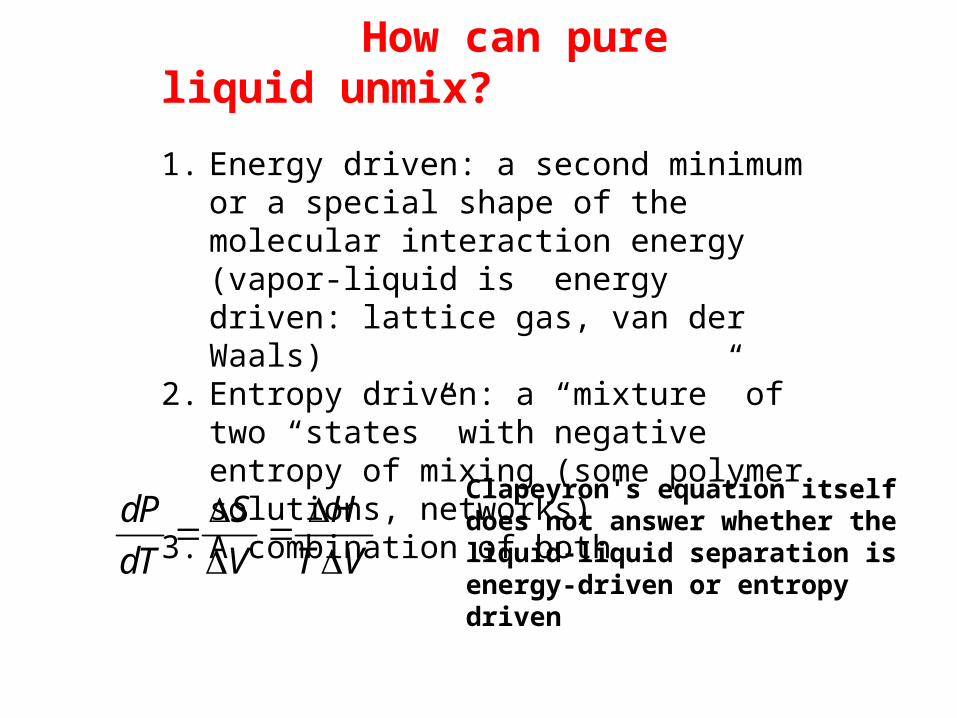
How can pure liquid unmix?
1. Energy driven: a second minimum or a special shape of the molecular interaction energy (vapor-liquid is energy driven: lattice gas, van der Waals)
2. Entropy driven: a “mixture” of two “states” with negative entropy of mixing (some polymer solutions, networks)
3. A combination of both
dP S H
dT V T V
Clapeyron's equation itself does not answer whether the liquid-liquid separation is energy-driven or entropy driven
[Mishima and Stanley, Nature, 396, 329 (1998)]
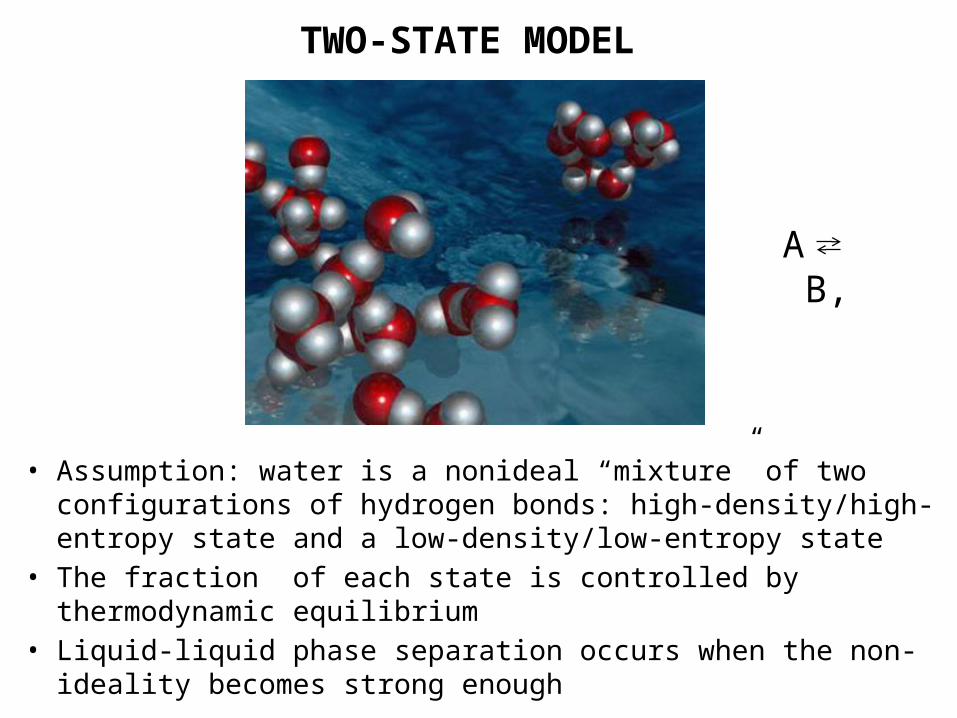
TWO-STATE MODEL
• Assumption: water is a nonideal “mixture” of two configurations of hydrogen bonds: high-density/high-entropy state and a low-density/low-entropy state
• The fraction of each state is controlled by thermodynamic equilibrium• Liquid-liquid phase separation occurs when the non-ideality becomes
strong enough
A B,
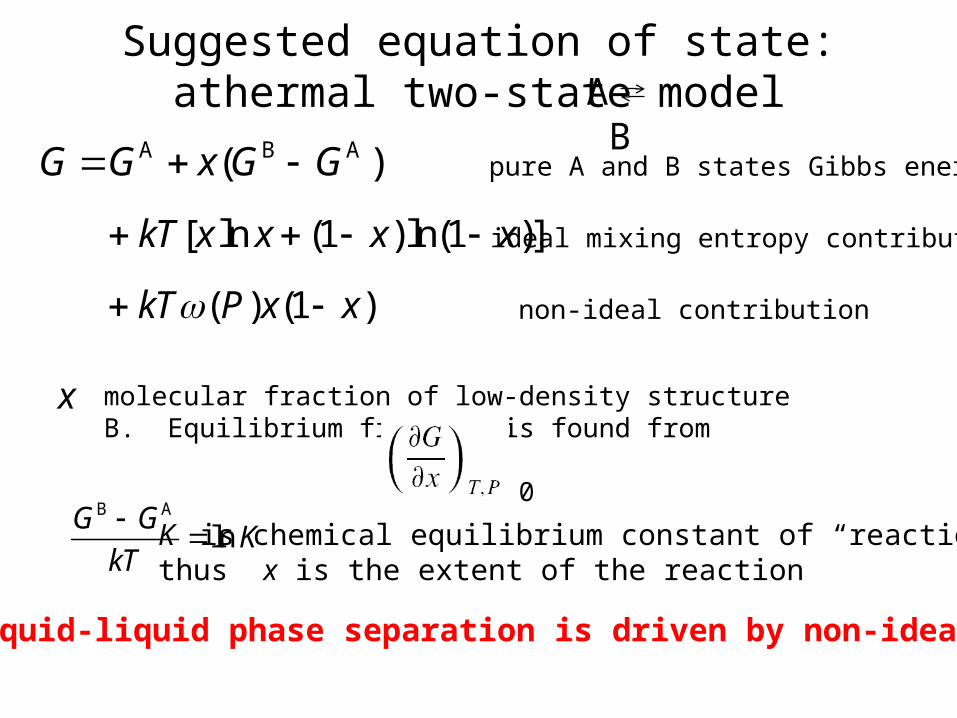
Suggested equation of state: athermal two-state model
A B A( )G G x G G
[ ln (1 )ln(1 )]kT x x x x
( ) (1 )kT P x x
pure A and B states Gibbs energies
ideal mixing entropy contribution
non-ideal contribution
x molecular fraction of low-density structure B. Equilibrium fraction is found from = 0
B A
lnG G
KkT
K is chemical equilibrium constant of “reaction”
thus x is the extent of the reaction
A B
This liquid-liquid phase separation is driven by non-ideal entropy
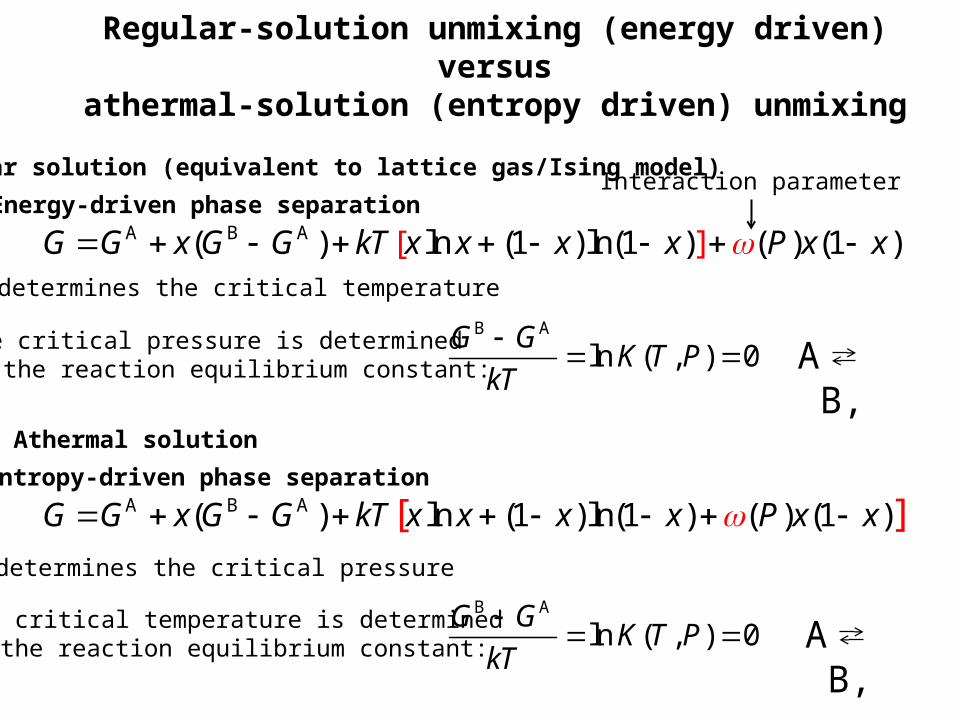
Regular-solution unmixing (energy driven) versusathermal-solution (entropy driven) unmixing
A B A( ) ln (1 )ln(1 ) ( ) (1 )[ ]G G x G G kT x x x x P x x
A B A( ) ln (1 )ln(1 ) ( ) ([ 1 )]G G x G G kT x x x x P x x
Regular solution (equivalent to lattice gas/Ising model)
Athermal solution
ω determines the critical temperature
ω determines the critical pressure
The critical temperature is determined by the reaction equilibrium constant:
B A
ln ( , ) 0G G
K T PkT
Interaction parameter
The critical pressure is determined by the reaction equilibrium constant:
B A
ln ( , ) 0G G
K T PkT
Energy-driven phase separation
Entropy-driven phase separation
A B,
A B,
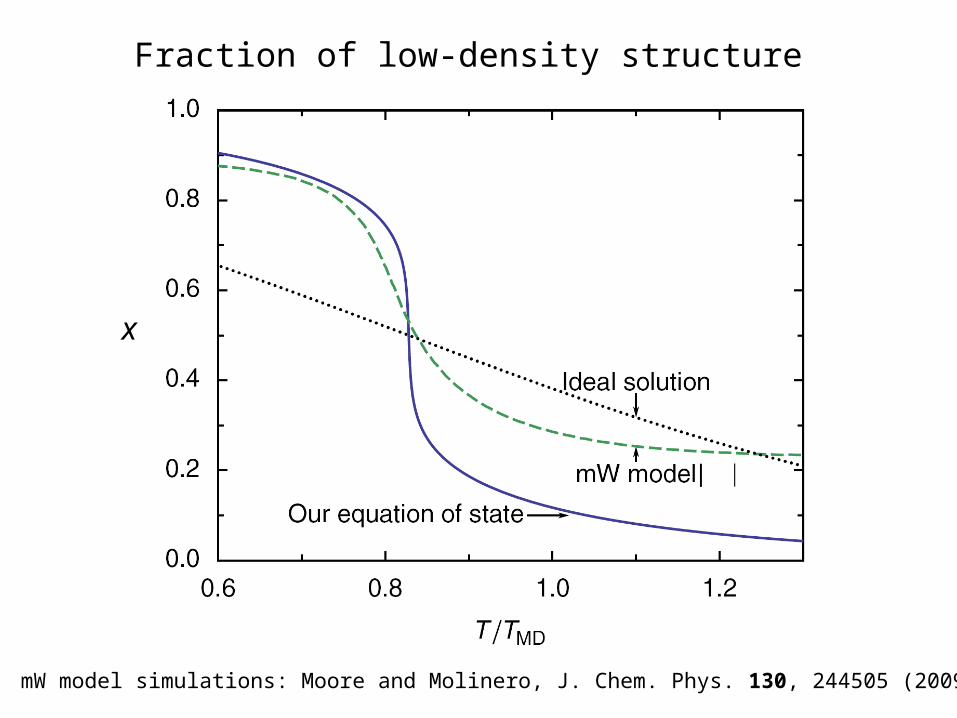
Fraction of low-density structure
mW model simulations: Moore and Molinero, J. Chem. Phys. 130, 244505 (2009).
x
[1]
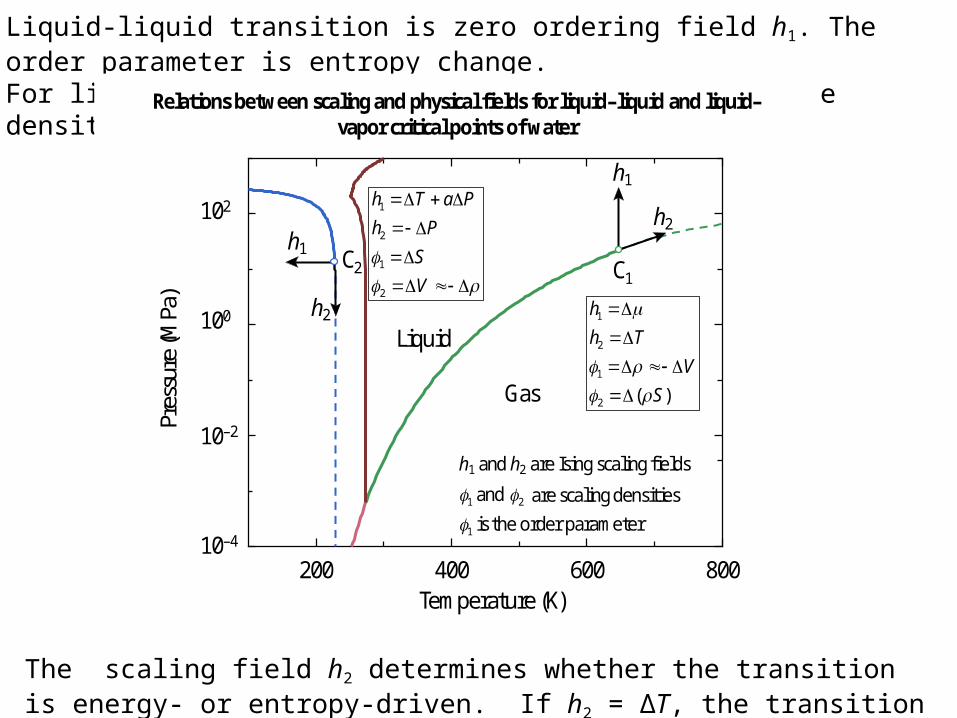
Liquid-liquid transition is zero ordering field h1. The order parameter is entropy change.For liquid-gas transition the order parameter is the density change.
h1= ln K = 0
The scaling field h2 determines whether the transition is energy- or entropy-driven. If h2 = ΔT, the transition is energy driven. If h2 = -ΔP, the transition is entropy driven.
Liquid
Gas
102
100
10–2
10–4
Pres
sure
(MPa
)
200 400 600 800Temperature (K)
C2 C1
h1
h2
Relations between scaling and physical fields for liquid–liquid and liquid–vapor critical points of water
h1
h2 1
2
1
2 ( )
h
h T
V
S
1
2
1
2
h T a P
h P
S
V
h1 and h2 are Ising scaling fields
1 2and are scaling densities
1 is the order parameter
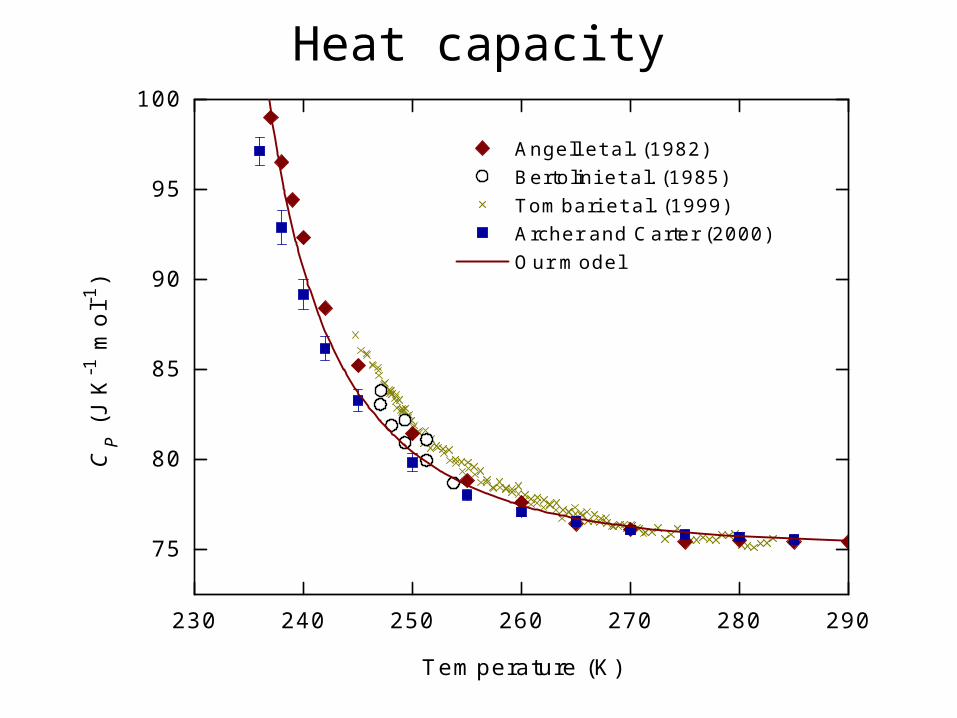
Heat capacity
230 240 250 260 270 280 290
75
80
85
90
95
100
Angell et al. (1982) Bertolini et al. (1985) Tombari et al. (1999) Archer and Carter (2000) Our model
CP (
J K
-1 m
ol-1
)
Temperature (K)
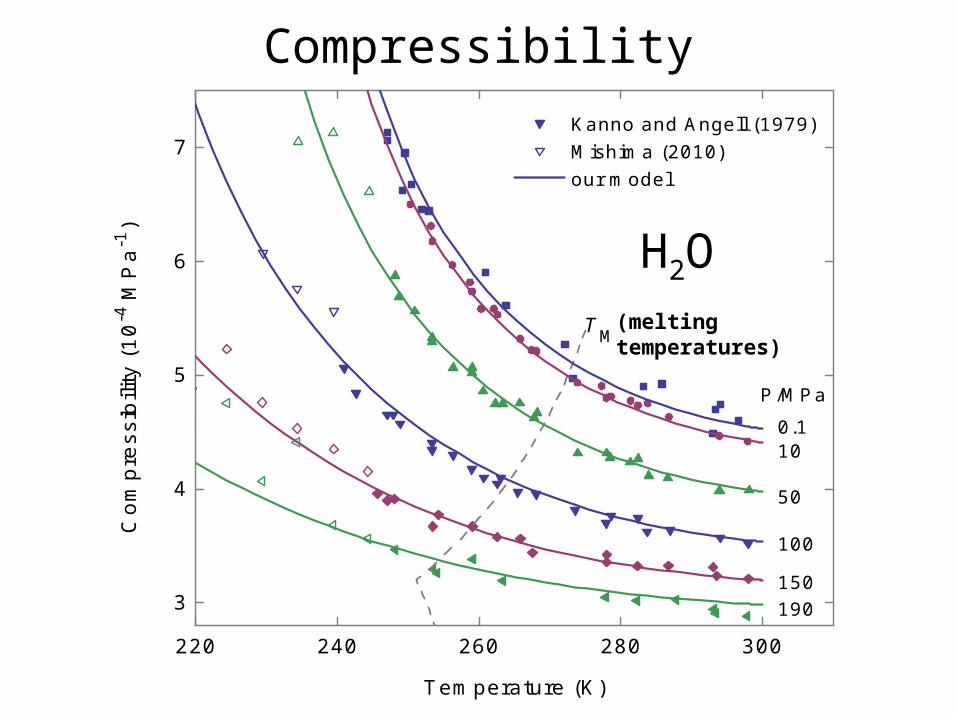
Compressibility
220 240 260 280 300
3
4
5
6
7
190
Kanno and Angell (1979) Mishima (2010) our model
TM
Com
pres
sibi
lity
(10-4
MP
a-1)
Temperature (K)
0.110
50
100
150
P/MPa
H2O(melting temperatures)
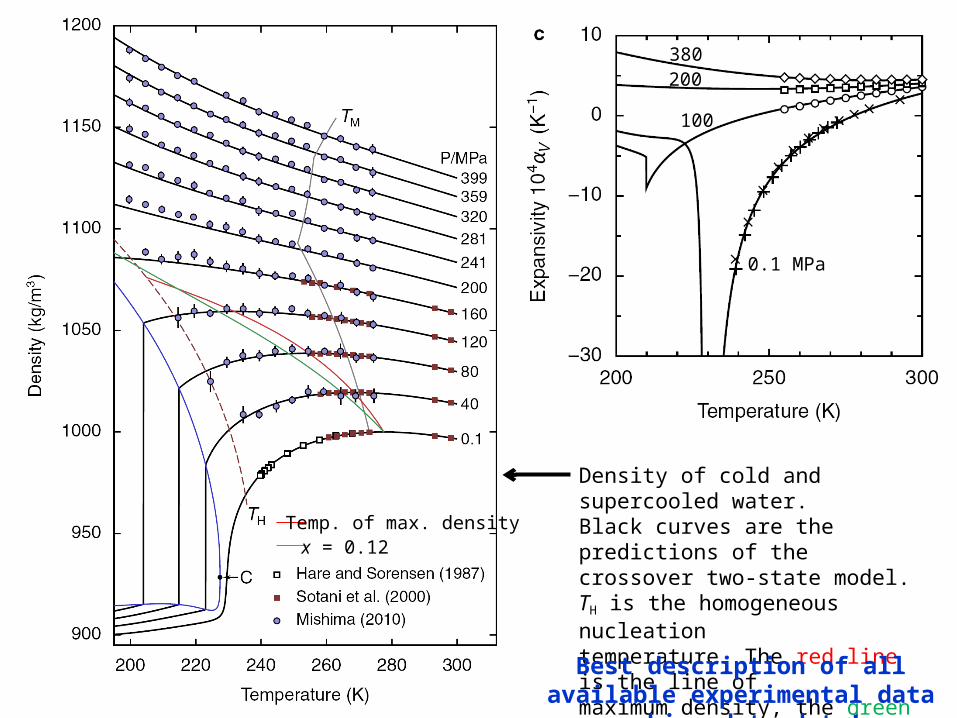
Density
0.1 MPa
100
200380
Temp. of max. densityx = 0.12
Density of cold and supercooled water.Black curves are the predictions of thecrossover two-state model.TH is the homogeneous nucleationtemperature. The red line is the line ofmaximum density, the green line is aconstant LDL fraction of about 0.12.
Best description of all available experimental data achieved to date!
Conclusions• We accurately describe all property data on supercooled water with a
two-state model based on an athermal mixing of two states. This model assumes that the liquid-liquid transition in water is entropy driven.
• Heavy water (D2O) shows similar anomalies and can be described by our model equally well.
• A regular-solution model (purely energy-driven liquid-liquid phase separation) does not work well (the description quality is an order of magnitude worse).
Current Activity• Application to atomistic models of water and to supercooled aqueous
solutions.• Adding a solute to supercooled water may move the critical point into
the experimentally accessible region.