anisotropy and tension–compression asymmetry modeling of
TRANSCRIPT

International Journal of Plasticity 67 (2015) 53–68
Contents lists available at ScienceDirect
International Journal of Plasticity
journal homepage: www.elsevier .com/locate / i jp las
Anisotropy and tension–compression asymmetry modelingof the room temperature plastic response of Ti–6Al–4V
http://dx.doi.org/10.1016/j.ijplas.2014.10.0030749-6419/� 2014 Elsevier Ltd. All rights reserved.
⇑ Corresponding author. Tel.: +32 43669219; fax: +32 43669192.E-mail address: [email protected] (V. Tuninetti).
V. Tuninetti a,⇑, G. Gilles a, O. Milis a, T. Pardoen b, A.M. Habraken a,c
a ARGENCO Department, MS2F Division, University of Liège, Chemin des Chevreuils 1, 4000 Liège, Belgiumb Institute of Mechanics, Materials and Civil Engineering, Université catholique de Louvain, Place Sainte Barbe 2, B-1348 Louvain-la-Neuve, Belgiumc Research Director of the Fonds de la Recherche Scientifique – FNRS, Belgium
a r t i c l e i n f o
Article history:Received 3 March 2014Received in final revised form 22 September2014Available online 18 October 2014
Keywords:A. Yield conditionB. Anisotropic materialB. Constitutive behaviourC. Mechanical testingInverse modeling
a b s t r a c t
The mechanical behavior of the alloy Ti–6Al–4V is characterized using uniaxial tension,uniaxial compression, simple shear and plane strain tests in three orthogonal materialdirections. The experimental results reveal tension/compression asymmetry, anisotropicyielding and anisotropic strain-hardening. These features are incorporated into an elasto-plastic constitutive law based on the macroscopic orthotropic yield criterion ‘‘CPB06’’adapted to hexagonal metals. A new identification method for the yield criterion parame-ters is proposed by inverse modeling of the axial strain field of compression specimens inthe three orthogonal directions of the material. The sensitivity of different sets of materialparameters to the identification method is also analyzed and the capacity of the model toaccurately predict the forces and displacement field is discussed. A validation of the bestset of identified CPB06 material parameters is performed by comparing the load–displace-ment curves in different loading directions for tensile tests on notched round bars with dif-ferent levels of stress triaxiality and for compression tests on elliptical cross-sectionspecimens, both tests involving multiaxial strain fields and large deformations.
� 2014 Elsevier Ltd. All rights reserved.
1. Introduction
In engineering applications, titanium (Ti) and its alloys have replaced other metallic materials owing to superior strengthto density ratio, giving reliable, economic and more sustainable systems and components. The most commonly used and rel-atively economical Ti alloy is the Ti–6Al–4V composition, called hereafter TA6V. This two phase a + b-type alloy is found inmany applications principally in the aerospace industry, such as for fasteners, aircraft structural and engine components,because of its high strength over density ratio in the low to moderate range of operating temperatures. Offshore petroleumindustry have also taken advantages of using TA6V, for instance in applications as drilling risers owing its high flexibility(low ratio of modulus over strength), excellent corrosion and fatigue resistance (Deyuan et al., 2001; Gurrappa, 2003;Lütjering and Williams, 2007). These high mechanical performances combined with a good biocompatibility motivate exten-sive use of the TA6V in the medical industry such as orthopedic and dental implants (Elias et al., 2008; Long and Rack, 2006;Rack and Qazi, 2006). The high strength to weight ratio and its good ballistic capability have attracted the interest of thedefense industry for its use in armor for military vehicles (Burkins et al., 2000, 2001; Montgomery and Wells, 2001;Sukumar et al., 2013).

54 V. Tuninetti et al. / International Journal of Plasticity 67 (2015) 53–68
The wide range of applications of the TA6V has set the motivation to develop and enhance the state of modeling of itsmechanical behavior involving the plastic response. The primary phase noted a of the alloy TA6V is a hexagonal closedpacked (hcp) structure. As for other hcp alloys, the flow stress is strongly dependent on both temperature and strain rate(Khan et al., 2004, 2007; Lee and Lin, 1998; Majorell et al., 2002; Peirs et al., 2010; Tuninetti et al., 2012b; Tuninetti andHabraken, 2014; Porntadawit et al., 2014). In addition, TA6V exhibits a strength asymmetry between tension and compres-sion also called strength differential (SD) effect (Gilles et al., 2011; Hammami et al., 2011; Khan et al., 2012; Odenbergeret al., 2012; Tuninetti et al., 2012b). Gilles et al. (2011) and Nixon et al. (2010) explain that this effect is the result of thecombination of a sharp initial basal texture and of the polarity of the deformation twinning mechanism, even for monotonicloadings. Because of the twinning and texture evolution, the shape of the yield surface of hcp metals significantly changeswith accumulated plastic deformation and, therefore, traditional hardening laws cannot accurately capture these phenom-ena (Plunkett et al., 2006). Most of the previous studies have focused on capturing these features (SD, anisotropy) and thevalidation has been essentially based on the assessment of true stress-true strain curve predictions of monotonic tests.
The main objectives of the current study are to characterize, at Room Temperature (RT), the quasi-static mechanicalbehavior of TA6V alloy for different multi-axial stress states, to develop a methodology to identify the macroscopic ortho-tropic yield criterion CPB06 developed by Cazacu et al. (2006) and, finally, to verify the capabilities of Finite Element (FE)simulations, based on this constitutive model to predict the evolution of the load and shape changes due to plastic deforma-tion in more complicated specimen geometries such as notched round bars and elliptical cross-sections.
Numerous models have been applied to simulate the quasi-static behavior of TA6V. Several studies rely on the Johnson–Cook or Norton-Hoff models to take into account the strain rate sensitivity of TA6V alloy even when the strain rate range iswell below the dynamic regime (Kotkunde et al., 2014; Vanderhasten et al., 2008). These models neglect the strength differ-ential effect and the plastic anisotropy. Other studies were focused on damage prediction, but assuming an isotropic behav-ior. For instance Peirs (2012), investigated the fracture behavior of the TA6V using either a Johnson–Cook damage initiationcriterion combined with a progressive isotropic damage law or the Gurson model. In this study, the true fracture strain wasaround 40%. Damage in TA6V is known to proceed by the nucleation, growth and coalescence of small internal voids like inmost other industrial metallic alloys, e.g. (Peirs, 2012; Lecarme, 2013). Now, a key result recently obtained using 3D in-situtomography (Lecarme, 2013) is that the porosity in TA6V remains quite small almost until fracture (e.g., it is equal to 0.57% attrue axial strain equal to �0.7) and that it nucleates late in the deformation process (at a true axial strain equal to �0.4 underuniaxial tension). In other words, the softening induced by damage is very small up to relatively large strain. The focus of thepresent paper is to check the ability of a phenomenological macroscopic anisotropic elasto-plastic law to predict TA6V plas-tic flow until equivalent strain typically lower than 0.3–0.6 for damage induced softening can be neglected.
Various constitutive laws have been developed such as the Khan–Huang–Liang (KHL) model (Khan and Liang, 1999) andits extensions (Khan and Yu, 2012; Khan et al., 2012), the asymmetric yield function with dependence on the stress invari-ants proposed by Yoon et al. (2014), the asymmetric yield function based on Hill 1948 (Verma et al., 2011) and the CPB06yield criterion developed by Cazacu et al. (2006) which capture both the anisotropy due to texture evolution and theStrength Differential effect (SD). Other models for hcp metals include Cazacu and Barlat (2004) and Lou et al. (2013). Themodel by Cazacu and Barlat (2004) is simple as the principal stresses are not needed which simplifies the implementationon a FE code. The advantage of the model by Lou et al. (2013) lies in that both the anisotropy in yield stresses and R-valuesare considered under associated flow rule. The CPB06 criterion was selected in this work for its flexibility. A similar criterionwas successfully employed by Plunkett et al. (2006, 2008), Cazacu et al. (2010), Nixon et al. (2010), Gilles et al. (2011),Ghaffari Tari et al. (2014) and Yoon et al. (2013).
The CPB06 phenomenological yield function described in Section 4 will be identified at RT and at a strain rate equal to10�3 s�1 from a set of monotonic tests described in Section 2 involving uniaxial tensile, uniaxial compression, simple shearand plane strain tensile states. The ‘‘one step’’ identification method proposed earlier by Gilles et al. (2011) is replaced hereby a more accurate ‘two steps’ method integrating inverse FE modeling described in Section 4.2. The anisotropic hardeningbehavior is described by linear interpolation of continuous CPB06 yield surfaces identified at several plastic work levels,which makes it possible the description of different hardening rates in tension, compression and shear. Inverse modelingincluding uniaxial stress–strain responses in tension, plane strain, shear as well as FE analyses of compression tests are usedto adjust the material parameters. This identification method is first validated in Section 4.2 by predicting the experimentalaxial strain distribution measured by 3D digital image correlation (DIC) in the median cross-section of compression speci-mens with initially elliptic cross-section for three orthogonal material directions. A second validation is also presented inSection 5 by predicting the load evolution and shape of tensile notched round bars and of compression specimens.
Finally, the sensitivity of the different sets of identified material parameters to the identification method as well as thecapacity of the model to accurately predict forces and displacement fields are discussed.
This research focuses not only on capturing the SD and anisotropy of TA6V alloy observed in monotonic stress–straincurves, but also on verifying that FE simulations can accurately reproduce the load and shape changes of full scale specimenssubjected to multiaxial loading and large plastic strains.
2. Material and experimental procedures
Compression, tension, shear and plane strain specimens are machined from an initial TA6V alloy ingot with the dimen-sions shown in Fig. 1. Both tensile and compression tests are performed in the three orthogonal directions of the material:

Fig. 1. Material directions of the TA6V ingot (dimensions in mm).
V. Tuninetti et al. / International Journal of Plasticity 67 (2015) 53–68 55
Longitudinal (LD), Transverse (TD) and Short Transverse (ST). Shear, Bauschinger and plane strain tensile tests are performedin the ST-LD plane. The tests are performed at room temperature and the targeted strain rate is constant, equal to 10�3 s�1.
2.1. Material
The chemical composition of the TA6V alloy is given in Table 1. Optical microscopy shows slightly elliptic grains and witha mean grain size equal to 12 lm in the ST-LD plane and 9 lm in ST-TD plane. The a-phase represents 94% of the volume. Theinitial texture of the material shown in Fig. 2 was determined by X-ray diffraction (XRD) at Paris-13 University. The initialtexture is quite weak.
2.2. Compression tests
Specimens are machined by wire electron discharge machining (EDM) with the dimensions shown in Fig. 3(a). The geom-etry used in this work was selected because the axial strain distribution and elliptical shape of the specimen is more sensitiveto the plastic anisotropy of the material. The experiments are performed in three orthogonal material directions: LD, TD andST. The servo hydraulic axial testing machine is controlled with a feedback loop system in order to impose constant strainrates equal to 10�3 s�1. Three 3D optical measurement systems (6 CCD cameras) are used and the strain/displacement fieldsare measured for characterization and validation purposes (Fig. 3(b)). Due to friction, a slight barreling is observed and thestress state is not purely uniaxial. The stress–strain curves are obtained using the method proposed by Tuninetti et al.(2012a). The cross-section of the specimen is determined by fitting an ellipse on the experimental data. The average trueaxial stress is computed by dividing the load measured by the load cell with the current cross-section area. The true averageaxial strain is obtained by averaging the axial strain measured on the surface of the horizontal symmetric plane of thesample.
2.3. Uniaxial tensile tests
Axisymmetric specimens of 6 mm diameter for the LD direction are tested at constant strain rates equal to 10�3, 10�2, and10�1 s�1 using a universal testing machine and three 3D-DIC systems are used for the strain/displacement measurements. Byusing the cross-section evolution of the tensile samples measured by DIC, a parameter similar to the ‘‘Lankford’’ coefficientused for sheets is computed. It is defined as the ratio of the strain rates in the TD direction and in the ST direction, i.e.RLD ¼ _eTD= _eST with _eTD ¼ lnðb=rÞ=t, _eST ¼ lnða=rÞ=t, and where r is the initial radius of the specimen and a, b are the majorand minor axis lengths of the current elliptical cross-section of the specimen, while t is the time. Accurate cross-sectionalarea values are measured during the entire duration of the test. The average value of the axial stress can thus be computedeven after the onset of necking. However, as such information was not available in TD and ST directions, it was decided toonly use the pre-necking part of the curve. The load–displacement curve is identified until the earliest possible occurrence ofnecking by applying the Considère criterion.
The tensile tests in the TD and ST directions are performed on axisymmetric specimens of 4 mm in diameter using a uni-versal testing machine equipped with a digital axial extensometer (Lecarme, 2013). The section is estimated by assumingvolume conservation until the onset of necking which is identified by the Considère criterion. The machine is controlledin order to keep a constant cross-head speed. The stress strain curves obtained for average plastic strain rates equal to7 � 10�4 s�1 for the TD and 9 � 10�5 s�1 for the ST direction are transformed into the corresponding response at a rate of
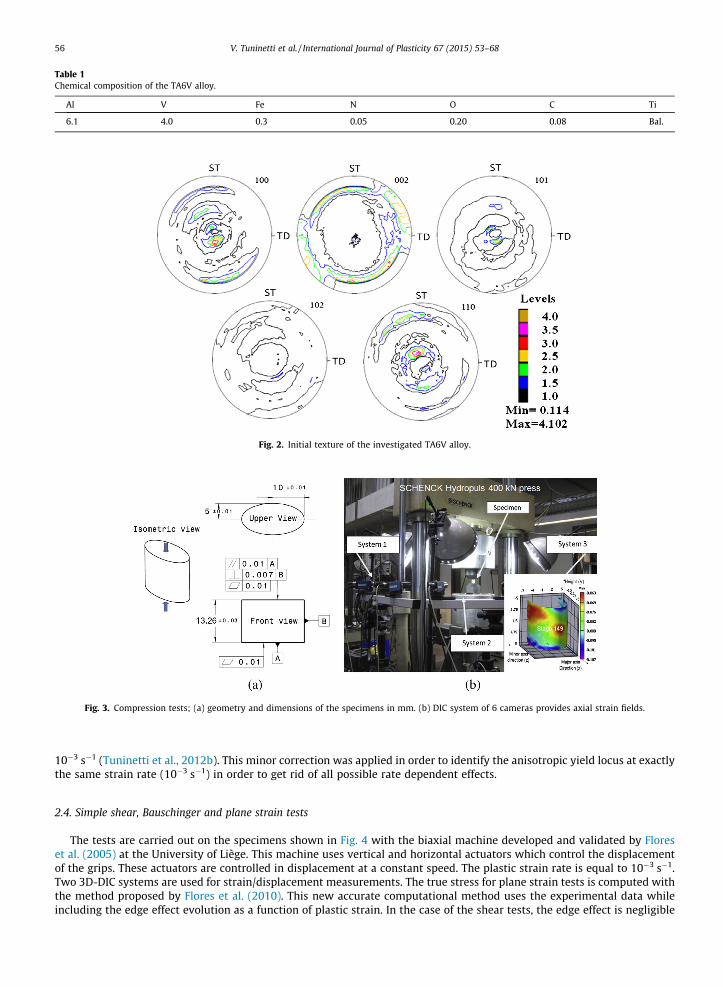
Table 1Chemical composition of the TA6V alloy.
Al V Fe N O C Ti
6.1 4.0 0.3 0.05 0.20 0.08 Bal.
Fig. 2. Initial texture of the investigated TA6V alloy.
Fig. 3. Compression tests; (a) geometry and dimensions of the specimens in mm. (b) DIC system of 6 cameras provides axial strain fields.
56 V. Tuninetti et al. / International Journal of Plasticity 67 (2015) 53–68
10�3 s�1 (Tuninetti et al., 2012b). This minor correction was applied in order to identify the anisotropic yield locus at exactlythe same strain rate (10�3 s�1) in order to get rid of all possible rate dependent effects.
2.4. Simple shear, Bauschinger and plane strain tests
The tests are carried out on the specimens shown in Fig. 4 with the biaxial machine developed and validated by Floreset al. (2005) at the University of Liège. This machine uses vertical and horizontal actuators which control the displacementof the grips. These actuators are controlled in displacement at a constant speed. The plastic strain rate is equal to 10�3 s�1.Two 3D-DIC systems are used for strain/displacement measurements. The true stress for plane strain tests is computed withthe method proposed by Flores et al. (2010). This new accurate computational method uses the experimental data whileincluding the edge effect evolution as a function of plastic strain. In the case of the shear tests, the edge effect is negligible

Fig. 4. The unique geometry and dimensions of specimen for plane strain, simple shear and Bauschinger test (dimensions in mm).
V. Tuninetti et al. / International Journal of Plasticity 67 (2015) 53–68 57
and the shear stress can be thus computed using: s = F/A0, where F is the load and A0 is the initial cross-section of thespecimen.
Plane strain tension, plane strain compression, and pure shear constitute identical loading condition provided that theplastic deformation is independent of the hydrostatic pressure. This is because the Lode parameter is zero for all these threecases (Yoon et al., 2014; Lou et al., 2014). Hence, it is not necessary to conduct the pure shear test to calibrate the CPB06 yieldfunction if plane strain tests data are available.
3. Experimental results
The average initial yield stress and the Young’s modulus are provided in Table 2 with the standard deviations. The alloyexhibits anisotropic elastic properties at room temperature. Similar results were already reported by Olsen and Moreen(1973), Lanning et al. (2005) and Oldenber et al. (2012) and explained by the cylindrical symmetry of the HCP crystal struc-ture (Tromans, 2011). For many materials, the Young’s modulus in tension is found different from the Young’s modulus incompression and it has to be derived from test data obtained in the stress mode of interest, as proposed by ASTM (2010).These elastic properties were mainly determined in this work using quasi-static uniaxial tension and compression tests withloading/unloading cycles near the onset of plasticity under constant strain rate of 10�3 s�1. For the FE simulations describedlater, the apparent Young’s modulus related to tension or compression state in the test direction (see Table 2) is used. Using asimple average Young’s modulus value induces discrepancies in the measured and predicted load–displacement curves(Figs. 11, 15 and 16). The reason of the small difference between the Young’s modulus in tension and in compression isnot fully explained. This asymmetry leading to larger stiffness in compression compared to tension shows up only for suf-ficiently large elastic strains. The elastic strains reached in Ti alloys are indeed significant, on the order of + or �1% due to thelarge strength and relatively low stiffness which can then exhibit the expected asymmetry in the interatomic repulsion/attraction forces.
Fig. 5 gathers all the available curves at 10�3 s�1 strain rate and RT, based on an average experimental response for eachloading direction and loading condition. The material response of the TA6V demonstrates a significant strength asymmetrybetween tension and compression. Anisotropic hardening is found and is observed to be stronger in compression compared
Table 2Experimental Young’s modulus and yield stress.
Test Direction Strain rate s�1 Young’s modulus E GPa/Std. Dev. Yield strength r0 MPa (0.2% plastic strain)/Std. Dev.
Tension LD 10�3 111 ± 1 927 ± 3TD 10�3 115 ± 4 933 ± 1ST 10�3 117 ± 1 941 ± 4
Compression LD 10�3 122 ± 1 968 ± 3TD 10�3 128 ± 3 1040 ± 6ST 10�3 123 ± 3 1002 ± 5

0 0.02 0.04 0.06 0.08 0.1400
600
800
1000
1200
1400
Axi
al s
tres
s (σ
) or s
hear
str
ess
(τ) −
MPa
Logarithmic axial (ε) or shear strain (ε12=γ/2)
LD COMPTD COMPST COMPLD TENSTD TENSST TENSSPSSSHτ0 VM
Comp
Tens
Fig. 5. True stress strain curves for monotonic tensile and compression in three orthogonal material directions (LD, TD and ST), plane strain (SPS in LD-STplane), and simple shear (SSH in LD-ST plane) at 10�3 s�1 and at RT. The Voce hardening coefficients identified in tension along LD direction are A0 = 921.0,B0 = 160.0, C0 = 15.48.
58 V. Tuninetti et al. / International Journal of Plasticity 67 (2015) 53–68
to tension. The usual definition of Lankford coefficient used in sheet plane to quantify the degree of anisotropy has to beadapted for this bulk material. The so called ‘‘R value’’ in tension and LD direction is measured during the tests by DIC iden-tifying the evolution of the radii of the elliptic minimum cross-section. This value for the axial strain range [0,0.1] is almostconstant and its average value will be used hereafter: RLD ¼ _eTD= _eST ¼ 1:15:
Often, isotropic hardening is related to an increase of the dislocation density during plasticity and can be modeled by asimple homothetic expansion of the yield locus. Here, the hardening behavior is more complex. As already observed by Louet al. (2007) and Nixon et al. (2010), the hardening rate in the TA6V alloy is different in tension and in compression. It varieswith the loading direction as well (Fig. 5). For this reason, in the next section, the fitting of the CPB06 yield locus with themonotonic experimental stress–strain data for several plastic work levels will take into consideration the updating of theshape of the yield criterion. The texture evolution and the effect of twinning are the primary reasons for these macroscopicobservations.
4. Constitutive model and identification procedure
4.1. CPB06. Orthotropic yield criterion
The macroscopic orthotropic yield criterion CPB06 proposed by Cazacu et al. (2006) and Plunkett et al. (2006), wasselected in this study, as it describes both the tension/compression asymmetry and the anisotropic behavior. This criterionis defined by
F1 ¼ ðjR1j � kR1Þa þ ðjR2j � kR2Þa þ ðjR3j � kR3Þa ð1Þ
where k is a parameter which takes into account the strength differential effect (SD), a is the degree of homogeneity, R1,R2; R3 are the principal values of the tensor R defined by R ¼ C : S where C is a fourth-order orthotropic tensor that accountsfor the plastic anisotropy of the material and S is the deviator of the Cauchy stress tensor. The tensor C represented as Voigtnotations is defined as follows
C ¼
C11 C12 C13 0 0 0C12 C22 C23 0 0 0C13 C23 C33 0 0 00 0 0 C44 0 00 0 0 0 C55 00 0 0 0 0 C66
2666666664
3777777775
ð2Þ
A methodology that allows describing directional hardening which accounts for the distortion of the yield locus of hex-agonal materials has been proposed by Plunkett et al. (2006). It consists in determining the anisotropy coefficients corre-sponding to several fixed levels of accumulated plastic strain and then use a piece-wise linear interpolation to obtain the

V. Tuninetti et al. / International Journal of Plasticity 67 (2015) 53–68 59
yield surface corresponding to any level of accumulated plastic strain. Gilles et al. (2011) have used a similar methodologywhere the plastic work is used instead of the accumulated plastic strain. This second methodology is adopted here. Theupdated yield locus is described by
f ðr; �epÞ ¼ �rðr; �epÞ � Yð�epÞ ð3Þ
where �r is the equivalent stress according to the given yield criterion in Eq. (1) while �ep is the equivalent plastic strain asso-ciated to �r using the work-equivalence principle (Hill, 1987), and Yð�epÞ is a reference hardening curve (the tensile stress–strain curve along LD direction is adopted in this study). The form of the latter is chosen asYð�epÞ ¼ A0 þ B0b1� exp �C0�ep
� �c, where A0; B0; C0 are material constants. For any �ep, the plastic work per unit volume is
given by
Wpð�epÞ ¼Z �ep
0YðpÞdp ¼ ðA0 þ B0Þ�ep �
B0
C01� expð�C0�epÞ� �
: ð4Þ
The anisotropy coefficients and k parameters are considered to evolve as a function of the plastic work per unit volume Wp.
They are determined for several levels of Wp: W ð1Þp < � � � < W ðjÞ
p < � � � < W ðmÞp ; j ¼ i; . . . ;m, where W ð1Þ
p corresponds to initial
yielding and W ðmÞp corresponds to the highest level of plastic work attained in the experimental tests. Next, for each of the
individual plastic work levels, W ðjÞp ; �r is calculated using Eq. (1). The determination of the yield surface corresponding to
an intermediate level of plastic work (W ðjÞp 6Wp 6W ðjþ1Þ
p ) is made by a linear interpolation.
4.2. Identification procedure
The anisotropy coefficients Cij and k parameters of the CPB06 yield criterion are fitted based on experimental yield stressratios and the single R-ratio available using the Simulated Annealing (SA) algorithm (Metropolis et al., 1953; Hastings, 1970).This is a global optimization method that distinguishes between different local optima. In this study, the error function to beminimized is defined as follows
E ¼Xr
i¼1
giðrT
D=rTLDÞ
numi
ðrTD=rT
LDÞexpi
� 1
" #2
þXs
j¼1
gj
ðrCD=rT
LDÞnumj
ðrCD=rT
LDÞexpj
� 1
" #2
þXt
k¼1
gkðrSPS
D =rTLDÞ
numk
ðrSPSD =rT
LDÞexpk
� 1
" #2
þ � � �
þXu
l¼1
glðrSSH
D =rTLDÞ
numl
ðrSSHD =rT
LDÞexpl
� 1
" #2
þXv
m¼1
gmRnum
m
Rexpm
� 1� �2
ð5Þ
where r, s, t, u and v are respectively the number of tensile, compressive, plane strain, shear yield stresses, and available R-ratio. The superscript indicates whether the value is experimental (exp) or numerical (num). Parameters gi,j,k,l,m are used tobalance the weight of each term. In the current identification, uniaxial tensile and compression tests are available in thethree directions RD, TD, ST, while plane strain and shear tests and R-ratio are available in the LD direction only. This firstidentification step provides an initial set of parameters that requires further adjustments.
Starting from this first set of material parameters, inverse modeling of the compression tests provides a second refined setof parameters. This second identification step compares the predicted response with the experimental axial strain distribu-tion measured in the median cross-section of the specimens by 3D-DIC for LD, TD and ST directions. This second identifica-tion is essential as the axial strain distribution in the specimens with the selected elliptical cross-section is very sensitive tothe material anisotropy, seen Tuninetti et al. (2012a). One-eighth of the compression specimens is modeled in the FE sim-ulations within the updated Lagrangian FE code Lagamine developed by ArGEnCo Department of the University of Liège. TheBWD3D finite element is selected. It is an 8-node 3D brick element with a mixed formulation adapted to large strains andlarge displacements. It involves a reduced integration scheme (with only one integration point) and an hourglass controltechnique. This element is based on the non-linear three-field (stress, strain and displacement) HU-WASHIZU variationalprinciple (Belytschko and Bindeman, 1991; Duchêne et al., 2007; Simo and Hughes, 1986). In order to simulate frictionbetween the dies and the surface of the specimen for compression tests, 3D CFI3D contact elements (Habraken andCescotto, 1998) with 4 integration points and a Coulomb friction law are chosen. The Coulomb friction coefficient U is con-sidered to be constant. A value U = 0.08 is obtained by fitting the measured and predicted barreling. Finally, these two iden-tification steps provide a material parameter set based on compression and tension tests in three directions (LD, TD, ST),shear, plane strain tests and RLD value for 5 plastic work levels and imposing the constraint C44 = C55 = C66 (Table 3).
The CPB06 constitutive model identified by the above procedure (the results of other identification strategies will beaddressed in the next section) is compared to the experimental data, as shown in Figs. 6–8. Fig. 6 shows the yield surfacesalong with the experimental data for five levels of plastic work. The values that are directly extracted from the tests are plot-ted with discrete symbols, e.g. compression and tension in the three orthogonal material directions. However, for the planestrain tensile test, the axial stress is computed using experimental data but the transverse is not known. Due to this, theexperimental plane strain data is shown as dashed line corresponding to the axial stress value. Three 2D cuts of the yieldsurface are presented (LD-TD, LD-ST and TD-ST) as well as the p-plane projection. Note that irrespective of the level of plastic

Table 3Coefficients of CPB06 yield function for TA6V and for 5 plastic works levels (a = 2) and values of Yð�epÞ identified in tension along LD direction.
Wp k C11 C12 C13 C22 C23 C33 C44 ¼ C55 ¼ C66
1.857 �0.136 1 �2.373 �2.364 �1.838 1.196 �2.444 �3.6079.377 �0.136 1 �2.495 �2.928 �2.283 1.284 �2.446 4.015
48.66 �0.165 1 �2.428 �2.920 1.652 �2.236 1.003 �3.996100.2 �0.164 1 �2.573 �2.875 1.388 �2.385 0.882 �3.926206.6 �0.180 1 �2.973 �2.927 0.534 �2.963 0.436 �3.883
LD Tension A0=921.0 B0=160.0 C0=15.48
Fig. 6. Yield loci predicted by CPB06 and experimental points (exp.) for 5 accumulated plastic works: Wp1 = 1.86, Wp2 = 9.38, Wp3 = 48.7, Wp4 = 100.2 andWp5 = 206.6 J/cm3.
60 V. Tuninetti et al. / International Journal of Plasticity 67 (2015) 53–68
work, the yield loci exhibit a distorted elliptical shape. The agreement between the model and experiments is quitesatisfactory.
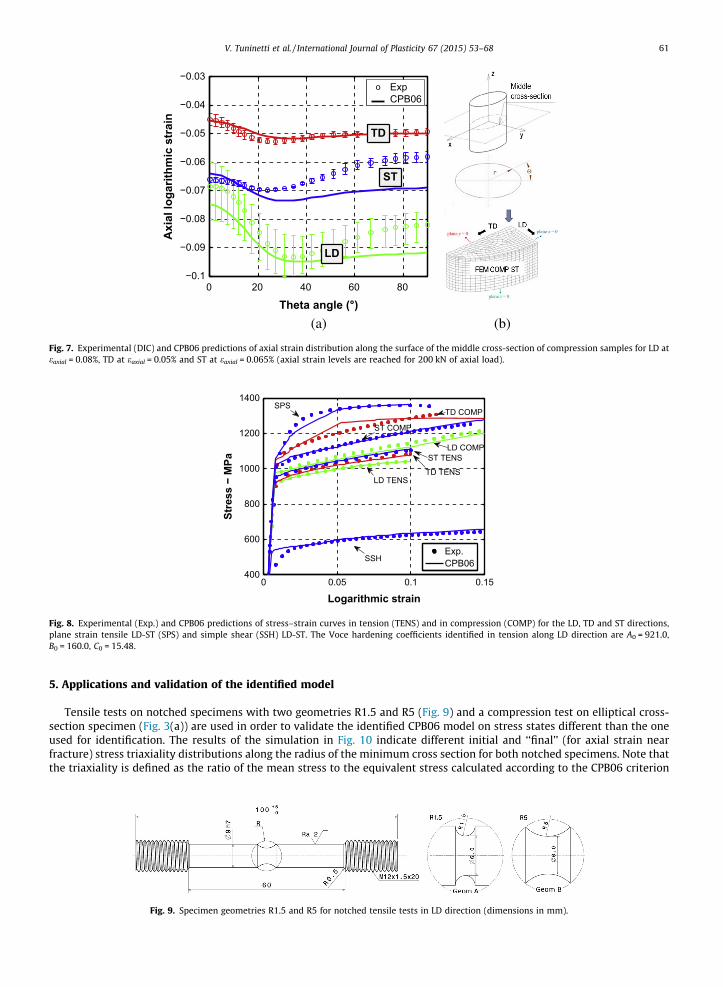
In order to analyze the plastic anisotropy predictions of the CPB06 model, the strain field predictions of compression testsin LD, TD and ST directions were also compared with the experimental results in Fig. 7 which provides the variation of theaxial strain (along the surface of the middle cross-section of the compression samples) with the theta angle. The strain dis-tribution is fairly well captured in the directions LD and TD but show a very large discrepancy in the ST direction. The max-imum error is 17%. This error may be due to the fact that the R-value is not accurately modeled in the CPB06 yield functionunder the associated flow rule assumption.
Fig. 8 shows the experimental stress–strain curves along with the model predictions. Except for the compression in the TDdirection, the predictions are consistent with the experiments. The different curves for both tension and compression inthree directions (LD, TD and ST) clearly confirm that the von Mises isotropic approach is insufficient to describe the mechan-ical behavior of the TA6V alloy. The linear parts within the predicted curves in Fig. 8 reflect the fact that the hardening behav-ior is related to interpolation between different yield locus shapes identified for five plastic work levels.
0 20 40 60 80−0.1
−0.09
−0.08
−0.07
−0.06
−0.05
−0.04
−0.03
Theta angle (°)
Axi
al lo
garit
hmic
str
ain
ExpCPB06
LD
ST
TD
o
(b)(a)
Fig. 7. Experimental (DIC) and CPB06 predictions of axial strain distribution along the surface of the middle cross-section of compression samples for LD ateaxial = 0.08%, TD at eaxial = 0.05% and ST at eaxial = 0.065% (axial strain levels are reached for 200 kN of axial load).
0 0.05 0.1 0.15400
600
800
1000
1200
1400
Logarithmic strain
Stre
ss −
MPa
Exp.CPB06
LD COMP
ST COMP
SPS
SSH
TD COMP
ST TENS
TD TENSLD TENS
Fig. 8. Experimental (Exp.) and CPB06 predictions of stress–strain curves in tension (TENS) and in compression (COMP) for the LD, TD and ST directions,plane strain tensile LD-ST (SPS) and simple shear (SSH) LD-ST. The Voce hardening coefficients identified in tension along LD direction are A0 = 921.0,B0 = 160.0, C0 = 15.48.
V. Tuninetti et al. / International Journal of Plasticity 67 (2015) 53–68 61
5. Applications and validation of the identified model
Tensile tests on notched specimens with two geometries R1.5 and R5 (Fig. 9) and a compression test on elliptical cross-section specimen (Fig. 3(a)) are used in order to validate the identified CPB06 model on stress states different than the oneused for identification. The results of the simulation in Fig. 10 indicate different initial and ‘‘final’’ (for axial strain nearfracture) stress triaxiality distributions along the radius of the minimum cross section for both notched specimens. Note thatthe triaxiality is defined as the ratio of the mean stress to the equivalent stress calculated according to the CPB06 criterion
Fig. 9. Specimen geometries R1.5 and R5 for notched tensile tests in LD direction (dimensions in mm).

0 1 2 30.2
0.4
0.6
0.8
1
1.2
Initial radial coordinate − mmSt
ress
Tria
xial
ity
R1.5 InitialR1.5 FinalR5 InitialR5 Final
Fig. 10. Stress Triaxiality distribution along the radius of the minimum cross section for notched tensile tests geometries R1.5 and R5 at initial and finalstage. The axial displacement at the final stage is equal to 0.8 mm for the specimens R1.5 and 1 mm for the specimens R5.
62 V. Tuninetti et al. / International Journal of Plasticity 67 (2015) 53–68
(Eq. (1)) and using the material parameters shown in Table 3. The numerical simulations are run within the updatedLagrangian FE code Lagamine already introduced in the previous section.
In Fig. 11(a) and (b), the variation of the load as a function of the displacement for a 40 mm gauge zone and the exper-imental dimensions of the cross-section of the specimens R1.5 just before fracture measured by 3D-DIC are compared withthe predictions of the CPB06 model based on 4 different sets of material parameters identified with different choices ofexperimental test data:
0 0.2 0.4 0.6 0.80
10
20
30
40
50
Axial displacement − mm
Axi
al L
oad
− kN
CPB06(identification 1)CPB06(identification 2)CPB06(identification 3)CPB06(identification 4)VM+VOCEEXP
(a)
0 20 40 60 802.4
2.6
2.8
3
3.2
Theta − (°)
Rad
ius
− m
m
CPB06(1)CPB06(2)CPB06(3)CPB06(4)VM+VOCEEXP
(b) (c)
Fig. 11. CPB06 predictions of the (a) load vs. displacement for specimen geometry R1.5 (40 mm gauge length) (b, c) cross-section of the specimen R1.5 at0.8 mm of axial displacement.

Fig. 12. Comparison of axial strain field eyy for geometry R5 at 1 mm of axial displacement in LD direction. (a) Measured by 3D-DIC (b) predicted byCPB06(3) and (c) by CPB06(4).
V. Tuninetti et al. / International Journal of Plasticity 67 (2015) 53–68 63
1. Initial CPB06 yield locus identified with compression and tension tests for LD, TD and ST with Voce type hardening law(isotropic hardening, the shape evolution of the yield criterion is neglected); under the name CPB06(1).
2. Initial CPB06 yield locus identified with compression and tension tests for LD, TD and ST, shear and plane strain testswith Voce type hardening law; under the name CPB06(2).
3. CPB06 identified with compression and tension tests for LD, TD and ST, shear, plane strain tests and RLD = 1.15 value for5 plastic work levels; under the name CPB06(3).
4. CPB06 identified with compression and tension tests for LD, TD and ST, shear, plane strain tests and RLD = 1.15 value for5 plastic work levels, with the two step identification method presented earlier and imposing C44 = C55 = C66 (data setused for Figs. 6–8), under the name CPB06(4).
The results of Fig. 11 show that the identification procedures involving the largest number of monotonic tests (CPB06(3)and CPB06(4)) better reproduce both the load prediction and the shape of the deformed cross-section of the sample. How-ever, the constraint of C44 = C55 = C66 used for the identification CPB06(4) is needed in order to insure an accurate predictionof the load evolution. This constraint could be relaxed if shear tests for each material direction were available. Note that forthis specific notched geometry loaded in the LD direction and reaching only moderate axial strain levels, the isotropic elasto-plastic von Mises law fitted on tensile tests in this direction predicts quite well both the load and average radius evolutions.However, as presented hereafter, the second specimen B, with a smoother notch radius (R5) and thus allowing larger plastic

20 40 60 800
0.1
0.2
0.3
0.4
0.5
Theta − (°)
Axi
al lo
garit
hmic
str
ain CPB06(3)
CPB06(4)Experimental
0 20 40 60 802.4
2.5
2.6
2.7
2.8
2.9
3
Theta − (°)
Rad
ius
− m
m
Initial shapeCPB06(3)CPB06(4)EXP
(a) (b)
Fig. 13. Comparison of CPB06(3) and CPB06(4) predictions with DIC measurements for the specimen geometry R5 at 1 mm of axial displacement; (a) axialstrain distribution in the minimum cross-section of specimen; (b) cross-section of specimen.
2 4 6−5
0
5
ST direction − mm
LD d
irect
ion
− m
m
2 4 6−5
0
5
TD direction − mm
LD d
irect
ion
− m
mInitialExp.CPB06(3)CPB06(4)
Fig. 14. Comparison of predicted CPB06(3) and CPB06(4) deformed shapes of the notch of the specimen R5 (at 1 mm of axial displacement) with DICmeasurements.
0 0.2 0.4 0.6 0.8 10
10
20
30
40
Axial displacement − mm
Axi
al L
oad
− kN CPB06(3)
CPB06(4)EXP
Fig. 15. Correlations of predicted load vs. displacement curve with experimental results of specimen R5.
64 V. Tuninetti et al. / International Journal of Plasticity 67 (2015) 53–68

0 0.05 0.1 0.15 0.20
50
100
150
200
250
Average axial true strain
Load
− k
N
von MisesCPB06(4)Exp.
Fig. 16. Load vs. axial true strain predicted by CPB06(4) and measured in the experiment for compression tests in ST direction.
0 0.05 0.1 0.15 0.210
10.5
11
11.5
12
Average logarithmic axial strain
Min
or a
xis
leng
th −
mm von Mises
CPB06(4)Exp.
0 0.05 0.1 0.15 0.220
20.5
21
21.5
22
Average logarithmic axial strain
Maj
or a
xis
leng
th −
mm von Mises
CPB06(4)Exp.
(a) (b)
Fig. 17. Comparison between DIC measurements, CPB06(4) and von Mises law predictions of minor (a) and major (b) axis length of the elliptic cross-sectionof compression sample in ST direction.
10 10.5 11−6
−4
−2
0
2
4
6
TD direction mm
ST d
irect
ion
− m
m
5 5.5 6−6
−4
−2
0
2
4
6
LD direction − mm
ST d
irect
ion
− m
m
von MisesCPB06(4)Exp.
(b) (a)
Fig. 18. Barreling predictions by CPB06(4) and von Mises law compared to experimental measurements obtained by DIC.
V. Tuninetti et al. / International Journal of Plasticity 67 (2015) 53–68 65
−0.2 −0.15 −0.1 −0.05 0 0.05 0.1 0.15 0.2−800
−600
−400
−200
0
200
400
600
800
γ/2
Shea
r str
ess
− M
Pa
BAU05 1BAU05 2BAU10 1BAU10 2BAU15 1BAU15 2
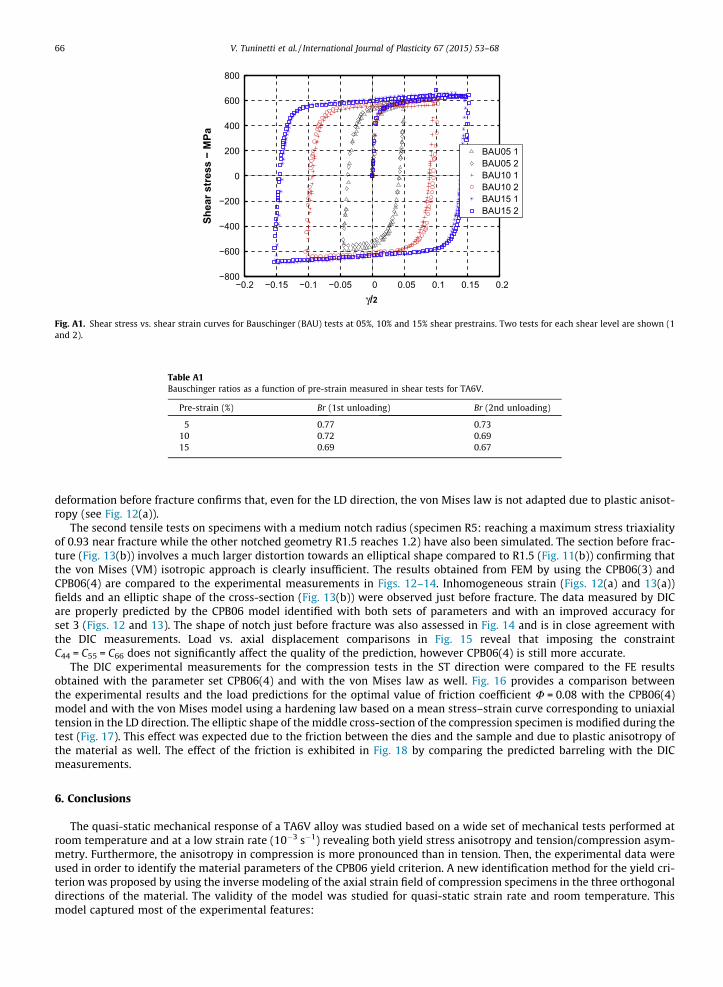
Fig. A1. Shear stress vs. shear strain curves for Bauschinger (BAU) tests at 05%, 10% and 15% shear prestrains. Two tests for each shear level are shown (1and 2).
Table A1Bauschinger ratios as a function of pre-strain measured in shear tests for TA6V.
Pre-strain (%) Br (1st unloading) Br (2nd unloading)
5 0.77 0.7310 0.72 0.6915 0.69 0.67
66 V. Tuninetti et al. / International Journal of Plasticity 67 (2015) 53–68
deformation before fracture confirms that, even for the LD direction, the von Mises law is not adapted due to plastic anisot-ropy (see Fig. 12(a)).
The second tensile tests on specimens with a medium notch radius (specimen R5: reaching a maximum stress triaxialityof 0.93 near fracture while the other notched geometry R1.5 reaches 1.2) have also been simulated. The section before frac-ture (Fig. 13(b)) involves a much larger distortion towards an elliptical shape compared to R1.5 (Fig. 11(b)) confirming thatthe von Mises (VM) isotropic approach is clearly insufficient. The results obtained from FEM by using the CPB06(3) andCPB06(4) are compared to the experimental measurements in Figs. 12–14. Inhomogeneous strain (Figs. 12(a) and 13(a))fields and an elliptic shape of the cross-section (Fig. 13(b)) were observed just before fracture. The data measured by DICare properly predicted by the CPB06 model identified with both sets of parameters and with an improved accuracy forset 3 (Figs. 12 and 13). The shape of notch just before fracture was also assessed in Fig. 14 and is in close agreement withthe DIC measurements. Load vs. axial displacement comparisons in Fig. 15 reveal that imposing the constraintC44 = C55 = C66 does not significantly affect the quality of the prediction, however CPB06(4) is still more accurate.
The DIC experimental measurements for the compression tests in the ST direction were compared to the FE resultsobtained with the parameter set CPB06(4) and with the von Mises law as well. Fig. 16 provides a comparison betweenthe experimental results and the load predictions for the optimal value of friction coefficient U = 0.08 with the CPB06(4)model and with the von Mises model using a hardening law based on a mean stress–strain curve corresponding to uniaxialtension in the LD direction. The elliptic shape of the middle cross-section of the compression specimen is modified during thetest (Fig. 17). This effect was expected due to the friction between the dies and the sample and due to plastic anisotropy ofthe material as well. The effect of the friction is exhibited in Fig. 18 by comparing the predicted barreling with the DICmeasurements.
6. Conclusions
The quasi-static mechanical response of a TA6V alloy was studied based on a wide set of mechanical tests performed atroom temperature and at a low strain rate (10�3 s�1) revealing both yield stress anisotropy and tension/compression asym-metry. Furthermore, the anisotropy in compression is more pronounced than in tension. Then, the experimental data wereused in order to identify the material parameters of the CPB06 yield criterion. A new identification method for the yield cri-terion was proposed by using the inverse modeling of the axial strain field of compression specimens in the three orthogonaldirections of the material. The validity of the model was studied for quasi-static strain rate and room temperature. Thismodel captured most of the experimental features:

V. Tuninetti et al. / International Journal of Plasticity 67 (2015) 53–68 67
1. in monotonic tests: the distortion of the yield surface associated with the tension–compression asymmetry and theanisotropic hardening;
2. in specimens with multiaxial stress–strain states and several stress triaxialities (notched tensile tests and compressiontests): load, shape changes and strain fields for different loading directions (tensile tests in LD, compression in STdirections).
The simulations demonstrated that the set of material parameters identified based on the largest number of tests andtaking into account the evolution of the yield locus shape provides the best agreement with the experimental measurementsused for validation. The interest of prescribing identical shear behavior in the 3 orthogonal planes when only one experimentis available, gives good predictions of load evolution (Figs. 11(a) and 15) but moderate discrepancies appear when looking atthe strain distributions (Figs. 11(b), 12 and 13(a)). There are not enough anisotropic parameters in the CPB06 yield functionto characterize the anisotropy both in the yield stresses and R-values. A non-associated flow rule could be applied to capturethe anisotropy in R-values and therefore to reduce the discrepancies in the prediction of the strain distributions while stillusing the CPB06 function.
Future work must be performed in order to identify the evolution of the yield surface with strain rate, temperature, strainpath changes and cyclic behavior and to incorporate kinematic hardening (Appendix A). The simplest version of the Cazacumodel with one linear transformation (matrix C Eq. (2)) was used; however, increasing the number of transformations couldprovide even higher flexibility to the model.
Furthermore, the effect of damage should be investigated to predict fracture as well as to capture some moderate soft-ening expected near the onset of fracture. Versions of the Gurson model extended to anisotropic yield locus like the onedeveloped by Bettaïeb et al. (2011), Khan and Liu (2012) or Benzerga et al. (2004) can be used for this purpose. Nevertheless,the fact that the present model with no softening was able to reproduce the load and geometry evolution up to large strainsconfirms the assumption that damage in this material nucleates late with limited porosity levels until final stage of the coa-lescence process (Lecarme, 2013).
Acknowledgments
The authors thank the Walloon Region (Winnomat 2 project), the Belgian Scientific Research Fund FNRS which financesA.M.H. and the Interuniversity Attraction Poles Program, P7/21 Intemate initiated by the Belgian Science Policy office, forfinancial support. The authors would also like to thank B. Bacroix and T. Chauveau (U. Paris 13) for the texture measurementsas well as L. Lecarme (UCL) for providing stress-strain curves in ST and TD directions used in this paper.
Appendix A. Quantification of kinematic hardening
Fig. A1 shows the variation of the shear stress (s = F/A0) with the shear strain (c/2). Three pre-strain 5, 10 and 15% of shearstrain tests are presented. The reverse curves show early re-yielding and rapid work hardening. This significant kinematichardening is quantitatively presented by using the Bauschinger ratio (Br) defined by
Br ¼ rf � rR
2rF; ðBr 6 1Þ ðA:1Þ
where rF is the yield stress at the start of unloading and rR is the yield stress at the reverse loading (Table A1). Br is equal to 1for pure isotropic hardening (rf = �rR). The smaller the Bauschinger ratio, the larger the Bauschinger effect. The presence ofdifferent stress levels within the a and b phases of the TA6V as well as the heterogeneity of the strain at the local level (twinsand grain orientation implying different active slip systems with different critical resolved shear) explain the origin of thekinematic hardening.
References
ASTM, 2010. Standard Test Method for Young’s Modulus, Tangent Modulus, and Chord Modulus. ASTM E111-04.Belytschko, T., Bindeman, L.P., 1991. Assumed strain stabilization of the 4-node quadrilateral with 1-point quadrature for nonlinear problems. Comput.
Methods Appl. Mech. Eng. 88, 311–340.Benzerga, A.A., Besson, J., Pineau, A., 2004. Anisotropic ductile fracture: Part II: theory. Acta Mater. 52, 4639–4650.Bettaieb, M.B., Lemoine, X., Duchêne, L., Habraken, A.M., 2011. On the numerical integration of an advanced Gurson model. Int. J. Numer. Methods Eng. 85,
1049–1072.Burkins, M., Hansen, J., Paige, J., Turner, P., 2000. The Effect of Thermomechanical Processing on the Ballistic Limit Velocity of Extra Low Interstitial Titanium
Alloy Ti–6Al–4V. U.S. Army Research Laboratory ARL-MR-486, 1–69.Burkins, M., Wells, M., Fanning, J., Roopchand, B., 2001. The Mechanical and Ballistic Properties of an Electron Beam Single Melt of Ti–6Al–4V Plate. U.S.
Army Research Laboratory, ARL-MR-515.Cazacu, O., Barlat, F., 2004. A criterion for description of anisotropy and yield differential effects in pressure-insensitive metals. Int. J. Plasticity 20, 2027–
2045.Cazacu, O., Plunkett, B., Barlat, F., 2006. Orthotropic yield criterion for hexagonal close packed metals. Int. J. Plasticity 22, 1171–1194.Cazacu, O., Ionescu, I.R., Yoon, J.W., 2010. Orthotropic strain rate potential for the description of anisotropy in tension and compression of metals. Int. J.
Plasticity 26, 887–904.Deyuan, F., Fort III, W., Horvath, R., 2001. Experience with titanium heat exchangers in refinery services. Mater. Perform. 40, 56–60.

68 V. Tuninetti et al. / International Journal of Plasticity 67 (2015) 53–68
Duchêne, L., El Houdaigui, F., Habraken, A.M., 2007. Length changes and texture prediction during free end torsion test of copper bars with FEM andremeshing techniques. Int. J. Plasticity 23, 1417–1438.
Elias, C.N., Lima, J.H.C., Valiev, R., Meyers, M.A., 2008. Biomedical applications of titanium and its alloys. JOM 60, 46–49.Flores, P., Rondia, E., Habraken, A.M., 2005. Development of an experimental equipment for the identification of constitutive laws. Int. J. Forming Process.
(Special Issue), 117–137.Flores, P., Tuninetti, V., Gilles, G., Gonry, P., Duchêne, L., Habraken, A.M., 2010. Accurate stress computation in plane strain tensile tests for sheet metal using
experimental data. J. Mater. Process. Technol. 210, 1772–1779.Ghaffari Tari, D., Worswick, M.J., Ali, U., Gharghouri, M.A., 2014. Mechanical response of AZ31B magnesium alloy: experimental characterization and
material modeling considering proportional loading at room temperature. Int. J. Plasticity 55, 247–267.Gilles, G., Hammami, W., Libertiaux, V., Cazacu, O., Yoon, J.H., Kuwabara, T., Habraken, A.M., Duchêne, L., 2011. Experimental characterization and elasto-
plastic modeling of the quasi-static mechanical response of TA–6V at room temperature. Int. J. Solids Struct. 48, 1277–1289.Gurrappa, I., 2003. Characterization of titanium alloy Ti–6Al–4V for chemical, marine and industrial applications. Mater. Charact. 51, 131–139.Habraken, A.M., Cescotto, S., 1998. Contact between deformable solids: the fully coupled approach. Math. Comput. Modell. 28, 153–169.Hammami, W., Tirry, W., Coghe, F., Duchêne, L., Delannay, L., Habraken, A.M., 2011. Ti6A14V anisotropy and texture evolution predictions using multisite
and self consistent crystal plasticity models. In: The 12th World Conference on Titanium Ti-2011.Hastings, W.K., 1970. Monte Carlo sampling methods using Markov chains and their applications. Biometrika 57, 97–109.Hill, R., 1987. Constitutive dual potentials in classical plasticity. J. Mech. Phys. Solids 35, 23–33.Khan, A.S., Liang, R., 1999. Behaviors of three BCC metal over a wide range of strain rates and temperatures: experiments and modeling. Int. J. Plasticity 15,
1089–1109.Khan, A.S., Liu, H., 2012. Strain rate and temperature dependent fracture criteria for isotropic and anisotropic metals. Int. J. Plasticity 37, 1–15.Khan, A.S., Yu, S., 2012. Deformation induced anisotropic responses of Ti–6Al–4V alloy. Part I: experiments. Int. J. Plasticity 38, 1–13.Khan, A.S., Suh, Y.S., Kazmi, R., 2004. Quasi-static and dynamic loading responses and constitutive modeling of titanium alloys. Int. J. Plasticity 20, 2233–
2248.Khan, A.S., Kazmi, R., Farroch, B., 2007. Multiaxial and non-proportional loading responses, anisotropy and modeling of Ti–6Al–4V titanium alloy over wide
ranges of strain rates and temperatures. Int. J. Plasticity 23, 931–950.Khan, A.S., Yu, S., Liu, H., 2012. Deformation induced anisotropic responses of Ti–6Al–4V alloy Part II: a strain rate and temperature dependent anisotropic
yield criterion. Int. J. Plasticity 38, 14–26.Kotkunde, N., Deole, A.D., Gupta, A.K., Singh, S.K., 2014. Comparative study of constitutive modeling for Ti–6Al–4V alloy at low strain rates and elevated
temperatures. Mater. Des. 55, 999–1005.Lanning, D., Nicholas, T., Haritos, G., 2005. On the use of critical distance theories for the prediction of the high cycle fatigue limit stress in notched Ti–6Al–
4V. Int. J. Fatigue 27, 45–57.Lecarme, L., 2013. Viscoplasticity, Damage and Fracture of Ti–6Al–4V. PhD Thesis. Université Catholique de Louvain, Belgium.Lee, W.S., Lin, C.F., 1998. Plastic deformation and fracture behaviour of TA6V alloy loaded with high strain rate under various temperatures. Mater. Sci. Eng.
A 241, 48–59.Long, M., Rack, H.J., 2006. Titanium alloys in total joint replacement—a materials science perspective. Biomater 19, 1621–1639.Lou, X.Y., Li, M., Boger, R.K., Agnew, S.R., Wagoner, R.H., 2007. Hardening evolution of AZ31B Mg sheet. Int. J. Plasticity 23, 44–86.Lou, Y., Huh, H., Yoon, J.W., 2013. Consideration of strength differential effect in sheet metals with symmetric yield functions. Int. J. Mech. Sci. 66, 214–223.Lou, Y., Yoon, J.W., Huh, H., 2014. Modeling of shear ductile fracture considering a changeable cut-off value for stress triaxiality. Int. J. Plasticity 54, 56–80.Lütjering, G., Williams, J.C., 2007. Titanium: Engineering Materials and Processes, second ed. Springer-Verlag, Berlin.Majorell, A., Srivatsa, S., Picu, R.C., 2002. Mechanical behavior of TA6V at high and moderate temperatures – Part I: experimental results. Mater. Sci. Eng. A
326, 297–305.Metropolis, N., Rosenbluth, A.W., Rosenbluth, M.N., Teller, A.H., Teller, E., 1953. Equation of state calculations by fast computing machines. J. Chem. Phys 21,
1087–1092.Montgomery, J.S., Wells, M.G.H., 2001. Titanium armor applications in combat vehicles. JOM 53, 29–32.Nixon, M.E., Cazacu, O., Lebensohn, R.A., 2010. Anisotropic response of high-purity a-titanium: experimental characterization and constitutive modeling.
Int. J. Plasticity 26, 516–532.Odenberger, E.L., Hertzman, J., Thilderkvist, P., Merklein, M., Kuppert, A., Stöhr, T., Lechler, J., Oldenburg, M., 2012. Thermo-mechanical sheet metal forming
of aero engine components in Ti–6Al–4V – Part 1: material characterisation. Int. J. Mater. Form., 1–12.Olsen, R.H., Moreen, H.A., 1973. Calculation of the elastic anisotropy of Ti–6Al–4V alloy sheet from pole figure data. Metall. Trans. 4, 701–705.Peirs, J., 2012. Experimental Characterisation and Modelling of the Dynamic Behaviour of the Titanium Alloy Ti6Al4V. PhD Thesis. Ghent University,
Belgium.Peirs, J., Verleysen, P., Degrieck, J., Coghe, F., 2010. The use of hat-shaped specimens to study the high strain rate shear behaviour of Ti–6Al 4V Int. J. Impact
Eng. 37, 703–714.Plunkett, B., Lebensohn, R.A., Cazacu, O., Barlat, F., 2006. Anisotropic yield function of hexagonal materials taking into account texture development and
anisotropic hardening. Acta Mater. 54, 4159–4169.Plunkett, B., Cazacu, O., Barlat, F., 2008. Orthotropic yield criteria for description of the anisotropy in tension and compression of sheet metals. Int. J.
Plasticity 24, 847–866.Porntadawit, J., Uthaisangsuk, V., Choungthong, P., 2014. Modeling of flow behavior of Ti–6Al–4V alloy at elevated temperatures. Mater. Sci. Eng. A 599,
212–222.Rack, H.J., Qazi, J.I., 2006. Titanium alloys for biomedical applications. Mater. Sci. Eng. C 26, 1269–1277.Simo, J.C., Hughes, T.J.R., 1986. On the variational foundations of assumed strain methods. J. Appl. Mech., ASME 53, 51–54.Sukumar, G., Bhav Singh, B., Bhattacharjee, A., Siva Kumar, K., Gogia, A.K., 2013. Ballistic impact behaviour of b-CEZ Ti alloy against 7.62 mm armour piercing
projectiles. Int. J. Impact Eng. 54, 149–160.Tromans, D., 2011. Elastic anisotropy of HCP metal crystals and polycrystals. Int. J. Res. Rev. Appl. Sci. 6, 462–483.Tuninetti, V., Habraken, A.M., 2014. Impact of anisotropy and viscosity to model the mechanical behavior of Ti–6Al–4V alloy. Mater. Sci. Eng. A 605, 39–50.Tuninetti, V., Gilles, G., Péron-Lührs, V., Habraken, A.M., 2012a. Compression test for metal characterization using digital image correlation and inverse
modeling. Procedia IUTAM 4, 206–214.Tuninetti, V., Gilles, G., Milis, O., Lecarme, L., Habraken, A.M., 2012b. Compression test for plastic anisotropy characterization using optical full-field
displacement measurement technique. In: Steel Res. Int. SE: 14th Int. Conf. Metal Forming 2012, pp. 1239–1242.Vanderhasten, M., Rabet, L., Verlinden, B., 2008. Ti–6Al–4V: deformation map and modelisation of tensile behavior. Mater. Des. 29, 1090–1098.Verma, R.K., Kuwabara, T., Chung, K., Haldar, A., 2011. Experimental evaluation and constitutive modeling of non-proportional deformation for asymmetric
steels. Int. J. Plasticity 27, 82–101.Yoon, J., Cazacu, O., Mishra, R.K., 2013. Constitutive modeling of AZ31 sheet alloy with application to axial crushing. Mater. Sci. Eng., A 565, 203–212.Yoon, J.W., Lou, Y., Yoon, J., Glazoff, M.V., 2014. Asymmetric yield function based on the stress invariants for pressure sensitive metals. Int. J. Plasticity 56,
184–202.