análise de confiabilidade de barragem de concreto construída
TRANSCRIPT

© 2019 IBRACON
Volume 12, Number 3 (June 2019) p. 551 – 579 • ISSN 1983-4195http://dx.doi.org/10.1590/S1983-41952019000300007
Reliability analysis of built concrete dam
Análise de confiabilidade de barragem de concreto construída
a University of São Paulo, Polytechnic School, Post-graduation Program in Civil Engineering, São Paulo, SP, Brazil;b University of São Paulo, School of Engineering of São Carlos, Structural Engineering Department, São Carlos, São Paulo, SP, Brazil.
Received: 11 Sep 2017 • Accepted: 01 Jun 2018 • Available Online:
This is an open-access article distributed under the terms of the Creative Commons Attribution License
K. O. PIRES a
[email protected]://orcid.org/0000-0002-6972-0183
A. T. BECK b
[email protected]://orcid.org/0000-0003-4127-5337
T. N. BITTENCOURT a
[email protected]://orcid.org/0000-0001-6523-2687
M. M. FUTAI a
[email protected]://orcid.org/0000-0002-4969-3085
Abstract
Resumo
The conventional design of concrete gravity dams still follows the deterministic method, which does not directly quantify the effect of uncertainties on the safety of the structure. The theory of structural reliability allows the quantification of safety of these structures, from the quantification of the inherent uncertainties in resistance and loading parameters. This article illustrates application of structural reliability theory to the case study analysis of a built concrete gravity dam. Results show that reliability of the built structure is greater than that of the designed structure. The study compares reliability for design conditions, with the corresponding safety coefficients, illustrating a lack of linearity between safety coefficients and reliability. Furthermore, the study shows which are the failure modes and the design parameters with greater influence on dam safety.
Keywords: structural safety assessment, concrete dams, reliability analysis.
O projeto convencional de barragens de gravidade de concreto ainda segue o método determinístico, que não quantifica diretamente o efeito das incertezas na segurança da estrutura. A teoria de confiabilidade estrutural permite a quantificação da segurança destas estruturas, a partir da quantificação das incertezas inerentes aos parâmetros de resistência e solicitação. Este artigo ilustra a aplicação da confiabilidade estrutural ao estudo de caso de uma barragem de gravidade de concreto construída. Os resultados obtidos mostram que a confiabilidade da estrutura construída é maior do que da estrutura projetada. O estudo compara a confiabilidade na condição de projeto com os coeficientes de segurança resultantes, ilustrando a falta de linearidade entre coeficientes de segurança e confiabilidade. O estudo mostra ainda quais são os modos de falha e parâmetros de projeto com maior influência na segurança da estrutura.
Palavras-chave: avaliação de segurança estrutural, barragens de concreto, análise de confiabilidade.
552 IBRACON Structures and Materials Journal • 2019 • vol. 12 • nº 3
Reliability analysis of built concrete dam
1. Introduction
The usual procedures for verifying the overall stability of concrete dams are based on deterministic methods and use of safety fac-tors. Simplifications normally used in definition of the actions, re-sistance parameters and mechanical behavior models, introduce uncertainties in analysis procedures.Uncertainties are present throughout the entire life cycle of the structure, from conception to the end of its lifespan. The associ-ated risks can be aggravated by the inadequate execution of any phase of an engineering work (design, construction, operation and decommissioning). The uncertainties also change throughout the life cycle, being larger in the design phase. In general, uncertain-ties can be reduced after construction and during the operation, due to the collection of real data and reduction of forecast or pre-diction uncertainties. Uncertainties arise from the incomplete knowledge of the nature of engineering systems we design and operate, but also from the natural randomness of the processes involved. Materials strength and environmental forces are inherently random and cannot be described completely in a deterministic way [1]. To quantify these uncertainties, and to evaluate their effects on the performance and design of engineering systems, concepts and methodologies of probability and statistics should be appropriately applied [2].Uncertainties imply risk, which is defined as the product of proba-bility of occurrence of event (P) and its consequences (C), accord-ing to Equation (1). The risk related to dam failure can be defined as the measure of likelihood and severity of an adverse effect on life, health, property and the environment. Risk can be estimated by combining all scenarios, considering probabilities of occurrence and their consequences [3].
(1)
As described by the International Commission on Large Dams [3], risk analysis can be used as an appropriate tool in the process of risk management. Dam risk analysis requires identification of po-tential failure modes and quantification of conditional probabilities of system responses to different demands.The probability of occurrence of an adverse event is called, generi-cally, probability of failure (Pf) [4], which can be obtained by means of structural reliability analysis. Structural reliability analysis uses probabilistic methods to evaluate the safety of a structure.Structural reliability analysis is related to calculation and prognosis of the probability of failure of a structural system at any stage of its life cycle [5]. It can also be used for calibration of partial safety factors of design codes, as described by the European Committee for Standardization [6].Structural systems must meet safety requirements, which are di-rectly related to structural failure modes, which are formulated in design equations or in terms of limit state equations. The evalua-tion of probabilities of failure is based on the performance function of the structural system.Given a vector X, which gathers the random variables of resistance and loading, a limit state equation g(X) is written in order to divide the domain of X into safety domain (Ds) and failure domain (Df):
(2)
The probability of failure (Pf) can be calculated as the probability of the problem variables belonging to the failure domain:
(3)
where fX (x) is the joint function of probability density of the random variables of the problem. Thus, the calculation of the probability of failure constitutes in evaluating a multidimensional integral over the fault domain.According to Melchers and Beck [5], there are three methods to solve this multidimensional integral:n direct integration: rare application;n numerical integration through Monte Carlo simulation (MCS);n transformation methods: integration is performed by transform-
ing the random variables into the multivariate standard normal space, and through approximations of the integration limit (g(X) ≤ 0).
In this paper, the Monte Carlo Simulation (MCS) and the First Or-der Reliability Method (FORM) techniques are used.Evaluated failure probabilities Pf can be related to the reliability index (β), which is defined as the minimum distance between the limit state equation and the origin of the normal standard space, expressed in (nondimensional) standard deviation units. To assess safety of a structure, the reliability index (β) obtained as described above can be compared with target reliability indexes (βT), which are related to the limit state and to failure consequences.The European Committee for Standardization [6] recommends reliability indexes (β) according to the consequence class of the structure; however, this rule is not related to dams. The docu-ment defines three classes of consequences and the respective target reliability indexes: high class (βT = 5.2/year), middle class (βT = 4.7/year) and low class (βT = 4.2/year). This classification considers consequences of economic, environmental and human life loss for conventional structures (buildings, etc.).it is also im-portant to assess the effect of design factors in safety margins. Safety factors have been determined empirically for different ap-plications and types of materials, and their values incorporated to design criteria all over the world. The argument is that the project meeting these criteria would be sufficiently safe, but unfortunately this is not always true. First, because safety factors will be differ-ent, depending on the mathematical model used and the safety factor settings. In addition, a given safety factor returns different failure probability values, depending on the uncertainties in the in-put data, such as coefficient of variation, number of tests, quality of investigations, measurements in loco, etc. Therefore, the structural safety achieved through safety factors can vary over a wide range of values, in terms of probability of failure [7]. In Brazil, promulgation of the Law on Safety of Dams nº 12.334/2010 [8] reflected societal demands for higher safety levels of dams, and resulted in the demand for reassessment of safety of existing dams, according to deadlines and periodicities established in complementary regulations. These security reas-sessments can be based on concepts of structural reliability.Use of structural reliability methods in analysis of concrete dams is not widespread, but the development of several surveys in this area can be seen, including research carried out by Ellingwood and Tekie [9], Tekie and Ellingwood [10], Westberg [11], Johansson [12],
553IBRACON Structures and Materials Journal • 2019 • vol. 12 • nº 3
K. O. PIRES | M. M. FUTAI | T. N. BITTENCOURT | A. T. BECK
Royet et al. [13], García [14], Bernstone [15], Westberg [16], Gar-cía et al. [4], Westberg and Johansson [17], Su et al. [18], Torres et al. [19], Krounis [20], Krounis et al. [21] and Li et al. [22]. However, none of these surveys addresses the update of reliability of a con-structed dam, in relation to the projected dam.In view of the above, the objective of this paper is to demonstrate use of structural reliability analysis to evaluate the probability of failure of constructed concrete dams, in comparison to the tradi-tionally adopted safety checks. Additionally, it is sought to evaluate the safety factors established in Brazilian design codes, in order to verify their impacts on safety of concrete dams.
2. Global failure modes of concrete dams
Structural reliability analyses require the definition of limit state func-tions, which in turn must mathematically describe the relevant failure modes of the structure under analysis. Concrete dams may fail at the foundation, at the interface between concrete and foundation, and at the concrete. The traditional stability analysis criteria use conventional balance and limit state theories. The usual analyses use models in only two dimensions, neglecting three-dimensional effects. The stability is verified for failure modes related to sliding, overturning and overstressing on the concrete and foundation.In general, the occurrence of overstressing is not a global failure mode. Local crushing or cracking does not necessarily lead to global failure nor to a failure mechanism. Instead, overstressing is considered a service limit state. However, overstressing may be the cause and starting factor that leads to a global failure; hence it must be analysed [16]. This can be verified by the analysis model of combined failure modes presented by Fishman [23]. More details on this issue can also be found in Westberg and Johansson [17].The basic design assumptions are: a) the dam is completely at-tached to foundation rock, along the contact; b) the foundation must withstand loads with acceptable strength; c) the dam con-crete is homogeneous, isotropic and elastic-linear; which together with contraction may transfer load if they are joined, otherwise the entire load is transferred to the foundation; d) horizontal and verti-cal strength vary linearly from upstream face to downstream face; and e) the horizontal shear strength has parabolic variation from upstream to downstream face [24]. There are different methodologies for defining the parameters of analysis and verification of failure modes, as described in the stud-ies carried out by EPRI [25], USACE [26], Ruggeri et al [27] and Johansson [12].In Brazil, the document entitled Criteria for Civil Project of Hy-dropower Plants, prepared by Centrais Elétricas Brasileiras S.A. (ELETROBRÁS), published in 2003, is adopted as a reference for concrete dam projects. According to this guide, the global stability of concrete dams should be checked for failure modes related to sliding, overturning, floatation and overstressing on concrete and foundation. The analyses developed in this paper consider condi-tions of normal, exceptional and limit loading, limited to the inter-face region between concrete and foundation; and to global failure modes related to sliding, overturning and floatation.The Eletrobrás guide [28] defines four conditions of loading: normal or usual, exceptional, limit and construction. The usual loading condition corresponds to all combinations of actions that
present a high probability of occurrence during the design life of the structure, during normal operation or routine maintenance of the site, under normal hydrological conditions. The exceptional loading condition corresponds to a situation of combination of actions with low probability of occurrence during the structures design life. In general, these combinations consider occurrence of only one exceptional action, among exceptional hydrological conditions, defects in the drainage system, atypical action, seis-mic effects, etc.; with other actions at normal loading condition. The limit loading condition corresponds to a situation of combina-tion of actions with very low probability of occurrence during the design life of the structure. In general, these combinations con-sider the occurrence of more than one exceptional action, such as exceptional hydrological conditions, defects in the drainage system, atypical actions, seismic effects, etc.; with other actions at normal loading condition.The construction loading condition corresponds to all combinations of actions that are likely to occur during the execution of the site. They may be due to the loading of construction equipment, struc-tures only partially executed, abnormal loadings during transport of permanent equipment, and any other similar conditions, and occur for short periods in relation to the design life.
2.1 Sliding
Sliding stability is verified by comparison of acting and resisting shear, at the potential rupture surface. The acting shear is depen-dent on the sum of forces parallel to the surface under analysis. For the resisting shear strength, the Mohr-Coulomb failure criterion is used, where the maximum resisting tangential strength (t) for each point of the sliding surface is described by:
(4)
being c the cohesion, σn the effective normal tension for sliding surface and ϕ the friction angle. From the integral of cohesion and normal strength along the surface under analysis, the resisting shear force (R) is obtained:
(5)
The use of Mohr-Coulomb criterion allows determining an enve-lope of resistances for a material that is based on friction and co-hesion parameters, for different levels of normal (σ) and shear (t) strength pairs. This envelope is obtained from laboratory and/or field tests, leading to the rupture shear strength for different levels of normal strength.The design criteria of Eletrobrás [28] establishes the following formu-lation, to verify safety against sliding in concrete-rock interface planes:
(6)
where ∑R is the sum of resistant horizontal forces; ΣT is the sum of acting horizontal forces; ΣN is the sum of effective normal forces on the sliding surface under analysis; ϕ is the characteristic friction angle of the sliding surface under analysis; c is the characteristic cohesion along the sliding surface; A is the effective (compressed) area of contact of the structure on the plane under analysis; fsdϕ and fsdc are the partial safety factors of the materials in relation to
554 IBRACON Structures and Materials Journal • 2019 • vol. 12 • nº 3
Reliability analysis of built concrete dam
friction and cohesion, respectively; and SSF is the safety factor to the total sliding (considers the plots of friction and cohesion resistance).Considering use of the resistance reduction factors for friction angle (fsdϕ) and cohesion (fsdc), the total safety factor should be greater than or equal to 1. If shear rupture is allowed in a certain part of the surface, the cohesion resistance should be considered equal to 0 (c= 0), and the friction angle equal to the residual condition. Table 1 presents the safety factors for sliding safety assessment.Equation (6) is similar to the sliding safety check equation adopted by the U.S. Bureau of Reclamation [24], whose “shear-friction fac-tor of safety” method returns the global safety factor to sliding; that is, it does not introduce partial safety factors.
2.2 Overturning
The stability to overturning is verified by means of comparison be-tween stabilizing and overturning moments, with respect to a point or an effective line of rotation [28], according to:
(7)
where OSF is the safety factor for overturning; ΣMe is the sum of acting stabilizing moments on the structure, considered as such: dead load, the minimum permanent loads and the dead load of the permanent equipment, if installed; and ΣMt is the sum of overturn-ing moments, due to action of destabilizing loads, such as hydro-static pressure, uplift pressure, silt pressure, etc. The stabilizing effects of cohesion and friction on the surfaces in contact with the foundation should be rejected. Table 1 presents the safety factors to be used in assessing safety to overturning.
2.3 Flotation
The stability to flotation is verified by means of the ratio between the sum of the gravitational forces and the sum of uplift pressure forces at the potential rupture surface [28], according to:
(8)
where FSF is the safety factor for flotation; ΣV is the sum of gravi-tational forces; and ΣU is the sum of uplift pressure forces. The calculation considers the region delimited in blocks, rejecting any
favourable contributions due to cohesion and friction between blocks or between structure and foundation. Table 1 presents the safety factors to be used in assessment of safety against flotation.
3. Structural reliability methods
In order to solve the structural reliability problem, this paper makes use of the First Order Reliability Method (FORM) and of Monte Carlo Simulation (MCS). The Structural Risk Analysis and Design (StRAnD) software, developed by the São Carlos School of En-gineering, University of São Paulo [29], is employed. Importance sampling using design points is used, in Monte Carlo Simulation.Transformation methods involve mapping the random variables from the original design space to standard normal space, a search for the design point in standard normal space, and approximations of G(X) at the design point. The design point is found from solution of a mathematical programming problem, since in standard normal space the design point is the point on the limit state equation clos-est to the origin. The design point is also the most likely point (or mode) of the failure domain. The (minimum) distance between the design point and the origin of standard normal space is called the reliability index (β). The First Order (FORM) solution involves an approximation of the integration domain by a hyperplane [5]:
(9)
being β the reliability index and Φ the standard normal cumulative distribution.Monte Carlo simulation (MCS) allows solving with same level of dif-ficulty problems with any number of random variables and/or large model complexity (linear or nonlinear, single or multiple limit state functions) [1]. Samples (trials) of random variables are obtained from the joint density (fX (x), Eq. (3)), and the probability of failure is estimated as:
(10)
here is the estimated probability of failure, I[ ] is the indicator function, Xi is sample vector i, Nf is the number of points in the failure domain, and N is the number of trials. The number of trials must be large enough in order to obtain the probability of failure with small statistical error.
Table 1Minimum values of safety factors
Safety factorLoading conditions
Usual Exceptional Limit Constructionfsdc 3.0 (4.0) 1.5 (2.0) 1.3 (2.0) 2.0 (2.5)fsdϕ 1.5 (2.0) 1.1 (1.3) 1.1 (1.3) 1.3 (1.5)
Sliding Safety Factor(SSF-total) ≥ 1 ≥ 1 ≥ 1 ≥ 1
Overturning Safety Factor(OSF) 1.5 1.2 1.1 1.3
Flotation Safety Factor(FSF) 1.3 1.1 1.1 1.2
Ref.: Eletrobrás [28];fsdc reduction factor of the cohesion resistance;fsdϕ reduction factor of the friction resistance;The factors of reduction in brackets should be adopted when the knowledge of materials is poor.
555IBRACON Structures and Materials Journal • 2019 • vol. 12 • nº 3
K. O. PIRES | M. M. FUTAI | T. N. BITTENCOURT | A. T. BECK
Equation (10) is based on a sample of finite size; hence it is subject to a statistical error that corresponds to the variance of I[Xi]. The variance of corresponds to the statistical error of the simulation and depends on the order of magnitude of the exact probability of failure Pf. The lower the probability of failure, the greater is the number of simulations required to obtain the same variance.The coefficient of variation (COV) of Pf can be obtained from Equa-tion (11). Evaluation of a probability of failure of the order of 10-p with COV ≤ 10%, requires approximately 10p+2 samples, making the number of simulations prohibitive for very low probabilities of failure [5]:
(11)
To reduce the number of required simulations, variance reduction techniques are used. In this paper, the technique of importance sampling using design points is used. This technique moves the sampling points to the failure domain, centering the sampling func-tion at design point coordinates. The design points are obtained from the FORM solution, as detailed in Melchers & Beck [5].
4. Limit state equations
Considering the failure modes described above, the loading condi-tions and the characteristics of the dam-foundation interface, the limit state equations are written as follows.The limit state function for sliding along the surface under analysis is defined by:
(12)
(13)
where TR is the sum of the resistant forces on sliding surface, TS is the sum of acting forces parallel to the sliding surface, N' is the sum of normal forces to sliding surface, ϕi is internal friction angle of concrete-rock interface, c is cohesion of concrete-rock interface, and A is compressed effective area. Expanding Equation (13), we have:
(14)
where γc is the specific weight of concrete, Vc is concrete volume, Ww1 is the upstream water weight, U is the sum of acting uplift pressure forces, Uc is the uplift pressure acting on fissure open-ings, when present, and Ww2 is the downstream water weight. U is obtained from:
(15)
where xd1 is the distance between the drains and the upstream face, or the end of the fissure, when present, xd2 is the distance be-tween drains and downstream face, h1 corresponds to headwater depth, h2 corresponds to tailwater depth, h3 corresponds to water depth equivalent to uplift in drainage line, and γw is the specific weight of water. h3 is obtained by:
(16)
(17)
where k is the coefficient of hydraulic inefficiency, h4 corresponds to height of the drainage gallery, in relation to concrete-rock in-terface, iu is the coefficient of increase of uplift, and hy1 is the dif-ference in depth between the maximum elevation and the normal elevation of the reservoir.The limit state function for overturning, with respect to the most extreme downstream point of the surface under analysis, is de-fined as:
(18)
(19)
where MR corresponds to the sum of resisting moments and MS is the sum of moments tending to cause overturning, and the indexes Ww1, Wc, Ww2, H2, U, Uc, H1, correspond respectively to the mo-ments related to the upstream water weight, dam concrete weight, downstream water weight, downstream hydrostatic thrust, uplift, uplift acting on fissure opening, when present, and upstream hy-drostatic thrust. Expanding Equation (19), we have:
(20)
where lw1 is the horizontal distance between upstream water cen-ter of the mass and downstream face on reference surface, lwc
is the horizontal distance between center of mass of concrete dam and downstream face on the reference surface, lw2 is the horizontal distance between the center of mass of downstream water and the downstream face on reference surface, Lc is the length of a crack, when present, lc is the horizontal distance between the center of the crack and downstream face on the surface of reference.The limit state function for floatation is defined by:
(21)
(22)
where N is the sum of gravitational forces and U is the sum of act-ing uplift pressure forces.
5. Case study
5.1 Dam description
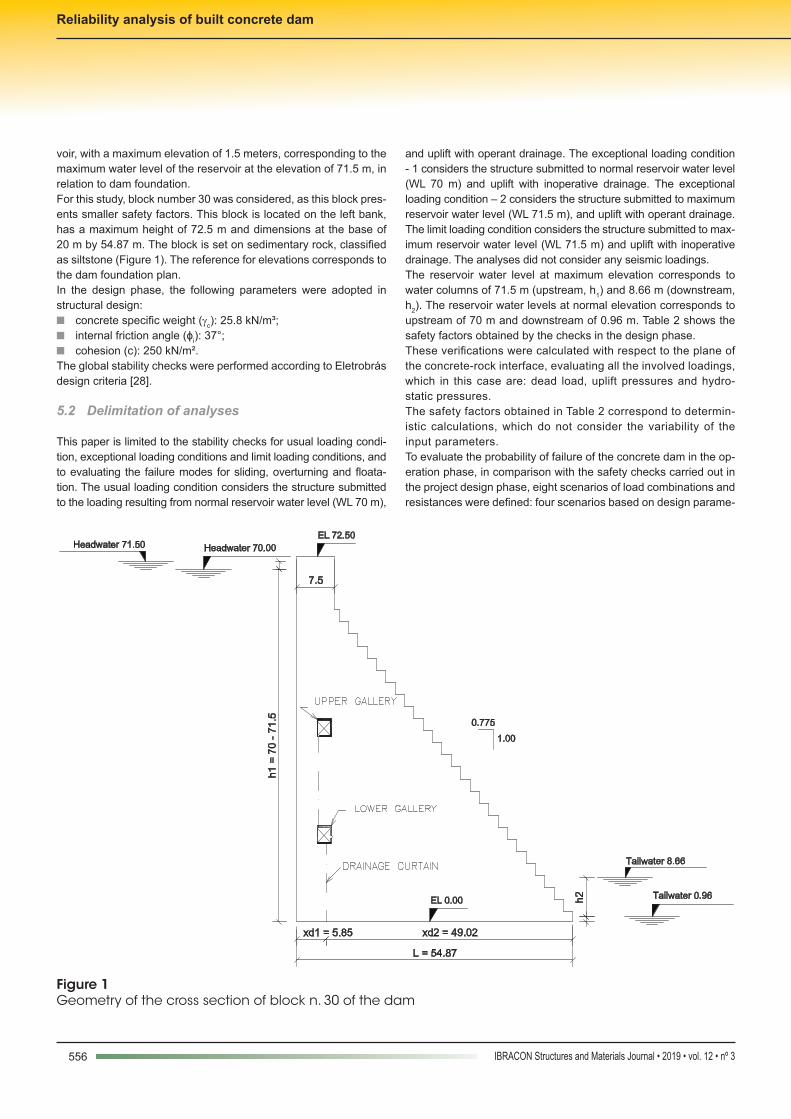
The gravity dam under study is made of roller-compacted concrete, has a maximum height of 82.5 m and a crest length of 746 m. The contraction joints were spaced at every 20 meters at most, totalling 41 concrete blocks. The upstream face is vertical and the down-stream face has a slope of 0.775 : 1 (H : V). The crest of the dam is 7.50 m wide.The dam has two drainage galleries with drain lines located at 5.85 m from the upstream face, with the purpose of relieving uplift at the concrete-rock foundation interface and interstitial pressure of the mass of concrete.The spillway was dimensioned for the inflow ten-thousand-year flood, which provides for damping of the affluent flow in the reser-
556 IBRACON Structures and Materials Journal • 2019 • vol. 12 • nº 3
Reliability analysis of built concrete dam
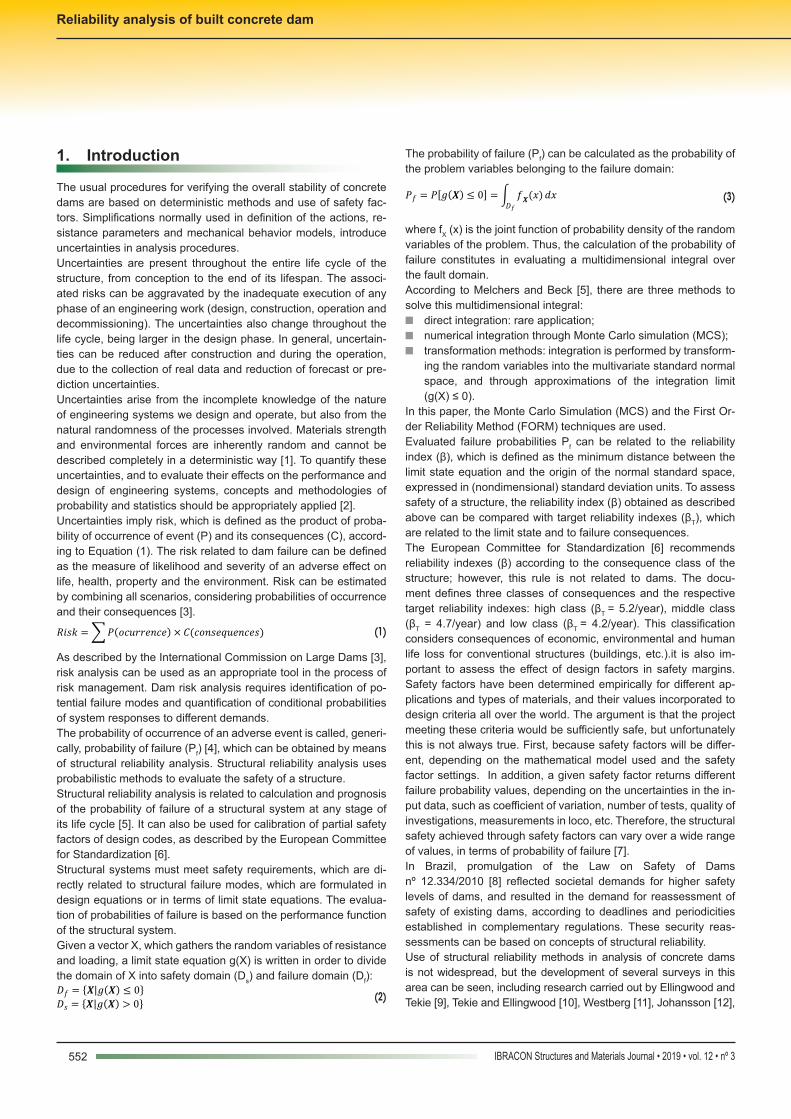
voir, with a maximum elevation of 1.5 meters, corresponding to the maximum water level of the reservoir at the elevation of 71.5 m, in relation to dam foundation.For this study, block number 30 was considered, as this block pres-ents smaller safety factors. This block is located on the left bank, has a maximum height of 72.5 m and dimensions at the base of 20 m by 54.87 m. The block is set on sedimentary rock, classified as siltstone (Figure 1). The reference for elevations corresponds to the dam foundation plan.In the design phase, the following parameters were adopted in structural design:n concrete specific weight (γc): 25.8 kN/m³; n internal friction angle (ϕi): 37°;n cohesion (c): 250 kN/m².The global stability checks were performed according to Eletrobrás design criteria [28].
5.2 Delimitation of analyses
This paper is limited to the stability checks for usual loading condi-tion, exceptional loading conditions and limit loading conditions, and to evaluating the failure modes for sliding, overturning and floata-tion. The usual loading condition considers the structure submitted to the loading resulting from normal reservoir water level (WL 70 m),
and uplift with operant drainage. The exceptional loading condition - 1 considers the structure submitted to normal reservoir water level (WL 70 m) and uplift with inoperative drainage. The exceptional loading condition – 2 considers the structure submitted to maximum reservoir water level (WL 71.5 m), and uplift with operant drainage. The limit loading condition considers the structure submitted to max-imum reservoir water level (WL 71.5 m) and uplift with inoperative drainage. The analyses did not consider any seismic loadings.The reservoir water level at maximum elevation corresponds to water columns of 71.5 m (upstream, h1) and 8.66 m (downstream, h2). The reservoir water levels at normal elevation corresponds to upstream of 70 m and downstream of 0.96 m. Table 2 shows the safety factors obtained by the checks in the design phase.These verifications were calculated with respect to the plane of the concrete-rock interface, evaluating all the involved loadings, which in this case are: dead load, uplift pressures and hydro-static pressures. The safety factors obtained in Table 2 correspond to determin-istic calculations, which do not consider the variability of the input parameters.To evaluate the probability of failure of the concrete dam in the op-eration phase, in comparison with the safety checks carried out in the project design phase, eight scenarios of load combinations and resistances were defined: four scenarios based on design parame-
Figure 1Geometry of the cross section of block n. 30 of the dam
Headwater 71.50 Headwater 70.00
Tailwater 0.96
Tailwater 8.66
EL 72.50
EL 0.00
L = 54.87
xd1 = 5.85
h1 =
70 -
71.5
.
h2
.
xd2 = 49.02
0.775
1.00
7.5

557IBRACON Structures and Materials Journal • 2019 • vol. 12 • nº 3
K. O. PIRES | M. M. FUTAI | T. N. BITTENCOURT | A. T. BECK
ters, and four scenarios based on dam data obtained in operation. Table 3 presents a summary of load combination and resistances scenarios, and the parameters used in each case.Considering that the exceptional and limit loading conditions are related to conditional events, of small probability of occur-rence, it is necessary to evaluate the unconditional probabil-ity of failure, for each failure mode. The events considered are the maximum water level in the reservoir, and the non-operational foundation drains. The failure probabilities calcu-lated under these circumstances are conditional probabilities, conditional on occurrence of each loading scenario. As the in-volved events are considered independent, the unconditional probability calculation consists in the multiplication of the conditional probability by the occurrence probability of each loading event scenario.Considering the sizing information of the previously described spill-way, the occurrence of maximum reservoir level has a mean return time of 1/10000 years. For the event related to non-operational drainage, an average lifespan of 50 years was assumed, with mean return time of 1/50 years. This leads to one expected occur-rence during the lifetime, with an occurrence probability of 63%.
5.3 Definition of variables
A summary of random variables for the problem is presented in Table 4: statistical distributions, mean value and standard devia-tion are presented.
5.3.1 Specificconcreteweight
The statistical data on specific weight of concrete in operation phase were obtained from 29 concrete samples, extracted from the mass of dam, which were obtained by means of rotary drilling in different regions of the structure. Specific weight of concrete was obtained as γc (kN/m³) ~ N (26; 0.94). For the scenarios related to the design phase, γc (kN/m³) ~ N (25.8; 1.29) was adopted, which corresponds to weight and COV (of 5%) measured in construction, during concrete production technological control of the.
5.3.2 Internalfrictionangleandcohesion of concrete-rock contact
For the parameters of internal friction angle and cohesion of the
Table 2Safety factors obtained and required
Safety assessmentLoading conditions
Usual Exceptional-1 Exceptional-2 Limit
Sliding Safety Factor(SSF)
fsdc 3.0 2.0 2.0 1.3fsdϕ 1.5 1.3 1.3 1.1
Required ≥ 1 ≥ 1 ≥ 1 ≥ 1Obtained 1.01 1.04 1.11 1.15
Overturning Safety Factor(OSF)
Required 1.5 1.2 1.2 1.1Obtained 1.89 1.68 1.46 1.32
Flotation Safety Factor(FSF)
Required 1.3 1.1 1.1 1.1Obtained 4.5 3.56 2.6 2.19
Table 3Scenarios of loading and resistances combinations
Load and resistances
combinations
Load conditions
h1
(m)h2
(m)Lc
(m)
Mean of random variablesγc
(kN/m³)fi
(°)c
(kN/m²) k iu
D1 Usual 70 0.96 – 25.80 37.00 250 0.33 -D2 Exceptional 1 70 0.96 – 25.80 37.00 250 0.89 -D3 Exceptional 2 71.5 8.66 5.55 25.80 37.00 250 0.33 1.00 D4 Limit 71.5 8.66 5.55 25.80 37.00 250 0.99 1.00 O1 Usual* 70 0.96 – 26.00 41.99 700 0.18 -O2 Exceptional 1* 70 0.96 – 26.00 41.99 700 0.89 -O3 Exceptional 2* 71.5 8.66 5.55 26.00 41.99 700 0.18 0.50 O4 Limit* 71.5 8.66 5.55 26.00 41.99 700 0.99 0.50
* Loading condition adjusted according to data obtained in the operation phase;D1, D2, D3 and D4 are scenarios of the design phase; O1, O2, O3 and O4 are scenarios of the operation phase; h1 headwater;h2 tailwater;Lc crack length;γc concrete specific weight;fi internal friction angle;c concrete-rock interface cohesion;k coefficient of hydraulic inefficiency;iu coefficient of increase of uplift pressure.
558 IBRACON Structures and Materials Journal • 2019 • vol. 12 • nº 3
Reliability analysis of built concrete dam
concrete-rock interface, no tests were performed with the dam ma-terial under study. The adopted parameters were defined based on studies of other authors. As the analysis model presented previ-ously does not predict use of roughness or basic friction angle, ref-erence values coming from tests of intact connection of concrete-rock interface were considered (for research only).Studies carried out by EPRI [25] of the concrete-rock interface of eighteen dams and different types of rock, show friction angle val-ues between 54 and 68º; and cohesion values between 1.3 and 1.9 MPa. Rocha (1964), based on tests of 70 concrete blocks at 6 different dam sites, obtained friction angles between 53 and 63º; and cohesion values between 0.1 and 0.7 MPa. Link (1969), ob-tained friction angles between 45 and 52º; and cohesion values
between 0.1 and 3.0 MPa. Lo et al. (1991) evaluated samples of the intact connection of the concrete-rock interface, obtaining a typical value of 62º for the internal friction angle, and cohesion of 2.2 Mpa [27].Fishman [23] presents results of internal friction angle and cohe-sion of 32 large-scale shear tests performed on concrete blocks on different types of rock, from the foundation of 24 dams. The study presents values for the internal friction angle with mean of 52.1º, standard deviation of 8.8º, minimum value of 27.5º and maximum value of 63º. For cohesion, the mean of 1.13 MPa, standard devia-tion of 0.74 MPa, minimum value of 0.06 MPa and maximum value of 2.6 MPa were found. These tests were performed on igneous, metamorphic and sedimentary rocks. Krounis et al. [30] performed
Table 4Summary of random variables
Random variables(R.V.) Unit Distribution Mean SD COV
(%)Concrete specific weight (γc) a kN/m³ Normal 25.80 1.29 5 h, D1–4
Concrete specific weight (γc) b kN/m³ Normal 26.00 0.94 3,62 O1–4
Internal friction angle (fi) a º Normal 37 9.99 27 i, D1–4
Internal friction angle (fi) c º Normal 41.99 11.34 27 O1–4
Concrete–rock interface cohesion (c) a kN/m² Lognormal 250 100.00 40 i, D1–4
Concrete–rock interface cohesion (c) c kN/m² Lognormal 700 280.00 40 O1–4
Coefficient of hydraulic inefficiency (k) d – Normal 0.18 0.03 15 O1, O3
Coefficient of hydraulic inefficiency (k) a – Normal 0.33 0.10 30 j, D1, D3
Coefficient of hydraulic inefficiency (k) e – Normal 0.89 0.13 15 k, O2
Coefficient of hydraulic inefficiency (k) e – Normal 0.89 0.27 30 j, D2
Coefficient of hydraulic inefficiency (k) e – Normal 0.99 0.15 15 k, O4
Coefficient of hydraulic inefficiency (k) e – Normal 0.99 0.30 30 j, D4
Coefficient of increase of uplift pressures (iu) f – Uniform 0.5 0.29 58 O3, O4
Coefficient of increase of uplift pressures (iu) g – Deterministic 1 – – D3, D4
a based on the dam design parameters;b based on the measurement of specimens extracted from the concrete of the dam;c based on the China Electricity Council [31];d based on the measurement of the PZC01 piezometer during a 4–year period;e based on the dam design parameters and theoretical uplift pressure;f assumed;g considered with deterministic value 1;h based on the measurement of specimens made during the construction of the dam;i considered the same COV described in the China Electricity Council [31];j based on the measurement of others piezometers installed in block 30 of the dam foundation;k considered the same COV of the piezometer PZC01;O1–4, O1, O2, O3 and O4 operation phase scenarios;D1–4, D1, D2, D3 and D4 design phase scenarios.
Table 5Friction angle and cohesion parameters of concrete to rock interface
Rock properties of dam foundation
Friction angle(N distribution)
Cohesion(LN distribution)
Mean (º)
SD (º)
Mean(MPa)
SD(MPa)
Category I: dense and sound, distance between cracks >1 m56.31 16.70 1.5 0.5452.43 14.57 1.3 0.47
Category II: sound, weakly weathered massive rock with crack spaces 0.5-1 m
52.43 14.57 1.3 0.4747.73 11.86 1.1 0.40
Category III: rock mass of medium sound, crack spaces 0.3-0.5 m47.73 11.86 1.1 0.4041.99 11.31 0.7 0.28
Ref.: China Electricity Council [31]
559IBRACON Structures and Materials Journal • 2019 • vol. 12 • nº 3
K. O. PIRES | M. M. FUTAI | T. N. BITTENCOURT | A. T. BECK
direct shear tests on cubic samples of concrete-rock, obtaining re-sults for intact connection of the concrete-rock interface, with val-ues of internal friction angle of 54.4º and cohesion of 2.97 MPa.According to the results of these studies, a wide range of values is observed, varying between 27.5 and 68º for the internal friction angle; and between 0.06 MPa and 3 MPa for cohesion, confirming the high degree of uncertainty present in these parameters. In ad-dition, it is observed that only a few studies present data that allow the calculation of statistical parameters.The Chinese standard for hydroelectric power plant designs, China Electricity Council [31], presents reference values for friction angle and cohesion according to the classification of the foundation rock. The mean parameters and standard deviation are presented for three rock categories. Table 5 presents the summary of the refer-ence values for each rock category. It can be observed that the reference values are within the same range of other presented studies. Besides the rock category, the Chinese standard appoints other parameters of the rock mass, such as the resistance and elastic modulus for classification.The concrete block of the dam under study is set on siltstone, which is a sedimentary rock. The tests performed on rock samples during dam construction showed mean values of resistance to compres-
sion of 61.58 MPa; and elastic modulus of 31.77 GPa. Based on dam foundation mapping, a GSI (Geological Strength Index) of 65 was considered; and the elastic modulus of the mass of rock was estimated as 8.4 GPa. The analyses of the drilling samples and the surface mapping of the foundation indicated spacing between fractures varying from 0.1 to 1 meter.Based on this information, on the previous studies and on the ref-erences values described in Table 5, the values fi (°) ~ N (41.99; 11.31) and c (kN/m²) ~ LN (700; 280) were considered for the con-crete-rock connection interface, in the operation phase.For the design phase scenarios, the same material parameters were considered, but using the same COV as for the operation phase, resulting in fi (°) ~ N (37; 9.99) and c (kN/m²) ~ LN (250; 100).
5.3.3 Coefficientofhydraulicinefficiency
The calculation of the uplift pressure acting on the concrete dam foundation, defined by deterministic design criteria, is usually based on Darcy’s law, which predicts the linear reduction of down-stream pressure to upstream pressure. When there is no drainage system at dam foundation, or when the drainage is inoperative, the upstream and downstream uplift pressures are equivalent to the
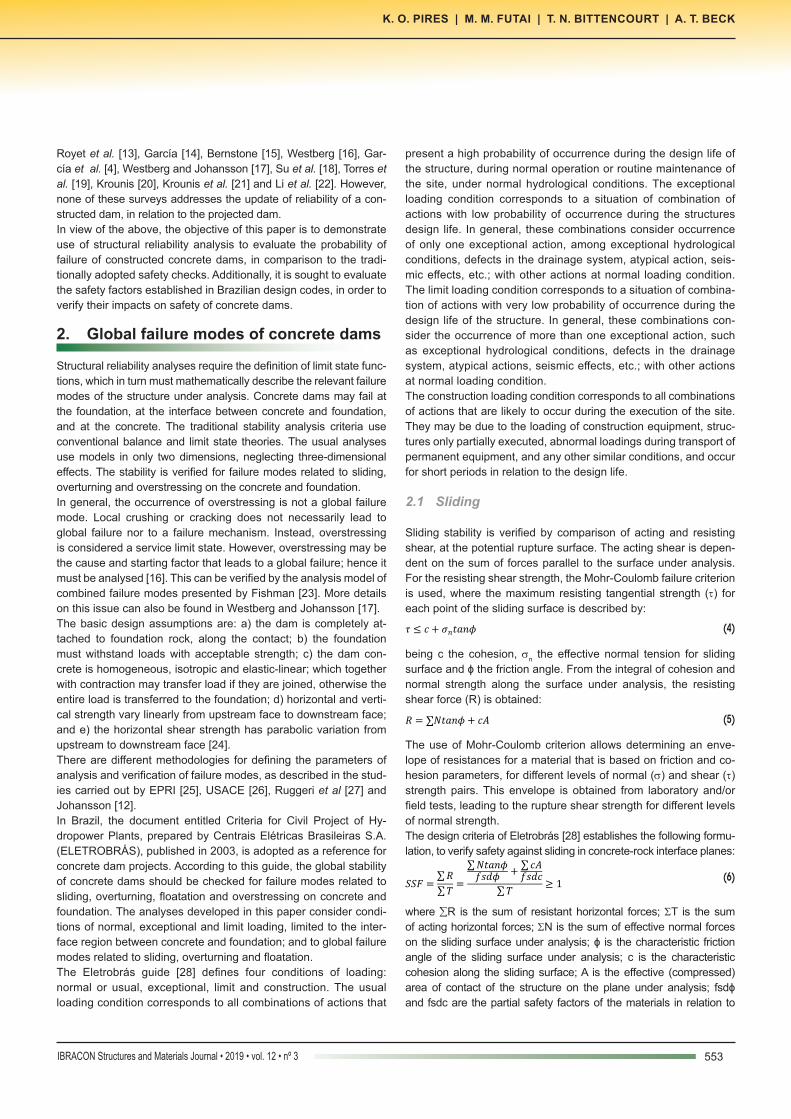
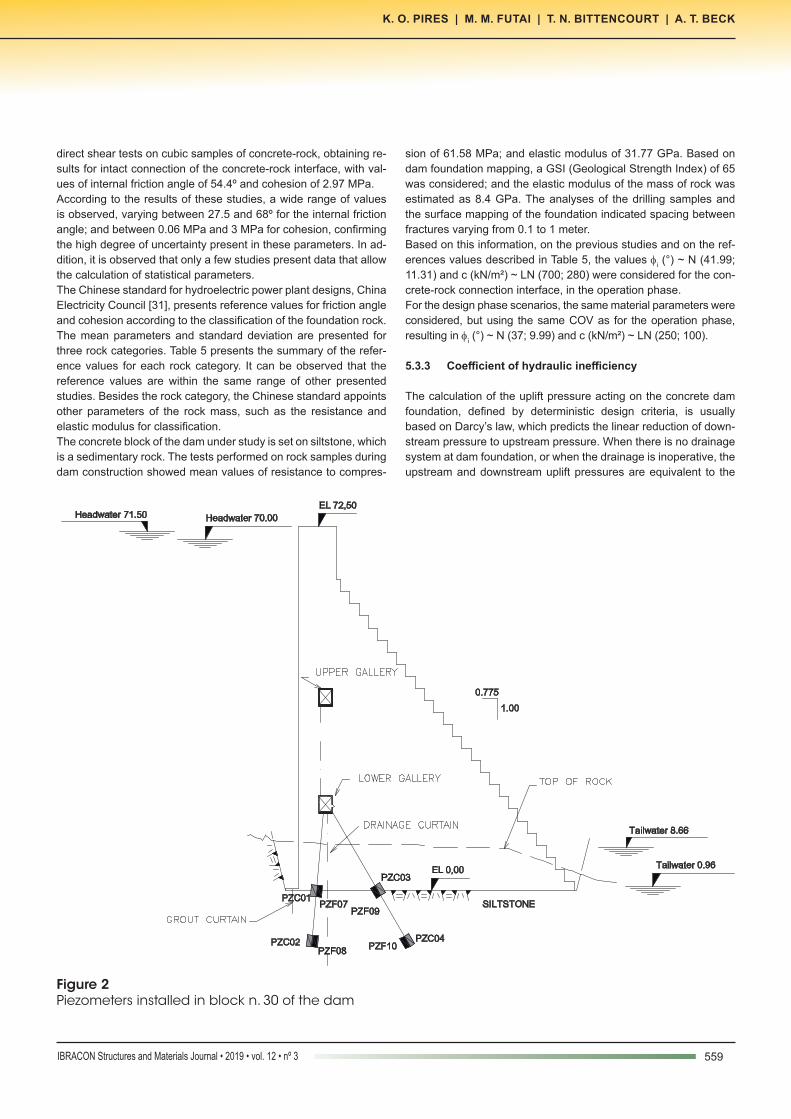
Figure 2Piezometers installed in block n. 30 of the dam
PZC02PZF08
PZF07PZF09
PZF10PZC04
PZC03
SILTSTONE
EL 72,50
EL 0,00
Headwater 71.50 Headwater 70.00
Tailwater 0.96
Tailwater 8.66
0.775
1.00
PZC01
560 IBRACON Structures and Materials Journal • 2019 • vol. 12 • nº 3
Reliability analysis of built concrete dam
respective water columns in the upstream and downstream reser-voirs of the dam.
When there is a drainage system acting on the dam foundation, the models may differ in the definition of drainage efficiency (E). According to USBR [24], the drainage efficiency is 0 <E <0.66, while for USACE [32], drainage efficiency is 0 <E <1. In formu-lations for the calculation of uplift pressure, instead of using hy-draulic efficiency (E), the coefficient of hydraulic inefficiency (k) is normally used, which is given by:
(23)
Eletrobrás [28] adopts the following formulations for the calculation of the uplift pressure in the drainage line:
(24)
(25)
Similar to the criteria established by USBR [24] for normal drainage
Table 6Maximum annual values of k
Year Headwater (m)
Maximumpressure(m.w.c.)
k
2016 70.01 11.21 0.152015 70.01 14.34 0.192014 70.01 15.71 0.212013 70.04 13.51 0.18
Mean 0.18SD 0.03
COV 0.15m.w.c.: meters of water column
Table 7Values of (β), (Pf) and (α) for each failure mode and scenarios
ScenariosD1 D2 O1 O2 D3 D4 O3 O4
(design) (dam built) (design) (dam built)Headwater h1(m) 70 70 70 70 71.5 71.5 71.5 71.5
Tailwater h2(m) 0.96 0.96 0.96 0.96 8.66 8.66 8.66 8.66
Mean R.V.
γc 25.80 25.80 26.00 26.00 25.80 25.80 26.00 26.00fi 37.00 37.00 41.99 41.99 37.00 37.00 41.99 41.99c 250 250 700 700 250 250 700 700k 0.33 0.89 0.18 0.89 0.33 0.99 0.18 0.99iu – – – – 1.00 1.00 0.50 0.50
Sliding SSF 1.01 1.03 – – 1.11 1.15 – –βFORM 1.81 1.35 3.42 3.17 1.48 0.88 3.15 2.82PfFORM 3.50E-02 8.91E-02 3.15E-04 7.67E-04 6.92E-02 1.91E-01 8.15E-04 2.43E-03βMC 1.87 1.40 3.47 3.23 1.55 0.91 3.24 2.89PfMC 3.06E-02 8.13E-02 2.65E-04 6.11E-04 6.06E-02 1.80E-01 5.91E-04 1.90E-03
α values γc 0.01 0.03 0.00 0.00 0.02 0.04 0.00 0.01fi 0.81 0.68 0.66 0.55 0.81 0.64 0.66 0.53c 0.17 0.24 0.34 0.45 0.17 0.23 0.34 0.46k 0.00 0.06 0.00 0.00 0.01 0.09 0.00 0.01iu – – – – 0.00 0.00 0.00 0.00
Overturning OSF 1.89 1.46 – – 1.68 1.32 – –βFORM > 8 3.57 > 8 6.28 7.28 2.82 > 8 5.14PfFORM < 6E-16 1.76E-04 < 6E-16 1.67E-10 1.67E-13 2.43E-03 < 6E-16 1.40E-07βMC > 8 3.57 > 8 6.27 7.30 2.78 > 8 5.22PfMC < 6E-16 1.79E-04 < 6E-16 1.81E-10 1.47E-13 2.75E-03 < 6E-16 8.78E-08
α values γc 0.77 0.32 0.96 0.50 0.81 0.33 0.97 0.50k 0.23 0.68 0.04 0.50 0.19 0.67 0.03 0.48iu – – – – 0.00 0.00 0.00 0.02
Flotation FSF 4.5 2.6 – – 3.56 2.19 – –βFORM > 8 6.68 > 8 > 8 > 8 5.81 > 8 > 8PfFORM < 6E-16 1.18E-11 < 6E-16 < 6E-16 < 6E-16 3.15E-09 < 6E-16 < 6E-16βMC > 8 6.68 > 8 > 8 > 8 5.85 > 8 > 8PfMC < 6E-16 1.17E-11 < 6E-16 < 6E-16 < 6E-16 2.50E-09 < 6E-16 < 6E-16
α values γc 0.75 0.29 0.96 0.47 0.78 0.28 0.95 0.45k 0.25 0.71 0.04 0.53 0.22 0.72 0.04 0.54iu - - - - 0.00 0.00 0.02 0.01
SSF (Sliding Safety Factor); OSF (Overturning Safety Factor); FSF (Flotation Safety Factor).

561IBRACON Structures and Materials Journal • 2019 • vol. 12 • nº 3
K. O. PIRES | M. M. FUTAI | T. N. BITTENCOURT | A. T. BECK
situations, Eletrobrás [28] adopts a coefficient of hydraulic ineffi-ciency of 0.33. According to USBR [24], the value of k = 0.33 was established based on historical data.Statistical parameters for coefficients of hydraulic inefficiency were based on Equation (24). Although (h2 < h4) for the dam under study, there is a pumping system installed at the concrete-rock interface level, such that indeed h2 > h4.The definition of the mean and standard deviation was based on the 4-year historic of monitored data of the uplift pressure, acting at the foundation of block nº 30. Eight piezometers were installed at the foundation of this block (Figure 2), and the PZC 01 piezometer was chosen for evaluation of k. The criterion of choice was based on the highest observed pressures, installation position and historical data consistency. The calculation methodology considered the maximum annual values of piezometric pressure for the water level of the normal reservoir (WL 70.00 m), obtaining the values presented in Table 6.For the scenarios related to the operation phase of the dam, with operant drainage, based on the data presented in Table 8, the value k ~ N (0.18; 0.03) was defined. For the scenarios related to the operation phase, with inoperative drainage, k was adopted as corresponding to the limit established by the model for inoperative drainage (Equations (26) and (27)), but with the same COV calcu-lated in Table 8.
(26)
(27)
For the scenarios related to the dam design phase, the coefficients of hydraulic inefficiency were adopted according to Eletrobrás rec-ommendations [28]. Considering the greater uncertainties in the design phase, the COV for these scenarios was defined as the mean of the coefficients of variation of the piezometers installed in the same block of the dam.
5.3.4 Coefficientofupliftpressureincrement
Exceptional events of reservoir water level are rare and of short duration, and the response of the elevation of uplift pressure de-pends on how the discontinuities are influenced by the tensions induced by the dam-reservoir system [27]. Thus, in the absence of monitoring data during such events, which would allow under-standing the actual behaviour, it is reasonable to consider that slow and sudden variations of the uplift pressure may occur.Based on the above, an uplift pressure increment coefficient was defined as a random variable for exceptional cases of reservoir level, with uniform distribution on the interval [0 ,1], given by iu ~ U (0.5; 0.29).
5.4 Results
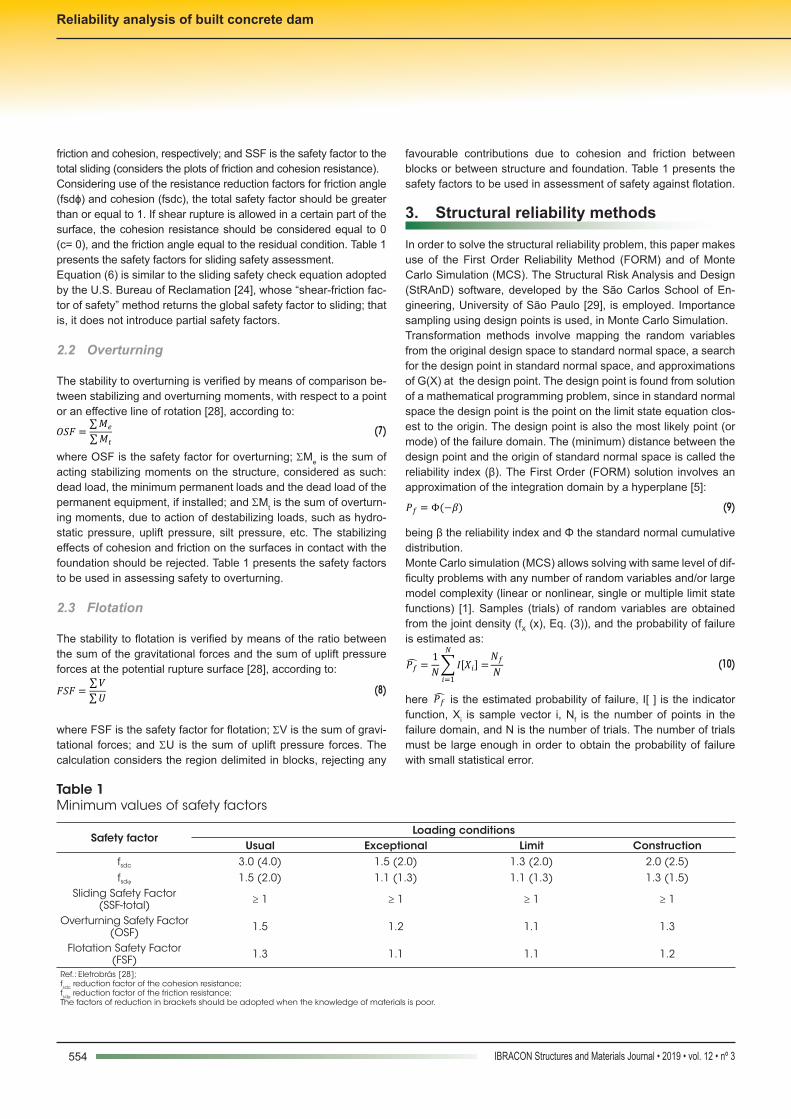
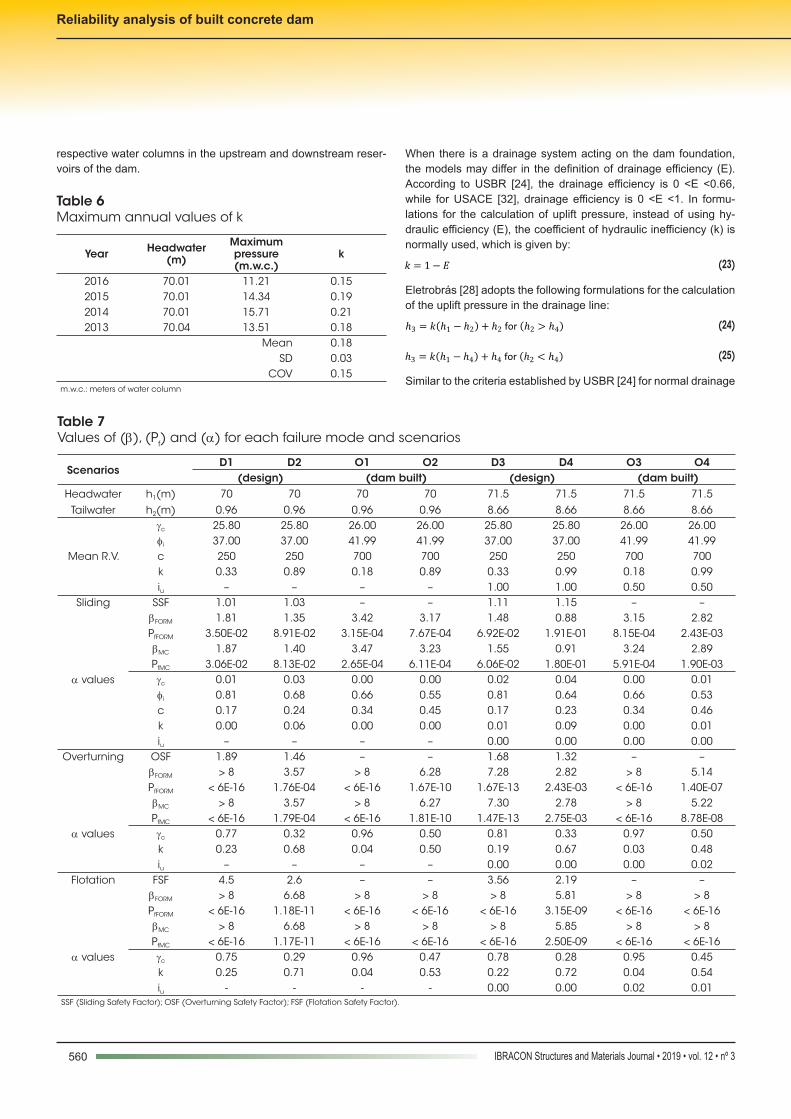
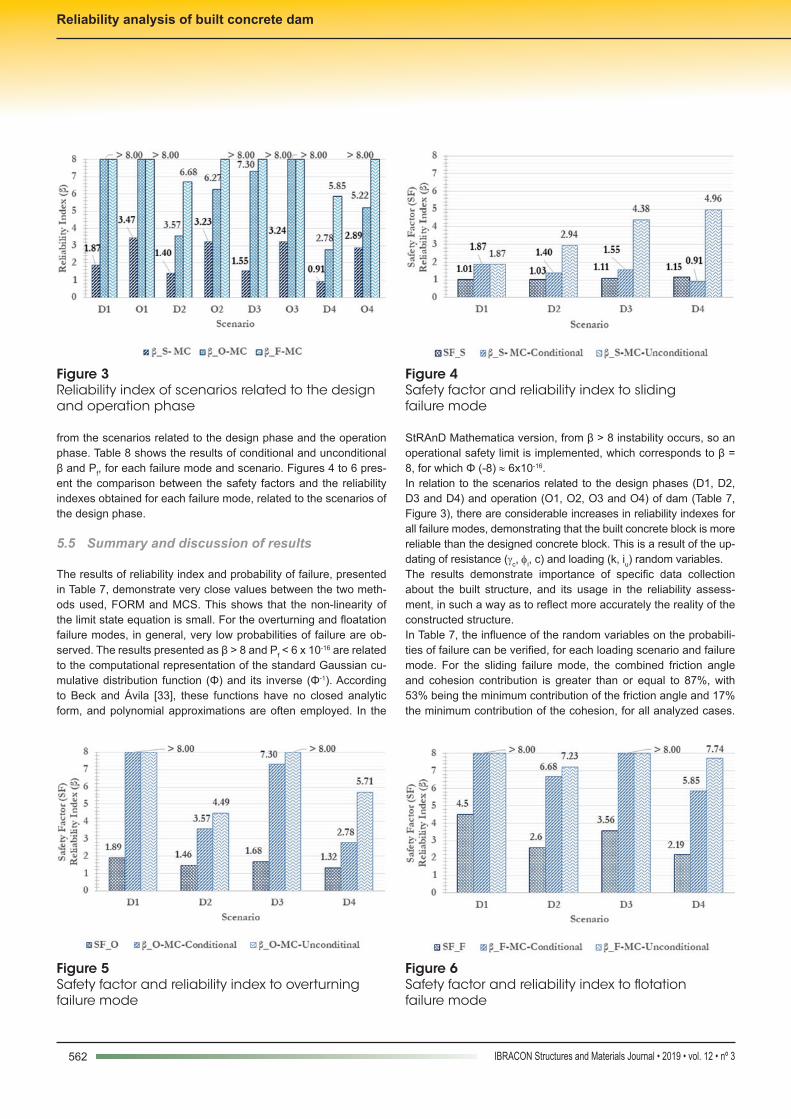
The results obtained by FORM and MCS in terms of reliability in-dex (β) and conditional probability of failure (Pf), for each failure mode and scenario, are presented in Table 7. The sensitivity coef-ficients (α), for each random variable, are also presented. Figure 3 shows the comparison between the reliability indexes resulting
Table 8Values of (β) e (Pf) conditional and unconditional for each failure mode and scenarios
ScenariosD1 D2 O1 O2 D3 D4 O3 O4
(design) (dam built) (design) (dam built)Headwater h1(m) 70 70 70 70 71.5 71.5 71.5 71.5
Tailwater h2(m) 0.96 0.96 0.96 0.96 8.66 8.66 8.66 8.66
Mean R.V.
γc 25.8 25.8 26 26 25.8 25.8 26 26fi 37 37 41.99 41.99 37 37 41.99 41.99c 250 250 700 700 250 250 700 700k 0.33 0.89 0.18 0.89 0.33 0.99 0.18 0.99iu – – – – 1 1 0.5 0.5
Sliding SSF 1.01 1.03 – – 1.11 1.15 – –
CβMC 1.87 1.4 3.47 3.23 1.55 0.91 3.24 2.89PfMC 3.06E-02 8.13E-02 2.65E-04 6.11E-04 6.06E-02 1.80E-01 5.91E-04 1.90E-03
UβMC 1.87 2.94 3.47 4.22 4.37 4.96 5.30 5.77PfMC 3.06E-02 1.63E-03 2.65E-04 1.22E-05 6.06E-06 3.60E-07 5.91E-08 3.81E-09
Overturning OSF 1.89 1.46 – – 1.68 1.32 - -
CβMC > 8 3.57 > 8 6.27 7.3 2.78 > 8 5.22PfMC < 6E-16 1.79E-04 < 6E-16 1.81E-10 1.47E-13 2.75E-03 < 6E-16 8.78E-08
UβMC > 8 4.49 > 8 6.85 > 8 5.71 > 8 7.27PfMC < 6E-16 3.58E-06 < 6E-16 3.63E-12 < 6E-16 5.49E-09 < 6E-16 1.76E-13
Flotation FSF 4.5 2.6 – – 3.56 2.19 – –
CβMC > 8 6.68 > 8 > 8 > 8 5.85 > 8 > 8PfMC < 6E-16 1.17E-11 < 6E-16 < 6E-16 < 6E-16 2.50E-09 < 6E-16 < 6E-16
UβMC > 8 7.23 > 8 > 8 > 8 7.74 > 8 > 8PfMC < 6E-16 2.33E-13 < 6E-16 < 6E-16 < 6E-16 5.01E-15 < 6E-16 < 6E-16
C conditional probability values; U unconditional probability values.
562 IBRACON Structures and Materials Journal • 2019 • vol. 12 • nº 3
Reliability analysis of built concrete dam
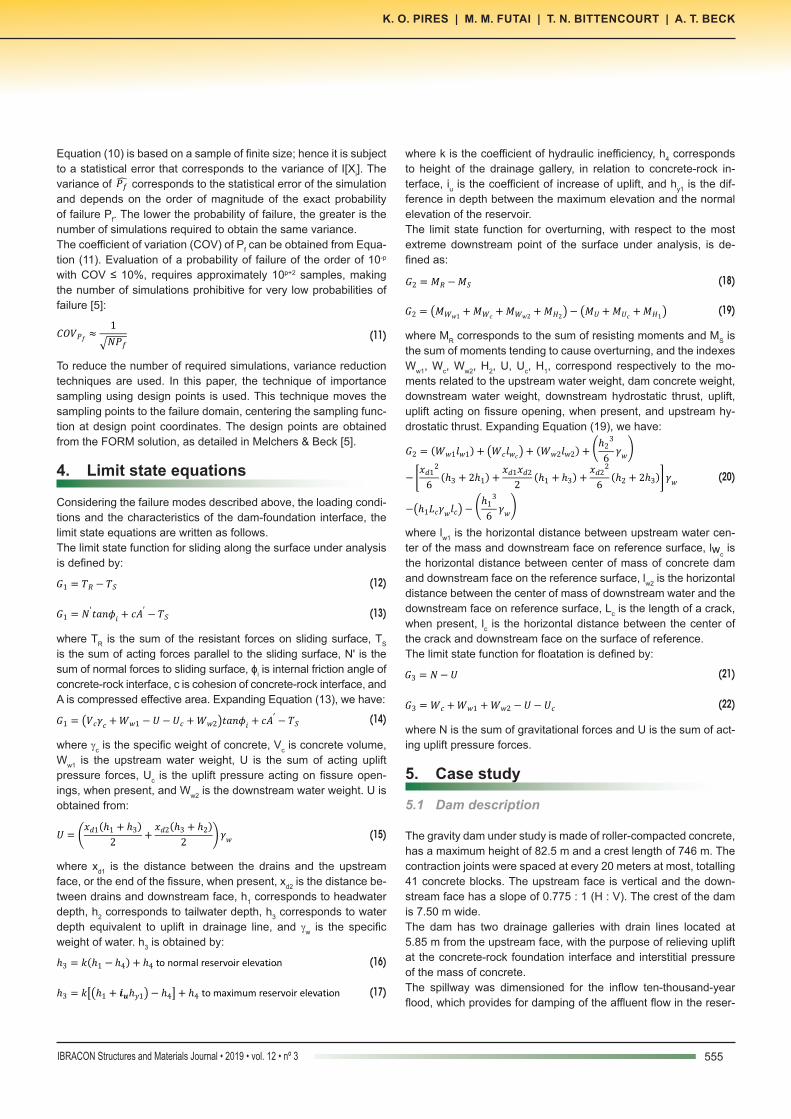
from the scenarios related to the design phase and the operation phase. Table 8 shows the results of conditional and unconditional β and Pf, for each failure mode and scenario. Figures 4 to 6 pres-ent the comparison between the safety factors and the reliability indexes obtained for each failure mode, related to the scenarios of the design phase.
5.5 Summary and discussion of results
The results of reliability index and probability of failure, presented in Table 7, demonstrate very close values between the two meth-ods used, FORM and MCS. This shows that the non-linearity of the limit state equation is small. For the overturning and floatation failure modes, in general, very low probabilities of failure are ob-served. The results presented as β > 8 and Pf < 6 x 10-16 are related to the computational representation of the standard Gaussian cu-mulative distribution function (Φ) and its inverse (Φ-1). According to Beck and Ávila [33], these functions have no closed analytic form, and polynomial approximations are often employed. In the
StRAnD Mathematica version, from β > 8 instability occurs, so an operational safety limit is implemented, which corresponds to β = 8, for which Φ (-8) ≈ 6x10-16.In relation to the scenarios related to the design phases (D1, D2, D3 and D4) and operation (O1, O2, O3 and O4) of dam (Table 7, Figure 3), there are considerable increases in reliability indexes for all failure modes, demonstrating that the built concrete block is more reliable than the designed concrete block. This is a result of the up-dating of resistance (γc, fi, c) and loading (k, iu) random variables.The results demonstrate importance of specific data collection about the built structure, and its usage in the reliability assess-ment, in such a way as to reflect more accurately the reality of the constructed structure.In Table 7, the influence of the random variables on the probabili-ties of failure can be verified, for each loading scenario and failure mode. For the sliding failure mode, the combined friction angle and cohesion contribution is greater than or equal to 87%, with 53% being the minimum contribution of the friction angle and 17% the minimum contribution of the cohesion, for all analyzed cases.
Figure 3Reliability index of scenarios related to the design and operation phase
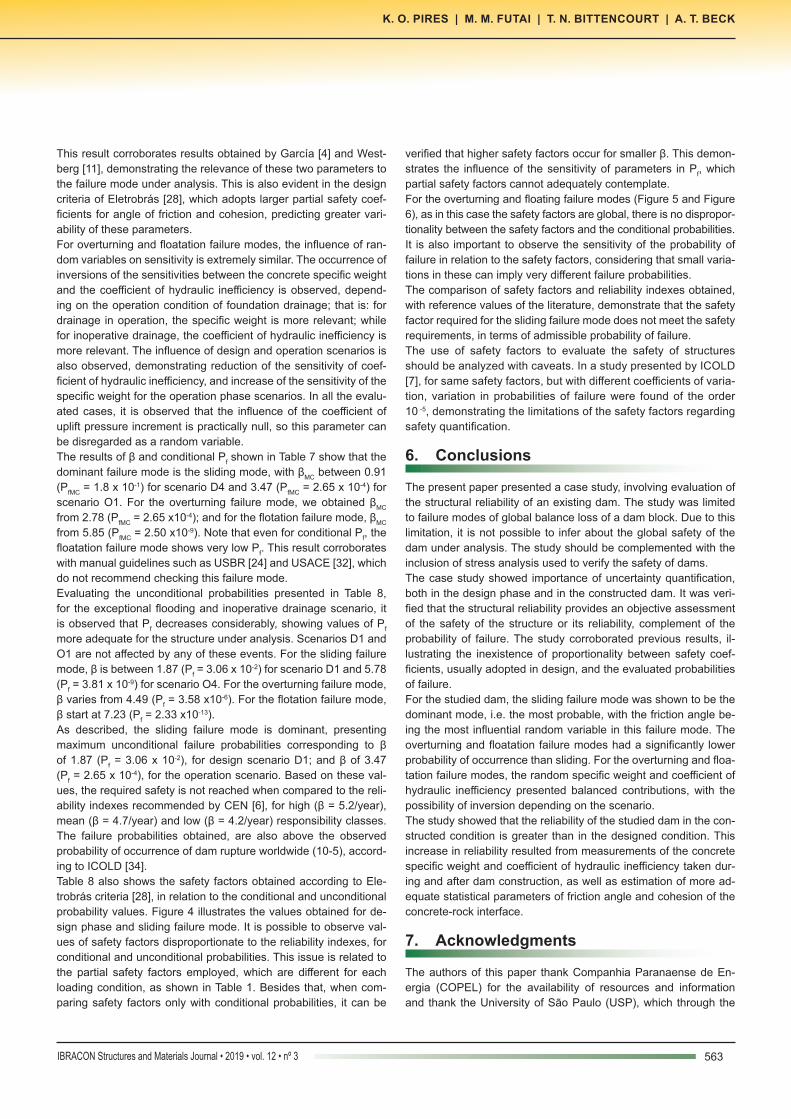
Figure 4Safety factor and reliability index to sliding failure mode
Figure 5Safety factor and reliability index to overturning failure mode
Figure 6Safety factor and reliability index to flotation failure mode
563IBRACON Structures and Materials Journal • 2019 • vol. 12 • nº 3
K. O. PIRES | M. M. FUTAI | T. N. BITTENCOURT | A. T. BECK
This result corroborates results obtained by García [4] and West-berg [11], demonstrating the relevance of these two parameters to the failure mode under analysis. This is also evident in the design criteria of Eletrobrás [28], which adopts larger partial safety coef-ficients for angle of friction and cohesion, predicting greater vari-ability of these parameters.For overturning and floatation failure modes, the influence of ran-dom variables on sensitivity is extremely similar. The occurrence of inversions of the sensitivities between the concrete specific weight and the coefficient of hydraulic inefficiency is observed, depend-ing on the operation condition of foundation drainage; that is: for drainage in operation, the specific weight is more relevant; while for inoperative drainage, the coefficient of hydraulic inefficiency is more relevant. The influence of design and operation scenarios is also observed, demonstrating reduction of the sensitivity of coef-ficient of hydraulic inefficiency, and increase of the sensitivity of the specific weight for the operation phase scenarios. In all the evalu-ated cases, it is observed that the influence of the coefficient of uplift pressure increment is practically null, so this parameter can be disregarded as a random variable.The results of β and conditional Pf shown in Table 7 show that the dominant failure mode is the sliding mode, with βMC between 0.91 (PfMC = 1.8 x 10⁻¹) for scenario D4 and 3.47 (PfMC = 2.65 x 10⁻⁴) for scenario O1. For the overturning failure mode, we obtained βMC from 2.78 (PfMC = 2.65 x10⁻⁴); and for the flotation failure mode, βMC from 5.85 (PfMC = 2.50 x10⁻⁹). Note that even for conditional Pf, the floatation failure mode shows very low Pf. This result corroborates with manual guidelines such as USBR [24] and USACE [32], which do not recommend checking this failure mode.Evaluating the unconditional probabilities presented in Table 8, for the exceptional flooding and inoperative drainage scenario, it is observed that Pf decreases considerably, showing values of Pf more adequate for the structure under analysis. Scenarios D1 and O1 are not affected by any of these events. For the sliding failure mode, β is between 1.87 (Pf = 3.06 x 10⁻²) for scenario D1 and 5.78 (Pf = 3.81 x 10⁻⁹) for scenario O4. For the overturning failure mode, β varies from 4.49 (Pf = 3.58 x10⁻⁶). For the flotation failure mode, β start at 7.23 (Pf = 2.33 x10⁻¹³).As described, the sliding failure mode is dominant, presenting maximum unconditional failure probabilities corresponding to β of 1.87 (Pf = 3.06 x 10⁻²), for design scenario D1; and β of 3.47 (Pf = 2.65 x 10⁻⁴), for the operation scenario. Based on these val-ues, the required safety is not reached when compared to the reli-ability indexes recommended by CEN [6], for high (β = 5.2/year), mean (β = 4.7/year) and low (β = 4.2/year) responsibility classes. The failure probabilities obtained, are also above the observed probability of occurrence of dam rupture worldwide (10-5), accord-ing to ICOLD [34].Table 8 also shows the safety factors obtained according to Ele-trobrás criteria [28], in relation to the conditional and unconditional probability values. Figure 4 illustrates the values obtained for de-sign phase and sliding failure mode. It is possible to observe val-ues of safety factors disproportionate to the reliability indexes, for conditional and unconditional probabilities. This issue is related to the partial safety factors employed, which are different for each loading condition, as shown in Table 1. Besides that, when com-paring safety factors only with conditional probabilities, it can be
verified that higher safety factors occur for smaller β. This demon-strates the influence of the sensitivity of parameters in Pf, which partial safety factors cannot adequately contemplate.For the overturning and floating failure modes (Figure 5 and Figure 6), as in this case the safety factors are global, there is no dispropor-tionality between the safety factors and the conditional probabilities.It is also important to observe the sensitivity of the probability of failure in relation to the safety factors, considering that small varia-tions in these can imply very different failure probabilities.The comparison of safety factors and reliability indexes obtained, with reference values of the literature, demonstrate that the safety factor required for the sliding failure mode does not meet the safety requirements, in terms of admissible probability of failure.The use of safety factors to evaluate the safety of structures should be analyzed with caveats. In a study presented by ICOLD [7], for same safety factors, but with different coefficients of varia-tion, variation in probabilities of failure were found of the order 10 -5, demonstrating the limitations of the safety factors regarding safety quantification.
6. Conclusions
The present paper presented a case study, involving evaluation of the structural reliability of an existing dam. The study was limited to failure modes of global balance loss of a dam block. Due to this limitation, it is not possible to infer about the global safety of the dam under analysis. The study should be complemented with the inclusion of stress analysis used to verify the safety of dams.The case study showed importance of uncertainty quantification, both in the design phase and in the constructed dam. It was veri-fied that the structural reliability provides an objective assessment of the safety of the structure or its reliability, complement of the probability of failure. The study corroborated previous results, il-lustrating the inexistence of proportionality between safety coef-ficients, usually adopted in design, and the evaluated probabilities of failure.For the studied dam, the sliding failure mode was shown to be the dominant mode, i.e. the most probable, with the friction angle be-ing the most influential random variable in this failure mode. The overturning and floatation failure modes had a significantly lower probability of occurrence than sliding. For the overturning and floa-tation failure modes, the random specific weight and coefficient of hydraulic inefficiency presented balanced contributions, with the possibility of inversion depending on the scenario.The study showed that the reliability of the studied dam in the con-structed condition is greater than in the designed condition. This increase in reliability resulted from measurements of the concrete specific weight and coefficient of hydraulic inefficiency taken dur-ing and after dam construction, as well as estimation of more ad-equate statistical parameters of friction angle and cohesion of the concrete-rock interface.
7. Acknowledgments
The authors of this paper thank Companhia Paranaense de En-ergia (COPEL) for the availability of resources and information and thank the University of São Paulo (USP), which through the

564 IBRACON Structures and Materials Journal • 2019 • vol. 12 • nº 3
Reliability analysis of built concrete dam
Postgraduate Program in Civil Engineering made possible the de-velopment of this study.
8. Bibliographicreferences
[1] A. T. Beck, Confiabilidade e Segurança das Estruturas. Elsevier, 2019.
[2] A. H.-S. Ang and W. H. Tang, Probability Concepts in Engi-neering Planning and Design: Emphasis on Application to Civil and Environmental Engineering. Wiley, 2007.
[3] International Commission on Large Dams - ICOLD, “Risk as-sessment in dam safety management. Bulletin 130.” Paris, 2005.
[4] L. Altarejos-García, I. Escuder-Bueno, A. Serrano-Lombillo, and M. G. de Membrillera-Ortuño, “Methodology for estimat-ing the probability of failure by sliding in concrete gravity dams in the context of risk analysis,” Struct. Saf., vol. 36, pp. 1–13, 2012.
[5] R. E. Melchers and A. T. Beck, Structural reliability: analysis and prediction. 3rd Ed., John Wiley & Sons, 2018.
[6] European Committe for Standartization - CEN, “Basis of structural design. EN 1990.” Brussels, Belgium, 2001.
[7] International Commission on Large Dams - ICOLD, “Rock foundations for dams. Bulletin 88.” Paris, 1993.
[8] Brasil. Lei no 12.334 de setembro de 2010, “Estabelece a Política Nacional de Segurança de Barragens e o Sistema Nacional de Informações sobre Segurança de Barragens.” [Online]. Available: http://www.planalto.gov.br/ccivil_03/_ato2007-2010/2010/lei/l12334.htm.
[9] B. Ellingwood and P. B. Tekie, “Fragility analysis of concrete grav-ity dams,” J. Infrastruct. Syst., vol. 7, no. 2, pp. 41–48, 2001.
[10] P. B. Tekie and B. R. Ellingwood, “Seismic fragility assess-ment of concrete gravity dams,” Earthq. Eng. Struct. Dyn., vol. 32, no. 14, pp. 2221–2240, 2003.
[11] M. Westberg, “Reliability-based evaluation of concrete dams,” 2007.
[12] F. Johansson, “Shear strength of unfilled and rough rock joints in sliding stability analyses of concrete dams,” Royal Institute of Technology, 2009.
[13] P. Royet, L. Peyras, J. P. Becue, and C. Carvajal, “Analytical review of gravity dam stability from novel French limit-state guidelines to a probabilistic assessment of structural safe-ty,” in 23rd International Congress on Large Dams (ICOLD 2009), Brasilia, Brazil, 2009.
[14] L. Altarejos García, “Contribución a la estimación de la prob-abilidad de fallo de presas de hormigón en el contexto del análisis de riesgos.” 2009.
[15] C. Bernstone, M. Westberg, and J. Jeppsson, “Structural as-sessment of a concrete dam based on uplift pressure moni-toring,” J. Geotech. geoenvironmental Eng., vol. 135, no. 1, pp. 133–142, 2009.
[16] M. Westberg, “Reliability-based assessment of concrete dam stability,” Lund University, 2010.
[17] M. Westberg Wilde and F. Johansson, “System reliability of concrete dams with respect to foundation stability: applica-tion to a spillway,” J. Geotech. Geoenvironmental Eng., vol. 139, no. 2, pp. 308–319, 2012.
[18] H. Su, J. Hu, and Z. Wen, “Service life predicting of dam
systems with correlated failure modes,” J. Perform. Constr. Facil., vol. 27, no. 3, pp. 252–269, 2011.
[19] A. Morales-Torres, I. Escuder-Bueno, L. Altarejos-Garc\’\ia, and A. Serrano-Lombillo, “Building fragility curves of sliding failure of concrete gravity dams integrating natural and epistemic un-certainties,” Eng. Struct., vol. 125, pp. 227–235, 2016.
[20] A. Krounis, “Sliding stability re-assessment of concrete dams with bonded concrete-rock interfaces,” KTH Royal Institute of Technology, 2016.
[21] A. Krounis, F. Johansson, J. Spross, and S. Larsson, “In-fluence of cohesive strength in probabilistic sliding stability reassessment of concrete dams,” J. Geotech. Geoenviron-mental Eng., vol. 143, no. 2, p. 4016094, 2016.
[22] Y. Li, Y. Sun, B. Li, and Z. Xu, “Penalty function-based meth-od for obtaining a reliability indicator of gravity dam stability,” Comput. Geotech., vol. 81, pp. 19–25, 2017.
[23] Y. A. Fishman, “Stability of concrete retaining structures and their interface with rock foundations,” Int. J. Rock Mech. Min. Sci., vol. 46, no. 6, pp. 957–966, 2009.
[24] U.S. Bureau of Reclamation - USBR, “Design of Gravity Dams.” 1976.
[25] Electric Power Research Institute - EPRI, “Uplift pressures, shear strengths, and tensile strengths for stability analysis of concrete gravity dams.” Denver, 1992.
[26] U.S. Army Corps of Engineers - USACE, “Evaluation and Comparison of Stability Analysis and Upplift Criteria for Con-crete Gravity Dams by Three Fedral Agencies.” 2000.
[27] G. Ruggeri, R. Pellegrini, M. de Celix, M. Berntsen, P. Royet, V. Bettzieche, W. Amberg, A. Gustafsson, T. Morison, and A. Zenz, “Sliding stability of existing gravity dams—Final re-port,” ICOLD Eur. Club, Paris, 2004.
[28] Centrais Elétricas Brasileiras S.A. - ELETROBRÁS, “Critérios de Projeto Civil de Usinas Hidrelétricas.” Rio de Janeiro, 2003.
[29] A. T. Beck, “StRAnD, Structural Reliability Analysis and De-sign, Manual do Usuário, Engenharia de Estruturas. Escola de Engenharia de São Carlos,.” USP, 2008.
[30] A. Krounis, F. Johansson, and S. Larsson, “Shear Strength of Partially Bonded Concrete--Rock Interfaces for Applica-tion in Dam Stability Analyses,” Rock Mech. Rock Eng., vol. 49, no. 7, pp. 2711–2722, 2016.
[31] China Electricity Council, “The Standards Compilation of Water Power in China.” 2000.
[32] U. S. Army Corps of Engineers - USACE, “Gravity Dam De-sign.” 1995.
[33] A. T. Beck and others, “Strategies for finding the design point under bounded random variables,” Struct. Saf., vol. 58, pp. 79–93, 2016.
[34] International Commission on Large Dams - ICOLD, “Dam Failures statistical analyses. Bulletin 99.” 1995.