anna mikhaylova, vasilisa gorochnaya - social effects of
TRANSCRIPT

Social Effects of Agglomeration. An Assessment of Intraregional Disparities in the South of Russia
Anna MIKHAYLOVA*1, 2, Vasilisa GOROCHNAYA1, 3 * Corresponding author
1 Immanuel Kant Baltic Federal University, Kaliningrad, RUSSIAN FEDERATION 2 Saint Petersburg Electrotechnical University “LETI”, Saint-Petersburg, RUSSIAN FEDERATION
3 Southern Federal University, Rostov-on-Don, RUSSIAN FEDERATION
E-mail: [email protected], [email protected] DOI: 10.24193/JSSP.2020.2.05 https://doi.org/10.24193/JSSP.2020.2.05
K e y w o r d s: urban agglomeration, agglomeration effect, urbanization, urban population, rural settlements, regional inequality,
regional divergence, Rostov agglomeration, Russia
A B S T R A C T
1. INTRODUCTION
The competitiveness of the national economy is formed at its grassroots levels – regional and municipal. The development of the regional economy, the standard of living, and the well-being of the population are highly dependent on the spatial economic structure. Due to its specificity, the latter can both contribute to and inhibit the diffusion of innovation, exchange of resources and technologies. The problems of inequality in municipal development are actively studied in modern science.
A strong factor for increasing the gap of socioeconomic divergence is the geo-economic position of a municipality, in particular, its spatial proximity to
and functional integrity with large urban spatial systems, such as urban and township clusters, clustered cities, concentrated urban areas, metropolitan areas, urban economic zones, expanded metropolitan areas, urban-rural integrated regions, metropolitan regions, mega metropolitan regions, megalopolis, Metropolitan Inter-locking Region (MIRs), urban cluster belts, etc. (an excellent review was done by Fang and Yu, 2017).
Large urban agglomerations play an important role in structuring modern regional space in most countries. Studies on the relationship between agglomeration processes and the economic development of municipalities determined by spatial proximity to agglomerations are conducted across the globe, including
Centre for Research on Settlements and Urbanism
Journal of Settlements and Spatial Planning
J o u r n a l h o m e p a g e: http://jssp.reviste.ubbcluj.ro
The growth of cities against the background of transport infrastructure development has led to the formation of urban agglomerations as systems of interconnected cities. Rural areas are the foundation for the growth of new actively developing urban spatial systems and become donors of labour resources. The redistribution of population between the city and the country entails a number of social effects. This study aims to assess the impact of agglomeration processes on the social sphere of municipalities in the region. The main focus of the study is the dynamically developing monocentric agglomeration in the south of Russia – the Rostov agglomeration. The methodological approach is based on assessing the gaps between different types of municipalities depending on their territorial location relative to the agglomeration centre presented in four groups of social indicators: urbanization, labour mobility, housing, and quality of life. The Agglomeration Social Impact Index was calculated. We learned there is significant heterogeneity in the level of social development among different types of municipalities. The decisive effect on social gaps is exerted by three factors: agglomeration, urbanization, transport and logistics. The most favourable living conditions are found in the municipalities located in the immediate vicinity of the agglomeration core.

Anna MIKHAYLOVA, Vasilisa GOROCHNAYA Journal of Settlements and Spatial Planning, vol. 11, no. 2 (2020) 113-126
114
Brazil (Catela et al., 2010; Pereira and Moreira, 2018; Raiher, 2019; Queiroz and Golgher, 2008), Egypt (Badr et al., 2019), Greece (Ciommi et al., 2019; 2020), Poland (Badach and Cymanow, 2019; Pepliński, 2020), Spain (Jofre-Monseny et al., 2011), the UK (Du and Vanino, 2020), and post-Soviet states (Csanádi and Csizmady, 2019). Much attention to the relationship between the residential structure of cities and the surrounding rural areas is paid by the Indian scholars, introducing the concept of “fractal urbanism” (Bharathi et al., 2020). Studies of western scholars on the agglomeration effects on municipalities are considering the industry sectors and the types of enterprises most affected (Du and Vanino, 2020; Jofre-Monseny et al., 2011; Badr et al., 2019).
Scholars have found both positive externalities due to the intensification of information flow and the diffusion of technologies (Badr et al., 2019), as well as negative ones associated with an increase in the deficit of agricultural land (Pepliński, 2020; Goytia, 2017; Opoku, 2019), and an increase in imbalances on the labour market due to the hyperbolic growth of large enterprises in the agglomeration space (Du and Vanino, 2020). The influence of agglomeration factor on the dynamics and capabilities of start-ups and industry networks has been established in Sweden (Eriksson and Lengyel, 2019; Eriksson and Rataj, 2019) and Brazil (Amarante et al., 2019).
The growth of urban agglomerations leaves its mark on the housing market pricing in adjacent municipalities (Nijenhuis, 2019; Xu, 2020), contributes to segregation and growth of social inequality (Blanco et al., 2017; Goytia and Dorna, 2016; Muñoz, 2017; Tóth et al., 2019; Ubeda, 2019). This is largely affected by pendulum migration, which complicates the labour market in certain municipalities and forms new settlement patterns (Costa and De Valk, 2018; Klaesson and Öner, 2020; Verdugo, 2011).
The growth and territorial expansion of urban spaces, along with an increase in their connectivity triggers negative effects; namely the agglomeration “takes over” rural settlements, eventually destroying their lifestyle and contributing to depopulation due to migration processes. At the same time, neighbouring municipal districts often turn out to be indirect recipients of the positive social effects that are achieved in agglomerations. The study on the ratio of positive and negative externalities of agglomerations in the social sphere is an important but little-studied problem, which requires detailed diagnostics in the context of municipalities. In this case, it is necessary to take into account the difference in their remoteness and spatial location relative to the agglomeration core. In this study, we assess the inequality of social development of the municipalities of the region caused by the influence of the agglomeration factor. Our hypothesis is that the population of municipalities located near the metropolitan area has a higher quality and standard of
living than the population living in areas further from it, but also within the same region. We also assume that, within the urban agglomeration itself, districts of different levels of social development can also be distinguished, depending on the distance from the core of the agglomeration.
This study is focused on the Rostov region, an agro-industrial area in southern Russia, which experiences the dichotomy of the Rostov agglomeration as a large industrial and transport hub and a vast agricultural periphery. Rural municipalities form the spine of competitiveness of the Rostov agglomeration and supply the main export product. However, they are not always the recipients of the social benefits created by the agglomeration. In this regard, the example of the Rostov region of Russia is of considerable interest for studying the heterogeneity of social space caused by the influence of agglomeration. 2. METHODOLOGY
The study of the impact of agglomeration effects on the social sphere is based on data for the Rostov region of Russia, which is the southern federal district of the country. The administrative and territorial structure of the Rostov region includes 12 urban districts and 43 municipal districts, as well as 17 urban and 391 rural settlements at the lowest administrative level (Fig. 1).
Fig. 1. The administrative and territorial structure of
the Rostov region.
The administrative centre is the city of Rostov-
on-Don, acting as the capital of the federal district and the centre of agglomeration processes taking place in the region, concentrating 27% of the total population. Around the city, a large Rostov agglomeration has naturally formed, attracting population from the neighbouring municipalities (Gorochnaya and Mikhaylov, 2020). The Rostov agglomeration occupies 16.2% of the entire territory of the Rostov region and concentrates over 2.5 million people. As of the end of 2019, 71.4% of the region’s permanent urban population lives in the Rostov agglomeration.

Social Effects of Agglomeration. An Assessment of Intraregional Disparities in the South of Russia Journal of Settlements and Spatial Planning, vol. 11, no. 2 (2020) 113-126
115
In order to verify the research hypothesis, all the municipalities of the Rostov region were grouped
depending on their territorial location relative to the existing urban agglomeration (Table 1).
Table 1. Spatial distribution of municipalities of the Rostov region.
Municipality type
Delimitation principle Number of municipalities
1. Agglomerative Enters the Rostov agglomeration 6 cities and 10 districts
Including the spatial elements of the Rostov agglomeration
1.1. Core
Agglomeration core – areas generally included in the composition of the agglomeration in scholarly research
4 cities: Rostov-on-Don, Azov, Bataysk, Novocherkassk 4 districts: Azovsky, Aksaysky, Bagaevsky, Myasnikovsky
1.2. Interjacent Areas sometimes included in agglomeration in scholarly research
1 city: Taganrog 2 districts: Kagalnitsy, Neklinovsky
1.3. Peripheral Areas rarely included in agglomeration in scholarly research
1 city: Shakhty 4 districts: Kuibyshevsky, Matveevo-Kurgansky, Octyabrsky, Rodionovo-Nesvetaysky
2. Contiguous
Directly adjacent to the Rostov agglomeration, in the case of cities – located inside districts bordering the agglomeration
3 cities: Gukovo, Zverevo, Novoshakhtinsk 5 districts: Veselovsky, Zernogradsky, Krasnosulinsky, Semikarakorsky, Ust-Donetsky
3. Remote Do not have a common border with areas included in the agglomeration
3 cities: Volgodonsk, Donetsk and Kamensk-Shakhtinsky 28 districts: Belokalitvinsky, Bokovsky, Verkhedonetsky, Volgodonsky, Dubovsky, Egorlyksky, Zavetinsky, Zimovnikovsky, Kamensky, Kasharsky, Konstantinovsky, Martynovsky, Millerovsky, Milyutinsky, Morozovsky, Oblivsky, Orlovsky, Sandstoneokopsky, Proletarsky, Sovetsky, Remninsky, Tselinsky, Tsimlyansky, Chertkovsky, Sholokhovsky
The assessment of the quality and standard of
living of the population of municipalities depending on their territorial location is based on a number of assumptions.
Firstly, it is expected that, with proximity to agglomeration, municipalities should have a more developed service sector for the population, while the municipalities that make up the core of the agglomeration should have the most developed service sector. Also, with the proximity to the core of the agglomeration, a higher level of public infrastructure is expected, for example, the availability of sports facilities.
Secondly, the density and quality of roads play a significant role in the social cohesion of areas both within the agglomeration and in the system of connections between the agglomeration core and other areas of the region. We assume that transport accessibility of the districts determines the pendulum migration within the region, including its effects on the unemployment rate.
Thirdly, it is expected that the closer to the core-forming agglomeration city, the higher is the price per square meter of housing, which determines the dynamics of more active construction in neighbouring municipalities.
The aforementioned assumptions on the social effects of the agglomeration are aligned with the indicators used in other studies on the matter, which are grouped and generalized (urbanization – Ciommi et al., 2019; 2020; Espindola et al., 2017; Mikhaylov et al., 2019; labour mobility – Gainanov et al., 2017; Mitze and Schmidt, 2015; Navarro-Azorin and Artal-Tur, 2017; Pose et al., 2020; Tkachenko and Fomkina, 2015; Yu et al., 2016; housing – Shmidt et al., 2016; Yang and Pan, 2020; quality of life – Manganelli et al., 2020; Sass and Porsse, 2020; Tao et al., 2020). Table 2 provides a description of the indicators used to assess the social effects of the agglomeration processes on the municipalities of the region. The difference in the time periods of the studied indicators is due to differences in data collection approaches. Indicators obtained from
Anna MIKHAYLOVA, Vasilisa GOROCHNAYA Journal of Settlements and Spatial Planning, vol. 11, no. 2 (2020) 113-126
116
Rostovstat are collected and published annually in dynamics.
The indicators of the number of real estate objects and their value are calculated using the CIAN database updated as of 1.07.2020. Separately, using GIS, the remoteness of the administrative centres of all
municipalities from the borders of Rostov-on-Don city was calculated. For all indicators, the arithmetic mean values were calculated for the types of municipalities identified in accordance with their territorial location relative to the Rostov-on-Don agglomeration core: agglomerative, contiguous, remote.
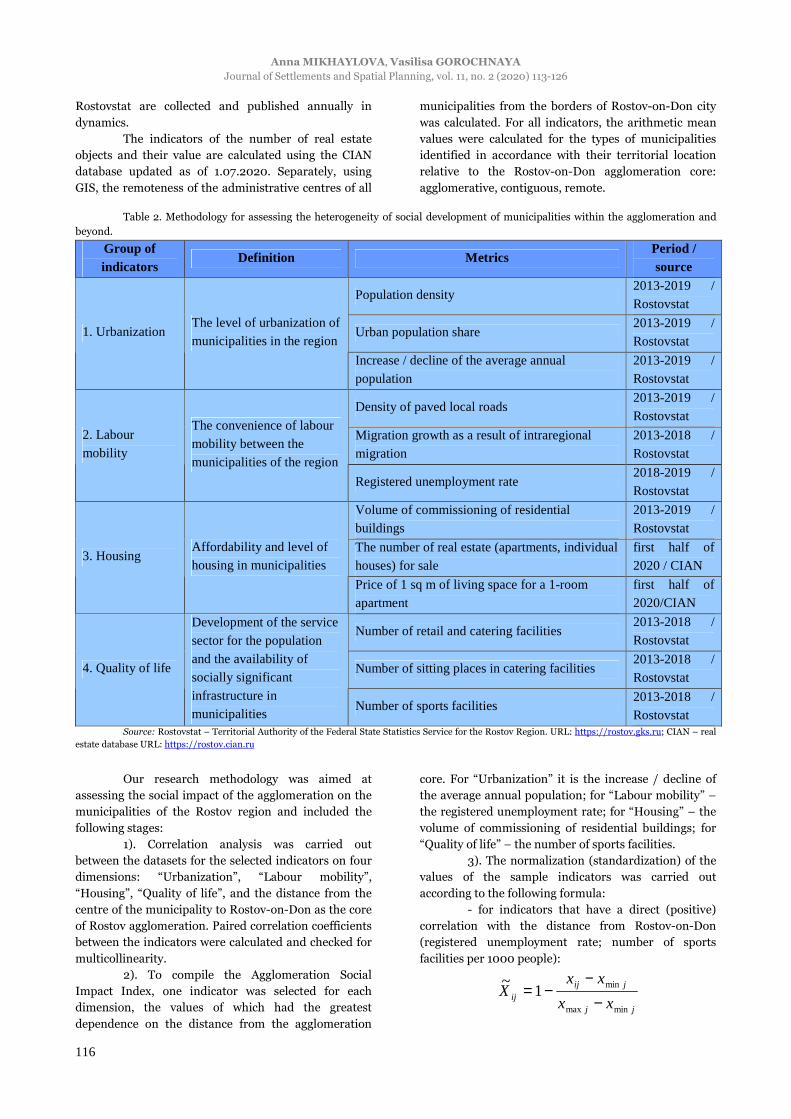
Table 2. Methodology for assessing the heterogeneity of social development of municipalities within the agglomeration and
beyond.
Group of indicators
Definition Metrics Period / source
Population density 2013-2019 / Rostovstat
Urban population share 2013-2019 / Rostovstat
1. Urbanization The level of urbanization of municipalities in the region
Increase / decline of the average annual population
2013-2019 / Rostovstat
Density of paved local roads 2013-2019 / Rostovstat
Migration growth as a result of intraregional migration
2013-2018 / Rostovstat
2. Labour mobility
The convenience of labour mobility between the municipalities of the region
Registered unemployment rate 2018-2019 / Rostovstat
Volume of commissioning of residential buildings
2013-2019 / Rostovstat
The number of real estate (apartments, individual houses) for sale
first half of 2020 / CIAN
3. Housing Affordability and level of housing in municipalities
Price of 1 sq m of living space for a 1-room apartment
first half of 2020/CIAN
Number of retail and catering facilities 2013-2018 / Rostovstat
Number of sitting places in catering facilities 2013-2018 / Rostovstat
4. Quality of life
Development of the service sector for the population and the availability of socially significant infrastructure in municipalities
Number of sports facilities 2013-2018 / Rostovstat
Source: Rostovstat – Territorial Authority of the Federal State Statistics Service for the Rostov Region. URL: https://rostov.gks.ru; CIAN – real estate database URL: https://rostov.cian.ru
Our research methodology was aimed at assessing the social impact of the agglomeration on the municipalities of the Rostov region and included the following stages:
1). Correlation analysis was carried out between the datasets for the selected indicators on four dimensions: “Urbanization”, “Labour mobility”, “Housing”, “Quality of life”, and the distance from the centre of the municipality to Rostov-on-Don as the core of Rostov agglomeration. Paired correlation coefficients between the indicators were calculated and checked for multicollinearity.
2). To compile the Agglomeration Social Impact Index, one indicator was selected for each dimension, the values of which had the greatest dependence on the distance from the agglomeration
core. For “Urbanization” it is the increase / decline of the average annual population; for “Labour mobility” – the registered unemployment rate; for “Housing” – the volume of commissioning of residential buildings; for “Quality of life” – the number of sports facilities.
3). The normalization (standardization) of the values of the sample indicators was carried out according to the following formula:
- for indicators that have a direct (positive) correlation with the distance from Rostov-on-Don (registered unemployment rate; number of sports facilities per 1000 people):
jj
jijij xx
xxX
minmax
min1~
−−
−=
Social Effects of Agglomeration. An Assessment of Intraregional Disparities in the South of Russia Journal of Settlements and Spatial Planning, vol. 11, no. 2 (2020) 113-126
117
- for indicators having an inverse (negative) correlation with the distance from Rostov-on-Don
(increase / decline of the average annual population; volume of commissioning of residential buildings):
jj
jijij xx
xxX
minmax
min~−
−=
The multicollinearity check of the normalized
values of four indicators was carried out (Table 3). All paired correlation coefficients are | r | <0.7, which indicates the absence of multicollinearity of factors.
4). Agglomeration Social Impact Index (I_ (asii)) was calculated for all municipalities of the Rostov region as the arithmetic mean of the normalized values of four indicators:
4
4
1∑ == i i
asii
xI
A typology of the municipalities of the Rostov
region was carried out according to the Agglomeration Social Impact Index.
Table 3. Pairwise correlation coefficient matrix.
- x1 (increase / decline of
the average annual population)
x2 (registered unemployment rate)
x3 (volume of commissioning of
residential buildings)
x4 (number of sports facilities)
x1 1 - - - x2 0.2276 1 - - x3 0.6041 0.3794 1 - x4 0.3926 0.3534 0.3409 1
3. RESEARCH RESULTS
3.1. Urbanization
The Rostov agglomeration has a monocentric structure, with a large attractor city - Rostov-on-Don, around which smaller cities are located and connected along transport routes: 4 large cities with a population of 100 - 250 thousand people (Taganrog, Shakhty, Novocherkassk, Bataysk) and 2 medium-sized cities with a population of 80-90 thousand people (Azov, Aksai), as well as one urban-type Kamenolomni settlement in the Oktyabrsky district with 35.9 thousand people. The total population of the cities and towns of Rostov agglomeration is just over 2 million people, which accounts for 71% of the total urban population of the Rostov region. The Rostov agglomeration also includes 8 closely related agricultural areas, in which a total of 366.5 thousand people live. Overall, almost 37% or 500 thousand rural population of the region falls under the influence of the Rostov agglomeration.
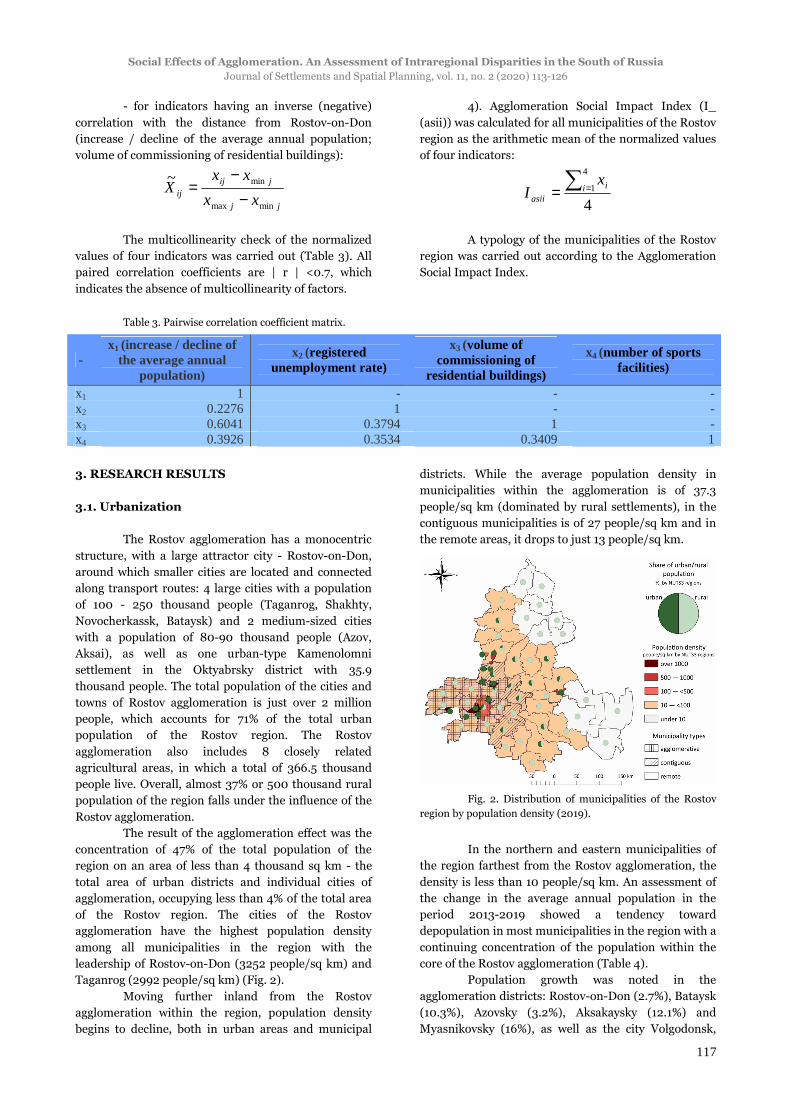
The result of the agglomeration effect was the concentration of 47% of the total population of the region on an area of less than 4 thousand sq km - the total area of urban districts and individual cities of agglomeration, occupying less than 4% of the total area of the Rostov region. The cities of the Rostov agglomeration have the highest population density among all municipalities in the region with the leadership of Rostov-on-Don (3252 people/sq km) and Taganrog (2992 people/sq km) (Fig. 2).
Moving further inland from the Rostov agglomeration within the region, population density begins to decline, both in urban areas and municipal
districts. While the average population density in municipalities within the agglomeration is of 37.3 people/sq km (dominated by rural settlements), in the contiguous municipalities is of 27 people/sq km and in the remote areas, it drops to just 13 people/sq km.
Fig. 2. Distribution of municipalities of the Rostov
region by population density (2019).
In the northern and eastern municipalities of the region farthest from the Rostov agglomeration, the density is less than 10 people/sq km. An assessment of the change in the average annual population in the period 2013-2019 showed a tendency toward depopulation in most municipalities in the region with a continuing concentration of the population within the core of the Rostov agglomeration (Table 4).
Population growth was noted in the agglomeration districts: Rostov-on-Don (2.7%), Bataysk (10.3%), Azovsky (3.2%), Aksakaysky (12.1%) and Myasnikovsky (16%), as well as the city Volgodonsk,
Anna MIKHAYLOVA, Vasilisa GOROCHNAYA Journal of Settlements and Spatial Planning, vol. 11, no. 2 (2020) 113-126
118
remote from the Rostov agglomeration (1.1%), which is a major transport and logistics, industrial and energy
hub in the south of Russia.
Table 4. Dynamics of urbanization indicators by municipality types of the Rostov region, 2013-2019.
Indicator Municipality type
2013 2014 2015 2016 2017 2018 2019 Growth rate 2019-2013
(%) Rostov-on-Don 385.7 387.8 389.5 391.3 393.2 394.9 396.0 2.7
Agglomerative 32.73 32.78 32.89 32.92 32.93 32.92 32.85 0.4
Contiguous 19.43 19.24 19.09 18.96 18.89 18.72 18.51 -4.7
Population density
Remote 14.66 14.52 14.41 14.30 14.20 14.07 13.92 -5.1
Rostov-on-Don 100 100 100 100 100 100 100 0.0
Agglomerative 65.33 65.26 65.10 64.89 64.79 64.73 64.61 -1.1
Contiguous 68.03 68.07 68.15 68.31 68.43 68.34 68.29 0.4
Urban population share
Remote 42.59 42.73 42.80 42.46 42.61 42.73 42.90 0.7
Rostov-on-Don - 0.55 0.45 0.45 0.48 0.44 0.27 2.68*
Agglomerative - 0.15 0.33 0.10 0.03 -0.05 -0.20 0.36*
Contiguous - -0.98 -0.79 -0.67 -0.36 -0.90 -1.11 -4.72*
Average annual population dynamics Remote - -0.99 -0.74 -0.75 -0.71 -0.90 -1.08 -5.06*
Note: * growth rate of the absolute value of the annual population 2019 to 2013.
Table 4 illustrates, on the one hand, the trend
of an increase in population density in the agglomeration core, as well as its significant reduction in the periphery – in remote municipalities. On the other hand, it shows the reducing share of the rural population in contiguous and remote municipalities with relocation to cities.
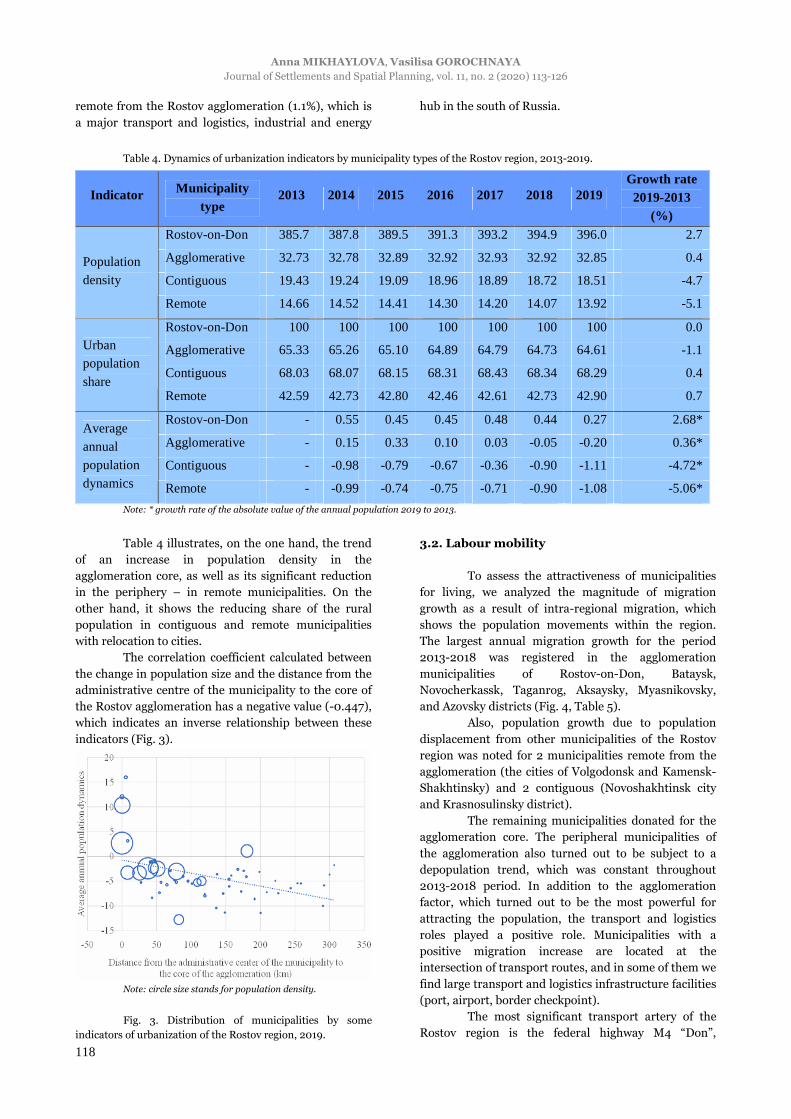
The correlation coefficient calculated between the change in population size and the distance from the administrative centre of the municipality to the core of the Rostov agglomeration has a negative value (-0.447), which indicates an inverse relationship between these indicators (Fig. 3).
Note: circle size stands for population density.
Fig. 3. Distribution of municipalities by some
indicators of urbanization of the Rostov region, 2019.
3.2. Labour mobility To assess the attractiveness of municipalities
for living, we analyzed the magnitude of migration growth as a result of intra-regional migration, which shows the population movements within the region. The largest annual migration growth for the period 2013-2018 was registered in the agglomeration municipalities of Rostov-on-Don, Bataysk, Novocherkassk, Taganrog, Aksaysky, Myasnikovsky, and Azovsky districts (Fig. 4, Table 5).
Also, population growth due to population displacement from other municipalities of the Rostov region was noted for 2 municipalities remote from the agglomeration (the cities of Volgodonsk and Kamensk-Shakhtinsky) and 2 contiguous (Novoshakhtinsk city and Krasnosulinsky district).
The remaining municipalities donated for the agglomeration core. The peripheral municipalities of the agglomeration also turned out to be subject to a depopulation trend, which was constant throughout 2013-2018 period. In addition to the agglomeration factor, which turned out to be the most powerful for attracting the population, the transport and logistics roles played a positive role. Municipalities with a positive migration increase are located at the intersection of transport routes, and in some of them we find large transport and logistics infrastructure facilities (port, airport, border checkpoint).
The most significant transport artery of the Rostov region is the federal highway M4 “Don”,
Social Effects of Agglomeration. An Assessment of Intraregional Disparities in the South of Russia Journal of Settlements and Spatial Planning, vol. 11, no. 2 (2020) 113-126
119
connecting Rostov-on-Don with Moscow – the capital city of Russia. In the immediate vicinity of this road are
the cities of Bataysk, Aksai, Novocherkassk, Shakhty, Novoshakhtinsk, Kamensk-Shakhtinsky.
Table 5. Dynamics of labour mobility indicators of the municipality types of the Rostov region, 2013-2019.
Indicator Municipality
type 2013 2014 2015 2016 2017 2018 2019
Growth rate
2019-2013 (%)
Rostov-on-Don 1009.3 1009.3 1009.3 1009.3 1018.2 1019.6 1020.5 1.1
Agglomerative 216.2 216.9 216.8 216.8 402.5 412.0 406.3 87.9
Contiguous 130.8 133.3 131.9 133.6 187.2 197.3 200.0 52.9
Density of paved local roads
Remote 132.0 129.3 130.3 132.2 234.7 240.7 246.0 86.4
Rostov-on-Don 4015 2514 999 1810 3002 3016 - -24.9*
Agglomerative 232.3 255.9 213.5 115.9 110.1 122.9 - -47.1*
Contiguous -230.4 -211.5 -86.5 15.4 -122.9 -137.8 - -40.2*
Migration growth as a result of intraregional migration Remote -182.5 -150.3 -113.2 -118.4 -118.4 -121.2 - -33.6*
Rostov-on-Don - - - - - 0.40 0.40 0.0**
Agglomerative - - - - - 0.87 0.90 3.1**
Contiguous - - - - - 0.99 0.89 -10.1**
Registered unemployment rate
Remote - - - - - 1.25 1.26 1.3** Note: * 2018 to 2013; ** 2019 to 2018.
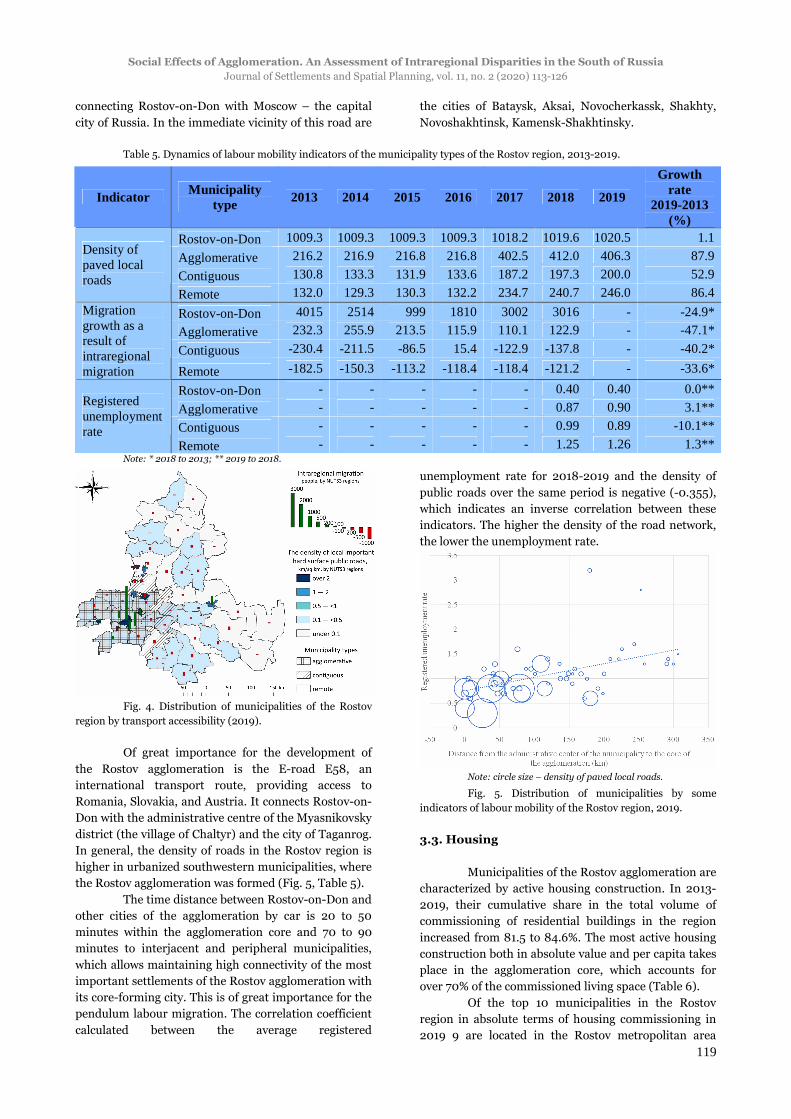
Fig. 4. Distribution of municipalities of the Rostov
region by transport accessibility (2019).
Of great importance for the development of the Rostov agglomeration is the E-road E58, an international transport route, providing access to Romania, Slovakia, and Austria. It connects Rostov-on-Don with the administrative centre of the Myasnikovsky district (the village of Chaltyr) and the city of Taganrog. In general, the density of roads in the Rostov region is higher in urbanized southwestern municipalities, where the Rostov agglomeration was formed (Fig. 5, Table 5).
The time distance between Rostov-on-Don and other cities of the agglomeration by car is 20 to 50 minutes within the agglomeration core and 70 to 90 minutes to interjacent and peripheral municipalities, which allows maintaining high connectivity of the most important settlements of the Rostov agglomeration with its core-forming city. This is of great importance for the pendulum labour migration. The correlation coefficient calculated between the average registered
unemployment rate for 2018-2019 and the density of public roads over the same period is negative (-0.355), which indicates an inverse correlation between these indicators. The higher the density of the road network, the lower the unemployment rate.
Note: circle size – density of paved local roads.
Fig. 5. Distribution of municipalities by some indicators of labour mobility of the Rostov region, 2019.
3.3. Housing
Municipalities of the Rostov agglomeration are characterized by active housing construction. In 2013-2019, their cumulative share in the total volume of commissioning of residential buildings in the region increased from 81.5 to 84.6%. The most active housing construction both in absolute value and per capita takes place in the agglomeration core, which accounts for over 70% of the commissioned living space (Table 6).
Of the top 10 municipalities in the Rostov region in absolute terms of housing commissioning in 2019 9 are located in the Rostov metropolitan area

Anna MIKHAYLOVA, Vasilisa GOROCHNAYA Journal of Settlements and Spatial Planning, vol. 11, no. 2 (2020) 113-126
120
(Rostov-on-Don, Aksaysky district, Bataysk, Taganrog, Azovsky district, Novocherkassk, Azov, Shakhty, Neklinovsky district), and the city Volgodonsk, previously noted as a significant transport and industrial centre of the region. The peripheral agricultural Rodionovo-Nesvetaysky and Kuibyshevsky municipal districts, deprived of large-scale industry,
turned out to be the least attractive for housing construction within the Rostov agglomeration. Table 7 and Figure 6 show the distribution of municipalities of the Rostov region in terms of the supply of new and secondary housing, as presented by CIAN – the largest Russian database of rental and sale of real estate.
Table 6. Dynamics in the volume of commissioning of residential buildings, by types of municipalities in the Rostov region,
2013-2019.
Municipality type
Units 2013 2014 2015 2016 2017 2018 2019 Growth rate 2019-2013
(%) thousand sq m
1025.1 1102.7 1111.1 1113.2 1118.5 1127.1 1259.2 22.8 Rostov-on-Don
sq m / person
0.93 0.99 1.00 0.99 0.99 1.00 1.11 19.6
thousand sq m
714.8 794.8 849.3 781.9 815.4 844.9 949.2 32.8 Agglomerative
sq m / person
0.51 0.56 0.60 0.55 0.58 0.60 0.67 32.3
thousand sq m
99.5 111.0 106.6 92.4 81.2 78.1 78.8 -20.9 Contiguous
sq m / person
0.22 0.25 0.24 0.21 0.19 0.18 0.19 -16.9
thousand sq m
294.2 316.4 341.8 305.7 318.9 297.2 324.1 10.2 Remote
sq m / person
0.23 0.25 0.27 0.24 0.25 0.24 0.26 16.0
Table 7. Real estate sales market indicators by municipality types in the Rostov region, 2020.
Number of apartments for sale Number of individual houses for
sale
Price of 1 sq m of living space for a 1-room apartment Municipality type
Total Per 1000 people
Total Per 1000 people
Thousand rubles
Rostov-on-Don 44725 39.5 13464 11.9 59.04
Agglomerative 13550 9.6 24286 17.2 30.69
Contiguous 248 0.6 526 1.2 23.72
Remote 2088 1.7 1911 1.5 22.96
Fig.6. Distribution of municipalities in the Rostov
region by housing (2020).
Most real estate advertisements are presented in the municipalities of the agglomeration core and the transit municipalities of large transport routes. Leadership in the supply of housing is held by Rostov-on-Don, where 44,725 apartments and 13,464 individual houses are for sale. The top-five also included the agglomerative type of municipalities – Taganrog (4,404 apartments and 2,623 houses), Bataysk (3,354 apartments and 11,731 houses), Aksaysky municipal district (2,569 apartments and 2,081 houses) and Novocherkassk (1,682 apartments and 2,784 houses), all having a positive migration influx of the population due to intraregional migration.
Up to 40% of apartments for sale are one-bedroom flats. A striking example is Bataisk with a significant amount of supply of individual houses,
Social Effects of Agglomeration. An Assessment of Intraregional Disparities in the South of Russia Journal of Settlements and Spatial Planning, vol. 11, no. 2 (2020) 113-126
121
which is determined by the historical specifics of the city’s development dominated by one-storey private houses. A third of the population of this urban district previously lived in the village of Koysug, which became part of Bataysk in 1959. New residential neighbourhoods with multi-storey buildings are being built mainly in the Severny and Zarya districts, where there is a transport artery for communication with Rostov-on-Don and there is a developed social infrastructure. Rostov residents are increasingly buying real estate in Bataysk because of more comfortable living conditions and faster access to the centre of Rostov-on-Don, which has led to equalization of prices per square meter between Bataysk and some areas of Rostov-on-Don. The area of attractiveness for life near Rostov-on-Don is also Aksaysky, which in 2017 was recognized as the most comfortable place for living in the Rostov region by the RostovGazeta news agency. The criteria used are demography, health preservation, natural environment, education, employment, and public infrastructure. The analysis on the average cost of 1 sq m of one-room apartment, by municipality type, demonstrates a pronounced agglomeration influence. The highest price for 1 sq m is typical for apartments located in the agglomeration core (Rostov-on-Don) – 59.04 thousand rubles, and then decreasing: for the group of agglomerative – 30.69 thousand rubles, for the contiguous – 23.72 thousand rubles, and for the remote – 22.96 thousand rubles (Table 7).
Paired correlation coefficients calculated between indicators of the distance from the administrative centre of the municipality to Rostov-on-Don, on the one hand, and the number of apartments for sale per 1000 inhabitants, price per 1 sq m, and volume of commissioning of residential buildings per person, on the other hand. The values are negative, namely -0.398; -0.373; -0.502. This indicates that the farther from the core of the agglomeration, the less active the processes of housing construction and the lower prices for housing, which is associated with both lower demand and purchasing power of the population (Fig. 7).
Note: circle size stands for the number of apartments for
sale per 1000 people.
Fig. 7. Distribution of municipalities by some indicators of the housing of the Rostov region, 2019.
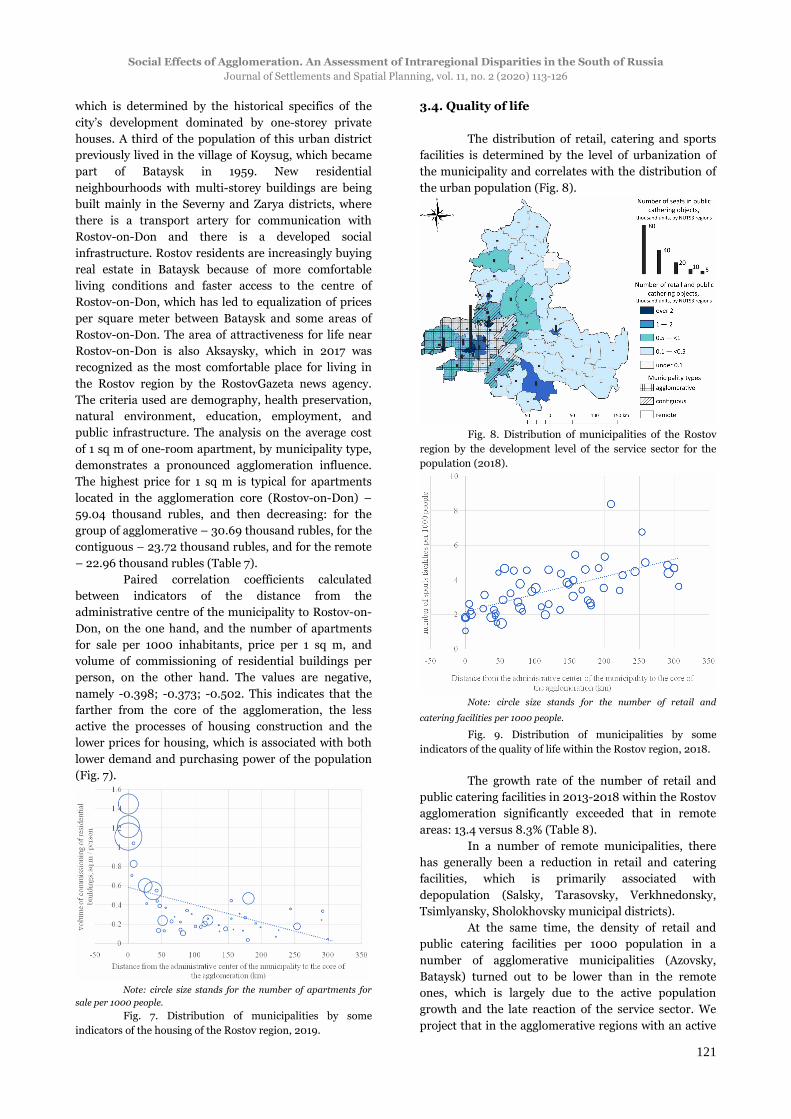
3.4. Quality of life
The distribution of retail, catering and sports facilities is determined by the level of urbanization of the municipality and correlates with the distribution of the urban population (Fig. 8).
Fig. 8. Distribution of municipalities of the Rostov
region by the development level of the service sector for the population (2018).
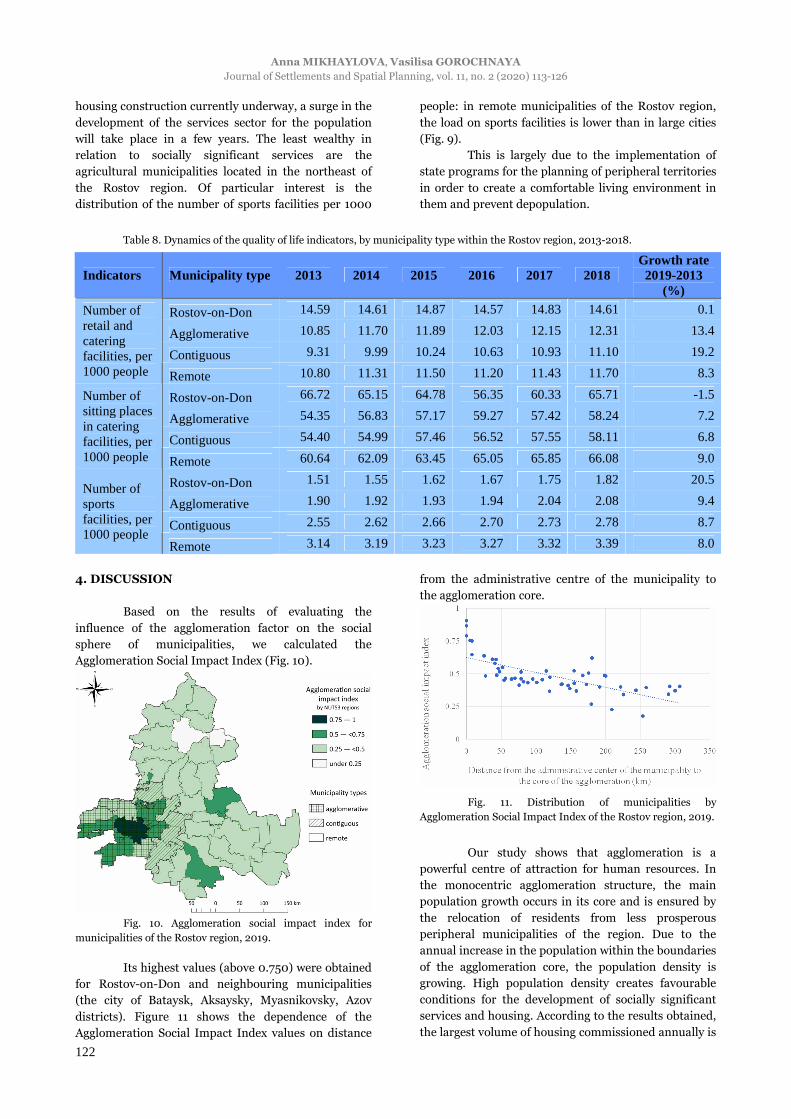
Note: circle size stands for the number of retail and
catering facilities per 1000 people.
Fig. 9. Distribution of municipalities by some indicators of the quality of life within the Rostov region, 2018.
The growth rate of the number of retail and
public catering facilities in 2013-2018 within the Rostov agglomeration significantly exceeded that in remote areas: 13.4 versus 8.3% (Table 8).
In a number of remote municipalities, there has generally been a reduction in retail and catering facilities, which is primarily associated with depopulation (Salsky, Tarasovsky, Verkhnedonsky, Tsimlyansky, Sholokhovsky municipal districts).
At the same time, the density of retail and public catering facilities per 1000 population in a number of agglomerative municipalities (Azovsky, Bataysk) turned out to be lower than in the remote ones, which is largely due to the active population growth and the late reaction of the service sector. We project that in the agglomerative regions with an active
Anna MIKHAYLOVA, Vasilisa GOROCHNAYA Journal of Settlements and Spatial Planning, vol. 11, no. 2 (2020) 113-126
122
housing construction currently underway, a surge in the development of the services sector for the population will take place in a few years. The least wealthy in relation to socially significant services are the agricultural municipalities located in the northeast of the Rostov region. Of particular interest is the distribution of the number of sports facilities per 1000
people: in remote municipalities of the Rostov region, the load on sports facilities is lower than in large cities (Fig. 9).
This is largely due to the implementation of state programs for the planning of peripheral territories in order to create a comfortable living environment in them and prevent depopulation.
Table 8. Dynamics of the quality of life indicators, by municipality type within the Rostov region, 2013-2018.
Indicators Municipality type 2013 2014 2015 2016 2017 2018 Growth rate 2019-2013
(%)
Rostov-on-Don 14.59 14.61 14.87 14.57 14.83 14.61 0.1
Agglomerative 10.85 11.70 11.89 12.03 12.15 12.31 13.4
Contiguous 9.31 9.99 10.24 10.63 10.93 11.10 19.2
Number of retail and catering facilities, per 1000 people Remote 10.80 11.31 11.50 11.20 11.43 11.70 8.3
Rostov-on-Don 66.72 65.15 64.78 56.35 60.33 65.71 -1.5
Agglomerative 54.35 56.83 57.17 59.27 57.42 58.24 7.2
Contiguous 54.40 54.99 57.46 56.52 57.55 58.11 6.8
Number of sitting places in catering facilities, per 1000 people Remote 60.64 62.09 63.45 65.05 65.85 66.08 9.0
Rostov-on-Don 1.51 1.55 1.62 1.67 1.75 1.82 20.5
Agglomerative 1.90 1.92 1.93 1.94 2.04 2.08 9.4
Contiguous 2.55 2.62 2.66 2.70 2.73 2.78 8.7
Number of sports facilities, per 1000 people
Remote 3.14 3.19 3.23 3.27 3.32 3.39 8.0
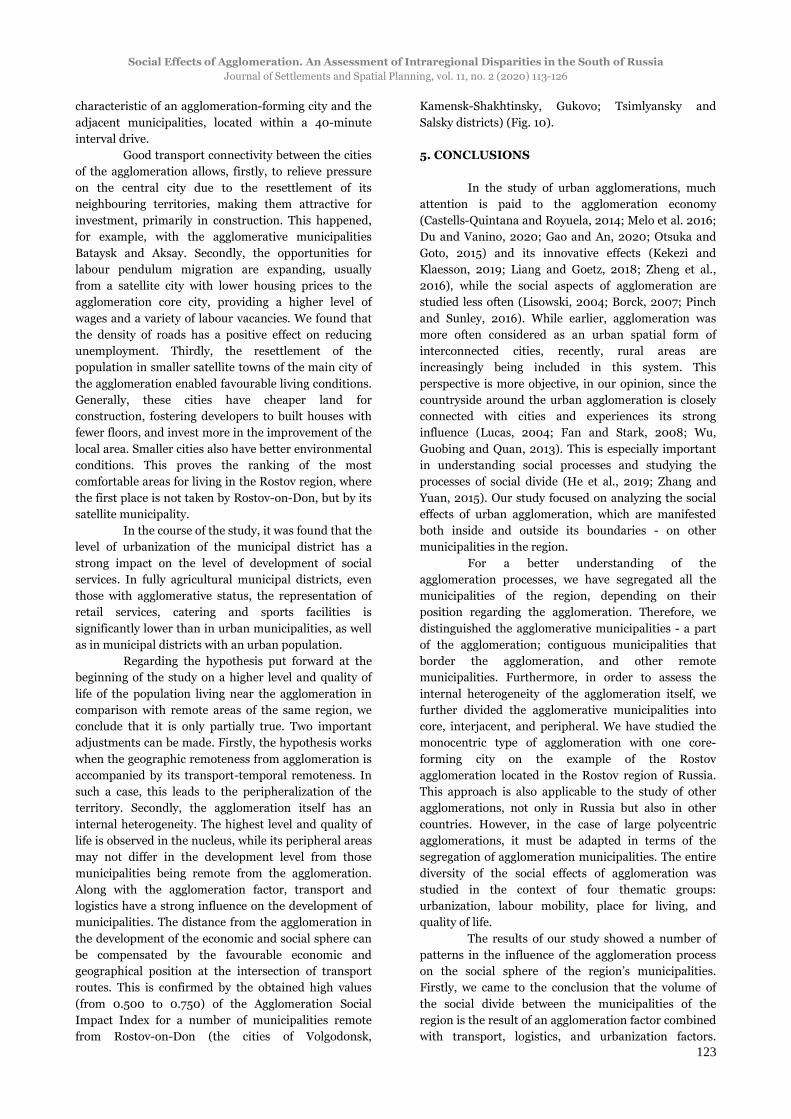
4. DISCUSSION
Based on the results of evaluating the influence of the agglomeration factor on the social sphere of municipalities, we calculated the Agglomeration Social Impact Index (Fig. 10).
Fig. 10. Agglomeration social impact index for
municipalities of the Rostov region, 2019.
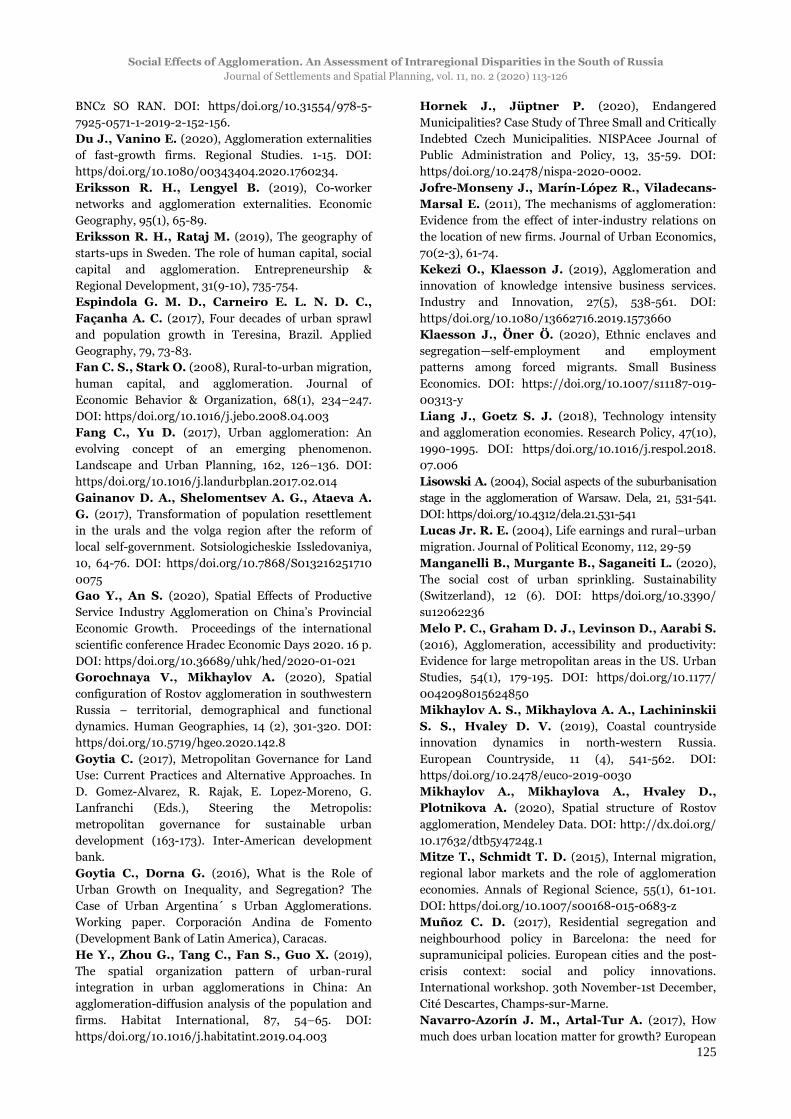
Its highest values (above 0.750) were obtained for Rostov-on-Don and neighbouring municipalities (the city of Bataysk, Aksaysky, Myasnikovsky, Azov districts). Figure 11 shows the dependence of the Agglomeration Social Impact Index values on distance
from the administrative centre of the municipality to the agglomeration core.
Fig. 11. Distribution of municipalities by
Agglomeration Social Impact Index of the Rostov region, 2019.
Our study shows that agglomeration is a powerful centre of attraction for human resources. In the monocentric agglomeration structure, the main population growth occurs in its core and is ensured by the relocation of residents from less prosperous peripheral municipalities of the region. Due to the annual increase in the population within the boundaries of the agglomeration core, the population density is growing. High population density creates favourable conditions for the development of socially significant services and housing. According to the results obtained, the largest volume of housing commissioned annually is
Social Effects of Agglomeration. An Assessment of Intraregional Disparities in the South of Russia Journal of Settlements and Spatial Planning, vol. 11, no. 2 (2020) 113-126
123
characteristic of an agglomeration-forming city and the adjacent municipalities, located within a 40-minute interval drive.
Good transport connectivity between the cities of the agglomeration allows, firstly, to relieve pressure on the central city due to the resettlement of its neighbouring territories, making them attractive for investment, primarily in construction. This happened, for example, with the agglomerative municipalities Bataysk and Aksay. Secondly, the opportunities for labour pendulum migration are expanding, usually from a satellite city with lower housing prices to the agglomeration core city, providing a higher level of wages and a variety of labour vacancies. We found that the density of roads has a positive effect on reducing unemployment. Thirdly, the resettlement of the population in smaller satellite towns of the main city of the agglomeration enabled favourable living conditions. Generally, these cities have cheaper land for construction, fostering developers to built houses with fewer floors, and invest more in the improvement of the local area. Smaller cities also have better environmental conditions. This proves the ranking of the most comfortable areas for living in the Rostov region, where the first place is not taken by Rostov-on-Don, but by its satellite municipality.
In the course of the study, it was found that the level of urbanization of the municipal district has a strong impact on the level of development of social services. In fully agricultural municipal districts, even those with agglomerative status, the representation of retail services, catering and sports facilities is significantly lower than in urban municipalities, as well as in municipal districts with an urban population.
Regarding the hypothesis put forward at the beginning of the study on a higher level and quality of life of the population living near the agglomeration in comparison with remote areas of the same region, we conclude that it is only partially true. Two important adjustments can be made. Firstly, the hypothesis works when the geographic remoteness from agglomeration is accompanied by its transport-temporal remoteness. In such a case, this leads to the peripheralization of the territory. Secondly, the agglomeration itself has an internal heterogeneity. The highest level and quality of life is observed in the nucleus, while its peripheral areas may not differ in the development level from those municipalities being remote from the agglomeration. Along with the agglomeration factor, transport and logistics have a strong influence on the development of municipalities. The distance from the agglomeration in the development of the economic and social sphere can be compensated by the favourable economic and geographical position at the intersection of transport routes. This is confirmed by the obtained high values (from 0.500 to 0.750) of the Agglomeration Social Impact Index for a number of municipalities remote from Rostov-on-Don (the cities of Volgodonsk,
Kamensk-Shakhtinsky, Gukovo; Tsimlyansky and Salsky districts) (Fig. 10). 5. CONCLUSIONS
In the study of urban agglomerations, much attention is paid to the agglomeration economy (Castells-Quintana and Royuela, 2014; Melo et al. 2016; Du and Vanino, 2020; Gao and An, 2020; Otsuka and Goto, 2015) and its innovative effects (Kekezi and Klaesson, 2019; Liang and Goetz, 2018; Zheng et al., 2016), while the social aspects of agglomeration are studied less often (Lisowski, 2004; Borck, 2007; Pinch and Sunley, 2016). While earlier, agglomeration was more often considered as an urban spatial form of interconnected cities, recently, rural areas are increasingly being included in this system. This perspective is more objective, in our opinion, since the countryside around the urban agglomeration is closely connected with cities and experiences its strong influence (Lucas, 2004; Fan and Stark, 2008; Wu, Guobing and Quan, 2013). This is especially important in understanding social processes and studying the processes of social divide (He et al., 2019; Zhang and Yuan, 2015). Our study focused on analyzing the social effects of urban agglomeration, which are manifested both inside and outside its boundaries - on other municipalities in the region.
For a better understanding of the agglomeration processes, we have segregated all the municipalities of the region, depending on their position regarding the agglomeration. Therefore, we distinguished the agglomerative municipalities - a part of the agglomeration; contiguous municipalities that border the agglomeration, and other remote municipalities. Furthermore, in order to assess the internal heterogeneity of the agglomeration itself, we further divided the agglomerative municipalities into core, interjacent, and peripheral. We have studied the monocentric type of agglomeration with one core-forming city on the example of the Rostov agglomeration located in the Rostov region of Russia. This approach is also applicable to the study of other agglomerations, not only in Russia but also in other countries. However, in the case of large polycentric agglomerations, it must be adapted in terms of the segregation of agglomeration municipalities. The entire diversity of the social effects of agglomeration was studied in the context of four thematic groups: urbanization, labour mobility, place for living, and quality of life.
The results of our study showed a number of patterns in the influence of the agglomeration process on the social sphere of the region’s municipalities. Firstly, we came to the conclusion that the volume of the social divide between the municipalities of the region is the result of an agglomeration factor combined with transport, logistics, and urbanization factors.

Anna MIKHAYLOVA, Vasilisa GOROCHNAYA Journal of Settlements and Spatial Planning, vol. 11, no. 2 (2020) 113-126
124
Agglomeration sets the general social dynamics of the development of municipalities within a region, drawing resources into its core. The bulk of the region’s population is concentrated in the municipalities of the agglomeration core. At the same time, there is a tendency to a gradual increase in the density of agglomeration due to the influx of population from other municipalities in the region - primarily agricultural ones. The impact of two other factors can distort the centrifugal forces of the agglomeration, which results in the formation of separate, unconnected growth poles within a region on the basis of distant cities of a smaller size.
Secondly, as economic development and clustering of the core-forming agglomeration city take place, part of its workforce perform pendulum migration from its satellite cities. This becomes possible both due to the temporal proximity of satellite towns to the core city due to the development of transport infrastructure and by providing better living conditions due to the influx of investments: new modern residential neighbourhoods with a well-equipped territory, a more favourable environmental situation, better social security infrastructure (new kindergartens, schools, sports facilities are being built). However, the pace of development of the retail trade and public catering sectors is not always keeping up with population growth rates in these municipalities.
Thirdly, municipalities with a completely rural population cannot take full advantage of their proximity of the agglomeration core if they are deprived of good transport connectivity to the core-forming agglomeration city. In this case, they are characterized by the course of the same negative trends as in the remote municipalities experiencing depopulation. The results obtained are of both theoretical value for studying the social effects of agglomeration processes, and practical significance from the point of view of building an inter-municipal management system. In the further study, more attention should be paid to studying the mechanisms of effective integration of the rural population in a highly urbanized environment in order to achieve sustainability in the development of rural areas and prevent their peripheralization. 6. ACKNOWLEDGEMENTS
The reported study was funded by RFBR according to the research project № 18-310-20016 “Coastal cities in innovation spaces of the European part of Russia”. Vasilisa Gorochnaya expressed her gratitude to the 5-100 competitiveness program of the Immanuel Kant Baltic Federal University for supporting their research fellowship. Authors would like to acknowledge the contribution of Andrey Mikhaylov for supervising the research, as well as Dmitry Hvaley and Angelina Plotnikova for support with cartographic materials.
REFERENCES Amarante P. A., da Silva M. V. B., do Monte P. A. (2019), Inter-industry relations and agglomeration economies in Brazil: an approach based on firm creation. Revista Brasileira de Estudos Regionais e Urbanos, 13(3), 309-339. Badach E., Cymanow P. (2019), Impact of agglomerations on social, agricultural and environmental transformations of neighbouring municipalities. Roczniki Naukowe Stowarzyszenia Ekonomistów Rolnictwai Agrobiznesu, XXI, 24-35. DOI: https/doi.org/10.5604/01.3001.0013.6023. Badr K., Rizk R., Zaki C. (2019), Firm productivity and agglomeration economies: evidence from Egyptian data. Applied Economics, 51(51), 5528-5544. DOI: https/doi.org/10.1080/00036846.2019.1613506. Bharathi N., Malghan D., Mishra S., Rahman A. (2020), Fractal Urbanism: City Size and Residential Segregation in India. IIM Bangalore Research Paper, 616. Blanco I., Cruz H., Martínez R. (2017), Crisis, urban segregation and social innovation in Catalonia. Partecipazione e conflitto. The Open Journal of Sociopolitical Studies, 10 (1), 221-245. Borck R. (2007), Consumption and Social Life in Cities: Evidence from Germany. Urban Studies, 44(11), 2105-2121. DOI: https/doi.org/10.1080/00420980701 518925 Castells-Quintana D., Royuela V. (2014), Agglomeration, inequality and economic growth. The Annals of Regional Science, 52(2), 343-366. DOI: https/doi.org/10.1007/s00168-014-0589-1 Catela E. Y., Porcile G., Gonçalves F. D. (2010), Brazilian municipalities: Agglomeration economies and development levels in 1997 and 2007. Cepal Review, 141-156. Ciommi M. T., Zambon I., Salvati L. (2019), Population dynamics, agglomeration economies and municipal size: a long-term analysis. Journal of Urban & Regional Analysis, 11(1), 5-17. Ciommi M., Egidi G., Salvia R., Cividino S., Rontos K., Salvati L. (2020), Population dynamics and agglomeration factors: A non-linear threshold estimation of density effects. Sustainability (Switzerland), 12 (6). DOI: https/doi.org/10.3390/ su12062257 Costa R., De Valk H. A. (2018), Ethnic and socioeconomic segregation in Belgium: A multiscalar approach using individualisedneighbourhoods. European Journal of Population, 34(2), 225-250. Csanádi G., Csizmady A. (2019), Residential segregation and suburban development in post-socialist agglomerations. In "Prigorodnaya revolyuciya" v regional`nomsreze: periferijny`e gorodskie territorii na post sovetskom prostranstve: Sbornik tezisov dokladov mezhdunarodno nauchnoj konferencii. Izdatel`stvo
Social Effects of Agglomeration. An Assessment of Intraregional Disparities in the South of Russia Journal of Settlements and Spatial Planning, vol. 11, no. 2 (2020) 113-126
125
BNCz SO RAN. DOI: https/doi.org/10.31554/978-5-7925-0571-1-2019-2-152-156. Du J., Vanino E. (2020), Agglomeration externalities of fast-growth firms. Regional Studies. 1-15. DOI: https/doi.org/10.1080/00343404.2020.1760234. Eriksson R. H., Lengyel B. (2019), Co-worker networks and agglomeration externalities. Economic Geography, 95(1), 65-89. Eriksson R. H., Rataj M. (2019), The geography of starts-ups in Sweden. The role of human capital, social capital and agglomeration. Entrepreneurship & Regional Development, 31(9-10), 735-754. Espindola G. M. D., Carneiro E. L. N. D. C., Façanha A. C. (2017), Four decades of urban sprawl and population growth in Teresina, Brazil. Applied Geography, 79, 73-83. Fan C. S., Stark O. (2008), Rural-to-urban migration, human capital, and agglomeration. Journal of Economic Behavior & Organization, 68(1), 234–247. DOI: https/doi.org/10.1016/j.jebo.2008.04.003 Fang C., Yu D. (2017), Urban agglomeration: An evolving concept of an emerging phenomenon. Landscape and Urban Planning, 162, 126–136. DOI: https/doi.org/10.1016/j.landurbplan.2017.02.014 Gainanov D. A., Shelomentsev A. G., Ataeva A. G. (2017), Transformation of population resettlement in the urals and the volga region after the reform of local self-government. Sotsiologicheskie Issledovaniya, 10, 64-76. DOI: https/doi.org/10.7868/S013216251710 0075 Gao Y., An S. (2020), Spatial Effects of Productive Service Industry Agglomeration on China’s Provincial Economic Growth. Proceedings of the international scientific conference Hradec Economic Days 2020. 16 p. DOI: https/doi.org/10.36689/uhk/hed/2020-01-021 Gorochnaya V., Mikhaylov A. (2020), Spatial configuration of Rostov agglomeration in southwestern Russia – territorial, demographical and functional dynamics. Human Geographies, 14 (2), 301-320. DOI: https/doi.org/10.5719/hgeo.2020.142.8 Goytia C. (2017), Metropolitan Governance for Land Use: Current Practices and Alternative Approaches. In D. Gomez-Alvarez, R. Rajak, E. Lopez-Moreno, G. Lanfranchi (Eds.), Steering the Metropolis: metropolitan governance for sustainable urban development (163-173). Inter-American development bank. Goytia C., Dorna G. (2016), What is the Role of Urban Growth on Inequality, and Segregation? The Case of Urban Argentina´ s Urban Agglomerations. Working paper. Corporación Andina de Fomento (Development Bank of Latin America), Caracas. He Y., Zhou G., Tang C., Fan S., Guo X. (2019), The spatial organization pattern of urban-rural integration in urban agglomerations in China: An agglomeration-diffusion analysis of the population and firms. Habitat International, 87, 54–65. DOI: https/doi.org/10.1016/j.habitatint.2019.04.003
Hornek J., Jüptner P. (2020), Endangered Municipalities? Case Study of Three Small and Critically Indebted Czech Municipalities. NISPAcee Journal of Public Administration and Policy, 13, 35-59. DOI: https/doi.org/10.2478/nispa-2020-0002. Jofre-Monseny J., Marín-López R., Viladecans-Marsal E. (2011), The mechanisms of agglomeration: Evidence from the effect of inter-industry relations on the location of new firms. Journal of Urban Economics, 70(2-3), 61-74. Kekezi O., Klaesson J. (2019), Agglomeration and innovation of knowledge intensive business services. Industry and Innovation, 27(5), 538-561. DOI: https/doi.org/10.1080/13662716.2019.1573660 Klaesson J., Öner Ö. (2020), Ethnic enclaves and segregation—self-employment and employment patterns among forced migrants. Small Business Economics. DOI: https://doi.org/10.1007/s11187-019-00313-y Liang J., Goetz S. J. (2018), Technology intensity and agglomeration economies. Research Policy, 47(10), 1990-1995. DOI: https/doi.org/10.1016/j.respol.2018. 07.006 Lisowski A. (2004), Social aspects of the suburbanisation stage in the agglomeration of Warsaw. Dela, 21, 531-541. DOI: https/doi.org/10.4312/dela.21.531-541 Lucas Jr. R. E. (2004), Life earnings and rural–urban migration. Journal of Political Economy, 112, 29-59 Manganelli B., Murgante B., Saganeiti L. (2020), The social cost of urban sprinkling. Sustainability (Switzerland), 12 (6). DOI: https/doi.org/10.3390/ su12062236 Melo P. C., Graham D. J., Levinson D., Aarabi S. (2016), Agglomeration, accessibility and productivity: Evidence for large metropolitan areas in the US. Urban Studies, 54(1), 179-195. DOI: https/doi.org/10.1177/ 0042098015624850 Mikhaylov A. S., Mikhaylova A. A., Lachininskii S. S., Hvaley D. V. (2019), Coastal countryside innovation dynamics in north-western Russia. European Countryside, 11 (4), 541-562. DOI: https/doi.org/10.2478/euco-2019-0030 Mikhaylov A., Mikhaylova A., Hvaley D., Plotnikova A. (2020), Spatial structure of Rostov agglomeration, Mendeley Data. DOI: http://dx.doi.org/ 10.17632/dtb5y4724g.1 Mitze T., Schmidt T. D. (2015), Internal migration, regional labor markets and the role of agglomeration economies. Annals of Regional Science, 55(1), 61-101. DOI: https/doi.org/10.1007/s00168-015-0683-z Muñoz C. D. (2017), Residential segregation and neighbourhood policy in Barcelona: the need for supramunicipal policies. European cities and the post-crisis context: social and policy innovations. International workshop. 30th November-1st December, Cité Descartes, Champs-sur-Marne. Navarro-Azorín J. M., Artal-Tur A. (2017), How much does urban location matter for growth? European
Anna MIKHAYLOVA, Vasilisa GOROCHNAYA Journal of Settlements and Spatial Planning, vol. 11, no. 2 (2020) 113-126
126
Planning Studies, 25 (2), 298-313. DOI: https/ doi.org/10.1080/09654313.2016.1262825 Nijenhuis R. (2019), The effect of housing prices on the relatedness and complexity of Dutch municipalities. Utrecht University, Faculty of geosciences. https://dspace.library.uu.nl/handle/1874/383616 Opoku S. K. (2019), Effects of Urbanization on the Availability of Land for Crop Farming: A Case Study of Ga East Municipality. University of Ghana. Otsuka A., Goto M. (2015), Agglomeration economies in Japanese industries: the Solow residual approach. The Annals of Regional Science 54, 401-416. DOI: https/doi.org/10.1007/s00168-015-0659-z Pepliński B. (2020), Location of Cows and Pigs in Suburban Areas of Polish Metropolitan Centers. Sustainability, 12, 2619. DOI: https/doi.org/10.3390/ su12072619. Pereira G., Moreira T. (2018), A proposal to redesign the map of the regions of Brazil: Agglomerating neighbouring and socioeconomically homogeneous municipalities. Regional Science Policy & Practice, 12(1), 167-183. DOI: https/doi.org/10.1111/ rsp3.12142. Pinch S., Sunley P. (2016), Do Urban Social Enterprises Benefit from Agglomeration? Evidence from Four UK Cities, Regional Studies, 50(8), 1290-1301, DOI: https/doi.org/ 10.1080/00343404.2015. 1034667 Pose D. P., Martínez-Filgueira X. M., López-Iglesias E. (2020), Productive vs. residential economy: Factors behind the recovery of rural areas in socioeconomic decline. RevistaGalega De Economia, 29 (2), 1-30. DOI: https/doi.org/10.15304/rge.29.2.6744 Queiroz B. L., Golgher A. B. (2008), Human capital differentials across municipalities and states in Brazil. Population Review, 47(2). DOI: https/doi.org/10.1353/ prv.0.0008 Raiher A. (2019), Economies of agglomeration and their relation with industrial productivity in Brazilian municipalities. Papers in Regional Science, 99(3), 725-747. DOI: https/doi.org/10.1111/pirs.12487. Sass K. S., Porsse A. A. (2020), Urban sprawl and the cost of providing local public services: Empirical evidence for brazilian municipalities. Regional Science Policy and Practice, Article in press. DOI: https/doi.org/10.1111/rsp3.12345 Shmidt A. V., Antonyuk V. S., Francini A. (2016), Urban agglomerations in regional development:
Theoretical, methodological and applied aspects. Economy of Region, (3), 776-789. DOI: https/doi.org/ 10.17059/2016-3-14 Tao M., Huang Y., Tao H. (2020), Urban network externalities, agglomeration economies and urban economic growth. Cities, 107 DOI: https/doi.org/ 10.1016/j.cities.2020.102882 Tkachenko A. A., Fomkina A. A. (2015), Agglomerated settlement pattern: Identification and accounting. Regional Research of Russia, 5 (2), 173-177. DOI: https/doi.org/10.1134/S2079970515020124 Tóth G., Wachs J., Di Clemente R., Jakobi Á., Ságvári B., Kertész J., Lengyel B. (2019), Inequality is rising where social network segregation interacts with urban topology. arXiv preprint arXiv:1909.11414. Pre-print. Ubeda M. (2019), Local Amenities and Income Disparities within Cities. In Public Policies, Cities and Regions workshop, 2019. Verdugo G. (2011), Public housing and residential segregation of immigrants in France, 1968-1999. Population, 66(1), 169-193. Wu C., Guobing W., Quan Z. (2013), Affection of Agglomeration Spatial Externality, Urban-rural Labor Mobility on Income Gap. Industrial Economics Research, 2 Xu H. (2020), Land Price Fluctuations, Commercial-Residential Segregation, and Gentrification. MPRA Paper 98844, University Library of Munich, Germany Yang Z., Pan Y. (2020), Human capital, housing prices, and regional economic development: Will “vying for talent” through policy succeed? Cities, 98 DOI: https/doi.org/10.1016/j.cities.2019.102577 Yu N., de Roo G., de Jong M., Storm S. (2016), Does the expansion of a motorway network lead to economic agglomeration? evidence from china. Transport Policy, 45, 218-227. DOI: https/doi.org/ 10.1016/j.tranpol.2015.03.014 Zhang X., Yuan D. (2015), A study on the relationship between urban and rural coordination and integration from the perspective of urban agglomeration: A case study of the northern gulf of Guangxi. Journal of Hunan City University, 36 (1), 95-99. Zheng S., Sun W., Wu J., Kahn M. E. (2016), Urban Agglomeration and Local Economic Growth in China: The Role of New Industrial Parks. SSRN Electronic Journal. DOI: https/doi.org/10.2139/ssrn. 2746711’