annals, association of american geographers
TRANSCRIPT

The Localized Geographies of Violence in the North Caucasus of Russia, 1999-2007
John O’Loughlin
Frank Witmer
Institute of Behavioral Science University of Colorado at Boulder
Campus Box 487 Boulder CO. 80309-0487
USA
Email: [email protected]; [email protected]
Forthcoming: Annals, Association of American Geographers. Acknowledgements: The authors thank the National Science Foundation’s Human and Social Dynamics program (grant number 0433927) for the financial support that made possible both the fieldwork in the North Caucasus in 2005-2007 and the events data collection. Gearóid Ó Tuathail and Vladimir Kolossov again proved to be inestimable colleagues in the larger project on war outcomes in Bosnia and the North Caucasus, and continued to offer invigorating comradeship during the field excursions. Sitora Rashidova, Yana Raycheva, Mary Robinson and Evan O’Loughlin painstakingly coded and geo-located the events data over many long months. Nancy Thorwardson of Computing and Research Services at the Institute of Behavioral Science, University of Colorado prepared the figures for publication with her exemplary skill, punctuality, humor, and élan, and cast her editorial cold eye on our earlier texts. The paper also benefited from three anonymous reviews of an earlier version and from the comments and questions of colleagues at the 2007 Conference of Irish Geographers in Dublin, seminars in the Geography Department of Dartmouth College, University of Edinburgh and University of Plymouth, at the Kennan Institute in the Woodrow Wilson International Center for Scholars, the Institute of Behavioral Science and the 2008 Boston meeting of the Association of American Geographers. Any remaining errors are all ours.

1
Abstract The second Chechen war, starting in the North Caucasus in August 1999, shows few
signs of a ceasefire after almost ten years, though the level of violence has declined from
the peaks of the war’s first two years. Initially framed by both sides as a war between
separatists versus the federal center, the situation is now complicated by the installation
of a Moscow ally into power in Chechnya and the splintering of the opposition into
groups with diverse aims and theaters of operation. The main rebel movement has
declared the establishment of an Islamic caliphate in all the Muslim republics of the
North Caucasus as its ultimate goal. Fears of regional destabilization of the entire
North Caucasus of Russia are propelled by reports of increased militant activism in
republics adjoining Chechnya due to possible contagion effects of violence on these
poor areas. Temporal and spatial descriptive statistics of a large database of 14,177
violent events, geocoded by precise location, from August 1999 to August 2007 provide
evidence of the conflict’s diffusion into the republics bordering Chechnya. “Hot spots”
of violence are identified using Kulldorf’s SatScan statistics. A geographically-weighted
regression predictive model of violence indicates that locations in Chechnya and
forested areas have more violence, while areas with high Russian populations and
communities geographically removed from the main federal highway through the
region see less violence.
Key words: civil war, Chechnya, North Caucasus, spatial-statistical analysis, diffusion

2
At the height of the Vietnam War forty years ago, Robert McColl published an article in
this journal titled “The insurgent state: Territorial bases of revolution”. He proposed a
descriptive geographic model of rebel strategies from early (mobile) attacks to later
phases of a rebellion (building a parallel insurgent state with well-protected core areas)
as a manifestation of a territorial imperative (McColl 1969, 613). Using contemporary
insurgencies in China, Indonesia, the Philippines, Indochina and Greece, McColl
identified targeting schemata that balanced rebel resources against the relative value of
the targets. McColl concluded his analysis by stressing the viability of base areas as a
factor in the eventual probability of insurgent success.
Many of the military-geographic studies published since 1969 have a similarly
descriptive and avowedly territorial character. Recently, however, there are calls for the
application of more rigorous methodologies, both to understand the ebb and flow of
fighting in war zones and for post-conflict peace-keeping purposes (see, for example,
the chapters in Palka and Galgano, 2005). In contrast to the environmental and terrain
analysis of military geography stand critical geographic accounts of massive killings of
civilians in Germany and Japan during World War II (Hewitt 1983), the effects on
civilians of U.S. bombings of the dikes in the North during the Vietnamese war (Lacoste
1976), the destruction of cities (Graham 2004), the ‘war on terror’ in the Middle East
(Gregory 2004), and the environment and society impacts of militarization (Woodward
2004). However, compared to other social sciences (history, political science, economics,
social psychology, and sociology) concerned with the impacts of wars on communities
and their inhabitants, the relative lack of geographic work is evident. This article

3
attempts to redress this imbalance by focusing on the localized, geographically
disparate nature of civil wars, now constituting almost all modern warfare. Taking
advantage of the advances in the methods of spatial analysis that have developed since
McColl’s early work on rebellion, it demonstrates the valuable insights of a geographic
approach to understanding the nature of local wars and tracking their dynamics.
In the North Caucasus region of Russia, a second post-Soviet civil war erupted in
August 1999 and continues to the present. Unlike the first Chechen-Russian war of
1994-1996, the current insurgency is diffuse, diverse, geographically- and ethnically-
disparate, and less visible on the world’s television screens. It has evolved into
simmering violence across the six ethnic republics (Chechnya, Dagestan, Karachaevo-
Cherkessia, Kabardino-Balkaria, Ingushetia, and North Ossetia) and the predominantly
ethnically Russian Stavropol’ kray (Gammer 2007; Hughes 2007; Sagramoso, 2007;
Yarlykarpov 2007; Moore and Tumelty 2008; Human Rights Center “Memorial” 2008).
(Locations of the republics are identified on Figure 1). Though highly variable and
subject to the competing claims of federal and insurgent sources, the estimates of dead
in the two wars range from 80,000-100,000 and hundreds of thousands more have been
displaced or fled to avoid violence (O'Loughlin, Kolossov, and Radvanyi 2007; ICG
2008). Though the level of violence is down significantly from its 2001 peak, political
solutions are not widely supported and fears of regional instability due to poverty,
religious and political militancy, corruption and criminality, paramilitary and police
brutality, and the spread of violence from its Chechnya core are frequently expressed by
Russian and international commentators (see, inter alia, Kramer 2005; Peuch 2005;

4
Dunlop and Menon 2006; Russell 2007; Smirnov 2007; Moore 2008). After a long delay
due to reluctance in acknowledging the changing nature of the insurgency, General
Nikolai Rogozhkin, head of Russian Interior Ministry forces in the region, was quoted
by RIA-Novosti as saying that in 2007, a surge in militant activity has been registered in
Chechnya, Dagestan, Ingushetia and Kabardino-Balkaria (North Caucasus Weekly
2008) and rebel websites (e.g. www.kavkaz.org.uk/russ) report an increasing
geographic range of attacks. Tracking and mapping the diversity of violent events
(rebel attacks on security forces and installations, police arrests, military reprisals, and
civilian deaths due to the fighting) over the first eight years of the second Chechen-
Russian war allows analysis of these and similar claims (Moore 2008). Unlike previous
studies that relied on major incidents to make a case for growing regional instability,
14,177 violent events between 1999 and 2007 that are coded precisely by day of
occurrence and geographic location offers a more reliable database for testing the claims
and counter-claims of federal and local governments and the various insurgent groups.
Over the past half-century, the scientific study of war has evolved from
mathematical models of superpower arms races to understanding the distributions of
conflicts through use of economic and political correlates of states at war and recently, a
more focused attention on the characteristics of civil wars in the post-Cold War era as
interstate conflicts are now very rare (Collier and Hoeffler 2001; Sambanis 2002;
O'Loughlin 2004). The most recent development is disaggregating conflict data down
from the country-level to regions and localities under the rubric of GROW (Geographic
Research On War). Because civil wars are usually concentrated in specific regions

5
within a state (e.g. Assam within India) and country-level analysis is thus inappropriate
(Buhaug and Gates 2002; Buhaug and Lujala 2005; Raleigh 2007; O'Loughlin and
Raleigh 2008), this impetus demands detailed information - typically events data
(specific violent events coded for place, time, actor, target, and type). In this respect, a
re-focus on developments within the state (disggregating violence to its local elements)
is responding to a long-standing parallel critique of “the territorial trap” of international
relations by political geographers, with its fixity of structures and paucity of cases (only
the states of the international system) (Agnew, 1994). Because of the perceived threat to
the territorial integrity of post-Soviet Russia especially in the 21 ethnic republics and 10
ethnically-autonomous regions, the rebellion in Chechnya was always more than a local
insurrection. Attempts by the federal center to confine the fighting inside the republic’s
borders has been undermined since the beginning of the conflicts in 1994 by close ethnic
links to neighboring republics, raids by the rebels into adjoining Russian territories,
frequent attacks on Moscow and other targets far from the war-zone, and ties between
the Chechen rebels and supporters abroad.
Since the numerous large and well-used datasets in conflict studies are helpful
only in setting the overall study dimensions (Raleigh and Hegre 2005), our study fits
this new attention to localized violence. Unlike earlier works, we adopt an explicit
spatial-analytical perspective to map and understand violence over time and between
places. Specifically, our study: a) offers a descriptive account of the ebb and flow of
conflict in the North Caucasus between August 1999 (start of the second war in the
region) and August 2007 through cartographic and geo-statistical analysis of

6
dispersion-concentration trends; b) tests the hypothesis of diffusion of conflict from
Chechnya with its important implications for regional stability and for Russia’s regional
politics; and c) examines the ratio of violence (events per population) in the region’s 143
rayoni (counties) and major cities in relation to key political, environmental and
demographic factors in a geographically weighted regression (GWR) analysis.
The Study of Civil Wars and their Geographical Disaggregation
The limitations of so-called country-year approaches that generate a large N by
multiplying all countries and all years (typically since 1945) are evident. In revisiting
the literature published on the subject where conflict typically is represented in less
than 5 percent of the country-year cells, there are multiple and compound explanations
of civil wars, such as greed (economic) and grievance (ethnically-based), locations of
rebel and government targets and bases, environmental (terrain and forest),
institutional factors (effective governance and possibilities for expressing dissent), and
historical factors (the legacies remaining from previous conflicts in specific locales). The
most cited study concluded that civil war presence in a country in a particular year is
related to the factors that encourage insurgency (poverty, weak governments, unstable
politics, rough terrain, and large populations) while undermining arguments that
diverse ethnic populations experience more conflicts (Fearon and Laitin 2003). In fact,
a higher rate of diversity can be more stabilizing than a permanent majority-minority

7
struggle since control of the state apparatus by an ethnic majority can instigate
insurgency (Cederman and Girardin 2007).
The main debate in the civil war literature has been between those who prefer
greed explanations that emphasize the economic and resources incentives to fight, and
the creed emphasis, that examines differences according to ethnicity, religion, and
(increasingly) geographic location (Collier and Hoeffler 1998; de Soysa 2002; Collier,
Elliott, Hegre et al. 2003). A major World Bank research project has highlighted the
evident economic incentives to rebel, especially amongst young men (Collier 2000;
Collier and Hoeffler 2001; Sambanis 2002; Collier, Elliott, Hegre et al. 2003). The
geographer, Philippe Le Billon, has contributed to this debate by drawing attention to
the uneven distribution of lootable resources (e.g. diamonds, oil, forest products, gold)
that can pay for rebellions and thus become the focus of government-rebel actions,
coupled with a strong involvement of outside interests (corporate, criminal and
government) (LeBillon 2001; LeBillon 2008).
The geographic dimension of civil war study, however, still suffers from a weak
conception and poor measures of possible environmental effects on war onset,
frequency, and location. Among the limitations of country-level study is the
assumption of an even distribution of conflict within a country when it is obvious that
most countries experience civil conflicts only in selected locales. Use of country-level
data also tends to ignore non-state actors and international cross-border influences for
which information is difficult to obtain. Specifically, without geo-located information
on conflict events (battles, attacks, reprisals, raids, arrests, etc.), it is not possible to track

8
the to-and-fro of conflict that McColl (1969) identified as a missing piece of the puzzle.
Only with such data can rebel strategies and tactics, as well as government responses,
be analyzed, and explanations for the relative concentration in certain places pursued.
Geo-located data are the basis for the possible use of GIS-based techniques,
including spatially-weighted regression modeling that emphasizes non-stationarity and
coefficient drift, and geo-statistical frameworks to tackle these questions of intra-state
violence (Bailey and Gatrell 1995; Maguire, Batty, and Goodchild 2005). Predictive (e.g.
contagious diffusion) models can be developed to anticipate future attacks on the basis
of spatio-temporal trends, akin to hot-spot and trend analysis for crime data. Key ideas
that lend themselves to aggregate analyses about the causes of wars drawn from the
greed-creed literature can be examined at the local scale if disaggregated data are
available. Such conflict data offer further benefits that are, as yet, rarely pursued in
conflict study; for example, by connecting the local impacts of wars to the immediate
and contextual nature of the communities affected, aid programs can be properly
targeted and distribution points located (Sambanis 2005).
Historical study of civil war violence also suggests the advantages of a geo-
statistical analysis of disaggregated data. While pinpointing the geographical
distribution of revolutionary violence is a daunting task (Fitzpatrick 1978, 212),
historians have nevertheless documented the dynamics of nationalist violence by
compiling data on activists and combining this information with state responses. By
comparing locales of political violence with nearby locales of inactivity, they have been
able to document the key roles played by social and familial networks in mobilizing

9
nationalist agitation and offer a contextually-nuanced explanation of its geography.
Irish studies, in particular, has benefited from this type of work (Rumpf and Helburn
1977; Fitzpatrick 1978; Hart 1997; Hart 1998). Typical data sources (police and military
records, contemporary newspaper stories, memoirs, and interviews recording the time
and place of events) allow the construction of rates of rebel mobilization and
correlations with indices of economic and demographic composition. In Ireland, for
example, rebellion at the local scale was negatively associated with the strength of
economic links between local agricultural production tied to the British markets by
middle-income families. On the other hand, violence was positively associated with
rural poverty, the presence of local activist recruiters (especially school-teachers), a
history of agrarian and nationalist agitation, and geographic peripherality.
What is evident in Irish revolutionary study, a field that is rife with legend, bias,
traditional and revisionist accounts, hagiographies, and charges of brutality and war
crimes is that every activist carried a mental map of 'good' and 'bad' communities —
the former secure and hospitable, the latter potentially treacherous (Hart 1997, 166).
Kalyvas (2006), in the literature review for his magisterial account of the Greek civil war
of the 1940s, reviewed dozens of studies of similar conflicts and concludes that the key
underlying dynamic is the uncertainty of who is friend and who is foe? This
uncertainty sets up a moral hazard problem (i.e. a person insulated from risk may
behave differently from the way he/she would behave if fully exposed to risk).
Defection, denunciation, deterrence, and both discriminate and indiscriminate violence
are perpetrated upon civilians by both rebel and state forces. While Kalyvas was able to

10
account for about two-thirds of the violence among Greek villages by his rational choice
model, most accounts are anecdotal, tracking local legacies of enmity and hate that stem
from previous hostilities. But stereotypical ethnic wars are not always as univariate as
they seem. Bax (1995) delved beyond simple accounts of primitive “Balkanism” to
account for the intra- and inter-ethnic atrocities perpetuated in a small village in Bosnia-
Herzegovina as rational outcomes of strong clan loyalties, struggles for local economic
dominance, competition by religious orders within the Catholic church, and reciprocity
of brutality.
Despite the GROW initiative, much of the information collected is still highly
aggregated and lacks the detailed day-to-day locality-based event information that is
typical of the historical studies. Buhaug and Gates (2002), for example, analyzed yearly
data and centroidal coordinates of 265 civil wars in the Uppsala conflict database from
1946-2000. Later work (Buhaug and Lujala 2005; Buhaug and Rød 2006) extended the
Uppsala conflict data analysis to more sophisticated statistical modeling but the basic
spatial information is still too coarse to facilitate localized accounts of violence. The
research agenda motivating these analyses is inspired by traditional international
relations topics – rebel and government resources, military strategy, terrain and
distance to important objectives like capital cities, etc. Geographic units are generally
assigned a violence score that is cumulated from either the presence of conflict in a
given year, indexed to the scale of violence using the number of casualties or battles, or
included within the spatial range of violence around a pre-identified centroid. A subset
of these kinds of studies relates the ratio of violence to the economic and demographic

11
characteristics of the districts, hypothesizing that specific economic and ethnic
attributes will raise the potential for violence (Gates 2002; Murshed 2002; Murshed and
Gates 2005; Raleigh 2007). Recent worries that changing climates in vulnerable world-
regions will lead to more conflict (through the agency of forced migration and increased
competition with locals for scarce resources) have generated a flurry of interest (Homer-
Dixon 1999). While the aggregate statistical evidence for the connection is still
debatable (Hendrix and Glaser 2007; Nordås and Gleditsch 2007; Raleigh and Urdal
2007; Reuveny 2007), nuanced accounts of specific localities cautiously indicate a causal
relationship (Meier, Bond, and Bond 2007).
Though a long-standing focus of geographic study of conflicts has been on the
diffusion of wars, especially across international borders (O'Loughlin 1986; O'Loughlin
and Anselin 1991; Gleditsch 2002; Ward and Gleditsch 2002; O'Loughlin 2004;
O'Loughlin and Raleigh 2008), civil war study has not yet taken up a close examination
of this phenomenon at the local level. Preliminary accounts are intriguing (O'Loughlin
2004; Raleigh 2007; O'Loughlin and Raleigh 2008) and the mechanisms of conflict
diffusion through the actions of refugees, diasporas, and allied regimes in adjoining
states are now being elaborated (Salehyan and Gleditsch 2006).
The Context of the North Caucasus Conflicts, 1999-2007
In many respects, the North Caucasus conflicts resemble a classic separatist movement
in Chechnya with knock-on consequences into adjoining districts. As noted by Trenin,

12
Malashenko, and Lieven (2004), three types of conflicts have occurred on Russia’s
frontier (the North Caucasus) since the end of the Soviet Union in 1991. The first, best-
known and by far the bloodiest, are the Chechen wars of 1994-1996 and 1999-present
(Dunlop 1998; Politkovskaya 2003; Zärcher, Baev, and Koehler 2005). A ramping–up of
separatist claims in Chechnya, one of 89 subjects of the Russian Federation, developed
at a time of confused political authority at the federal center and uncertainty regarding
the unity of the state in the aftermath of the 1991 independence of the 15 republics of
the Soviet Union. War broke out in August 1994 after President Boris Yeltsin ordered
the end of the secession that had emerged under the leadership of the All-National
Congress of the Chechen People (NCChP) party, headed by former Soviet general
Dzhokhar Dudayev. This war was marked by major battles for control of Grozny (the
capital), and ended with the Khasavyurt Agreement of August 1996 that effectively
granted Chechnya autonomy within the Russian Federation. More than half the
population fled the republic, including most ethnic Russians, and nearly 100,000
military personnel and civilians died (Lieven 1998; Tishkov 2004).
The inter-war period 1996-1999 in Chechnya saw a power-struggle between
Aslan Maskhadov, a former Soviet officer elected as republic president, and Shamil
Basayev, a guerrilla leader active in hostage-taking beyond the war zone, who
advocated a more Islamist position from the leadership and who envisioned a caliphate
across the entire Muslim region of the North Caucasus. As part of this wider strategy,
Basayev and his followers invaded the bordering republic of Dagestan in August 1999,
thereby triggering the second Chechen war. The new Russian leadership of Vladimir

13
Putin, determined to end separatism, developed the “Chechenization” strategy of
placing local allies of the Kremlin into the power positions while isolating and
destroying implacable oppositionists. After deciding on a local rebel clan as the best
option to keep Chechnya within the Russian Federation, the Putin administration
backed the former rebel, Ramzan Kadyrov, who succeeded his assassinated father,
Mufti Akhmad Kadyrov, as Chechen president in 2007. Since 2001, the rebels have
gradually been pushed out of the cities and towns of the steppe and piedmont in the
north and center of Chechnya into the high mountains of the south and the war has
devolved into a partisan-style conflict with frequent attacks on Russian forces and their
local allies (Derlugian 2003; Sagamoso, 2007; Slider 2008).
A second type of conflict in the North Caucasus involves local ethnic groups
disputing traditional territories. The most violent of these, in October 1992, was
between Ingush and Ossetian militias contesting the Prigorodnyyy rayon near
Vladikavkaz (Figure 1), which had been shifted by Stalin to North Ossetia in 1944 after
he deported all Ingush (and Chechens) to central Asia as punishment for their supposed
support of the Nazi invaders. The district remains under the control of the North
Ossetian republic but the dispute remains unsettled as thousands of Ingush remain as
IDPs (Internally Displaced Persons) in the adjoining republic of Ingushetia (O’Loughlin,
Ó Tuathail and Kolossov, 2008). The terrorist attack on the school in the North Ossetian
town of Beslan in September 2004 was connected to this territorial dispute by both the
attackers and the families of the students killed and injured (Ó Tuathail 2009). Less

14
violent, but similar, territorial disputes resulting from Stalin’s mass deportations remain
unresolved in Dagestan (O'Loughlin, Kolossov, and Radvanyi 2007).
The third type of conflict is more amorphous and reflects the growing
radicalization in the region, frequently taking on a religious form. Often, this militancy
is a backlash against the rough and ineffective provocations of Russian military and
police forces as they attempt to identify and arrest oppositionists in this most
militarized region in the world (estimate from Dimitry Kozak, the former federal
plenipotentiary in the region, quoted in Dunlop and Menon 2006). (See also Kramer
2005; Evangelista 2005; Hahn 2008; Hassel 2008). This third type of conflict tends to
have strongly local elements since the impact of religious radicalism is quite scattered in
Kabardino-Balkaria and Karachaevo-Cherkessia, and more widespread in Ingushetia
and Dagestan as a result of the more intensive connections of these republic to events in
Chechnya. Lyall (2006) counted 17 militant groups in the region, with many
leaderships and aims unclear, but inspired by a combination of religious and ethnic
goals. Individual communities such as Buinaksk and Gimry (Dagestan), Nal’chik
(Kabardino-Balkaria), and Nazran (Ingushetia) have become known for frequent violent
clashes between local militants and police-military detachments; this type of conflict is
characterized mainly by assassinations and other attacks on political targets. It is
difficult to parse political from criminal acts since, as is usual in war zones (Collier
2000), criminality and corruption flourish and what appears to be a political
assassination might be motivated by a struggle for control of criminal assets (Moore
2008). The state has responded by supporting local interests who advocate regional,

15
cultural, and religious traditions, including renewed emphasis on Sufist rituals
(Malashenko 2008).
In the North Caucasus environment of great uncertainty about a political future
and of widespread concern about economic prospects, especially amongst young men
(Mendelson and Gerber 2006), the categorization of violent acts is often an uncertain
enterprise. The overall situation in the North Caucasus was summarized by
plenipotentiary Dimitry Kozak in 2005 as a systemic crisis caused by powerful clans
monopolizing the economic and political power in the region. Kozak wrote that “In all
North Caucasus republics, the leading positions in the organs of power and the largest
economic entities are occupied by people who are related to one another. “ (quoted in
Dunlop and Menon 2006, 106). While inter-ethnic violence has been rare, the fine
balance of distribution of resources amongst the dozens of ethnicities in the region
remains an ongoing concern, especially in Dagestan, the most diverse republic. Though
the Putin administration makes frequent recourse to the moniker of Wahhabite
fundamentalism to explain the causes of violence in the North Caucasus (Kynsh 2004),
public opinion locally is more likely to attribute it to poor federal government actions
and criminal activities (Kolossov and Ó Tuathail 2007). Only a tiny minority of the
populations of the North Caucasian republics want separation from Russia through
formation of a national homeland (O'Loughlin and Ó Tuathail 2009).
The North Caucasus Violent Event Database, 1999-2007

16
Following in the tradition of disaggregating civil conflicts through the accumulation of
information on individual incidents, we coded 14,177 violent events between 1 August
1999 and 31 August 2007 in the six ethnic republics (Chechnya, Ingushetia, Karachaevo-
Cherkessia, Kabardino-Balkaria, Dagestan, and North Ossetia) and the adjoining large
territory, Stavropol’ kray, populated mostly by ethnic Russians. (The locations are
identified on Figure 1). We do not analyze the few violent events in the other parts of
the southern Federal district often included in the North Caucasus such as parts of of
Krasnodar kray and the republic of Adygeya because of their distance from the conflict
zone.
Figure 1: Location Map of the North Caucasus of Russia, with boundaries of the republics, their capitals, and key locations mentioned in the text.

17
Unlike Lyall (2006), who collected information on 1,667 rebel attacks between
1999 and 2005, we coded all events that could be construed to be of a political character,
using Lexis-Nexis as our primary source, with rebel internet sites, and Russian and
foreign newspapers and wire services consulted for specific details. Erring on the side
of caution, we did not code killings or injuries that could conceivably be the result of
common criminality; either the target or attacker had to have a clear political character,
often identified through claims of responsibility - whether the victim was a political
office-holder, or location (e.g. police barracks). It is preferable to view the war as a
collection of loosely connected insurgencies that unfold according to different
republican-level logics (Lyall 2006, 16). 1
It is increasingly difficult to completely produce a binary classification of
political and non-political events, their admixture being a characteristic of
contemporary wars (Kaldor 1999). Like Lyall, we coded the target (federal, state, or
local police; the varied types of Russian military forces; political figures; civilians; rebels
or purported rebels; non-governmental organizations; media outlets; infrastructures
such as bridges, railway lines, and communications installations; border posts;
governmental offices); actors (the claimants, or in many cases, those attributed as the
attackers by the media source or the official press release and coded as police, military
or rebels); date; location - village, town/city or specific point such as a crossroad that
was geo-coded using placename/coordinate websites, FallingRain’s Directory of Towns
and Cities in Russia (www.fallingrain.com/world/RS) and the Geonames database
(http://geonames.nga.mil/ggmagaz/geonames4.asp) from the National Geospatial

18
Agency; casualties (killed and injured – civilians, federal, local, or rebel forces);
newspaper or other wire service source; and confirmation by other media reports.
Though we geo-coded events as precisely as possible, locations could not be pinpointed
for 3560 events and these were allocated to the centroid of the rayon or cities in which
they occurred.2
Some data uncertainties limit the analysis. Estimates of casualties are often
highly variable with rebels claiming high numbers for their success in killing Federal
and allied troops, while government sources give much lower figures for the same
event. Because these claims are usually so contradictory, we do not use casualty figures
in this article. We only divided battle-events if there was a significant shift in the
location or scale of the violence during the course of the fighting. Thus, the Beslan
(North Ossetia) killings of September 2004 that resulted in the deaths of 336 civilians
and rescuers and 32 terrorist hostage-takers was coded as one event, even though it
stretched over 3 days. Finally, all events were categorized as military actions, police
actions, rebel actions, or arrests. These latter operations, called zachistki (“mopping-up”
operations featuring mass arrests), often result from the sweeping of a village of young
men by combined military-police forces after a nearby rebel action (Kramer 2005). By
separating the violence into the four categories, we provide more disaggregated
information about both sides (military, police and mass arrests on the government side,
as well as rebels) than is typically the case in civil war research and thus, allows
analysis of both sets of violence perpetrators.

19
To understand the distribution of violence across the 143 rayoni and cities of the
North Caucasus, we collected aggregate information from the 2002 Russian census,
supplemented by population estimates for the geographic units of Chechnya and
Ingushetia by the Danish Refugee council (Trier and Deniev 2000). (In the fog of war,
the reliability of the census figures for these republics is highly questionable). Ethnic
figures and urban-rural populations are generally reliable but we dispensed with
measures of wealth due to concerns about accuracy in an environment with a high
proportion of income generated from unofficial sources (Vendina, Belozerov and
Gustafson, 2007).
Land use/land cover data for the rayoni are derived from the University of
Maryland’s Global Land Cover Facility (GLCF) (http://glcf.umiacs.umd.edu/index.shtml).
This land cover dataset was created using AVHRR satellite data acquired between 1981
and 1994 using a decision tree classifier and finer resolution Landsat imagery (Hansen,
DeFries, Townshend et al. 2000). For our aggregate analyses, the satellite data were
downloaded and georeferenced to the boundary files from ESRI (country borders) and
the University of Washington Central Eurasian Atlas (oblasts and rayons;
http://geo.lib.washington.edu/website/ceir/). To simplify the presentation of the land cover
data, the original 14 categories were reclassified and forest cover defined as Evergreen
Needleleaf/Broadleaf, Deciduous Needleleaf/Broadleaf, Mixed Forest, and Woodland
where each has more than 40 percent canopy cover with trees exceeding 5m in height
(Hansen, DeFries, Townshend et al., 2000). The mean elevation data for rayoni and

20
cities were calculated from the Shuttle Radar Topography Mission (SRTM) elevation
data (nominal 90m pixel resolution), and available from http://seamless.usgs.gov/.
Descriptive Longitudinal and Geographic Distribution of Violence
Violence in the North Caucasus peaked in April 2001, about 18 months after the second
war began. Though there has been a reduction in overall violence, and in each of the 4
types of events (police, military, rebel, and arrest), a detectable seasonal pattern of
violence, with an upsurge in spring followed by a decline in late autumn, is evident in
Figure 2a. After a fairly steady period of moderate violence between 2002 and 2006, the
last 18 months of the data series confirm a significant decline to spring 2007, followed
by an upsurge in the last four months of the series. Much of the explanation for these
trends relates to the Chechenization of the war and the switch of the former rebel
Akhmad Kadyrov (and later his son, Ramzan) to the government side in 1999. Well-
armed and well-financed, hundreds of rebels are estimated to have switched their
support to the republican leadership (Kramer 2006; Ouvaroff 2008). Furthermore, the
leadership of the Chechen rebels was devastated in 2005-06, with the killing of key
leaders including Aslan Maskhadov and Shamil Basayev, and while the active rebels
are estimated to number no more than 1000, they still launch daily attacks despite
Kremlin claims of stability (Smirnov 2007; Abdullaev 2008; North Caucasus Weekly
2008).
By classifying the violent events by republic location in Figure 2b, we can
clearly see the dominance of Chechnya (81 percent of all events) and the growing

21
importance of Ingushetia toward the end of the series. Dagestan was more prominent
early in the second Caucasus war since it started there in August 1999, and this republic
suffered an upsurge in violence in 2005; Dagestan has been the site of 8 percent (1151) of
all events. Ingushetia accounts for 6.6 percent of all violence, a ratio that increased in
the last few years of the data series as militant groups became more active in this small
republic bordering Chechnya, a trend that continued into 2008. Beyond these three
republics, the other four regions (Stavropol’ kray, North Ossetia, Kabardino-Balkaria,
and Karachayevo-Cherkessia)
Figure 2: Monthly Distribution of Violent Events in the North Caucasus August 1999-August 2007, a) by Type of Violence and b) by Republic.
collectively only counted for 4 percent of events but two of these were very violent with
hundreds of lives lost in hostage-taking at a school (Beslan, September 2004), and
attacks on military and police installations (Nal’chik, October 2005). While violence

22
dropped in the core region, it has proportionately grown in neighboring republics.
Since 2004, violence in Chechnya has decreased from over 90 percent to nearly 50
percent of the total in the North Caucasus at the end of the time-series.
The event map of violence shows a concentration in Chechnya and bordering
regions of the adjoining republics, but also clearly indicates incidences of violence
located hundreds of kilometers from Chechnya (Figure 3).
Figure 3: Geographic Distribution of Violent Events in the North Caucasus August 1999-August 2007. Circle size is proportional to number of events at each location.
The main highway of the region, the Caucasian Federal Highway can be generally
picked out in Figure 3. Linking Makhachkala to Grozny and then west to Nazran,
Nal’chik and Mineral’nyy Vody before turning northwest toward Rostov-na-Donu (see
Figure 1), its course is visible by the clusters of violence at its major towns and cities. A
border effect is also evident for Chechnya due to rebel attacks on border posts and

23
military checkpoints. For the first 8 years of the war, the federal authorities imposed a
‘ring of steel’ on Chechnya to try to contain the violence and road, rail, transport, and
oil links were diverted around the republic. The posts that marked this ‘ring of steel’
thus became the targets of intense violence. Key locations can also be picked out in the
region of greatest violence. Grozny city with 2446 events, Grozny rayon (county)
around the city with 1372 events, Makhachkala (Dagestan’s capital) with 272 events,
and cities in Chechnya (Vedeno - 173 events; Gudermes - 285; Shali - 238 events, Urus-
Martan - 191 events). An animation by season of the violence (32 map frames for eight
years) is available for download from our website at
www.colorado.edu/ibs/waroutcomes/maps.html.
Figure 4: Geographic Distribution of Violent Events per 1000 people in the North Caucasus rayoni and cities, August 1999-August 2007.

24
The mountains in the south of the Chechen republic with up to 63.3 events per
1000 people over the eight years of the data show the highest ratio of violence (Figure
4). The Buinaksky rayon in Dagestan and two in Ingushetia have higher intensities than
two of the Chechen rayoni; only 21 of the 143 geographic units in the entire study area
experienced no violent event. The sparsely-populated steppes of northern Stavropol’
kray and the mountains of southern Dagestan are most peaceful.
Comparison of our statistics to other accounts of the Caucasian wars after 1999
suggests that our data are more comprehensive than those heretofore published. For
the same time-period as Lyall’s (2006) study, we counted 3735 rebel actions compared
to his 1667 for the same areal coverage. For a comparable 2004-2007 time-frame, we
counted 1139 rebel attacks compared to 570 events in the WITS terrorism database.
While our data for casualties are not used in this article since the range is large due to
rival claims, they are certainly much higher than the approximate 3000 deaths for
federal and local police and military given by Russian government sources (Mukhin
2007; Kavkazskiy Uzel, 2007). “Memorial”, a Russian human rights organization, count
more than 75,000 civilians killed in the two wars since 1994 (Kavkazskiy Uzel, 2007).
Geo-statistical Analysis of North Caucasus Violent Events
Using the geo-coordinates of the individual events, we examined the distribution for
geographic-temporal trends and evidence of clusters of violence, checking the accuracy
of the frequent claims by commentators (e.g. Peuch 2005; Kramer 2006; Smirnov 2007)

25
that violence is diffusing from Chechnya. Most of the analyses of the point data were
conducted in the Splancs package written for R (Splancs 2007). A kernel density that
effectively converts the point data on a grid so that intensity can be visualized is
particularly effective.
Figure 5 shows the three-dimensional plot for space-time interactions in the
conflict event data and indicates the basis for the cutoff of 5 km in our geo-statistical
analysis. The values are calculated from the equation
)(ˆ)(ˆ),(ˆ),(ˆ tKhKthKthD TS−=
where ),(ˆ thK is the estimate for the bivariate space-time K function defined as the
expected number of events within distance h and time t of an arbitrary event (Bailey
and Gatrell 1995; Diggle, Chetwynd, Haggkvist et al. 1995).
Figure 5: Time-Space Plot of Violent Events in the North Caucasus, August 1999-August 2007 (geo-located14,177 events).

26
To assess whether there is any space-time interaction in the data, the estimates for the
spatial K function, )(ˆ hKS , and temporal K function, )(ˆ tKT , are multiplied and
subtracted from the combined space-time function. Raised values in the resulting plot
indicate evidence of space-time interaction. Figure 5 shows little variation in the
temporal dimension as D̂ rises gradually, but a significant spike between 4 and 5 kms
indicates increased spatial dependence of the events at this distance. There is also a
smaller rise at 10km, beyond which (not shown) the plot resumes its steady rise. The
extreme value of the observed statistic on the plot of the distribution of 99 Monte Carlo
simulations (not shown) provide further evidence of strong space-time interaction in
the data. The low spatial threshold of 5 km points to the localized nature of violence in
the region and the graph indicates that the spatial effect has a more significant effect
than the temporal one.
For each of the 8 years in the study, we generated an intensity map, creating a
smoothed version of the individual events in grid form (Figure 6). Using the spkernel2d
function within Splancs, a kernel estimation is calculated for each grid cell by summing
the weighted distances between the center of each grid cell and every event within a
given bandwidth. For our analysis, a distance of 5 km was chosen on the basis of the K
function results (see Figure 5). The weights for nearby events are determined by the
quartic kernel such that events close to the grid cell center are weighted strongly while
points near the edge of the bandwidth contribute little to the estimation; the larger the

27
bandwidth, the smoother the resulting map. (For full details, see pages 84-88 in Bailey
and Gatrell 1995.)
Figure 6: Kernel Density of Violent Events in the North Caucasus, August 1999- August 2007 (geo-located14,177 events).
The intensity maps for the 8 years (August 1999 to August 2007) show the
clustering of events along the Caucasian Federal Highway in central Chechnya in all
years (Figure 6). Points of higher density correspond to cities and major towns, the same
hot spots appear on multiple maps: Khasavyurt and Buinaksk in Dagestan, the major
cities of Chechnya on the steppe and piedmont, and the capital cities of Nazran

28
(Ingushetia) and Nal’chik (Kabardino-Balkaria). In the last three years of the study, a
reduction in violence intensity is also noted.
While the D̂ function provides an indicator of overall space-time interaction at
increasing spatio-temporal distances, an alternate approach can be used to identify
individual space-time clusters. For this, a scan statistic as implemented in the SaTScan
software was calculated (Kulldorff 2007). While geographers have frequently identified
spatial clusters for specific time-periods (a recent application of this methodology to
identify crime clusters before and after a major bridge completion between Denmark
and Sweden can be seen in Ceccato and Haining, 2004), the use of both time and spatial
measures is typically found in epidemiology (see the extensive bibliography in
Kulldorff 2007; also see Kulldorff, Heffernan, Hartman et al. 2005; Conley, Gahegan,
and Macgill 2005). Specifically, the space-time permutation scan statistic used here
compares the observed number of events in a space-time cylinder to the expected
number of events within specific area and time dimensions. Events are assumed to
follow a Poisson distribution within a given cylinder whose base area represents the
spatial dimension and whose height is the temporal dimension. For cylinders with
observed to expected ratios greater than one, a likelihood ratio test is calculated and
compared to a Monte Carlo generated distribution of test statistics to assess the
significance of each potential cluster. This simulation approach has the advantage of
eliminating problems associated with multiple testing and edge effects. (See Appendix 1
for more details on the method).
29
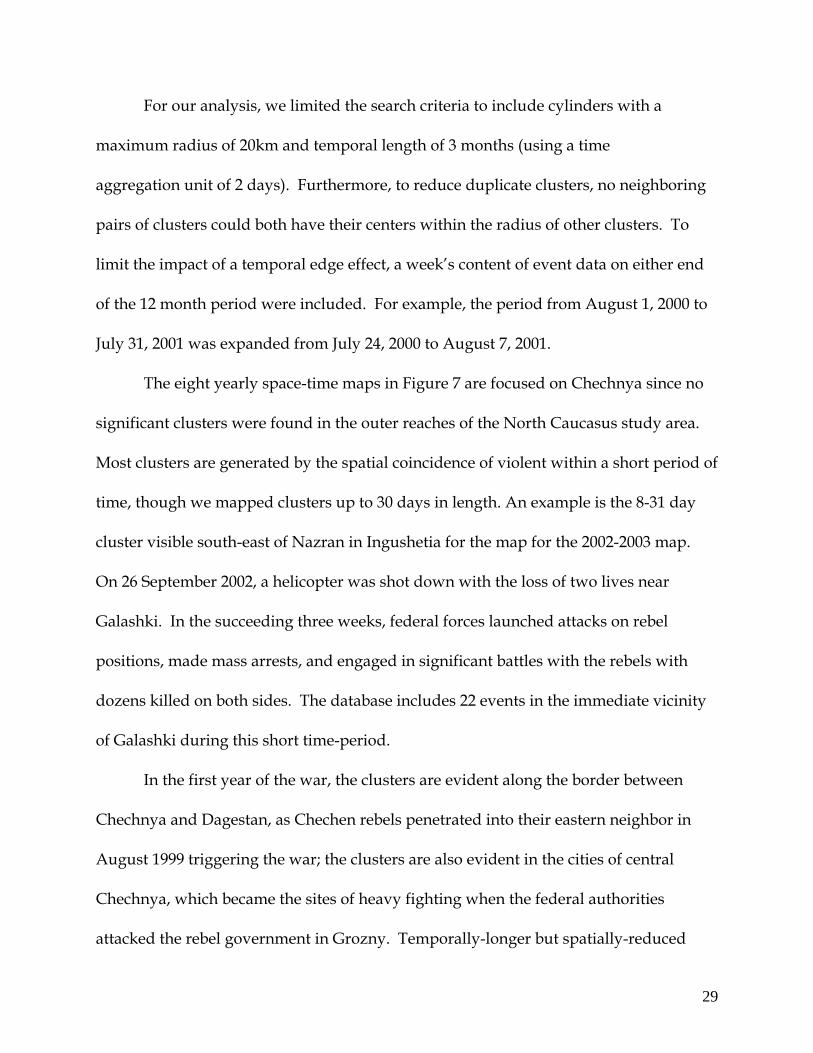
For our analysis, we limited the search criteria to include cylinders with a
maximum radius of 20km and temporal length of 3 months (using a time
aggregation unit of 2 days). Furthermore, to reduce duplicate clusters, no neighboring
pairs of clusters could both have their centers within the radius of other clusters. To
limit the impact of a temporal edge effect, a week’s content of event data on either end
of the 12 month period were included. For example, the period from August 1, 2000 to
July 31, 2001 was expanded from July 24, 2000 to August 7, 2001.
The eight yearly space-time maps in Figure 7 are focused on Chechnya since no
significant clusters were found in the outer reaches of the North Caucasus study area.
Most clusters are generated by the spatial coincidence of violent within a short period of
time, though we mapped clusters up to 30 days in length. An example is the 8-31 day
cluster visible south-east of Nazran in Ingushetia for the map for the 2002-2003 map.
On 26 September 2002, a helicopter was shot down with the loss of two lives near
Galashki. In the succeeding three weeks, federal forces launched attacks on rebel
positions, made mass arrests, and engaged in significant battles with the rebels with
dozens killed on both sides. The database includes 22 events in the immediate vicinity
of Galashki during this short time-period.
In the first year of the war, the clusters are evident along the border between
Chechnya and Dagestan, as Chechen rebels penetrated into their eastern neighbor in
August 1999 triggering the war; the clusters are also evident in the cities of central
Chechnya, which became the sites of heavy fighting when the federal authorities
attacked the rebel government in Grozny. Temporally-longer but spatially-reduced

30
clusters are visible for later years on the Chechen-Ingush border, in and around Grozny,
and in the mountains of southern Chechnya. As the war tended to take on a less urban
character after the Russian military pushed the rebel government out of Grozny in
February 2000, almost as many clusters are seen in Ingushetia as in Chechnya.
Figure 7: Significant Space-Time Clusters of Violent Events in the North Caucasus, August 1999- August 2007 (geo-located14,1177 events).

31
Major rebel attacks, as in Nazran in June 2004 and Nal’chik in October 2005, where the
fighting was followed by zachistki (mass arrest) operations over many weeks, in turn
generating further violence are also visible. In the last three years of the study, few
space-time clusters are apparent since the overall level of violence has reduced
drastically.
The descriptive account of the second Chechen war shows a decline in both the
level of overall violence over time as well as a reduction in the spatial density and
space-time clustering of conflict. At first blush, the arguments of Russian and Chechen
government officials about the ending of significant violence in the region would seem
to be supported, though the region remains highly militarized and politically unstable.
However, as can be gleaned from the three maps for August 2004-August 2007 (Figure
7), although Chechnya has experienced a striking drop in violence, adjoining regions
have seen relatively more concentrations of conflict than in the 1999-2004 period. This
trend suggests that the arguments of Russian and external observers that the conflict is
spreading and changing its character also have credence. A low-intensity conflict over
a broader geographic area over the long-term can be more destabilizing to a state than a
confined, though more destructive,war in one territory.
The Spread of Violence in the North Caucasus, 1999-2007
There have been numerous claims that a new style of conflict has emerged during the
second Chechen war. As the rebels were pushed out of the more densely-populated

32
urban centers in central Chechnya and as the Russian military, with their Kadyrovtsi
Chechen allies, have increased their control of major routes in the piedmont and steppes
that constitute about two-thirds of the republic, the conflict has proportionately become
more manifest in the forested mountainous south and the adjoining parts of Dagestan
and Ingushetia that offer protection to the rebels. An analysis of maps of rebel attacks
1999-2005 claimed that “it is clear, however, that violence is spreading: war touched
only 11 districts (rayoni) in 1999, principally in Chechnya and (briefly) Dagestan, but
reached 19 by 2003, 25 by 2004, and 32 in 2005” (Lyall 2006, 16). Other commentators
(e.g. Kramer 2005; Smirnov 2007; Vatchagaev 2008a) concur with the specter of long-
term hostilities in the poor North Caucasus bolstered by an increase in assassinations
and politico-criminal activity. In Dagestan, violence is mostly caused by jihadists, not by
inter-ethnic tensions, and a tit-for-tat pattern has been produced by the special
operations of the republic and federal security forces against Islamic militants (ICG
2008). Ingushetia has become the most violent region (in terms of events per
population) in the past two years due to attacks by Islamist militants on pro-
government forces and repressive governmental counter-actions (Vatchagaev, 2008b)
There are numerous options of geographic analytical methods used to check
claims of spatio-temporal diffusion. We present two summary measures for each of the
eight years of the study; a) Moran’s I index for the events aggregated to the rayon/city
scale with the inverse of inter-centroidal distances as the spatial weighting measure,
and b) centrographic indicators of mean center and standard distance ellipses for the
individual geo-located events. While the Moran’s I index has been used in studies of

33
conflict (e.g., O'Loughlin and Anselin 1991; Raleigh 2007), centrographic methods have
not been applied, possibly because of the absence of detailed geocoded data.
Figure 8: Spatial Clustering of Violent Events in the North Caucasus, August 1999- August 2007 using Moran’s I index by year. Z-score of 1.64 is significant at the .05 level, one-tailed test.
The Moran’s I measure and its associated Z-score plot in Figure 8 for the violence
ratio (events per 1000 inhabitants) over the 8 years of the war shows significant spatial
clustering in all years across the 143 rayoni/cities, with the peak clustering occurring in
the second year as the fighting centered on control of Grozny and surrounding cities.
After 3 years of de-clustering, the index shows an uptick in 2006-07, as violence re-
concentrated in the mountainous areas of south Chechnya (note the cluster on Figure 7
in this region). The trend in the index is consistent with a diffusion hypothesis but since

34
it is a global measure, more localized indicators are needed to document a diffusion of
conflict process.
Figure 9: Mean Center and Standard Deviational Ellipse of Violent Events in the North Caucasus, August1999- August 2007 by type of event.
The maps of the standard deviational ellipses (containing 68 percent of
observations; the x-axis is twice the standard deviation of the x values, extending one standard
deviation in both directions along the x-axis from the mean center with the y-axis calculated in a
similar way) and the mean centers for the four types of conflict over 8 years of the study
are clearer expressions of the spatio-temporal trends for the 14,177 geo-located events in
the database (Figures 9 and 10). While the mean centers are grouped tightly just south
of Grozny for all the distributions, the standard ellipses are more varied. Military
actions against the rebels are concentrated within a 25 km radius of Grozny, while
arrests (usually in zachistki by joint police and military units) show the greatest
geographic dispersion (Figure 9). With mass arrests having a broader reach than the

35
rebel or military actions, the ellipses provide another indicator of the broad sweep
strategy of the authorities to try to capture rebels, militants and their supporters
(Human Rights Watch 2008). However, these arrests in turn generate bitter local
resentment and further attacks on government officials and armed forces (Human
Rights Center “Memorial”, 2008). The primary orientation of the ellipses (northwest-
southeast) generally follows the line of the Caucasian Federal Highway through the
densest zones of violence from the mountains on the Chechen-Dagestan border through
central Chechnya to northern Ingushetia.
The most dramatic evidence of spatial diffusion is visible in Figure 10, the
standard deviational ellipses for each year for each type of violence. The same pattern
of greater spatial extent for arrests is visible for all eight years but an examination of the
yearly plots for the arrests shows a shrinking ellipse over time. None of the other plots
show this trend; their shapes, ranges and predominant axes show a great deal of
consistency over the years. One interpretation of the arrest maps is that the authorities
are becoming more spatially selective in their sweeps to concentrate on the areas of
rebel activity. Excluding the ellipses for August 1999-July 2000 and August 2000- July
2001 from the plots would bring the ellipses for the arrests into conformity with the
other distributions. In contrast to the arrest maps, the other distributions show
indications of spread especially in the last 3 years of the study. The ellipses now reach
into North Ossetia to the west and to a point within 40 km of Makhachkala, the
Dagestani capital on the Caspian Sea; the eastern and western extensions of the ellipses

36
are about equal in length and stand in sharp contrast to the north-south elongation,
which hardly changes over time.
Figure 10: Mean Center and Standard Deviational Ellipse of Violent Events in the North Caucasus, August1999- August 2007 by year.
The evidence in Figure 10 for the diffusion of the North Caucasian conflicts from
the center in Chechnya is clear, though it is not as dramatic as might be gauged from
the comments of military pundits and journalists. The reason for the lack of dramatic
shifts on the maps is that the core of violence (rebel attacks, military, and police

37
operations) is still in Chechnya’s most densely populated region – especially the cities
and military targets along the Caucasian Federal Highway. Even in the last months of
the study, over half of all violent events still took place in the Chechen republic.
Violence has spread, in the sense that places further from Chechnya are now seeing
violence more frequently; it is doubtful these places ever experience the intensity of
conflict that marked the 1994-96 war and the 1999-2002 period in the second war since
their violent events are generally guerrilla hit-and-run attacks on federal and republic
installations and personnel, and are followed by the inevitable arrests crackdown.
Explaining the Distribution of Violence in the North Caucasus, 1999-2007
Having presented evidence for the modest diffusion of violence from Chechnya during
the course of the war that started in August 1999, we turn now to an explanation of the
distribution of the violence. We summarize all violence as the rate of violent events per
1,000 persons in each rayon and city (n=143) as mapped in Figure 3. Using geographical
weighted regression (GWR) (Charlton, Fotheringham, and Brunsdon 2003;
Fotheringham, Brunsdon, and Charlton 2002), we account for the distribution of
violence using the aggregate characteristics of the rayoni/cities. Our choice of GWR is
predicated on our interest in identifying localized correlates of violence and is in line
with the advantages of a geographically-disaggregated analysis promoted by
Fotheringham 1997). War studies have been characterized for too long by generalized
explanations of violence that emanate from the institutional lens that political scientists

38
prefer; a complementary disaggregated geographic account examines place-to-place
variations in the distributions of wars.
In his examination of the distribution of rebel attacks in the North Caucasus,
Lyall (2006) introduced an explanation that combines the ethnic mix of an area with the
level of popular support for rebel actions. He expected that the smaller a group’s share
of the conflict area population, the more restraint an insurgent organization will show
while their actions are further curtailed by the number of competing organizations, the
nature and type of counterinsurgency practices adopted by the Russian government
and its local allies, and the intensity of popular support. Without reliable information
on the size and ambition of the plethora of insurgent groups, it is very hard to examine
these hypotheses and Lyall had to resort to a descriptive account for selected districts.
Our study is more circumspect because, while our event data are numerous and more
comprehensive, the correlates needed to understand rebel and state strategies are not
available.
Though dozens of explanations have been proffered for the onset and duration of
wars, the match of available information to the desiderata of predictive variables is poor
for the analysis of violence distribution in the North Caucasus. Drawing from the civil
war theories evident in the political science literature, we gathered data for measures of
ethnicity, terrain, land cover, targets, and separatist tradition in Chechnya. In collecting
data for analysis, we applied a natural log transformation for each of the 143
observations because of the skewed distribution of the dependent variable. The Russian
census data for 2002 are not reliable for Chechnya and Ingushetia and instead, we

39
substituted population data from the Danish Aid Agency and estimated the percentage
of the population that is Russian, the majority population throughout the area
(O'Loughlin, Kolossov, and Radvanyi 2007). Similarly, we have no reliable data on
income distribution or inequalities that might offer a test of the grievance hypothesis,
such as is available for Nepal and other states (Murshed 2002; Murshed and Gates
2005).
The targets for rebel actions are readily identified and include Grozny and the
neighboring political and population centers and the vital transportation arteries,
especially the Caucasian Federal Highway, known colloquially as the ”highway of
death” (Lyall 2006). The urban indicator was percentage urban residents; according to
Lyall (2006, 16), urban areas over 10,000 persons have been the predominant, though
not the overwhelming loci of insurgent attacks. To calculate the mean distance to the
Caucasian Federal Highway, we turned to the Digital Chart of the World road network
(available from http://data.geocomm.com/catalog/index.html); a distance-to-highway
grid was then derived and an average distance value was assigned for each district.
Only the section of the highway from Makhachala west was used for the calculation
since the southern part of the highway does not serve the same military role.
We can revisit McColl’s (1969) hypothesis about the importance of a secure base
for rebels by calculating the median elevation (meters) above sea-level of the
rayoni/cities. In his preliminary analysis of rebel attacks, Lyall (2006, 17) claimed that
“simple visualization reveals that there is no clear relationship between difficult terrain
and attack propensity”. The expectation that difficult terrain can shelter rebels and

40
invite government responses is now a standard feature of disaggregated studies of war
and can be estimated in the GWR model. Similarly, forested areas are expected to offer
cover for rebel actions and bases. Since Chechnya accounts for over four-fifths of the
cases in our data set and since the war’s origins lie in the attempt of rebels in this
republic to assert their independence, we added a dummy variable, location in
Chechnya, to reduce the variance unexplained.
GWR analysis allows the heterogeneity of parameters in the prediction of the
distribution of violence to be estimated and mapped. It relies on the assumption that
locations nearer to the point where violence is estimated are more influential on the
estimates than places farther removed. This method estimates a local regression model
for each observation by weighting near neighbors more than far neighbors according to
a spatial kernel. There are two main types of spatial kernels, adaptive and fixed.
Adaptive kernels specify a set number of neighbors to include in each local regression
estimate while fixed kernels specify a set distance bandwidth around each observation.
The drawback of the adaptive kernel method is that it assumes that the influence of
neighbors varies according to proximity. Since we have no expectation of such
variation in the North Caucasus, a fixed kernel was used. The distance bandwidth for
the fixed kernel was chosen by minimizing the Akaike Information Criterion (AIC)
using an iterative approach (Fotheringham, Brunsdon, and Charlton 2002). For our
model, this resulted in a fixed bandwidth of 78.19 km. This distance is large enough
that most areal units will have enough neighbors included for estimating the model
parameters. The weights for the local regression models are then calculated as

41
wij = exp(-d2ij/78.192)
where dij is the distance between centroid i and centroid j. Given our bandwidth
distance, this means that neighbors beyond about 100 km from the observation being
estimated are weighted so that they add little contribution to the regression parameter
estimates. The parameters for the global (not geographically weighted) and the GWR
models are shown in Table 1.
Repeating the GWR analysis for each of the four types of violent events and for
the cumulative total allows us to check the consistency of the predictive factors. Only
the model for arrests differed from the others. In this case, the predictive variable for
forest cover was not significant, as it was in the other four models. Otherwise, the
dependent variables show the same strength and direction of relationships and we
report the results for the total events model in Table 1.
As is usual with GWR models, there is a significant improvement in the fit of the
model compared to the global one. An improvement of 83.7 in jump in the the residual
sum of squares estimates, a corresponding drop in the AIC and the adjusted R-square
value from .622 to .705 attests to the improvement. Of the six predictors, only two
(distance to the Caucasian Federal Highway and Russian percentage) show significant
spatial variation in its parameter estimate using a Monte Carlo test procedure. The OLS
estimates for the global model generally follow the hypothesized relationship with the
rate of violence. Location in Chechnya is highly significant as might be expected from
the maps shown earlier, while the farther the rayon/city is from the Caucasian Federal
Highway, the lower the rate of violence.

42
Table 1: Parameter estimates for global and geographically-weighted regression
models of the distribution of violence in the North Caucasus, 1999-2007.
Similarly, the ratio of Russians in the population is negatively associated with the rate
of violence. Mean elevation is not significant, nor is the urban ratio (Table 1). Contrary
to Lyall (2006), the urban factor does not emerge as important when Chechen location
and the distance to the main highway through the area, linking many of the major
towns and cities, are taken into account. Finally, the forest cover measure is positively
related to the level of violence in a rayon/city.
b-value St. error
t-value GWR median value
P-value (Monte Carlo test of spatial
variation) Chechnya 3.568 0.40 8.98 3.605 .08 UrbanPct 0.009 0.01 1.26 0.011 .64
Mean Elevation -0.000 0.00 -1.61 0.000 .13 ForestPct 0.016 0.01 2.47 0.012 .47
Hwy_distance -0.008 0.00 -2.62 -0.005 .00 RussianPct -0.016 0.00 -4.11 -0.009 .00 Intercept -1.468 0.29 -5.01 -1.826 .02
Resid. sum of squares 263.67 179.99
Sigma 1.392 1.229 AIC 510.39 499.46
Adjusted R-square .622 .705

43
Figure 11: Distribution of Coefficients for the Geographically-Weighted Regression model of Violent Events for the rayoni/cities in the North Caucasus, 1999-2007. Significance is defined as a t-value of 1.68 for a one-tail test (40 degrees of freedom).
Estimates for the local parameters, as well as the estimated R2 value, are mapped
in Figure 11. Clearly, there is considerable heterogeneity on the maps with much of the
pattern related to the specific nature of the multiple conflicts that have started and
developed in the past decade. The overall fit for the southwestern part of Stavropol’
kray (the Mineral’nyy Vody tourist region), Kabardino-Balkaria and part of Karachaevo-
Cherkessia is poor (local R2 value less than .422). This area has had a moderate level of

44
violence and has both a strong Russian presence and a high urbanization ratio. The
model shows the best fit (higher than .715) for the border area between Dagestan and
Chechnya, including the capital cities (Makhachkala and Grozny, respectively) and the
main towns along the Caucasian Federal Highway, and a coefficient of determination
that is above the global average for other rayoni near Chechnya and for nearly all of
Dagestan (Figure 11a). The model fit is better for high violence locations than regions
with an absence of violence.
Interpreting the intercept value (not mapped) as an indicator of unexplained
variance, the high local values for this estimate in the west of the study region
(Stavropol’ kray, and the republic of Karachaevo-Cherkessia) (not mapped) reflect a
lower overall level of violence. Rayoni with low levels of violence in southern Dagestan
and Kabardino-Balkaria are evident on the map of the estimates of the Chechnya
location predictor (Figure 11b) with the largest coefficient values found in the west of
the study area and in southern Dagestan, both regions farthest from this republic. The
mountainous area along the Chechen-Dagestan border has the highest values for the
distance to the federal highway predictor, a reflection of the embedded nature of rebel
activity in this inaccessible terrain. Though not bisected by the main highway, it has
seen consistent violence since the first month (August 1999) of the second Chechen war
(Figure 11c). The areas of greatest increase in recent violence on the borders of
Ingushetia, Chechnya and North Ossetia are marked by high estimates for the Russian
population percentage which is low in these rayoni (Figure 11d). For the non-significant
factor, urban percentage, the map shows only a few rayoni with significant coefficients

45
(Figure 11e). The pattern of the forest cover coefficients (Figure 11f) emphasizes again
the significance of this factor in Chechnya, and western Dagestan (the high values of
this coefficient in northern Dagestan could be an artifact of the few neighbors within the
78.19 km kernel for this rayon, though in this area of steppe, little violence would be
expected. Finally, the pattern of the estimates for the insignificant predictors, mean
elevation and urban percentage, show most dispersed and idiosyncratic distributions.
The limitations of data access make the modeling of violence in the North
Caucasus a challenging exercise. We have shown the strong influence of the Chechen
locational factor, which despite many predictions and assertions of war diffusion, still
maintains its predominance. The importance of the main transport route in the region,
the Caucasian Federal Highway, as both an infrastructural asset to federal and
republican forces and as a rebel target, is also evident in our analysis. Violence is also
found disproportionately in non-Russian locations but despite recent press discussions
and even rebel claims, such as on the main rebel website (www.kavkaztsentr.org), that
higher elevations favor their activities, elevation does not appear to be a major factor in
the war to date. It is true that the pattern of rebel attacks and government responses
has shifted to the south and west over recent years but the value of the high mountains
to the rebels, as a refuge and a base from which to launch attacks, is not (yet) in line
with McColl’s (1969) expectations. The significance of the forest cover element,
however, suggests the advantages to rebels of more difficult terrain. Having lost their
main bases in the cities and the heavily-populated rayoni, the rebels have adapted a
different, guerrilla strategy but refrain from trying to maintain control of specific towns

46
(Kramer, 2005). Doing so invites massive governmental retaliation. As the Caucasian
conflicts spread regionally, with more terrorist incidences in both Dagestan and
Ingushetia than in Chechnya from October 2006 to October 2008 (WITS data), the
Russian state authorities are challenged by an increasingly disparate opposition
motivated by harsh and ineffective tactics since the beginning of the first Chechen war
in 1994.
Conclusions
Our analysis has shown modest evidence of diffusion in the North Caucasian wars that
is a result of the changing nature of the conflicts that have enveloped the region in the
past nine years. With its origins in a separatist conflict that was bounded by the
Chechen claims to their republic, the destabilization was exacerbated by the attack on
Dagestan in August 1999 by Chechen rebels and by the nature of the response of the
Russian security services. Over the past five years, the federal government has
increased cooperation with local allies, has installed reliable officials in key public
offices, and has increasingly relied on zachistki (mass arrest) operations to dampen the
rebellion. The end result is that these tactics have now drawn all adjoining republics
into the conflicts. Endemic poverty and poor employment prospects, coupled with a
trend to join religious groups by many of the disaffected, has meant that the prospects
for peace are no better now than a decade ago. In some ways, despite the reduction in
casualties, the security situation is worse than ever as the region has settled into

47
(seemingly) permanent low-level hostilities between the power ministries and a
myriad of oppositionists. A recent journalistic account concluded that Dagestan, not
Chechnya, was now the most dangerous republic in Russia for visitors (Vatchagaev
2008a).
While we have gathered a large amount of information on the conflict, the event
data are dependent on the sources that reported the events. The claims of government
and rebels are so contradictory that reliable information is a particularly scarce
commodity in the North Caucasus because of Russian control of information and the
dangers to journalists from all sides, reflected in the murder of prominent reporters like
Anna Politkovskaya in 2006. International agencies have great difficulty in serving the
those fleeing the conflicts; the UNHCR (UN High Commission for Refugees) and other
UN agencies withdrew from Nazran, Ingushetia in April 2007 due to a rocket attack on
their offices.
To attempt to mitigate the potential inaccuracies of the reports, we resorted to
different sources that noted the violent events, while avoiding the use of weights to
scale their severity. This approach, obviously, understates the importance of some
events such as the bloody end to the school hostage-taking in September 2004 in Beslan.
The cumulative effect of local events of varying severity also has important
repercussions for the tit-for-tat nature of the violence and the difficulty of finding
solutions.
In coding and organizing the data for the spatial analysis, we chose to adopt a
two-track approach, by analyzing both point and areal (density rate) events data. While

48
each has drawbacks and advantages, we were able to indicate the replicative nature of
the analyses – both types of data demonstrate clear, though modest, evidence for
diffusion of violence from the central Chechnya core area surrounding Grozny. Our
geographically-weighted regression analysis showed the importance of the main
transportation artery and the targets in Chechnya in explaining the distribution of
violence. Lack of data for predictive variables (especially level of material wealth) do
not allow an effective test of the ‘greed versus grievance’ explanation that has
dominated the quantitative study of civil wars.
McColl’s (1967, 1969) articles at the time of the Vietnam war were filled with
“counter-insurgency” language and tactics and produced a geography of rebellion that
started from Mao Zedong’s principles for guerrillas. Central to these tactics was the
strategy of building bases, in defensive sites that were accessible to targets, and McColl
showed how difficult it was to destroy the hideouts, once they were established. While
the technology of war and the nature of war (fewer international conflicts) has changed
in the past half-century, the interest in geographically tracking the details of violence
remains as prominent as ever. Modern technologies, especially GIS and associated
spatial analytical techniques, allow a sophistication of analysis that descriptive accounts
like McColl’s could hardly imagine. While we have confined ourselves in this paper to
mapping and analyzing spatial distributions of violence, our data lend themselves to
use in forecasting and extrapolation models, ascertaining the precise nature of spatial
diffusion (contagious, hierarchical, relocation), comparison of the geographic tactics and
targeting of specific rebel groups and governmental agencies, examination of the

49
influence of environmental factors (weather, terrain, landcover), and temporal
developments in rebel and government actions as causes of and response to political
changes. While spatial-analytical approaches have been applied to a diversity of
environmental and social topics, the recent availability of large, disaggregated datasets
on political violence now parallel data on criminal activities (location of offenses, homes
of offenders, etc), epidemiology (disease occurrences), and geological distributions (e.g.
petroleum), and allow similar sophisticated mapping and analysis.
References
Abdullaev, N. 2008. After lull, Chechnya sees surge in attacks. Moscow Times 18 June: 1. Agnew, J.A. 1994. The terrirtorial trap: The geographical assumptions of international relations theory. Review of International Political Economy 1: 53-80. Bailey, T. C. and A. C. Gatrell 1995. Interactive spatial data analysis. New York: Longman. Bax, M. 1995. Medjugorje: Religion, politics, and violence in rural Bosnia. Amsterdam: Amsterdam Free University Press. Buhaug, H. and S. Gates 2002. The geography of civil war. Journal of Peace Research 39: 417-433. Buhaug, H. and P. Lujala 2005. Accounting for scale: Measuring geography in quantitative studies of civil war. Political Geography 24: 399-418. Buhaug, H. and J. K. Rød 2006. Local determinants of African civil wars, 1970–2001. Political Geography 25: 315-335.

50
Ceccato, V. and R. Haining 2004. Crime in border regions: The Scandinavian case of Öresund, 1998-2001. Annals, Association of American Geographers 94: 807-826. Cederman, L. E. and L. Girardin 2007. Beyond fractionalization: Mapping ethnicity onto nationalist insurgencies. American Political Science Review 101: 173-185. Charlton, M., S. Fotheringham and C. Brunsdon 2003. GWR 3: Software for geographically weighted regression, Version 3.0.1. Newcastle-upon-Tyne, UK: Spatial Analysis Research Group, University of Newcastle-upon Tyne. Collier, P. 2000. Rebellion as a quasi-criminal activity. Journal of Conflict Resolution 44: 839-853. Collier, P., L. Elliott, H. Hegre, et al. 2003. Breaking the conflict trap: Civil war and development policy. Washington DC: World Bank Publishers. Collier, P. and A. Hoeffler 1998. On economic causes of civil war. Oxford Economic Papers 50: 563-573. ------ 2001. Greed and grievance in civil wars. Washington DC: World Bank Publishers. Conley, J., M. Gahegan and J. Macgill 2005. A genetic approach to detecting clusters in point data sets. Geographical Analysis 37: 286-314. de Soysa, I. 2002. Paradise is a bazaar? Greed, creed, and governance in civil war, 1989-99. Journal of Peace Research 39: 395-416. Derlugian, G. 2003. The structures of Chechnya's quagmires - Policy memo 309. Washington DC: PONARS Program on New Approaches to Russian Security , Center for Security and International Studies, Georgetown University. Diggle, P. J., A. Chetwynd, R. Haggkvist, et al. 1995. Second-order analysis of space-time clustering. Statistical Methods in Medical Research 4: 124-136. Dunlop, J. B. 1998. Russia confronts Chechnya: Roots of a separatist conflict. New York: Cambridge University Press. Dunlop, J. B. and R. Menon 2006. Chaos in the North Caucasus and Russia's future. Survival 48: 97-114. Evangelista, M. 2005. Is Putin the new de Gaulle? A comparison of the Chechen and Algerian wars. Post-Soviet Affairs 21: 360-377.

51
Fearon, J. D. and D. D. Laitin 2003. Ethnicity, insurgency and civil war. American Political Science Review 97: 75-90. Fitzpatrick, D. 1978. The geography of Irish nationalism, 1910-1921. Past and Present 78: 113-144. Fotheringham, A. S. 1997. Trends in quantitative methods I: Stressing the local. Progress in Human Geography 21: 88-96. Fotheringham, A. S., C. Brunsdon and M. Charlton 2002. Geographically weighted regression: The analysis of spatially varying relationships. Thousand Oaks, CA: Sage Publishers. Gammer, M., Ed. 2007. Ethno-nationalism, Islam and the state in the Caucasus: Post-Soviet disorder. New York: Routledge. Gates, S. 2002. Recruitment and allegiance: The microfoundations of rebellion. Journal of Conflict Resolution 46: 111-130. Gleditsch, K. S. 2002. All international politics is local: The diffusion of conflict, integration and democratization. Ann Arbor, MI: University of Michigan Press. Graham, S., Ed. 2004. Cities, war and terrorism. Oxford: Blackwell Publishing. Gregory, D. 2004. The colonial present: Afghanistan, Palestine, Iraq. Oxford: Blackwell Publishing. Hahn, G. M. 2008. The Jihadi insurgency and the Russian counterinsurgency in the North Caucasus. Post-Soviet Affairs 24: 1-39. Hansen, M., R. DeFries, J. R. G. Townshend, et al. 2000. Global land cover classification at 1 km resolution using a decision tree classifier. International Journal of Remote Sensing 21: 1331-1364. Hart, P. 1997. The geography of revolution in Ireland, 1917-1923. Past and Present 155: 142-176. --------- 1998. The Irish Republican Army and its enemies: Violence and community in Cork, 1916-1923. Oxford: Clarendon Press. Hassel, F. 2008. Nachwuchs für die Kaukasus-Rebellen: Guerillakrieg in Tschetschenien greift auf angrenzende Republiken über - Moskau setzt vor allem auf das Militär. (New blood for the Caucasus-rebels: The guerilla war in Chechnya is

52
spreading to adjoining republics - Moscow relies on the military above all else.) Frankfurter Rundschau 12 June: 2. Hendrix, C. S. and S. M. Glaser 2007. Trends and triggers: Climate, climate change and civil conflict in Sub-Saharan Africa. Political Geography 26: 695-715. Hewitt, K. 1983. Place annihilation: Area bombing and the fate of urban places. Annals, Association of American Geographers 73: 257-284. Homer-Dixon, T. F. 1999. Environment, scarcity and violence. Princeton, NJ: Princeton University Press. Hughes, J. 2007. Chechnya: From nationalism to jihad. Philadelphia, PA: University of Pennsylvania Press. Human Rights Center “Memorial” 2008. Ingushetia 2007: What is coming next? from http://www.memo.ru/2008/06/19/1906085.htm. last accessed 25 June 2008 Human Rights Watch 2008. As if they fell from the sky : Counterinsurgency, rights violations, and rampant immunity in Ingushetia. Moscow: Human Rights Watch. ICG 2008. Russia's Dagestan: Conflict Causes. Brussels: International Crisis Group, from http://www.crisisgroup.org/library/documents/europe/caucasus/192_russia_s_dagestan_conflict_causes.pdf. (last accessed 22 June 2008). Kaldor, M. 1999. New and old wars: Organized violence in a global era. Cambridge: Polity Press. Kalyvas, S. 2006. The logic of civil war violence. New York: Cambridge University Press. Kavkazskiy Uzel 2007. Minoboron' RF:za dve chechenskie kampanii pogibli 6.6 t'syach voennosluzhashchikh Rossii (Defense Ministry, Russian Federation: Two Chechen campaigns killed 6,600 Russian troops). from http://www.voinenet.ru/index.php?aid=13206 8 October (last accessed 20 June 2008). Kolossov, V. and G. Ó Tuathail 2007. An empire's fraying edge?: The North Caucasus instability in contemporary Russian geopolitical culture. Eurasian Geography and Economics 48: 202-225. Kramer, M. 2005. Guerilla warfare, counterinsurgency and terrorism in the North Caucasus: The military dimension of the Russian-Chechen conflict. Europe-Asia Studies 57: 209-268.

53
--------- 2006. The changing context of Russian federal policy in the North Caucasus: PONARS Policy Memo No. 416. Washington DC: Center for Strategic and International Studies, Georgetown University, from http://www.csis.org/media/csis/pubs/pm_0416.pdf. (last accessed 1 April 2008). Kulldorff, M. 2007. SaTScan: Software for the spatial, temporal and space-time scan statistics. Version 7.0.3. from http://www.satscan.org. Kulldorff, M., R. Heffernan, J. Hartman, et al. 2005. A space-time permutation scan statistic for disease outbreak detection. PLoS Medicine 2: 216-224. Kynsh, A. 2004. A clear and present danger: “Wahhabism” as a rhetorical foil. Die Welt des Islams 44: 3-26. Lacoste, Y. 1976. Enquête sur le bombardement des digues du fleuve rouge Vietname, été 1972 : Méthode d'analyse et réflexions d'ensemble. (Investigation of the bombing of the Red River dikes Vietnam summer 1972: Method of analysis and summary reflections). Hérodote 1: 86-117. LeBillon, P. 2001. The political ecology of wars: Natural resources and armed conflicts. Political Geography 20: 561-584. --------- 2008. Diamond wars? Conflict diamonds and geographies of resource wars. Annals, Association of American Geographers 98: 345-372. Lieven, A. 1998. Chechnya: Tombstone of Russian power. New Haven, CT: Yale University Press. Lyall, J. M. K. 2006. Landscapes of violence: A comparative study of insurgency in the North Caucasus. Paper presented at the Annual meeting of the Midwest Political Science Association Chicago, Il, April. Maguire, D., M. Batty and M. F. Goodchild 2005. GIS, spatial analysis, and modeling. Redlands, CA, ESRI Press. Malashenko, A. V. 2008. Islam and the state in Russia. Russian Analytical Digest no. 44: 2-5. McColl, R. W. 1967. A political geography of revolution: China, Vietnam, Thailand. Journal of Conflict Resolution 11: 153-167. --------- 1969. The insurgent state: Territorial bases of revolution. Annals, Association of American Geographers 59: 613-631.

54
Meier, P., D. Bond and J. Bond 2007. Environmental influences on pastoral conflicts in the Horn of Africa. Political Geography 26: 715-735. Mendelson, S. E. and T. Gerber 2006. Cauldron of terrorism or bowl of kasha: What survey data say about the North Caucasus. Washington DC: Center for Strategic and International Studies, Georgetown University, from http://www.csis.org/index.php?option=com_csis_pubs&task=view&id=3971 (last accessed 25 July 2007). Moore, C. 2008. Review article: Russia's post-colonial war(s). Europe-Asia Studies 60: 851-861. Moore, C. and P. Tumelty 2008. Foreign fighters and the case of Chechnya: A critical assessment. Studies in Conflict and Terrorism 31: 412-433. Mukhin, V. 2007. Neob'ektivnaya statistika poter' (Biased statistics on losses). Nezavissimaya Gazeta 10 October: 1 Murshed, S. M. 2002. Conflict, civil war and underdevelopment: An introduction. Journal Of Peace Research 39: 387-393. Murshed, S. M. and S. Gates 2005. Spatial-horizontal inequality and the Maoist insurgency in Nepal. Review of Development Economics 9: 121-134. Nordås, R. and N. P. Gleditsch 2007. Climate change and conflict. Political Geography 26: 627-638. North Caucasus Weekly 2008. Interior troops commander reports a surge in militant activity . 27 March from http://www.jamestown.org/chechnya_weekly/article.php?articleid=2374060 (last accessed 2 April 2008). O'Loughlin, J. 1986. Spatial models of international conflicts: Extending current theories of war behavior. Annals, Association of American Geographers 76: 63-80. --------- 2004. The political geography of conflict: Civil wars in the hegemonic shadow. In The Geography of War and Peace. Ed. C. Flint, 85-112. New York: Oxford University Press. O'Loughlin, J. and L. Anselin 1991. Bringing geography back to the study of international relations: Spatial dependence and regional context in Africa, 1966-1978. International Interactions 17: 29-61.

55
O'Loughlin, J., V. Kolossov and J. Radvanyi 2007. The Caucasus in a time of conflict, demographic transition, and economic change. Eurasian Geography and Economics 49: 135-156. O'Loughlin, J. and G. Ó Tuathail 2009. Accounting for separatist sentiment in Bosnia-Herzegovina and the North Caucasus of Russia: A comparative analysis of survey responses. Ethnic and Racial Studies 32: forthcoming. O'Loughlin, J., G. Ó Tuathail and V. Kolossov. 2008. The localized geopolitics of displacement and return in eastern Prigorodnyy rayon, North Ossetia. Eurasian Geography and Economics 49: 635-669. O'Loughlin, J. and C. Raleigh 2008. Spatial analysis of civil war violence. In The Sage Handbook of Political Geography. Ed. K. R. Cox, M. M. Low and J. Robinson, 493-508. Thousand Oaks, CA, Sage. Ó Tuathail, G. 2009. Placing blame: Making sense of Beslan. Political Geography 28: forthcoming. Ouvaroff, N. 2008. The oil factor and war of clans in Chechnya. Russian Analytical Digest no. 42: 5-9. Palka, E. J. and F. A. Galgano, Eds. 2005. Military geography: From peace to war. New York, McGraw-Hill. Peuch, J.-C. 2005. Russia: North Caucasus republics enter circle of violence. Johnson's Russia List, from http://www.cdi.org/russia/johnson/9066-18.cfm. last accessed 12 April, 2008 . Politkovskaya, A. 2003. A small corner of hell: Dispatches from Chechnya. Chicago, University of Chicago Press. Raleigh, C. 2007. The political geography of civil war: Patterns of insurgency in central Africa, 1960-2005. PhD Dissertation. Boulder, CO: Department of Geography, University of Colorado at Boulder. Raleigh, C. and H. Hegre 2005. Introducing ACLED: An armed conflict location and event dataset. Paper presented at “Disaggregating the Study of Civil War and Transnational Violence” conference, La Jolla, CA: University of California, Institute of Global Conflict and Cooperation, March.

56
Raleigh, C. and H. Urdal 2007. Climate change, environmental degradation, and armed conflict. Political Geography 26: 674-694. Reuveny, R. 2007. Climate-change-induced migration and violent conflict. Political Geography 26: 656-673. Rumpf, E. and A. C. Helburn 1977. Nationalism and socialism in twentieth-century Ireland. Liverpool: Liverpool University Press. Russell, J. 2007. Chechnya: Russia's “War on Terror”. New York: Routledge. Sagramoso, D. 2007. Violence and conflict in the Russian North Caucasus. International Affairs 83: 681–705. Salehyan, I. and K. S. Gleditsch 2006. Refugees and the spread of civil war. International Organization 60: 335-366. Sambanis, N. 2002. A review of recent advances and future directions in the quantitative literature on civil war. Defense and Peace Economics 13: 215-243. --------- 2005. Using case studies to refine and expand the theory of civil war. In Understanding Civil War. Ed. P. Collier and N. Sambanis, 299-330. Washington DC: World Bank Publishers. 2: Europe, Central Asia and other Regions. Slider, D. 2008. Putin's 'Southern Strategy': Dmitriy Kozak and the dilemmas of recentralization. Post-Soviet Affairs 24: 177-197. Smirnov, A. 2007. Kremlin propaganda belied by increasing rebel attacks. Chechnya Weekly 8: 26 June. http://www.jamestown.org/chechnya_weekly/article.php?articleid=2373511 (last accessed 2 April 2008). SPLANCS: Spatial and space-time point pattern analysis. 2007. Rowlinson, B. and P. Diggle. Lancaster, UK. http://cran.r-project.org/web/packages/splancs/index.html. Tishkov, V. 2004. Chechnya: Life in a war-torn society. Berkeley, CA: University of California Press. Trenin, D. V., A. V. Malashenko and A. Lieven 2004. Russia's restless frontier: The Chechnya factor in post-Soviet Russia. Washington DC: Carnegie Endowment for International Peace.

57
Trier, T. and K. Deniev 2000. Chechnya in figures: Survey of the population of the republic of Chechnya, Russian Federation, as an instrument for providing targeted humanitarian assistance. Nazran, Russia: Danish Refugee Council and ASF-Danish Peoples' Aid, from http://www.reliefweb.int/rw/rwb.nsf/AllDocsByUNID/d79a17448cfa4a9e85256989005bba72 (last accessed 12 February 2008). Vatchagaev, M. 2008a . Dagestan's Jamaats widen their theater of operations. North Caucasus Weekly Vol. 9, 8 May. Vatchagaev, M. 2008b. Violence in Ingushetia continues to intensify. North Caucasus Weekly Vol. 9, 31 October. Vendina, O.I., V.S. Belozerov and A.F. Gustafson 2007. The wars in Chechnya and their effects on neighboring regions. Eurasian Geography and Economics 48: 178-201. Ward, M. D. and K. S. Gleditsch 2002. Location, location, location: An MCMC approach to modeling the spatial context of war and peace Political Analysis 10: 244-260. Woodward, R. 2004. Military geographies. Oxford: Basil Blackwell. Yarlykarpov, A. 2007. Separatism and Islamic extremism in the ethnic republics of the North Caucasus. Russian Analytical Digest no. 22: 5-11. Zärcher, C., P. Baev and J. Koehler 2005. Civil wars in the Caucasus. In Understanding Civil War. Vol 2: Europe, central Asia and other regions. Ed. P. Collier and N. Sambanis, 259-298. Washington DC: World Bank Publishers.

58
Appendix 1 To assess whether the observations within each cylinder form a cluster, they are
compared against the expected number of events with the given area and time period.
Using the Kulldorff, Heffernan, Hartman et al. 2005 method, for each spatial location,
s, and each time unit, t, an expected number of violent events is calculated:
⎟⎠
⎞⎜⎝
⎛⎟⎠
⎞⎜⎝
⎛= ∑∑
tst
sstst cc
CcE 1][
where cst is the observed number of events cases at the given spatial location during t
and C is the total number of observed violent events. From these individual
calculations, the expected number of events within a given cylinder, A, can be
calculated by the following summation:
∑∈
=Ats
stA cEcE),(
][][
For each cylinder, the observed to expected ratio, ODE = cA/E[cA], is calculated and for
each cylinder with an ODE > 1, the Poisson generalized likelihood ratio measure is
AA cC
A
A
c
A
A
cECcC
cEc
−
⎟⎟⎠
⎞⎜⎜⎝
⎛−−
⎟⎟⎠
⎞⎜⎜⎝
⎛][][
where cA is the observed number of events in the cylinder.
To evaluate the statistical significance of the cluster, a Monte Carlo method is
used to generate 999 random permutations of the data for which the likelihood ratio
statistic is calculated. A p-value is then calculated by comparing the rank of the test
statistic generated from the real data, R, against the 999 simulated values,
p = R/(999+1).

59
NOTES 1 To check our data against another extensive collection, we compared the graphs of
incidences of terrorism from the National Counterterrorism center’s database, WITS
(Worldwide Incidences Tracking System, available from wits.nctc.gov) with those of
rebel attacks from our database for each month and for republic. The two graphs track
very closely, though we have 2-3 times more incidences coded consistently than the
WITS data.
2 On the suggestion from two anonymous reviewers, we also calculated the mean
centers and standard ellipses by year for each event type after removing the 25% of
events that contained no town or village geocoding. A comparison of these maps to
Figure 10 show a nearly identical geographical distribution for all event types over the
years. The only exception is for the distribution of arrests in 1999. Many mass arrests at
the beginning of the second conflict took place in Chechnya and Dagestan but were not
precisely geocoded. Removing these events from the arrests distribution yields a
slightly elongated ellipse in the northwest-southeast orientation for 1999 but with little
impact on the mean center. Therefore, we use the full database in all the analyses.