annaly investor presentation
TRANSCRIPT

September 2015
Investor Presentation
1 1
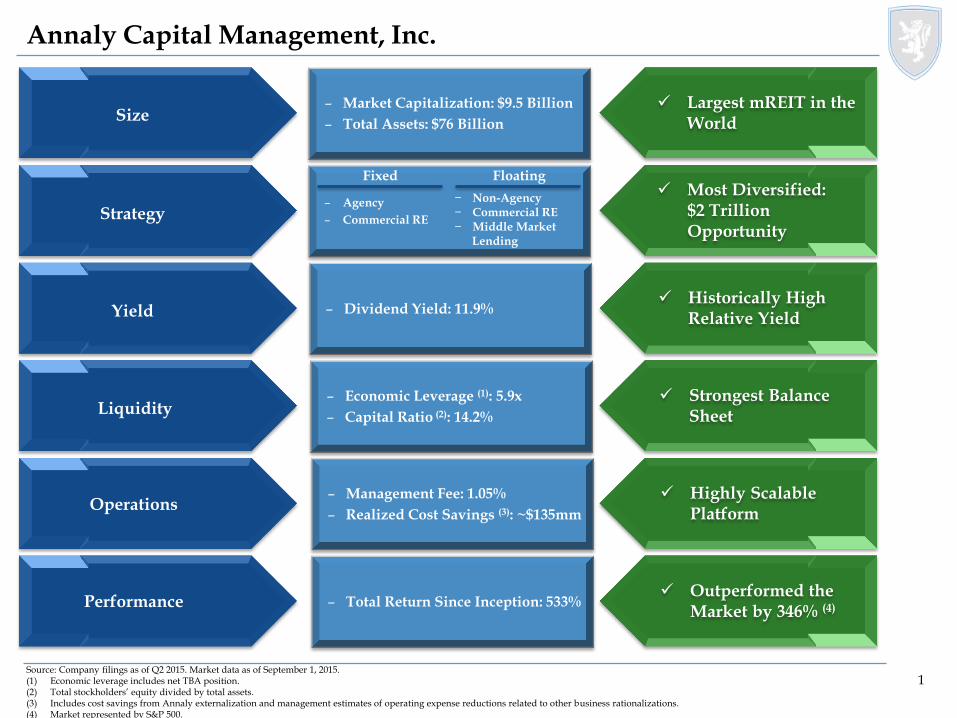
Historically High Relative Yield
Strongest Balance Sheet
Highly Scalable Platform
Outperformed the Market by 346% (4)
Most Diversified: $2 Trillion Opportunity
Largest mREIT in the World
Annaly Capital Management, Inc.
Size
Strategy
Yield
Liquidity
Operations
Performance
Source: Company filings as of Q2 2015. Market data as of September 1, 2015. (1) Economic leverage includes net TBA position. (2) Total stockholders’ equity divided by total assets. (3) Includes cost savings from Annaly externalization and management estimates of operating expense reductions related to other business rationalizations. (4) Market represented by S&P 500.
– Dividend Yield: 11.9%
– Economic Leverage (1): 5.9x
– Capital Ratio (2): 14.2%
– Management Fee: 1.05%
– Realized Cost Savings (3): ~$135mm
– Total Return Since Inception: 533%
– Agency
– Commercial RE
– Market Capitalization: $9.5 Billion
– Total Assets: $76 Billion
− Non-Agency − Commercial RE − Middle Market
Lending
Fixed Floating
2 2
$1.4 $1.5
$3.5 $3.3
$0.2
$1.8 $2.5
$2.6 $1.7
$0.7 $0.6
$2.4
$0.6
$1.3
$2.8
$1.6
$0.6 $0.1
$0.6
$0.4
$3.4
$2.7
$0.7 $0.2
$0.2
$1.6
$6.8
$5.3
$0.4 $0.1
$0.7
$0.3 $0.4
Agency 1 Agency 2 Non-Agency 1 Non-Agency 2 Commercial 1 Commercial 2 Corporates 1 Corporates 2
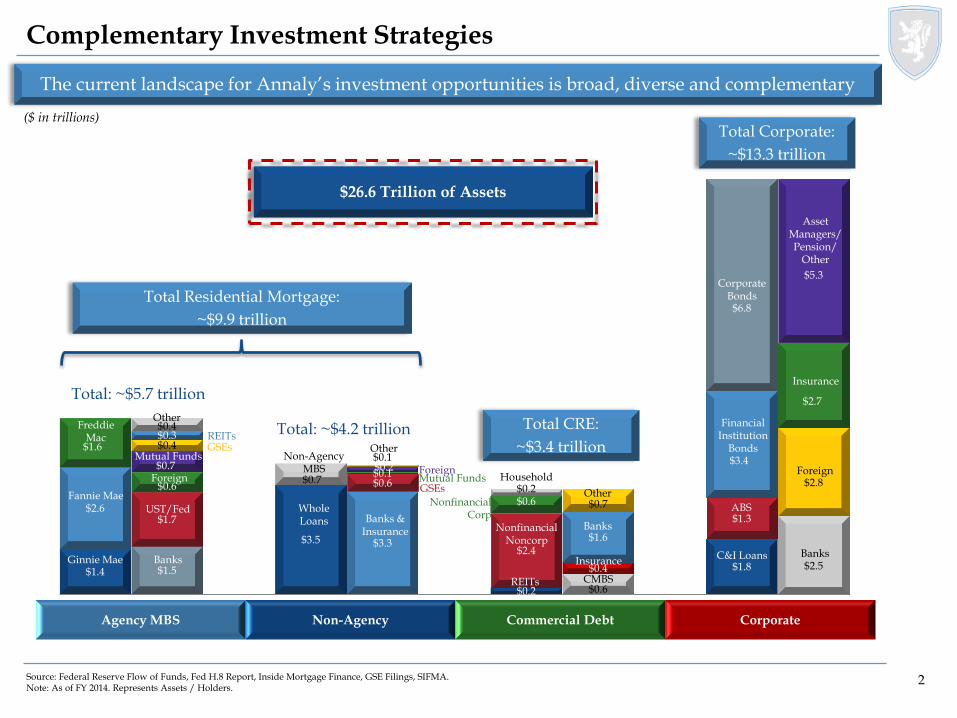
$26.6 Trillion of Assets
Complementary Investment Strategies
The current landscape for Annaly’s investment opportunities is broad, diverse and complementary
Agency MBS Non-Agency Commercial Debt Corporate
Freddie Mac
Ginnie Mae
Fannie Mae
Other
UST/Fed
Banks
Foreign
Mutual Funds GSEs
Whole Loans
Non-Agency MBS
Banks & Insurance
GSEs
REITs
Nonfinancial Noncorp
Nonfinancial Corp
Household
Corporate Bonds
Financial Institution
Bonds
ABS
C&I Loans Banks
Foreign
Insurance
Asset Managers/ Pension/
Other
CMBS
Insurance
Banks
Other
Total: ~$5.7 trillion
Total: ~$4.2 trillion
($ in trillions)
Total Residential Mortgage:
~$9.9 trillion
Source: Federal Reserve Flow of Funds, Fed H.8 Report, Inside Mortgage Finance, GSE Filings, SIFMA. Note: As of FY 2014. Represents Assets / Holders.
REITs
Mutual Funds Foreign
Total CRE:
~$3.4 trillion
Total Corporate:
~$13.3 trillion
Other

3 3
$1,735 $1,692
$1,498
$1,324
$1,167
$800
$900
$1,000
$1,100
$1,200
$1,300
$1,400
$1,500
$1,600
$1,700
$1,800
201
5
201
6
2017
201
8
201
9
Po
rtfo
lio
($
bn
)
$718
$610
$519
$441 $441
$300
$350
$400
$450
$500
$550
$600
$650
$700
$750
201
5
201
6
201
7
201
8
201
9
Po
rtfo
lio
($
bn
) $2 Trillion Opportunity
Annaly is positioned to be a permanent capital solution
Federal Reserve(2) Fannie / Freddie(1) CRE Maturities & New Originations(3)
Source: JPMorgan, Federal Reserve Flow of Funds Report, Trepp, Goldman Sachs and Mortgage Bankers Association. Analytics provided by The YieldBook Software. (1) Retained portfolios include both MBS and unsecuritized loans and represent 15% annual declines from 2015YE target of $718bn (10% below originally agreed upon target in Senior Preferred Stock Purchase Agreement). (2) Fed holdings and runoff are projected assuming reinvestments continue until September 30, 2016. (3) CMBS Data from RSS as of July 13, 2015. (4) Mortgage Bankers Originations from MBA Commercial/Multifamily Real Estate Forecast from February 2015.
GSE Run Off(1) $277bn
Fed Run Off $568bn
$354
$333
$352
$248
$194
$50
$100
$150
$200
$250
$300
$350
$400
$450
201
5
201
6
201
7
201
8
201
9
Ma
turi
tie
s ($
bn
)
CRE Maturities
$1.5tn
New Originations(4)
$1.7tn
M drive:
\\nyprodfs01\annaly\
Investor Pres -
ACREG Pages\GSE
Run Off - Fed Run
Off - CRE Debt
Maturity.xlsx
4 4
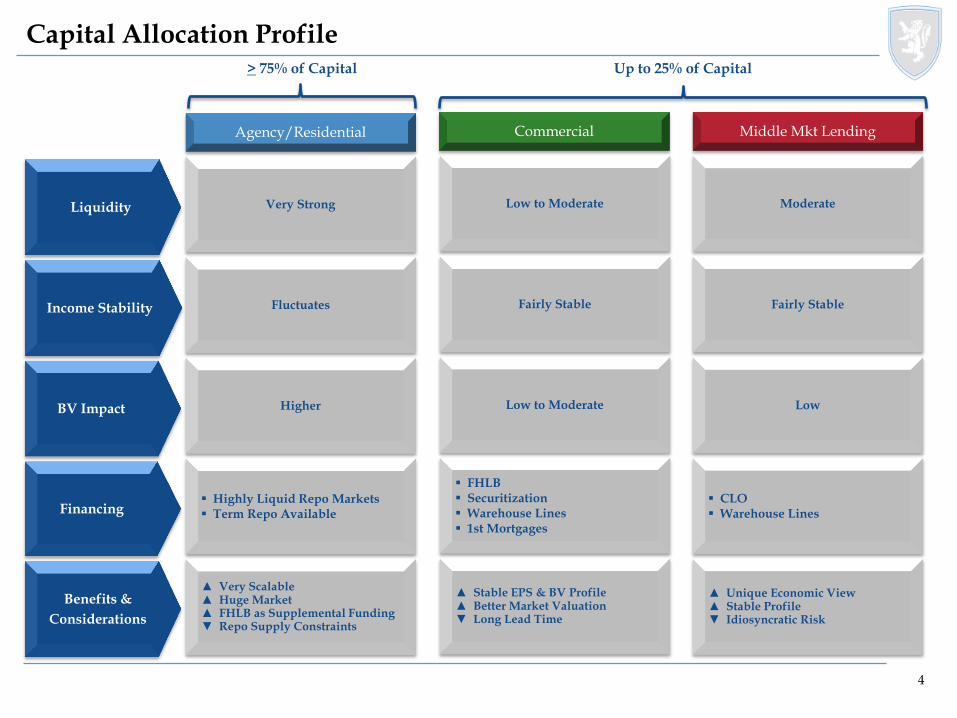
Agency/Residential Commercial Middle Mkt Lending
Financing
Benefits &
Considerations
Highly Liquid Repo Markets Term Repo Available
▲ Very Scalable ▲ Huge Market ▲ FHLB as Supplemental Funding ▼ Repo Supply Constraints
FHLB Securitization Warehouse Lines 1st Mortgages
▲ Stable EPS & BV Profile ▲ Better Market Valuation ▼ Long Lead Time
CLO Warehouse Lines
▲ Unique Economic View ▲ Stable Profile ▼ Idiosyncratic Risk
Liquidity Very Strong Low to Moderate Moderate
Benefits
Higher Low to Moderate Low
Fluctuates Fairly Stable Fairly Stable Income Stability
BV Impact
Capital Allocation Profile > 75% of Capital Up to 25% of Capital
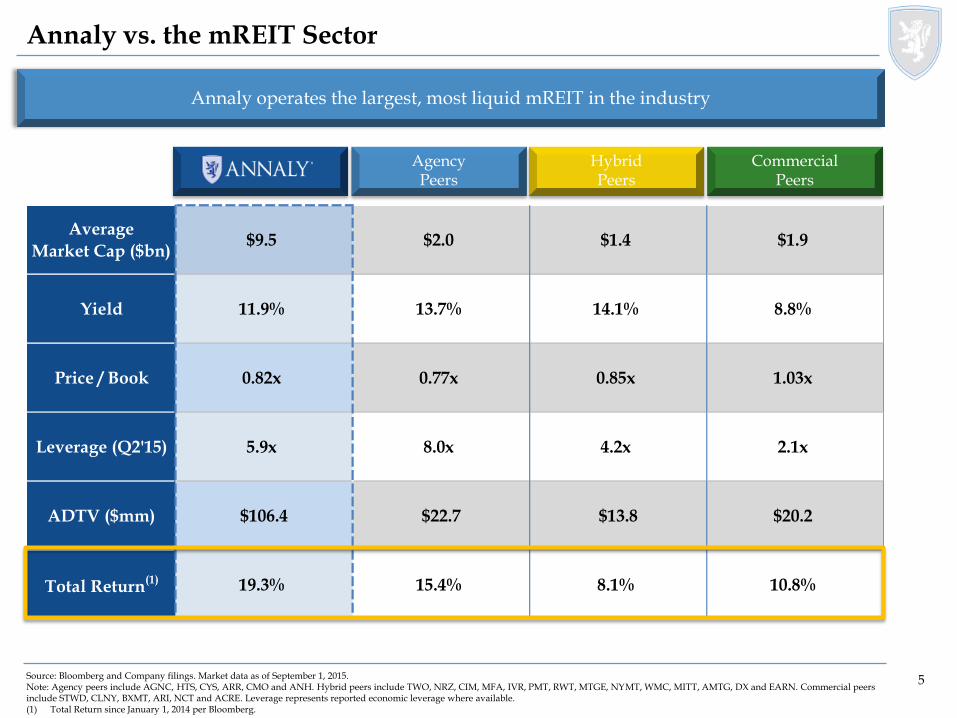
5 5
Average
Market Cap ($bn)$9.5 $2.0 $1.4 $1.9
Yield 11.9% 13.7% 14.1% 8.8%
Price / Book 0.82x 0.77x 0.85x 1.03x
Leverage (Q2'15) 5.9x 8.0x 4.2x 2.1x
ADTV ($mm) $106.4 $22.7 $13.8 $20.2
Total Return(1) 19.3% 15.4% 8.1% 10.8%
Annaly vs. the mREIT Sector
Annaly operates the largest, most liquid mREIT in the industry
Source: Bloomberg and Company filings. Market data as of September 1, 2015. Note: Agency peers include AGNC, HTS, CYS, ARR, CMO and ANH. Hybrid peers include TWO, NRZ, CIM, MFA, IVR, PMT, RWT, MTGE, NYMT, WMC, MITT, AMTG, DX and EARN. Commercial peers include STWD, CLNY, BXMT, ARI, NCT and ACRE. Leverage represents reported economic leverage where available. (1) Total Return since January 1, 2014 per Bloomberg.
Agency Peers
Commercial Peers
Hybrid Peers
6 6
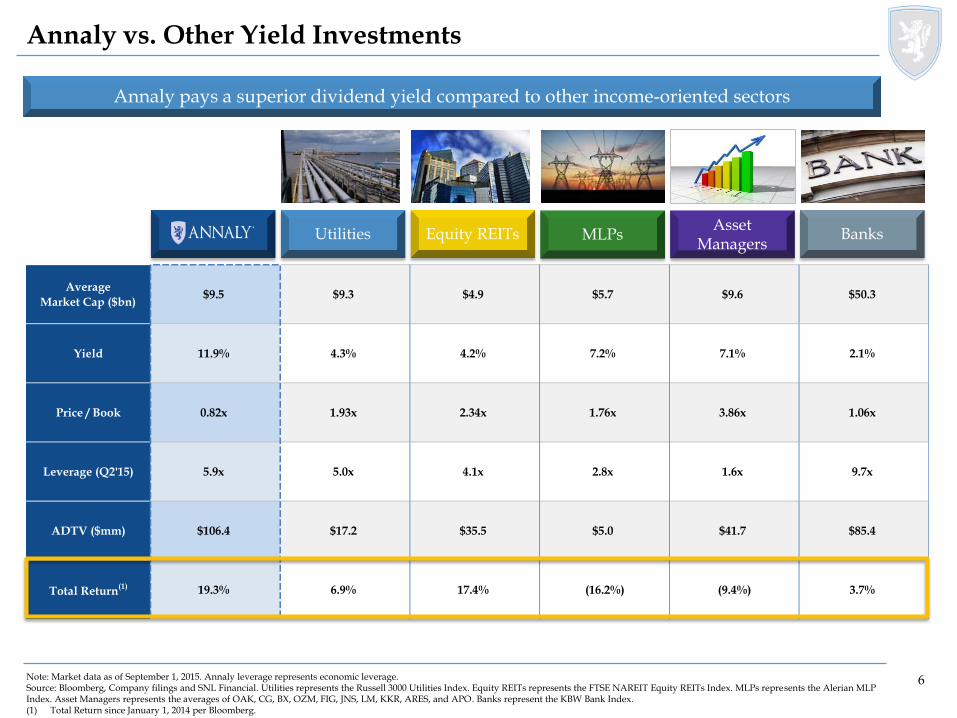
Average
Market Cap ($bn)$9.5 $9.3 $4.9 $5.7 $9.6 $50.3
Yield 11.9% 4.3% 4.2% 7.2% 7.1% 2.1%
Price / Book 0.82x 1.93x 2.34x 1.76x 3.86x 1.06x
Leverage (Q2'15) 5.9x 5.0x 4.1x 2.8x 1.6x 9.7x
ADTV ($mm) $106.4 $17.2 $35.5 $5.0 $41.7 $85.4
Total Return(1) 19.3% 6.9% 17.4% (16.2%) (9.4%) 3.7%
Annaly vs. Other Yield Investments
Annaly pays a superior dividend yield compared to other income-oriented sectors
Note: Market data as of September 1, 2015. Annaly leverage represents economic leverage. Source: Bloomberg, Company filings and SNL Financial. Utilities represents the Russell 3000 Utilities Index. Equity REITs represents the FTSE NAREIT Equity REITs Index. MLPs represents the Alerian MLP Index. Asset Managers represents the averages of OAK, CG, BX, OZM, FIG, JNS, LM, KKR, ARES, and APO. Banks represent the KBW Bank Index. (1) Total Return since January 1, 2014 per Bloomberg.
Utilities MLPs Equity REITs Asset
Managers Banks
7 7
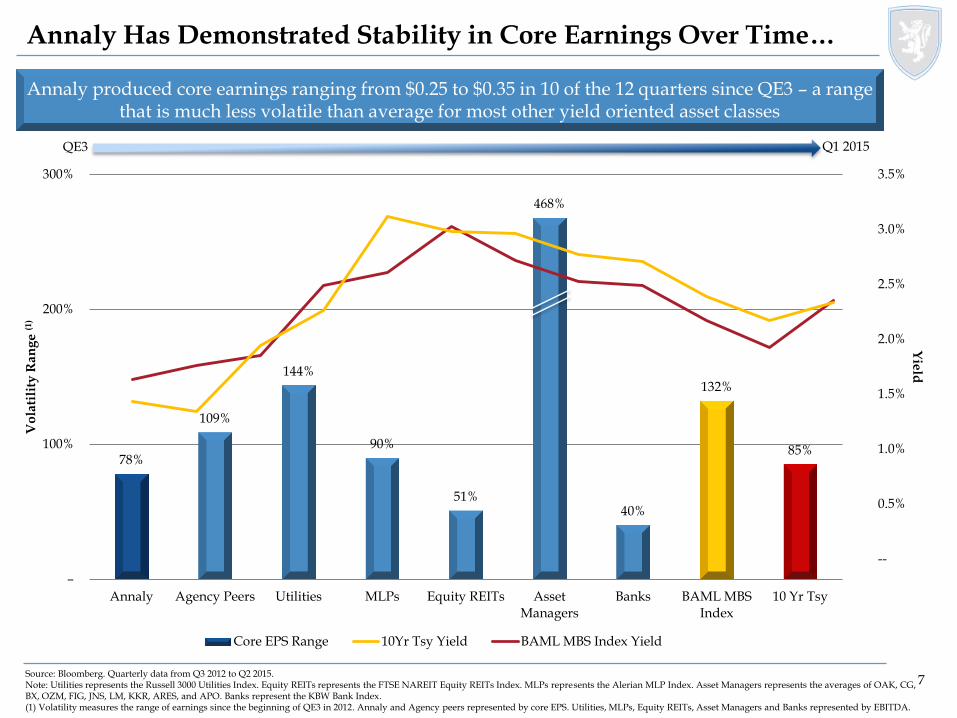
78%
109%
144%
90%
51%
468%
40%
132%
85%
–
100%
200%
300%
Annaly Agency Peers Utilities MLPs Equity REITs AssetManagers
Banks BAML MBSIndex
10 Yr Tsy
Vo
lati
lity
Ra
ng
e (1
)
Core EPS Range 10Yr Tsy Yield BAML MBS Index Yield
--
0.5%
1.0%
1.5%
2.0%
2.5%
3.0%
3.5%
Yie
ld
Annaly Has Demonstrated Stability in Core Earnings Over Time…
Annaly produced core earnings ranging from $0.25 to $0.35 in 10 of the 12 quarters since QE3 – a range that is much less volatile than average for most other yield oriented asset classes
Source: Bloomberg. Quarterly data from Q3 2012 to Q2 2015. Note: Utilities represents the Russell 3000 Utilities Index. Equity REITs represents the FTSE NAREIT Equity REITs Index. MLPs represents the Alerian MLP Index. Asset Managers represents the averages of OAK, CG, BX, OZM, FIG, JNS, LM, KKR, ARES, and APO. Banks represent the KBW Bank Index. (1) Volatility measures the range of earnings since the beginning of QE3 in 2012. Annaly and Agency peers represented by core EPS. Utilities, MLPs, Equity REITs, Asset Managers and Banks represented by EBITDA.
QE3 Q1 2015
\\nyprodfs02\fidac\Capital
Markets\Competitor Comparison\Other
Requests\2015.05_Earnings
Backup\Index Earnings Growth.xlsx
\\nyprodfs02\fidac\Capital
Markets\Competitor Comparison\2015
Q2\Q2 2015 CompCo_ vCurrent.xlsx
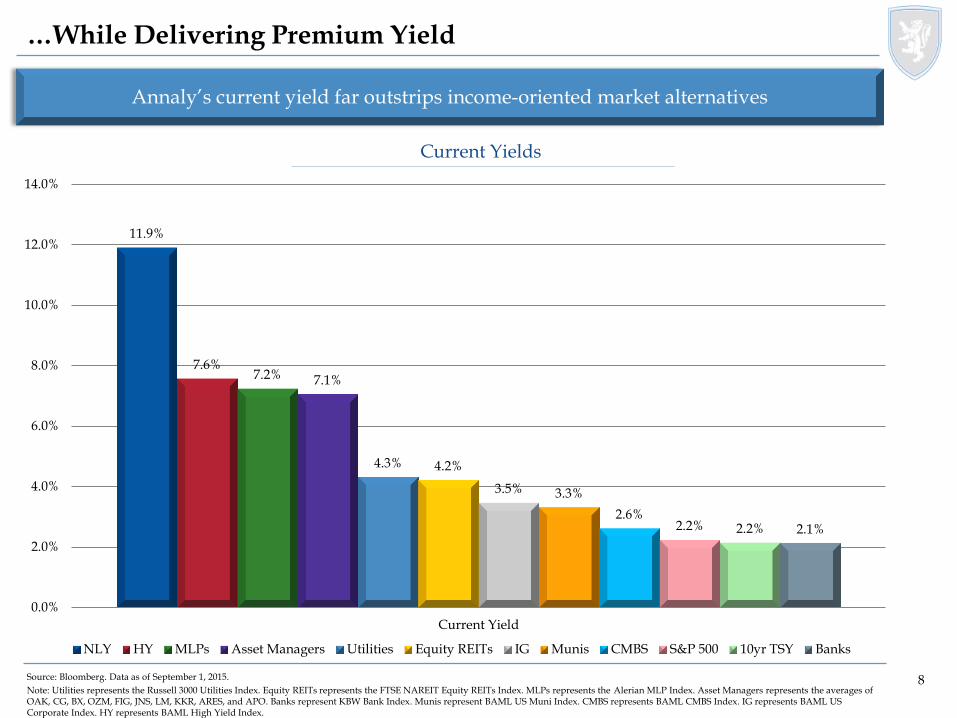
8 8 Source: Bloomberg. Data as of September 1, 2015.
Note: Utilities represents the Russell 3000 Utilities Index. Equity REITs represents the FTSE NAREIT Equity REITs Index. MLPs represents the Alerian MLP Index. Asset Managers represents the averages of OAK, CG, BX, OZM, FIG, JNS, LM, KKR, ARES, and APO. Banks represent KBW Bank Index. Munis represent BAML US Muni Index. CMBS represents BAML CMBS Index. IG represents BAML US Corporate Index. HY represents BAML High Yield Index.
…While Delivering Premium Yield
Annaly’s current yield far outstrips income-oriented market alternatives
Current Yields
\\nyprodfs02\fidac\Capital Markets\Requests\Asset
Returns\Asset Class Projected Returns since 2000 vCurrent.xlsx
11.9%
7.6% 7.2% 7.1%
4.3% 4.2%
3.5% 3.3%
2.6% 2.2% 2.2% 2.1%
0.0%
2.0%
4.0%
6.0%
8.0%
10.0%
12.0%
14.0%
Current Yield
NLY HY MLPs Asset Managers Utilities Equity REITs IG Munis CMBS S&P 500 10yr TSY Banks
9 9
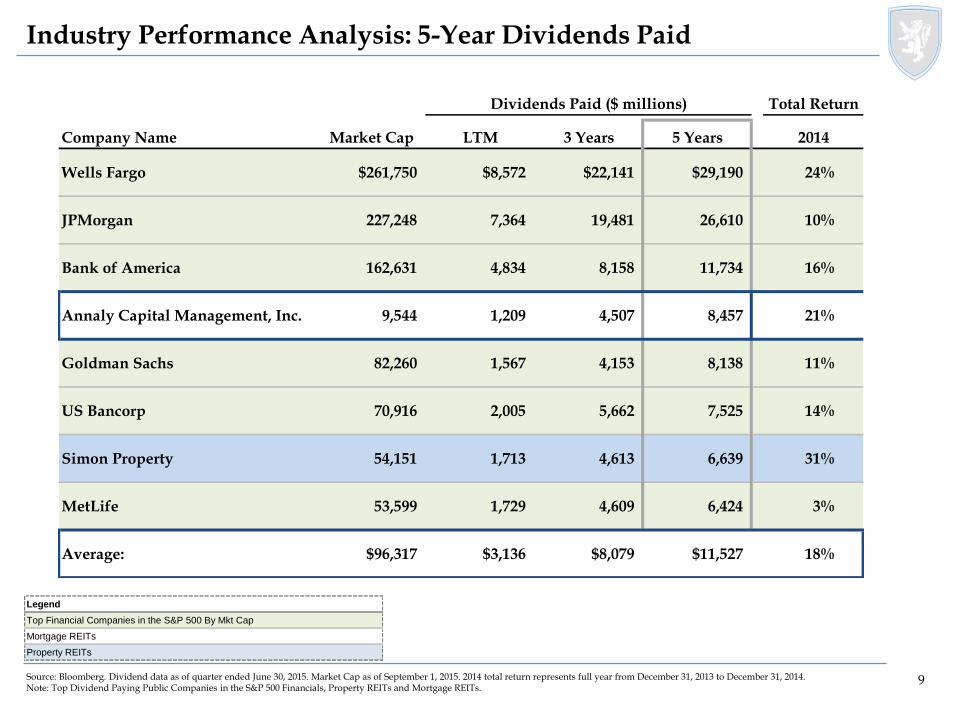
Industry Performance Analysis: 5-Year Dividends Paid
Source: Bloomberg. Dividend data as of quarter ended June 30, 2015. Market Cap as of September 1, 2015. 2014 total return represents full year from December 31, 2013 to December 31, 2014. Note: Top Dividend Paying Public Companies in the S&P 500 Financials, Property REITs and Mortgage REITs.
Legend
Top Financial Companies in the S&P 500 By Mkt Cap
Mortgage REITs
Property REITs
\\nyprodfs02\fidac\Capital
Markets\Comp
Analysis\Executive
Comp\New Dividend
Summary_vCurrent.xlsx
Dividends Paid ($ millions) Total Return
Company Name Market Cap LTM 3 Years 5 Years 2014
Wells Fargo $261,750 $8,572 $22,141 $29,190 24%
JPMorgan 227,248 7,364 19,481 26,610 10%
Bank of America 162,631 4,834 8,158 11,734 16%
Annaly Capital Management, Inc. 9,544 1,209 4,507 8,457 21%
Goldman Sachs 82,260 1,567 4,153 8,138 11%
US Bancorp 70,916 2,005 5,662 7,525 14%
Simon Property 54,151 1,713 4,613 6,639 31%
MetLife 53,599 1,729 4,609 6,424 3%
Average: $96,317 $3,136 $8,079 $11,527 18%

10 10
Filing Date Holder Shares
Purchased(1) Purchase Price ($)(1)
Purchase Value ($)
8/7/2015 Kevin G. Keyes-President; Director 300,000 $10.08 $3,024,000
8/20/2013 Wellington J. Denahan-Chairman of Board & CEO 181,818 $10.96 $1,993,631
5/8/2015 Wellington J. Denahan-Chairman of Board & CEO 198,216 $10.04 $1,991,203
8/8/2014 R. Nicholas Singh-Chief Legal Officer 122,784 $11.46 $1,407,105
11/15/2012 Kevin G. Keyes-President; Director 100,000 $13.90 $1,390,000
11/12/2013 Kevin G. Keyes-President; Director 100,000 $10.43 $1,043,000
8/21/2015 Wellington J. Denahan-Chairman of Board & CEO 100,000 $10.33 $1,033,000
8/13/2014 Wellington J. Denahan-Chairman of Board & CEO 86,837 $11.52 $1,000,362
11/8/2013 Wellington J. Denahan-Chairman of Board & CEO 93,000 $10.68 $993,240
8/8/2011 Kevin G. Keyes-President; Director 50,000 $17.13 $856,500
3/18/2015 Glenn A. Votek-Chief Financial Officer 25,000 $10.65 $266,250
8/17/2015 Glenn A. Votek-Chief Financial Officer 25,000 $10.36 $259,000
Top Annaly Management Purchases Since 2011
Top Insider Purchases
Source: SNL Financial as of August 25, 2015. Current market data from Bloomberg as of August 25, 2015. Note: Includes open market purchases of securities. Not inclusive of purchases tied to options or awards granted. (1) In instances where multiple transactions are disclosed in a single filing, share purchases are combined and weighted average price is shown.

11 11
(100%)
0%
100%
200%
300%
400%
500%
600%
700%
Annaly S&P 500 Bloomberg mREIT Index MSCI US REIT Index S&P Financials Berkshire Hathaway
The Annaly Track Record
Annaly has paid out $13.0 billion in dividends since inception (1)
Source: Bloomberg, weekly, October 10, 1997 through September 1, 2015. MSCI US REIT Index performance data begins June 17, 2005. (1) Source: Company filings and Bloomberg.
File:
N:\Capital Markets\Marketing\Presentations\Backup
Power of Dividends NEW - Mtg REIT Index_v14- SINCE IPO.xlsx
Price
Appreciation
Annaly (20%) 553% 533%
S&P 500 106% 81% 187%
Bloomberg mREIT Index (82%) 190% 108%
MSCI US REIT Index 26% 68% 93%
Berkshire Hathaway 346% 0% 346%
S&P Financials 15% 51% 66%
DividendsTotal
Return
12 12
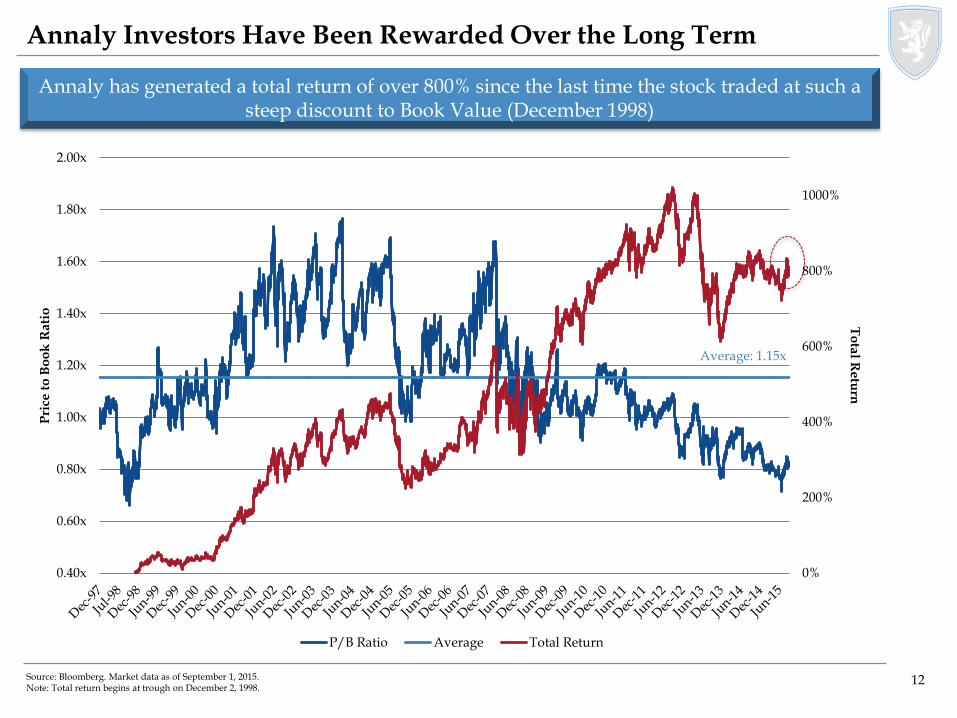
Annaly Investors Have Been Rewarded Over the Long Term
Source: Bloomberg. Market data as of September 1, 2015. Note: Total return begins at trough on December 2, 1998.
The lowest NLY has traded was at 0.66x on December 6th and 7th, 1998
The stock traded below book from June 12, 1998 to April 26, 1999, which was 219 trading days
Since 2000, the lowest NLY has traded was 0.72x on June 29, 2015
The stock has been trading below book since May 9th, 2013, which has been 591 trading days to date
Average: 1.15x
\\nyprodfs02\fidac\Capital
Markets\Hojnacki\Price_to_Book
_Dec 2013_v1.xlsx
Annaly has generated a total return of over 800% since the last time the stock traded at such a steep discount to Book Value (December 1998)
0%
200%
400%
600%
800%
1000%
0.40x
0.60x
0.80x
1.00x
1.20x
1.40x
1.60x
1.80x
2.00x
To
tal R
etu
rn
Pri
ce t
o B
oo
k R
ati
o
P/B Ratio Average Total Return

13 13
Agency
14 14 Source: Bloomberg and Company filings.
(1) Market Caps for 1998, 2005 and 2015 are as of December 31, 1998, December 30, 2005 and September 1, 2015, respectively. (2) GSE Credit Risk Sharing debt, Callable debt.
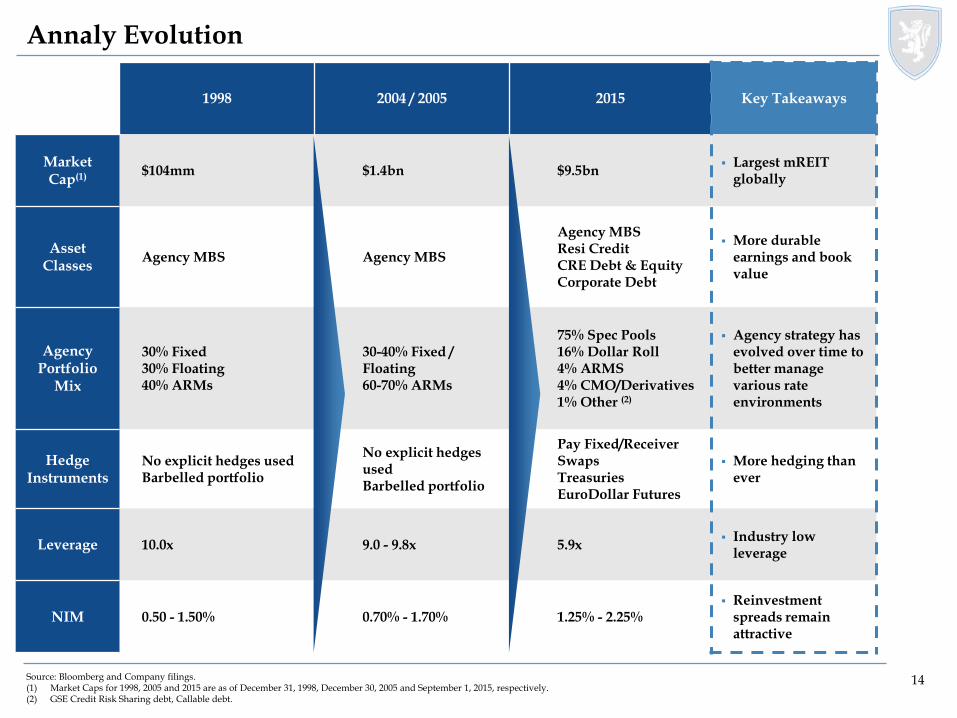
1998 2004 / 2005 2015 Key Takeaways
Market Cap(1) $104mm $1.4bn $9.5bn
Largest mREIT globally
Asset Classes
Agency MBS Agency MBS
Agency MBS Resi Credit CRE Debt & Equity Corporate Debt
More durable earnings and book value
Agency Portfolio
Mix
30% Fixed 30% Floating 40% ARMs
30-40% Fixed / Floating 60-70% ARMs
75% Spec Pools 16% Dollar Roll 4% ARMS 4% CMO/Derivatives 1% Other (2)
Agency strategy has evolved over time to better manage various rate environments
Hedge Instruments
No explicit hedges used Barbelled portfolio
No explicit hedges used Barbelled portfolio
Pay Fixed/Receiver Swaps Treasuries EuroDollar Futures
More hedging than ever
Leverage 10.0x 9.0 - 9.8x 5.9x Industry low
leverage
NIM 0.50 - 1.50% 0.70% - 1.70% 1.25% - 2.25% Reinvestment
spreads remain attractive
Annaly Evolution
15 15
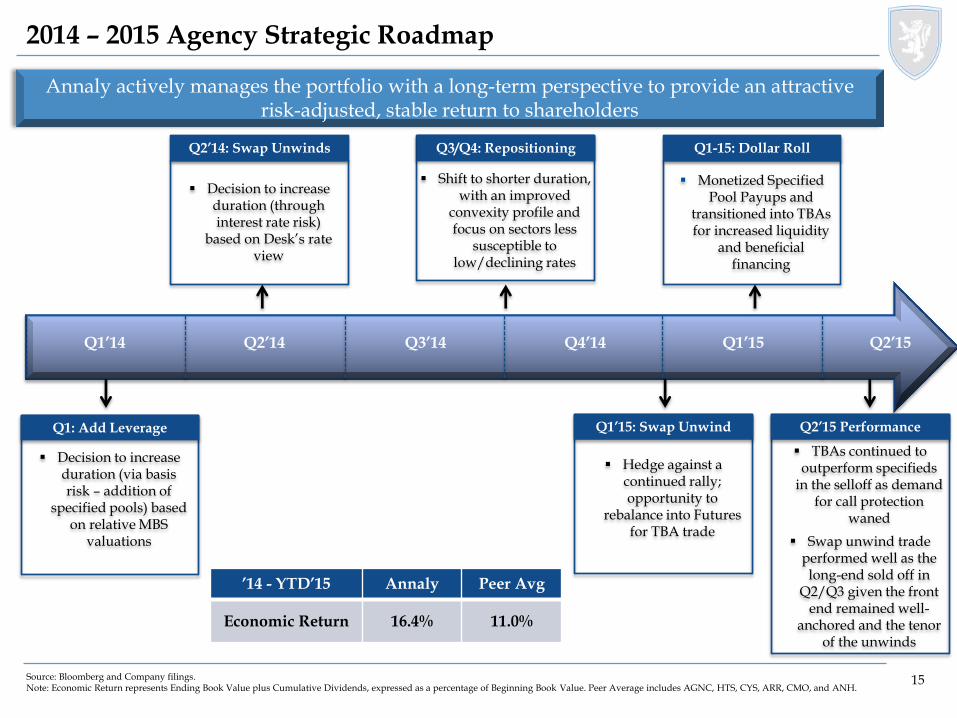
2014 – 2015 Agency Strategic Roadmap
Decision to increase duration (via basis risk – addition of
specified pools) based on relative MBS
valuations
Q1: Add Leverage
Decision to increase duration (through interest rate risk)
based on Desk’s rate view
Q2’14: Swap Unwinds
Hedge against a continued rally; opportunity to
rebalance into Futures for TBA trade
Q1’15: Swap Unwind
Monetized Specified Pool Payups and
transitioned into TBAs for increased liquidity
and beneficial financing
Q1-15: Dollar Roll
TBAs continued to
outperform specifieds in the selloff as demand
for call protection waned
Swap unwind trade performed well as the long-end sold off in
Q2/Q3 given the front end remained well-
anchored and the tenor of the unwinds
Q2’15 Performance
Q1’15 Q4’14 Q3’14 Q2’14 Q1’14 Q2’15
Shift to shorter duration,
with an improved convexity profile and focus on sectors less
susceptible to low/declining rates
Q3/Q4: Repositioning
’14 - YTD’15 Annaly Peer Avg
Economic Return 16.4% 11.0%
Annaly actively manages the portfolio with a long-term perspective to provide an attractive risk-adjusted, stable return to shareholders
Source: Bloomberg and Company filings. Note: Economic Return represents Ending Book Value plus Cumulative Dividends, expressed as a percentage of Beginning Book Value. Peer Average includes AGNC, HTS, CYS, ARR, CMO, and ANH.
16 16
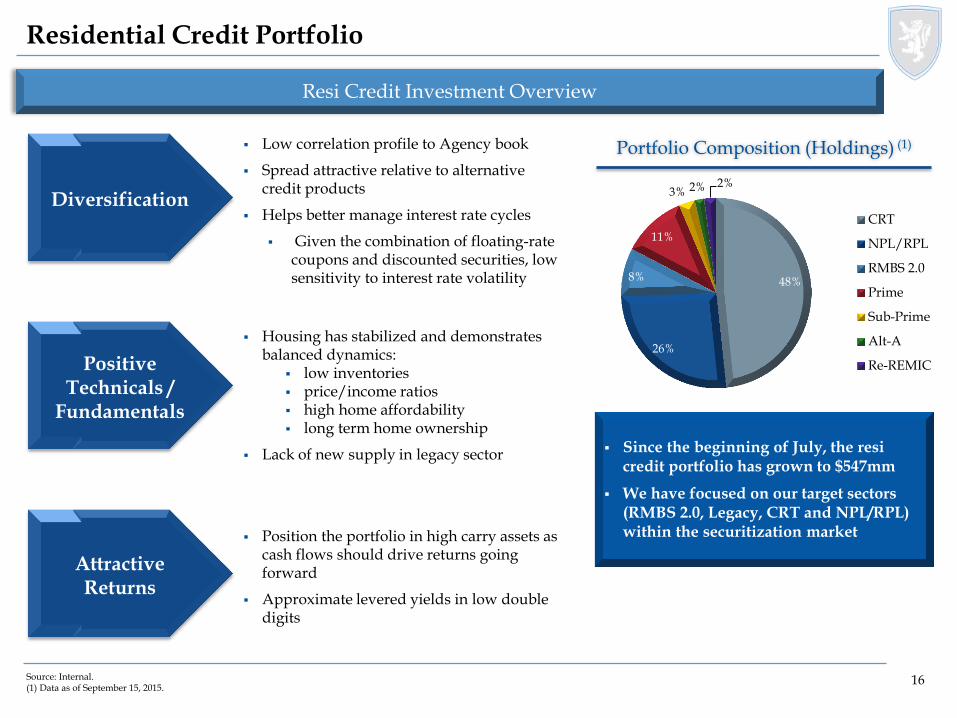
Portfolio Composition (Holdings) (1)
Residential Credit Portfolio
Resi Credit Investment Overview
Diversification
Positive Technicals /
Fundamentals
Attractive Returns
Low correlation profile to Agency book
Spread attractive relative to alternative credit products
Helps better manage interest rate cycles
Given the combination of floating-rate coupons and discounted securities, low sensitivity to interest rate volatility
Housing has stabilized and demonstrates balanced dynamics:
low inventories price/income ratios high home affordability long term home ownership
Lack of new supply in legacy sector Since the beginning of July, the resi credit portfolio has grown to $547mm
We have focused on our target sectors (RMBS 2.0, Legacy, CRT and NPL/RPL) within the securitization market
Position the portfolio in high carry assets as cash flows should drive returns going forward
Approximate levered yields in low double digits
48%
26%
8%
11%
3% 2% 2%
CRT
NPL/RPL
RMBS 2.0
Prime
Sub-Prime
Alt-A
Re-REMIC
Source: Internal. (1) Data as of September 15, 2015.

17 17
Comparative Performance
Annaly has generated an economic return of 16.4% over the last 6 quarter vs. 11.0% for its Agency peers while operating at 70% of the average peer leverage
0.7%
1.9%
(0.1%)
0.8%
0.1%
(0.4%)
0.6%
1.0%
0.0%
0.4% 0.2%
(0.5%)
(1.0%)
(0.5%)
0.0%
0.5%
1.0%
1.5%
2.0%
2.5%
Q1 2014 Q2 2014 Q3 2014 Q4 2014 Q1 2015 Q2 2015
Annaly Peer Average BV Weighted
Source: Company filings. Note: Peer Average includes AGNC, HTS, CYS, ARR, CMO, and ANH.
Economic Return per Unit of Leverage
18 18
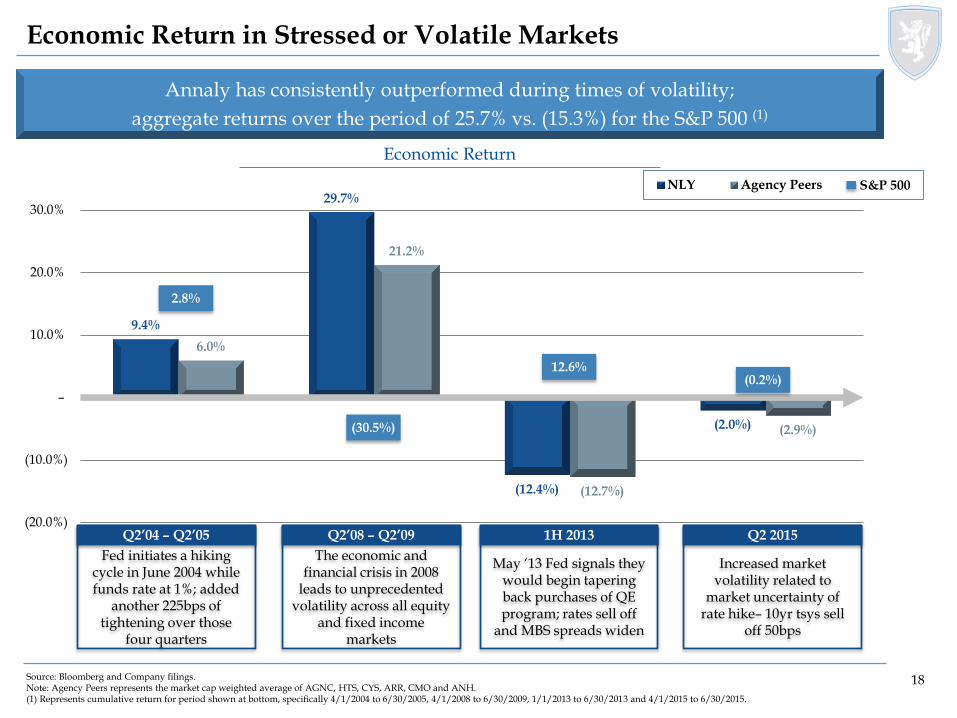
9.4%
29.7%
(12.4%)
(2.0%)
6.0%
21.2%
(12.7%)
(2.9%)
(20.0%)
(10.0%)
–
10.0%
20.0%
30.0%
2004 2008 1H 2013 Q2 2015
NLY Agency Peers
Economic Return in Stressed or Volatile Markets
Annaly has consistently outperformed during times of volatility;
aggregate returns over the period of 25.7% vs. (15.3%) for the S&P 500 (1)
Source: Bloomberg and Company filings. Note: Agency Peers represents the market cap weighted average of AGNC, HTS, CYS, ARR, CMO and ANH. (1) Represents cumulative return for period shown at bottom, specifically 4/1/2004 to 6/30/2005, 4/1/2008 to 6/30/2009, 1/1/2013 to 6/30/2013 and 4/1/2015 to 6/30/2015.
Economic Return
Fed initiates a hiking
cycle in June 2004 while funds rate at 1%; added
another 225bps of tightening over those
four quarters
Q2’04 – Q2’05
2.8%
(30.5%)
12.6% (0.2%)
Increased market volatility related to
market uncertainty of rate hike– 10yr tsys sell
off 50bps
Q2 2015 The economic and
financial crisis in 2008 leads to unprecedented
volatility across all equity and fixed income
markets
Q2’08 – Q2’09
May ‘13 Fed signals they would begin tapering back purchases of QE program; rates sell off
and MBS spreads widen
1H 2013
S&P 500
19 19
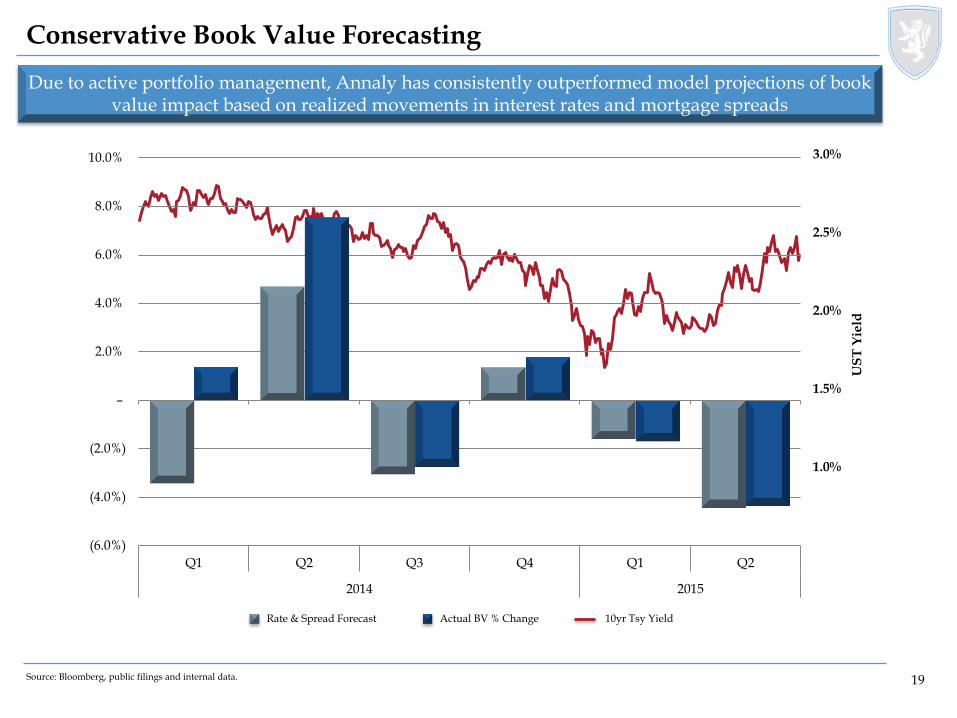
1.0%
1.5%
2.0%
2.5%
3.0%
US
T Y
ield
(6.0%)
(4.0%)
(2.0%)
–
2.0%
4.0%
6.0%
8.0%
10.0%
Q1 Q2 Q3 Q4 Q1 Q2
2014 2015
Conservative Book Value Forecasting
Due to active portfolio management, Annaly has consistently outperformed model projections of book value impact based on realized movements in interest rates and mortgage spreads
Source: Bloomberg, public filings and internal data.
Rate & Spread Forecast Actual BV % Change 10yr Tsy Yield

20 20
Commercial

21 21
Apartment, $2,150
Office $1,768
Retail, $1 14
Health Care, $1,007
Warehouse, $426
Other, $528
Current Net Stock of Private CRE Assets (1)
(1) Source: Bureau of Economic Analysis (as of 2014). (2) Source: Real Capital Analytics. Volumes annual except for 2015, which is as of June 30, 2015. (3) Source: Haver Analytics. (4) Source: Commercial Real Estate Finance Council. Volumes annual except for 2015, which is as of June 30, 2015.
CRE: Large Investable Market—Room for Growth
Continued growth for investing opportunities in the U.S.
$50.9
$30.0
$44.4
$80.3
$89.9
2011 2012 2013 2014 2015
$258.2 $234.8
$298.1
$362.5
$430.4
2011 2012 2013 2014 2015
CRE Transaction Volume (2)
($ in billions)
CMBS Deal Issuance (4)
($ in billions)
REITs, $199
CMBS, $631
LifeCos, $373
Banks, $1,698
GSEs, $247
Gov't, $201
Other, $76
Commercial Mortgage Debt Outstanding (3)
($ in billions)
($ in billions)
Total: $6.9 trillion
Total: $3.4 trillion
37.6%
29.4%
1H Volume Annual Volume
1H Volume Annual Volume

22 22
Annaly Commercial Real Estate Group Portfolio
Whole Loans 14%
Mezzanine Loan
Investments 29%
Preferred Equity
12%
Equity 13%
AAA CMBS 13%
B-Piece CMBS
Securities 19%
Source: Company filings and internal. Data as of June 30, 2015. (1) Based on percentage of equity invested in ACREG portfolio as a percentage of stockholders’ equity.
Whole Loans 10%
Mezzanine Loan
Investments 38%
Preferred Equity
16%
Equity 8%
AAA CMBS 3%
B-Piece CMBS Securities
25%
Total Value: $1.74 billion Unlevered Yield: 7.9%
Total Invested: $1.31 billion Levered Yield: 9.9%
Total Equity: $12.6 billion
ACREG invests across the capital structure Whole Loans Mezzanine Loans Preferred Equity Equity Securities (AAA CMBS, B-Pieces)
ACREG uses leverage to enhance returns of whole loans, equity and AAA CMBS
Asset Value Equity Invested Annaly Book Equity (1)
ACREG 10%
Agency, Non-Agency,
Corporate 90%
23 23
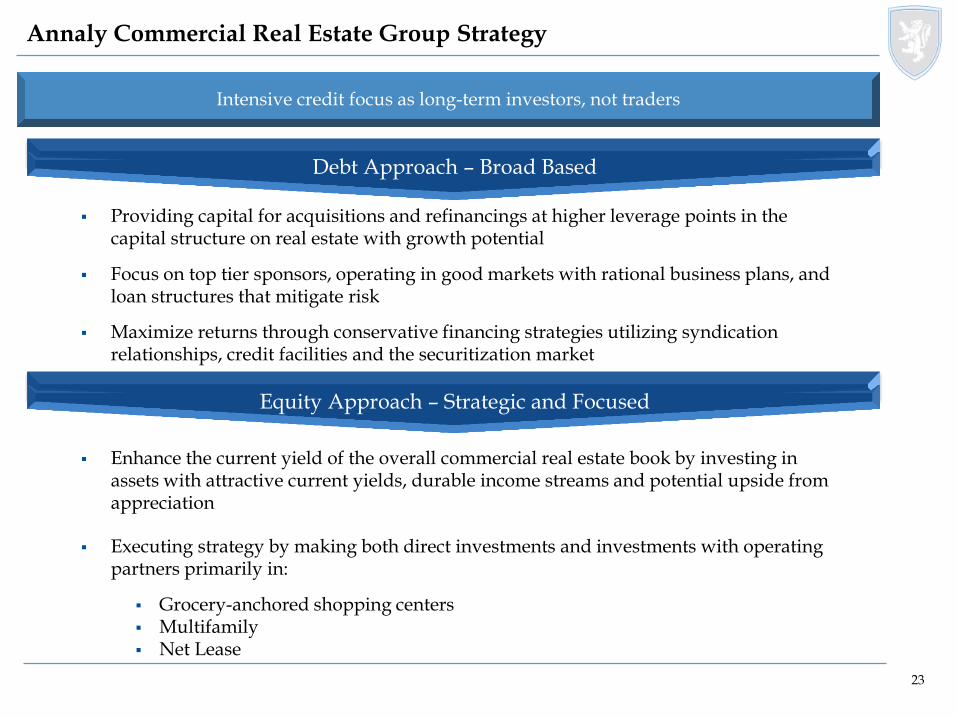
Annaly Commercial Real Estate Group Strategy
Intensive credit focus as long-term investors, not traders
Providing capital for acquisitions and refinancings at higher leverage points in the capital structure on real estate with growth potential
Focus on top tier sponsors, operating in good markets with rational business plans, and loan structures that mitigate risk
Maximize returns through conservative financing strategies utilizing syndication relationships, credit facilities and the securitization market
Enhance the current yield of the overall commercial real estate book by investing in assets with attractive current yields, durable income streams and potential upside from appreciation
Executing strategy by making both direct investments and investments with operating partners primarily in:
Grocery-anchored shopping centers Multifamily Net Lease
Debt Approach – Broad Based
Equity Approach – Strategic and Focused