annex 5 land-use, land-cover - world bankdocuments.worldbank.org/curated/en/716361468233047921/...1...
TRANSCRIPT

1
Annex 5 Land-use, Land-cover
Of Proposed Project Areas
Pub
lic D
iscl
osur
e A
utho
rized
Pub
lic D
iscl
osur
e A
utho
rized
Pub
lic D
iscl
osur
e A
utho
rized
Pub
lic D
iscl
osur
e A
utho
rized
Pub
lic D
iscl
osur
e A
utho
rized
Pub
lic D
iscl
osur
e A
utho
rized
Pub
lic D
iscl
osur
e A
utho
rized
Pub
lic D
iscl
osur
e A
utho
rized

2
FINAL REPORT LAND USE/LAND COVER OF THE PROPOSED PROJECT "SAMALOUT / GULF OF SUEZ 500KV TRANSMISSION
LINE"
Prepared By Mahmoud H Ahmed and Others
National Authority for Remote Sensing and Space Sciences
Electrical Power Samaloot

3
JANUARY 2010

4
List of Contents
Page No
INTRODUCTION 3
PREAMBLE 5
AIMS OF THE STUDY 5
MAIN DIVISIONS OF THE REPORT 5
STUDY AREA 6
DATA ACQUISITION 8
LAND USE-LAND COVER 20
APPENDING GIS LAYERS 20
CHANGE DETECTION 30
NATURAL HAZARDS ASSESSMENT 32
CONCLUSIONS 35
REFERENCES 36

5
Introduction
The Red Sea coastal land of Egypt extends from Suez (Lat. 30"N) to Mersa Halaib
(Lat. 22'N) at the Sudano-Egyptian border. The land adjacent to the Red Sea in Egypt
is generally mountainous, flanked on the western side by the range of coastal
mountains. In the deep trough between the shore-line and the highlands extends a
gently sloping plain which varies in width from 8 to 35 km. In certain parts of. the
west coast of the Gulf of Suez (e.g. Ehashm El-Galala ' 60 km South of Suez), there is
scarcely any plain, the mountains rising almost directly from the gulf. The coastal
plain is covered with sand over which the drainage systems of wadis meander with
their shallow courses.
Menya Governorate is considered one of the leading governorates through Egypt’s
ancient and modern history. It was gifted by a distinguished location among the
governorates of the northern Upper Egypt region. Such location reflected both
negatively and positively on the features of the inhabitance growth of the governorate.
Menya lies between the two longitudes 40 28°, 37 32° east and the two latitudes 40
27°, 45 28° north. It’ area is estimated to be about 32.2 79 km2, stretching to about
135 km in length. Menya population, according to the estimated census dated 1-1-
2005, is about 40 49 000. The inhabited area is estimated to be about 2.4 thousand
km, representing 7.5% only of the total area, upon which lives more than 4 million
people. It’s worth mentioning that Menya is the second biggest populated
governorate, after Giza, among Upper Egypt governorates capital. Menya is
surrounded by Beni Sweif from the north Giza and El Wady El Gedeed from the west,
Red Sea governorate from the east, and Assuit from the South. Menya is connected
with the other governorates through regional roads and national rail way.
The climate of the study area is arid. The mean annual rainfall ranges along Red sea
coast from 25 mm in Suez, 4 mm in Hurghada to 3.4 mm in Qusseir. The main bulk of
rain occurs in winter, i.e. Mediterranean affinity, and summer is, in general, rainless.
Variability of annual rainfall is not unusual. In Suez, for example, the years 1949 and
1958 were very dry: total annual rainfall was 2 mm and 3.1 mm respectively; whereas
in the years 1952 and 1956, which were relatively wet, rainfall was 56 mm and 55

6
mm respectively (Kassas and Zahran, 1962, 1965). Temperature is high and ranges
between 14-21.7'C in winter and 23.1-46.1'C in summer. Relative humidity ranges
from 43% in summer to 65% in winter. The Picheevaporation is higher in summer
(13.7-21.5 mm/day) than in winter (5.2-10.4 mm/day). The climate is the region is
affected by the dominating environmental circumstances, Menya stretches
longitudinally in latitudes between 40 27° and 45 28° North. As a result, it falls into
the desert climate system with its well known features. It’s worth mentioning that
most of the Egyptian lands fall in the same system. Maximum highest temperature
rate reaches 36.7° during summer, whereas the minimum temperature rate records
20.2° for the same month.
Recording land use/ land cover change over time is perhaps one of the most
important applications of digital remote sensing data (Christensen et al., 1988). For
example, the conversion of desert land to industrial activity land use can be detected
using a temporal comparison of spatial change determined from multi-dates satellite
data. The value of utilizing remotely sensed data for change detection studies is
limited only by the imagination of the investigators and potential users.
The using of change detection technique is to measure the changes in spatial distribution
of desert soil and marginal vegetation, water areas and land in Studyarea. Also, to detect
environmental change trends, particularly in soil, vegetation type and cover, as well as in
coastal areas during the past three decades.
Proposed project Justifications
Project identification:
In order to evacuate the energy generated at Gulf of Suez area, EETC is planning to
interconnect the Transmission line in the Gulf of Suez and Gabal El-Zait areas with
Samalout substation located at the Nile Valley by installing double circuit 500kV
transmission line of approximately 280 km. The line rout starts at Samalout 500kV
substation in desert area, then it goes through agriculture area until the Nile river. When it

7
crosses the Nile, it goes through desert area till Gabal El-Zait. The desert area of the line
rout is approximately 89% of the total length of the line (approx 248 km), while the
remaining 11% is agriculture area (approx 32km)
There are three proposed alternatives for the rout at Samalout segment. The main
differences are:
1- the first rout crosses the Nile River at 600 mt distance
2- The second rout crosses the Nile River at 600 mt distance and succeeded to avoid
the housing blocks
3- The third rout crosses the Nile River at 900 mt distance, and there is a mining area
located at the eastern side of the Nile.
The proposed selected rout is the second one since it crosses the Nile at minimal distance,
avoids all houses blocks and far from the pollution caused by the mining area.
Present Status
Air is polluted when coal and petroleum substances are burnt (oil – diesel – gas – fuel
used at homes, factories, cars and other serving activities). Combustion produces big
amount of carbon dioxide. During combustion carbon monoxide and sulphur dioxide as
well as nitrogenous oxides are produced. All these pollutants dangerously affect public
health. Moreover, the quality of air is negatively affected by the emissions of some
industries, such as:
• Sugar industry.
• Cement industry.
• Bricks and pottery industry.
• Plant coal industry.
Sources of energy
The most important sources of energy for most of the industrial activities inside
governorate are:
1- Electricity.
2- Various petroleum substances (mazot, solar, kerosene, benzene, botagas).

8
Menya doesn’t have station for generating electrical energy. It depends on the unified net
to meet its demands of electrical energy. There is a main station (500/220/132/11 k.volt)
at shousha village is Samallout (represents a key element regarding electrical supply in
Menya governorate) connected to the electricity generating station of the High Dam. It is
supplied by 2 lines from Assuit transformers station 500 k volt.
Menya governorate is also provided by electricity through a net of 220 volt supplied from
the generating station of Koraymat and generating station of Haram hill 500 k volt which
is connected to the unified net. Middle Egypt Company for distributing the electricity is
responsible for distributing and selling electrical energy to the subscribers over the
average and the low voltage along the governorates of northern sa'eid. Menya
governorate comes second place among the governorates regarding the annual amount of
sold energy with a percentage of 27.5%, where as it comes fifth regarding the annual
amount of energy consumed / individual. As a result, no fears exist from any pollutants
resulting from the use of electrical energy whether at industrial plants or in homes, this is
because of the absence of electricity generating stations and the dependence only on
transferred electricity. The size and uses of electrical energy in the governorate (2006)
are:
- Industrial and agricultural production (amount of consumed energy is 111154041
k.watt/hr.
- Public utilities (amount of consumed energy is 55.42 million k.watt/hs).
- Houses (amount of consumed energy 1081.22 million k.watt/hr).
- Commercial stores (amount of consumed energy is 23.1 watt/hr).
- Other uses (amount of energy consumed is 357.64 million).
- Average of the individual's annual share of electrical energy is 208.7 k.watt/hr.
- Average of the individual’s monthly share of electrical energy is 174 k.wtt/hr.
The needs for implementing such this important national projects are drived from
assessment of the present status of the electricity demand. Electricity service reaches
all the cities, villages, sub-villages ranches,…etc. of Menya. The governorate depends
on the electricity of the High dam. There are no stations for generating electricity.
Electricity sector in Menya only distributes. However, electricity doesn’t reach all the

9
families at their homes. Indicators of the Uniceif reports illustrate that only 83.5% of
the habitant benefit from electricity. What was recently reported from electricity
sector in 2005 shows that the number of actual subscribers is 745633. From that latest
number, it’s obvious that the number of citizens benefiting from the electricity service
exceed 95%. The population dynamics are increasing and the need for more
electricity service. This is creates the needs for implementing a new electrical
projects.
Preamble
A consultancy study has been commissioned to conduct environmental study for
proposed Transmission line project in Studyarea, Gulf of Suez, Red sea, Egypt. This
study should be submitted according to the terms of references as follows:
1- Ecological study related to Fauna and Flora of the study area.
2- Land use map of the study area (past, present and future plans).
3- Land cover map of the study area (past, present and future plans).
The study focused on the using of satellite images dated in 1984 and 2000 to monitor and
assess the historical land use / land cover feature and changes. Moreover, the field work
had a value add and update the results of the used processed images in the study.
Aims of the Study
The main purpose of this study is to record the natural and anthropogenic characteristics
of the study area ecosystem. The building of baseline information for the study area is
based essentially on using satellite images. This is required for the implementing the
proposed electrical project from Ras Shukeir to Menya governorate. This study aims to
identify the main environmental impact from the proposed project on the ecosystems that
are used for implementing this project; urban, human activities and development
activities to reflect the effect of the project in such these version areas in the Eastern
desert of Egypt.

10
Main divisions of the report
The report includes the following major sections:
• Land use Remote sensing study for the three ecosystems
• Field work section
• Historical changes using multi dates images
• Digital Elevation Model
• Ecological characteristics (Fauna, birds, fish and Flora) for three ecosystems
Study Area
The study area is extended from Ras Shokair city to Menya Governorate with about 300
Km long in the eastern desert, (Figure 1). Ras Shokair is located about 100 Km north of
Hurghada City. The study area has includes three different ecosystems. The first one is
located along the coastal zone of Gulf of Suez, the second ecosystem is located in the
eastern desert between Ras Shokair city and Menya Governorate, while the third
ecosystem is located at the western side of the study area includes the Nile River and
Menya governorate.
The ecological characteristics section gives an account of the environmental
characteristics Fauna and flora i.e. vegetation types of the Red Sea coastal land and the
inland desert as being the main ecological units of the Eastern Desert of Egypt. In this
section the ecological relationships of the ecological types of the coastal land of the
Red Sea that extends for about 300 km from gulf of Suez westwards to Menya
Governorate along the Nile river are described and evaluated. The fauna and flora cover
of representative study areas is indicated and the community types of this ecosystem
presented.
Data acquisition
In order to present a reasonable evaluation of the land use/ land cover maps and their
using in the determination of ecological characteristics of the study area, the following

11
data were collected. The above data have been processed and various geo-spatial data has
been determined automated into various GIS data sets. These data sets include
1. Topography
• A topographic maps of a scale 1: 100,000 (Fig 2)
2. GIS layers
• Spot height (Fig. 3)
• Major and Minor structures
• Contours of elevations (Fig. 2)
• The shoreline
• Road networks
• Stream network (Fig 4)
• A Digital Elevation Model (DEM) (Fig 5)
3. Satellite data (Fig. 6)
• MSS Landsat TM image year 1984
• ETM Landsat Image year 2000
The provided digital data and the automated GIS layers have been used to understand and
present the baseline information about Study areadrainage basin and to conduct a
preliminary assessment of both the natural hazards that might affect the planned mining
installations and the impact of the planned mining installations on the surrounding
environment.

12
Figure (1): Map shows the proposed study area with transmission line geographic coordinates

(TIN) triangulated irregular network
Acronym for triangulated irregular network. A vector data structure that partitions geographic
space into contiguous, no overlapping triangles. The vertices of each triangle are sample data
points with x-, y-, and z-values. These sample points are connected by lines to form Delaunay
triangles. TINs are used to store and display surface models.
ASPECT
The compass direction that a topographic slope faces, usually measured in degrees from north.
Aspect can be generated from continuous elevation surfaces. For example, the aspect recorded
for a TIN face is the steepest down slope direction of the face, and the aspect of a cell in a raster
is the steepest down slope direction of a plane defined by the cell and its eight surrounding
neighbors, (Fig. 4).
(DEM) digital elevation model.
The representation of continuous elevation values over a topographic surface by a regular array
of z-values, referenced to a common datum. DEMs are typically used to represent terrain relief,
(Fig 5).
SLOPE
He incline, or steepness, of a surface. Slope can be measured in degrees from horizontal (0–90),
or percent slope (which is the rise divided by the run, multiplied by 100). A slope of 45 degrees
equals 100 percent slope. As slope angle approaches vertical (90 degrees), the percent slope
approaches infinity. The slope of a TIN face is the steepest downhill slope of a plane defined by
the face. The slope for a cell in a raster is the steepest slope of a plane defined by the cell and its
eight surrounding neighbors (fig. 6).
One divided by distance, often raised to some power (1/D or 1/D2, for example), where D is a
distance value. By inverting the distance among spatial features, and using that inverted value as
a weight, near things have a larger weight or influence than things that are farther away.
An interpolation method for multivariate data in a Delaunay triangulation. The value for an
interpolation point is estimated using weighted values of the closest surrounding points in the

14
triangulation. These points, the natural neighbors, are the ones the interpolation point would
connect to if inserted into the triangulation. The process of sorting or arranging entities into
groups or categories; on a map, the process of representing members of a group by the same
symbol, usually defined in a legend.
Figure (2): Topographic and elevations data over the study area from Ras Skokair in the east to the Nile River in the west

15
Figure (3): Spot hightes data over the study area from Ras Shokair ibn the east to Nile River in the west.
Figure (4): Main aspects patterns of the geomorphological features over the study area. for the Study area.

16
Figure (5): Digital Elevation model for the Study area.
Figure (6): Slop gradient of the surface features over the study area.

17
Figure (7): The acquired Landsat images 1984 and 2000

18
Satellite data required accomplishing the objectives of remote sensing activities and
consequently achieving the current work objectives surveyed from archived scenes. The Landsat
image 1984 and 2000 that cover the study area were collected for the purpose of establishing a
comprehensive GIS database. (Fig 7)
Image processing
Image processing, which comprised three principal steps of geometric correction, spectral
enhancement and, in the case of the images of the study area, image classification was
undertaken using ERDAS Imagine (v 9.3).
Geometric Correction: The geometric correction of each image was carried out using standard
procedures. Geometric distortions are normally introduced to satellite data during acquisition.
They result from several factors including attitude (roll, pitch, and yaw), the Earth’s rotation and
panoramic distortions, (ERDAS, 1999). The coordinates of a remotely sensed scene do not
therefore correspond to a standard map projection and the coordinates of a fixed point vary from
image to image. Geometric correction (rectification) is therefore necessary in order to remove
geometric anomalies and created a faithful representation of the original scene by correcting
pixel location errors and establishing a correspondence between ground features and their correct
position throughout the image. As a result, it has the scale and projection properties (geometric
integrity) of a map. Image rectification is typically accomplished on the basis of well-distributed
ground control points (GCPs) located on both the images and a map of the corresponding area
(Olmanson et al., 2001). For each image a number of GCPs (between five and 19 depending on
image) were identified. These points comprised static features visible in both an image (source
points) and the corresponding 1:50:000 topographic map (reference points). GCPs included road
and canal intersections, bridges and other large man-made features. Since both the source and
corresponding reference points represented the same features with different coordinate systems
they were used to generate a transformation polynomial using the regression analysis method
(Milne, 1988). Acceptance of the transformation polynomial was based upon the RMS error
reported between the two sets of points. It is recommended that the RMS error should not exceed
the pixel size of the raw image and in the worst case (such as in mountainous areas) no more
than double the original pixel size. Subsequently the transformation polynomial was used to

19
rectify the image to the map coordinate system using the nearest neighbour re-sampling
technique (Christensen et al., 1988).
Image enhancement: Enhancement techniques are often employed in order to enhance image
display properties, identify different features in an image and thereby enhance subsequent visual
interpretation. Enhancement of each of the remotely sensed images of the study area was
undertaken by stretching the different spectral bands, one of the most common image
enhancement techniques. This procedure modifies the distribution and range of Digital Numbers
(DNs) of the image pixels so that the potentially limited range of DN values within the original
image covers a larger range within the stretched image, (Lillesand et al., 2008).
Image classification: Review of the false colour composites of Study area (discussed below)
highlighted major changes over time in the distribution of the characteristic feature of this
particular site. The extensive desert nature of study area into different sub-classes so that they
play an important ecological role. Therefore in order to more clearly illustrate these changes and
to provide quantitative information on the relative extent of these classes compared to other areas
of the remotely sensed images of Study areawere subject to a classification procedure. The basic
premise of multi-spectral image classification is that different surfaces have sufficiently different
reflectance properties in different regions of the electromagnetic spectrum (i.e. spectral
signatures). An unsupervised classification approach was adopted (e.g. Lillesand et al., 1998) in
which pixels were classified based upon their spectral signatures alone without any prior
knowledge of the different surfaces within the images. Classification was undertaken using
image bands with the highest spatial resolution. These comprised all four bands (1-6) of the MSS
image (resolution 79 m) and bands 1-5 and 7 of the Landsat TM image (resolution 30 m). The
classification was restricted to a digitised lake boundary for each image identified from the false
colour composites. The unsupervised classification procedure was performed using the
ISODATA (“Iterative Self-Organizing Data Analysis Technique”) algorithm within ERDAS
Imagine with an initial specified 15 arbitrary classes. This algorithm repeatedly performs an
entire classification from which clusters of pixels with similar spectral signatures are identified.
A minimum spectral distance formula is used to define these clusters. After initial unsupervised
classification, classes were combined based upon knowledge of the characteristics of the site to

20
provide major classes (Figure 8). The area and percentage cover of each of these classes was
then evaluated.
The most remotely sensed images used for the study area enable the identification of the key
features within these environments and in their immediate surroundings at the time of image
acquisition. Specific areas discussed in the text are labelled within the images.
Figure 8: Unsupervised classification to the used images

21
Figure 9: Supervised Classified images dated in 1984 and 2000 producing land cover map of the study area
Data Conversion
The files include all the digitized layers along with their thickness values. Various layers of the
dxf files are converted into their corresponding Sahpefiles using ArcGIS. In this step, each layer
of these files is separated into a thematic GIS layer.

22
Geo-referencing
Geo-referencing is an essential step of the spatial data management. Geo-referencing aims at the
conversion of the coordinates from the digitizing screen coordinates into a real world coordinate.
Each GIS layer is geo-referenced using the following parameters:
Projection : Universal Transverse Mercator (UTM)
Unit : Meters
Spheroid : WGS 84
Datum : WGS 84
Zone : 36
Editing
Various editing operations have conducted over GIS layers to make them ready for display and
analysis. These operations include the following:
• GIS layers: GIS layers have been overlain on the geo-referenced scanned map to check that
all layers in the maps have been extracted.
• Features: Check the occurrence or the absence of various features in each GIS layer. Verify
that each polygon is closed (No overshoots or undershoots). Verify that each line is smooth
and connected with other line if necessary.
• Attributes: Removing all the non-required fields of the DXF files from the shape files except
the thickness field, Create a new field called “Code” in the shape files, Transfer values of
“Thickness field” into the new created code field, Display the features in each GIS layer
using code values to assure the accuracy of data entry by comparing them with the source.
Edge matching
Having two GIS layers edge matched, they should be geo-referenced to the same projection
parameters, they should be the same feature class, and the corresponding features should have
the same attribute. Using these fundamentals, all the contiguous GIS layers in the study area
have been edge matched.

23
Mapping
In order to produce the land use / land cover maps with proper scale, various topographic maps,
Landsat images years 1984 and 2000, ground observations, and related ancillary data have been
compiled and processed in different ways. These data have been systematically used to prepare
the necessary layers to constitute an appropriate geographical information system (GIS) for the
study area. These data were integrated to establish a digital data base which could be useful for
site selections of proposed Transmission line project, planning and management of such this
development projects in the area.
The data available that were used in this study grouped into the following: (a) Natural hazards
maps, (b) Satellite data (c) Topographic maps at scale 1:100 000, all of these materials are
discussed in the following:
In the present work, Landsat imagery data dated in 1984 and 2000 that were covering the area of
Study areacity have been digitally processed, analyzed and interpreted to produce a land-
use/land-cover map at a scale of 1: 100.000, (Figure 4). The main classes of recognized land use
(activities) and land cover (resources) at this scale are given in Table (1). This is based mainly on
the multilevel land-use/land-cover classification system for use with remote sensor data adopted
by the U.S. Geological survey (Anderson et al., 1976). Landsat image, clearly displays the major
classes of land-use and land-cover of Study areacoastal zone, Gulf of Suez.
Land-use and land-cover maps are essential for many development projects, such these temporal
maps lead to detect the historical natural and human changes. Land-use / land-cover maps are
helpful to determine quantitatively the environmental changes of both natural and human inputs.
Remote sensing data are becoming important for mapping land-use and land-cover particularly
for large inaccessible areas. They provide an unbiased permanent data set that may be interpreted
for a wide range of land-use/land-cover (Sabins, 1997). Remotely sensed data can be acquired
from various systems, with a spatial resolution that matches the degree of detail required for the
study. The interpretation of remotely sensed data is faster and less expensive than conducting
ground surveys. Furthermore, digital processing is becoming essential because as spatial
resolution and spectral coverage increases, the volume of data also increases. The analysis and

24
interpretation of remote sensing data should be supplemented by ground checks of areas that
represent various categories of land-use and land-cover.
Geographical Information System application and digital analysis of Landsat TM data of years
1975 and 2000 have been utilized in this study to recognized and defined land use in Study
areacoastal plain area. The different steps involved in this work could be explained as follow:
• Defining a comprehensive legend according to the scale of Landsat TM image.
• Field checking and necessary modification of the primary maps applying the auxiliary data
and extant maps to promote the formation depicted on the land use / land cover maps.
• Measurement of land unit surface by applying geographical information system (GIS)
facilities to accomplish the work.
Land Use-Land Cover (LU/LC) Classification Scheme
The produced land-use/land-cover maps of two different dates 1984 and 2000 (Fig. 8&9) clearly
displays the major classes of land use and land cover in the study area of Ras Shukeir. The
system includes all major categories of land use and land cover, and can be expanded for special
situations. Basically, it could provide an accurate database for inventory of the existing patterns
of land-use/land-cover at scales ranging from regional to local. Furthermore, image acquired in
different dates for the same area may be digitally registered and compared to produce change
detection images that emphasize changes in land-use and land-cover. Regulating these changes is
an important action to minimize negative impacts on the environment due to the construction of
the proposed project.
Appending GIS layers
This is the final step of data automation process where all the contiguous GIS layers that have
the same feature class were appended to one GIS. At this point, we are having the following final
layers as shown at Figures (9-13).
Accurate detection of changes in the study area is helpful to assess the environmental status for
all ecological types of both natural parameters and human activities. Land-use and land-cover

25
maps provide an unbiased permanent data set that may be interpreted for a wide range of
applications as well development activities.
A brief description of the main land-use/land-cover categories in the prepared maps of the study
area along the Gulf of Suez, delineated from the interpretation of Land sat-TM images is as
follows (Lotsch et al., 2003):
Sabkha Area:
Field investigation also shows that most of the investigated areasshowed that Menya in general
contains three kinds of soil. In the north and the south, there are salty soils. Medium salt soils are
scattered in the north east, middle and south west. Most of the governorate’s lands are normal
salt and suitable for agriculture. In other words, the nature of land in Menya governorate is
characterized by topographic nature of Menya Governorate.
This layer showed the natural changes of the low land area filled by water and
include many types of vegetation. The salty soil characterize this Sabkha area and affected the
color and type of vegetation cover as shown in the collected photos and digitized from the
classified used images (Figure 7).
However, there is a difference between the urban areas and the rural ones. 85.16% of the urban
citizens of the governorate have access to the water network. 14.84% of them depend on pumps
as a source of water. As for the country side 33.73% only are connected to the public water
network, whereas 63.58% depend on pumps as a source of water percentage of connection to the
public network in urban and rural areas has increased during 2005 from 7: 12% Menya city
comes in the first place regarding the connection to the public water network 96.72%, then Beni
Mazar 96.67%, Odwa 92.45%, Mallawi 86.84%, and Maghagha 82.24%. However, this indicator
doesn’t reflect if the units enjoy an internal source of water.
The gravel desert provides several landform types that may be genetically related. In the first
place the parent fluvial deposits are mixtures of particles ranging from gravels to fine silt and
clay. Under the transportation agencies of wind and water, the finer material is removed and
the coarser material left to accumulate on the surface as lag deposits. This is the process of
natural sorting or sieving which is gradual; stages intermediate between the original mixed
deposits and the mature stage of gravel armour' may be recognized. The mature armour,
Vegetation of the Gravel Desert

26
closely packed gravels, once established, protects the underlying deposits against further
transportation. The result is that the mature gravel surface is usually barren. The vegetation of
the gravel desert of the Sheikh Fadl Desert road has been discussed by Kassas and Imam
(1959) under three types of habitats: gravel slopes, affluent runnels and main channels (Fig.
10). The range land is found inside the desert plain and representative the animal habitate with
grass land areas.
Agriculture: This layer includes both lands with agriculture activities and those with natural
vegetation. This was located at the western side of the study area closed to Menya Governorate.
The area of the reclaimed desert lands following Agricultural company of Upper Egypt reaches
33000 feddans, irrigated by three elevating station in Tarfa, Kamadeer and Sakoula. However,
the actual cultivated area reaches 70000 feddans; therefore, there exists disputes regarding taking
over irrigation water shares in the region.
Shrubs and Brush land, It includes desert shrubs and grasses growing in some plains and wadis,
where they support Bedouin in grazing their domesticated animals (Camel). Also this class
includes brush land sparsely scattered at the south, and mostly following the outlets of the main
wadis.
Barren Land: This class represents land which has a limited ability to support life, with a
surface predominantly formed of rocks, sands and gravels. According to its topography and
relief, (Fig. 9).
Plain Land, It includes the beaches covered by sans, gravels and shell fragments, almost barren
of any vegetation. Also the wadi deposits, alluvial fans and deluvial deposits along their margins,
made up of rock fragments and gravels eroded from the adjacent mountains. Any that may
present in this type of land, is very scrubby and widely-spaced (Figure 11).

27
Figure 10: Detected cultivated areas from satellite Images after the results of field check in the study area
Figure 11: Detected development activities from satellite Images after the results of field check in the study area

28
Figure 12: Detected development activities from satellite Images after the results of field check in the study area

29
Figure 13: Observation and field check for the urban results of Image classifications
30
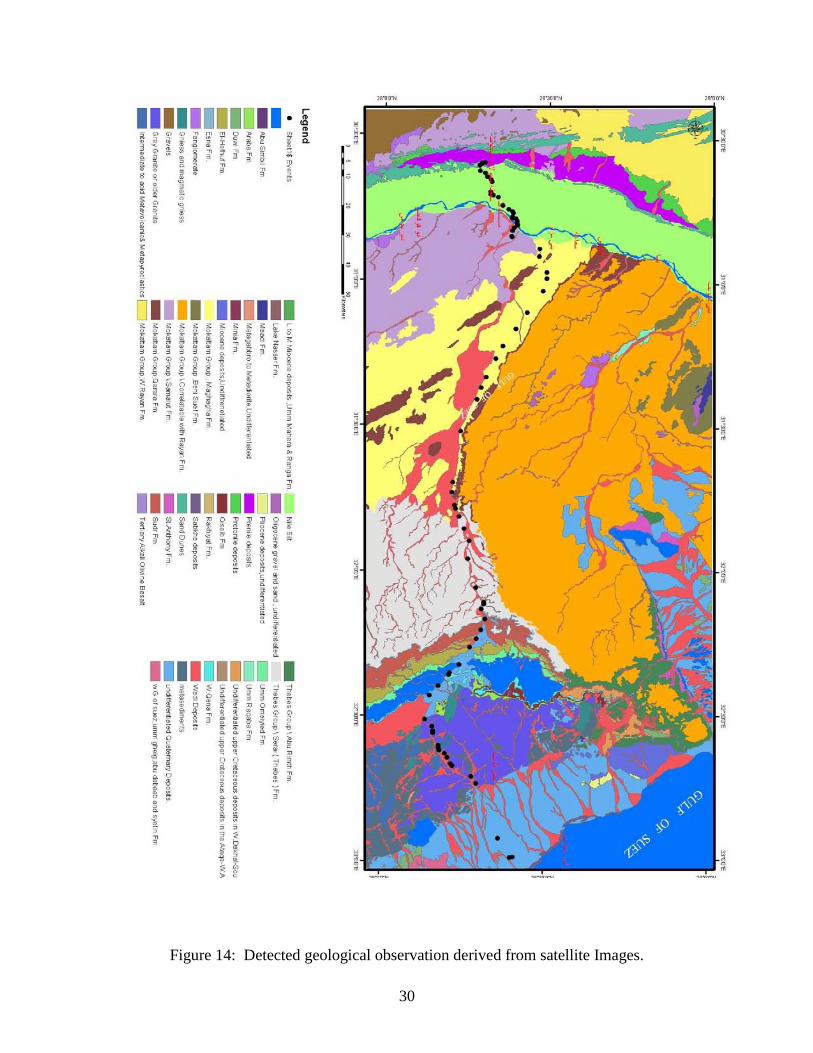
Figure 14: Detected geological observation derived from satellite Images.

31
Figure 15: Detected Images observation and field check derived from Images year 1984 and 2000
This GIS layers indicated in (Figs 13) comprises urban areas of intensive land-use where much
of the coastal and river land is covered by buildings, structures and streets. With the expanding
urban development in study area from year 1984 to year 2000, several other activities have been
constructed particularly at the fringes of urban land along Sheikh Fadl desert road. Mineral and
industrial activities are recorded in the study area, as well energy power station (Transmission
line) are installed in the area and considered the only source of the electricity in the area.
Urban Activities

32
Accordingly, it was subdivided into main classes, (Figure 10&11); the agriculture started from
the desert land and confined to the drainage system (run-off desert). The river Nile surrounding
areas are heavily vegetated area. It shows a mosaic pattern and distinct seasonal aspects mainly
due to the preponderant growth of the bryophytes’ during the late winter and early spring. This
aspect of seasonal phenology is not seen in the salt marsh ecosystem.
For example, Samallout’s population is 562.1 thousand according to 2005 estimation. The
amount of garbage produced daily this year has been estimated by about (562 tons/day). As a
result, the amount of garbage resulted from this markaz in 2005 reached about (205.2 thousand
tons). Samallout’s population is expected to reach 807 thousand person by 2022. Accordingly,
this indicated the development of electrical projects is a must.
Mountainous Land
The desert chain of mountains included within the west area of the Nile river, between Gulf
water in the east and Nile river in the west (300 km), is made up of the predominantly limestone
plateau blocks of Ataqa, Kahaliya, Akheider, the Galala El-Bahariya, the Galala El-Qibliya and
the chain of basement complex bounded on the north by Gebel Gharib and on the southern
border by the mass of Gebel Abu Dukhan, Gebel Qattar and Gebel Shayeb El-Banat, (Figure 15).
: this includes the rock exposures bounding the south desert of the Ras
Shkair area, Gulf of Suez from the west, and it is readily mapped on the satellite images.
The Gebel Shayeb EI-Banat group constitutes four mountains, namely, from north (Lat. 27°20'N)
to south (Lat. 26°5'N): Gebel Abu Dukhan (1705 m), Gebel Qattar (1963 m), Gebel Shayeb El-
Banat (2187 m) and Gebel Umm Anab (1782 m). Gebel Shayeb El-Banat is the highest peak
within the Red Sea coastal mountains. These are the igneous blocks that form a range extending
some 40-50 km to the west of Hurghada. The Gebel Shayeb group thus forms hills facing the
southern part of the Gulf of Suez and the northeast part of the Red Sea.
Menya governorate enjoys special monumental sites holding and featuring the Egyptian pharonic
history (old state – middle state – modern state) then the greek age, roman age, Christian and
Islamic age.

33
Figure 16: Gebel Shayeb El-Banat, west Ras Shokair city Eastern desert.

34
Change Detection in Land Use/Land Cover between 1984-2000
During the current study two images were selected to perform this analysis belonging to the
years 1984 and 2000, collecting of these two dates is due to the greening coverage on the surface
of study area have to be detected at same time. The data obtained from the two images were
subjected to analysis including spatial vegetation patterns and assessment of soil dynamics.
Furthermore, this biophysical parameter is a key remote sensing observation related to several
important biospheric properties including the proportion of photo synthetically absorbed
radiation and leaf area index were also used
Figure 17: Change detected in the geomorphological feature in Eastern desert.

35
Results of image processing in different dates 1984 and 2000 allow identifying the natural
environmental condition and forces affecting the study area and detected the major changes for
ecological components. The major distinct land use changes occurring in the study area due to
the extension of urban, oil activities and protectorates which develops along the western side of
Gulf of Suez.
The present status of land use-land cover in the districts of the Study area evaluated by digital
analysis of satellite data indicates that majority of areas in these districts are used for
development purpose.
Considering the change detections, there are many classes changes such as urban activities, oil
exploration, Sabkha area which indicated the sea water – land penetration. This is clear in the salt
soil covered the Sabkha area and colored vegetation cover. Development of anthropogenic input
reflected the constructed roads, which occurred mostly for the urban and transporting fringe of
Study areacity. These changes mostly are related to changes due to natural and resources found
on barren and wet land in the desert plain, which are recognized as an environmental impact.
Main future activities planned for the study area are related to the nature of the desert study area
and its natural resources, i.e. Ras Shukeir protectorate. The proposed Transmission line
development project are also consistent with nature of the study area and ecological status
sustainability, (Figure 17, 18).

36
Figure 18: Change detected in plants coverage in study area.
Natural Hazards Assessment
This preliminary assessment was critical to identify sources of the potential hazards on the
proposed project installations, from one side, and the impact of these installations on the
surrounding environment such as the Transmission line systems and the ecosystems, from the
other side.
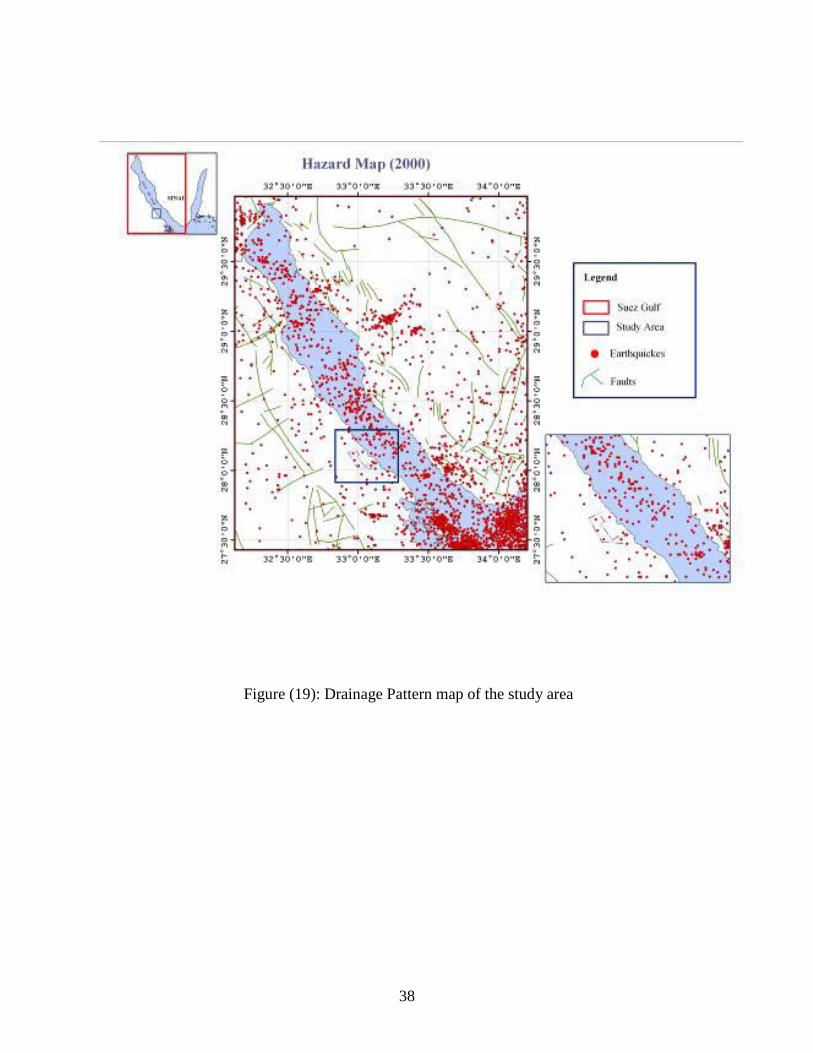
Several studies were published in the last few years on the earthquakes of StudyArea. Badawy et
al. (2008) studied the seismicity of this region and recorded a total of 2113 micro-earthquake
events from 2001 to 2005 (Figure 19). Hosny et al. (2008) also noticed that in spite of the fact
that the area exhibits a high level of seismic activity, it did not record large seismic shocks. The
focal depths of some for the recorded earthquakes have been determined. The focal depths range
from less than 4 km to more than 13 km. the origin for seismic activity in Study area region have

37
been attributed to the interaction between both the tectonic and magmatic activities (Giampiccolo
et al. 2004).
Studying this area illustrates that the lime Eocene rocks covering Menya was affected by a
number of normal cracks in the Oligocene / Miocene age, that takes a shop of a land fall downs
parallel to the Red Sea. Folds are rarely found east of Menya, so the general shape formations in
this area takes the main formational shapes of cast Africa Environmental profile of Menya 44
parallel to the Red Sea. As a result, most valleys of draining water take the same direction. East
Artifice region is related to the movements and folds of the base rocks in the old ages; therefore,
the eastern part of the Nile was affected by the elevation movement that took place in the fourth
Era and took the North West direction, that is the direction of the Red Sea.
Earthquakes activity in Menya In light of the available data and what was reported in the
regional planning of the governorate, Menya falls within a region of weak earthquake activity
with limited effect. In addition, areas of earthquake activity lies to the west and North West the
governorate, for enough from the expected inhabitant expansions areas (Figure 19).
The Eastern side of the study area along the coastal zone of the Gulf of Suez is located in active
seismic zone. This will not affected the proposed project construction as well no effect from
suggested development project on the accelerating the seismic waves. The two strongest
earthquakes recorded in the last 50 years were of magnitude 6.0 and 5.2 on Richter scale (Figure
18). They are classified as moderate earthquakes. They were recorded in November 12, 1955,
and July 2, 1984 respectively. Prior to 1955, no events have been reported in this area in the ISC
catalogue (Haggag et al. 2008).
38
Figure (19): Drainage Pattern map of the study area

39
Figure 20. The major drainage pattern of the Eastern Desert; and study area (modified after El Shazly et al. 1980).
.

40
Conclusions
The study area is including three different ecosystems which have different habitates and land
uses. Using satellite images and geographic information systems were very necessary for
achieving such this studiy. The interaction between man-made interventions and proposed
project along the routeline of the study area is not found.
No mpact on the the study area is detected during the analyses of the study results. Such this
kind of environmental friendly project entitled "Samalout/Gulf of Suez 500kv Transmission
Line" has not recorded any negative impact on the natural resources and development activities
to the selected study area and nabour governorates. Land use / Land cover components detected
in this study maps indicated that no effect can be occure over short term and long term to the
study area ecosystems, particulary the proposed electrical route line cooridinates. A mitigation
measures to minimize the impact of these important activities on the environment during the
implementation phase is required.
It is anticipated that site operation the storage area of waste rocks and the tailing storage areas
would have a minor impact on the natural ecosystem in the study area. No changes detected to
the geoenvironmental features of the study area from the analyses of satellite images during the
period 1984 to 2000. This reflects the stability of the environmental conditions and human
intervensions to the proposed project site.

41
References Abdel-Maksoud MMH (1997) The accounting measurement of removal costs of marine
pollution by petroleum resulting from ships under Arm’s Length Standard. M. Sc. Thesis,
Faculty of Commerce, Suez Canal university.
Anderson , J. R. ; Hardy, E. T. ; Roach, J. T. and Witmer, R. E. (1976): A Land-Use And Land-
Cover Classification System for Use with Remote Sensor Data . U. S. Geological Survey
Professional Paper 964
Awad H (1988) Potential and causes of accidental oil spills in the Red Sea and Gulf of Aden
(1974-1986). Bull. Inst. Oceangr. And Fish., ARE 14(1): 293-296.
Awad H, Michel P & El-Shazly A (1983) Actual situation of oil pollution in the ecosystem along
the Egyptian Red Sea coast. Bull. Inst. Oceangr. and Fish. ARE 9: 102- 108.
Badawy, A., El-Hady, Sh. and Abdel-Fattah, A. K. 2008: Microearthquakes and neotectonics of
Ras Shukeir , Eastern Desert of Egypt. Seismological Research Letters 79 (1): 55-67.
Bender ME, Hagris WJ, Hugget RJ & Roberts Jr (1988) Effect of polynuclear aromatic
hydrocarbons on fishes and shellfish, an overview of research in Virginia. Mar. Envir.
Res. 24: 237 – 241.
Blumer M, Sanders HL, Grassle FJ & Hampson GR (1971) A small oil spill. Environment, St.
Louis, Mo. 13: 1-18.
Capuzzo, JM (1987) Biological effects of petroleum hydrocarbons. Assessments from
experimental results. In: Long-term environmental effects of offshore oil and gas
development. (White HH, Ed.). Elsevier Applied Science, London. pp: 343 – 410.
Christensen, E., J. Jensen, E. Ramsey, & H. Jr. Mackey, 1988. Aircraft MSS data registration and
vegetation classification for wetland change detection. International Journal of Remote
Sensing, 9: 23-38.
Coccheri RW, Antonio A & Anna MM (1990) Polycyclic aromatic hydrocarbons in marine
organisms from Italian central Mediterranean coasts. Mar. Poll. Bull. 22(1): 15 – 18.
Cohen Y (1973) Effects of crude oil on the Red Sea alcyonarian Heteroxenia fuscescens. MSc
Thesis. The Hebrew University of Jerusalem. 49pp.
Dicks B (1984) Oil pollution in the Red Sea – Environment monitoring of an oil field on a coral
area, Gulf of Suez. Proc. of Mabahiss / John Morray Syposium: Marine science of the
North-West Indian Ocean and adjacent waters. Sept. 1983 Alexandria, Egypt, UAR.

42
El-Shazly, M. M., Misak, R., Hammad, F., Tamer, M. A., El-Ghazawi, M., Hassanein, A.,
Aggour, T., Adeib, N., Mohamad, S. S., Khalid, M. A., Youssef, A., Ezz El-Din, H.,
Galal, G. H., Atwa, S. M., Abdel Baki, A. A., Sallouma, M. K. and Gindi, Kh., 1992:
Ground water investigation in the Eastern Desert (Volume II: Ground water Supplies
in Selected Mining and Petroleum Districts, C- Qusseir – Mersa Himeira). Minerals,
Petroleum & Groundwater Assessment Program (MPGAP), Aid Project 263-0105,
Ministry of Agriculture and Land Reclamation, Desert Research Center: 1-255.
ERDAS, 1999. Earth Resources Data Analysis System, ERDAS Field Guide, (4th Edition),
ERDAS Inc., Allanta.
Fikry I. Khalaf, Ali A-F. Gab-Alla and Ashraf I. Ahmed
(2002). Ecological study of the impact
of oil pollution on the fringing reef of Ras Shukeir, Gulf of Suez, Red Sea, Egypt,
Egyptian Journal of Biology, Volume 4, 2002, pp. 119-126
Giampiccolo, E., Gresta, S., Rascona, F. 2004: Intrinsic and scattering attenuation from
observed seismic codas in southeastern Sicily (Italy). Phys. Earth Planet. Inter. 145: 55-
66.
Haggag, H. M., Gaber, H. H. , Sayed, A. D. and Ezzat, M. E-A. 2008: A review of the Recent
seismic activity in the southern part of Egypt (Upper Egypt). Acta Geodyn. Geomater.
5(1,149): 19-29.
Hanna RM (1983) Oil pollution on the Egyptian Red Sea coast. Mar. Pollut. Bull. 14: 268-271.
Heinrichsen D (1990) Our common seas. Coasts in crises. Earthscan publications, London, U.K.,
184pp.
Hodgson G (1999) A global assessment of human effects on coral reefs. Mar. Pollut. Bull. 38(5):
345 – 355.
Hosny, A., M. Guidarelli, M. and Panza, G. F. 2008: Source Moment Tensors of the earthquake
Swarm in Abu-Dabbab area, Marsa-Alam, South-East Egypt. Geophysical Research
Abstract 10.
Kassas, M. (1956). The mist oasis of Erkwit, Sudan. J. Ecol., 44, 180–194.
Kassas, M. (1957). On the ecology of the Red Sea coastal land. J. Ecol., 45, 187–203.
Kassas, M. (1960). Certain aspects of landform effects on plant-water resources. Bull. Soc.
Geogr. Egypte, 33, 45–52.
Kassas, M. and Zahran, M.A. (1962). Studies on the ecology of the Red Sea coastal land, I. The
district of Gebel Ataqa and El-Galala El-Bahariya. Bull. Soc. Geogr. Egypte, 35, 129–175.

43
Kassas, M. and Zahran, M.A. (1965). Studies on the ecology of the Red Sea coastal land, II. The
district from El-Galala El-Qibliya to Hurghada. Bull. Soc. Geogr. Egypte, 38, 155–193.
Kassas, M. and Zahran, M.A. (1967). On the ecology of the Red Sea littoral salt marsh, Egypt.
Ecol. Monogr., 37(4). 297–315.
Kassas, M. and Zahran, M.A. (1971). Plant life on the coastal mountains of the Red Sea, Egypt.
J. Ind. Bot. Soc. Golden Jubilee Volume, 50A, 571–589.
Kunhold WW (1969) Der Einfluss wasserloslicher bestandteile von Roholen und
Roholfraktionen auf die entwicklung von heringsbrut. Ber. Dt. Wiss. Kommn
meeresforsch. 20: 165-171.
Lillesand, T., J. Chipman, D. Nagel, H. Reese, M. Bobo, & R. Goldman, 1998. Upper Midwest
gap analysis program image processing protocol. Report for U.S. Geological Survey
Environment. Management Techical Centre, Onalaska, WI, EMTC 98-G001: 25.
Milne, A., 1988. Change detection analysis using landsat imagery: A review of methodology.
Proceedings of IGARSS '88 Symposium, Edinburgh, Scotland, Sept. 23-16 1988: 541-
544.
Mironov OG (1968) Hydrocarbon pollution of the sea and its influence on marine organisms.
Helgol. Wiss. Meeres. 17: 335 – 339.
Mironov OG (1972) The effect of oil pollution on the flora and fauna of the Black Sea. In:
Marine pollution and sea life. (Ruivo M, Ed.). London: Fishing News (Books) Ltd. 624pp.
Mostafa YM (1995) Studies on the hydrocarbon pollutants in the marine environment of the Red
Sea Gulfs and Suez Canal. PhD Thesis, Faculty of Science, Ain Shams University.
Mourcy A (1978) A field study of oil pollution of the Egyptian coast of the Red Sea. National
Research Center, Cairo, Egypt.
Olmanson, L.G., S.M. Kloiber, M.E. Bauer, P.L. Brezonik, 2001. Image processing protocol for
regional assessment of lake water quality. Water Resources Center Technical Report 14,
University of Minnesota, St. Paul.
Zahran, M.A. (1962). Studies on the Ecology of the Red Sea Coastal Land. MSc Thesis, Fac.
Sci.,University of Cairo.
Zahran, M.A. (1964). Contributions to the Study on the Ecology of the Red Sea Coast. PhD
Thesis, Fac. Sci., University of Cairo.
Zahran, M.A. (1965). Distribution of mangrove vegetation in Egypt. Bull. Inst Desert
Egypte,15(2), 7–12.

44
Zahran, M.A. (1977). Africa. A. Wet formations of the African Red Sea coast. In Wet
CoastalEcosystems (ed. V.J. Chapman). Elsevier, Amsterdam, pp. 215–231.
Zahran, M.A. (1982b). Vegetation Types of Saudi Arabia. Publ. King Abdul Aziz Univ., Jeddah,
Saudi Arabia, 61pp.
Zahran, M.A. (2004). The Natural Vegetation: A Renewable Resource for the Sustainable
Development of the Deserts of the Arab World: (in Arabic). Zaied International Prize for
Environment, Dubai, U.A.E, 496pp.
Zahran, M.A. and Mashaly, I.A. (1991). Ecological notes on the fl ora of the Red Sea coastal
land of Egypt. Bull. Fac. Sci. Mansoura Univ., 18(2), 251–292.