annex “a” - bpi express online
TRANSCRIPT


PART I.
INFORMATION REQUIRED IN INFORMATION STATEMENT A. GENERAL INFORMATION Item 1. Date, time and place of meeting of security holders. (a) Date : April 14, 2011 Time : 9:00 a.m. Place : Hotel Inter-Continental Manila, Ayala Center, Makati City
Registrants’ Mailing Address: BPI Building, Ayala Avenue corner Paseo de Roxas, Makati City
(b) Approximate date on which the information statement is first to be sent or given to security holders. March 18, 2011
WE ARE NOT ASKING FOR A PROXY AND
YOU ARE REQUESTED NOT TO SEND US A PROXY
Item 2. Dissenters' Right of Appraisal There are no matters or proposed corporate actions included in the agenda of the
meeting which may give rise to a possible exercise by security holders of their appraisal rights. Generally, however, in the specific instances mentioned by the Corporation Code of the Philippines, the stockholders of the corporation have the right of appraisal provided that the procedures and the requirements of Title X of the Corporation Code governing the exercise of the right are complied with and/or followed.
Item 3. Interest of Certain Persons in or Opposition to Matters to be Acted Upon (a) No current director or officer of the Bank, or nominee for election as directors
has any substantial interest, direct or indirect, by security holdings or otherwise, in any matter to be acted upon other than election to office.
(b) No director has informed the Bank that he intends to oppose any action to be
taken up at the meeting. B. CONTROL AND COMPENSATION INFORMATION
Item 4. Voting Securities and Principal Holders Thereof
(a) Class of Voting Securities: Common Shares Number of Shares Outstanding as of 31 January 2011: 3,556,356,173 Number of Votes Entitled: One (1) vote per share
Per Bank’s By-Laws, one share entitles the holder thereof to one vote, except in
election of the members of the Board of Directors (“Board”) where any stockholder may cumulate his vote as provided for in the Corporation Code.
(b) Record Date: Stockholders of record as of March 15, 2011 are entitled to
notice and to vote at the annual stockholders’ meeting
2

(c) Manner of Voting Article IV of the Amended By-Laws of the Bank provides that the stockholders
may delegate in writing their right to vote and must be attested by two (2) witnesses and filed with the Bank at least ten (10) days before the meeting. Voting shall be by shares and not per capita.
In addition, paragraph 6 of Article IV of said By-Laws states that the voting for the
election of members of the Board and upon all questions before the stockholders’ meeting, shall be by shares of stock, that is, one share entitles the holder thereof to one vote, two shares to two votes, etc.; but in the election of members of the Board any stockholder may cumulate his vote as provided for in the Corporation Code. In the election of Directors, cumulative voting is allowed provided that the total votes cast by a stockholder shall not exceed the number of shares registered in his name in the books of the Corporation as of the record date multiplied by the whole number of Directors to be elected. If the number of nominees does not exceed the number of Directors to be elected, the Secretary of the meeting upon motion made will be instructed to cast the votes represented at the meeting in favor of the nominees. However, if the number of nominees exceeds the number of Directors to be elected, voting shall be done by secret ballot.
(d) Security Ownership of Certain Record and Beneficial Owners and Management
i. Security ownership of certain record and beneficial owners of more than 5% as of January 31, 2011
Title of
Class
Name/Address of Record Owner & Relationship w/
Issuer
Name of Beneficial Owner &
Relationship w/ Record Owner
Citizenship
No. of Shares
Percentage of Holdings
Common
PCD Nominee Corp. (Non-Filipino) - Standard Chartered Bank Stockholder PCD Nominee Corp. (Filipino) G/F MKSE Building 6767 Ayala Ave., Makati City Stockholder
Various Stockholders Client
-DBS Bank, Ltd. Custodian holds 8.6965% or 309,278,747 shares Various Stockholders Client
Various
Singaporean
Filipino
1,246,067,314
202,757,100 1,448,824,414
35.0378%
5.7013% 40.7391%
Common Ayala Corporation Tower I, Ayala Triangle Ayala Avenue, Makati City Stockholder
Ayala Corporation Filipino 775,700,589 21.8117%
Common
Ayala DBS Holdings, Inc. 33rd Floor Ayala Tower One and Exchange Plaza, Ayala Triangle, Ayala Avenue Makati City Stockholder
Ayala DBS Holdings, Inc.
Filipino 757,831,372 21.3092%
Common Roman Catholic Archbishop of Manila 121 Arzobispo street Intramuros, Manila Stockholder
Roman Catholic Archbishop of Manila
Filipino 301,063,606 8.4655%
3

PCD Nominee Corporation (PCD) now known as Philippine Depository and Trust Corporation (PDTC) - Non-Filipino & Filipino, holds 40.7391% interest. PDTC is the registered owner of the shares beneficially owned by participants in the PDTC. The Board of Directors of each participant particularly DBS Bank Ltd. has the power to decide on how the shares are to be voted.
Ayala Corporation holds 21.8117% interest. Mermac, Inc. and the Mitsubishi
Group own 52.11% and 10.89%, respectively (or a total of 63.00%) of the outstanding shares of Ayala Corporation. The Board of Directors of Ayala Corporation has the power to decide on how Ayala Corporation shares in BPI are to be voted.
The Ayala DBS Holdings, Inc. (Ayala DBS) holds 21.3092% interest. Ayala
Corporation owns 60% of the outstanding shares of Ayala DBS. The Board of Directors of Ayala DBS has the power to decide on how Ayala DBS shares in BPI are to be voted.
The Roman Catholic Archbishop of Manila Group (RCAM) holds 8.4655%
interest. The Archbishop of Manila has the power to decide on how RCAM shares in BPI are to be voted.
ii. Security Ownership of Directors and Management as of 31 January 2011
Title of Class Name of Beneficial Owner Position No. of
Shares
Nature of Ownership
(R/B) Citizenship % of
Holdings
Common Jaime Augusto Zobel de Ayala II Chairman 285 R/B Filipino 0.0000%
Common Aurelio R. Montinola III Director & President 1,416,148
R/B
Filipino
0.0398% Common Gerardo C. Ablaza, Jr. Director 193 R/B Filipino 0.0000% Common Romeo L. Bernardo Director 12 R/B Filipino 0.0000% Common Chng Sok Hui Director 19 R/B Singaporean 0.0000% Common Cezar P. Consing Director 355 R/B Filipino 0.0000% Common Octavio V. Espiritu Director 1,062,453 R/B Filipino 0.0299% Common Rebecca G. Fernando Director 18 R/B Filipino 0.0000% Common Khoo Teng Cheong Director 19 R/B Singaporean 0.0000% Common Xavier P. Loinaz Director 3,123,465 R/B Filipino 0.0878% Common Ma Yuen Lin Annie Director 19 R/B British 0.0000% Common Mercedita S. Nolledo Director 11,275 R/B Filipino 0.0003% Common Artemio V. Panganiban Director 10 R/B Filipino 0.0000% Common Oscar S. Reyes Director 1,076 R/B Filipino 0.0000% Common Fernando Zobel de Ayala Director 120 R/B Filipino 0.0000% Common Gil A. Buenaventura SEVP & COO 241,710 R/B Filipino 0.0068% Common Antonio V. Paner EVP & Treasurer 96,890 R/B Filipino 0.0027% Common Alfonso L. Salcedo, Jr. Executive VP 34,973 R/B Filipino 0.0010% Common Teresita B. Tan Executive VP 339,919 R/B Filipino 0.0096% Common Natividad N. Alejo Senior VP 12,496 R/B Filipino 0.0004% Common Cesario A. De Leon III Senior VP 198,340 R/B Filipino 0.0056% Common Georgina O. Espaldon Senior VP 1 R/B Filipino 0.0000% Common Elvira V. Mayo Senior VP 416,649 R/B Filipino 0.0117% Common Ma. Ysabel P. Sylianteng Senior VP 1,342,674 R/B Filipino 0.0378% Aggregate Shareholdings of Directors & Officers as a Group 8,299,119 0.2334%
None of the members of the Bank’s Board of Directors and management owns 2.0%
or more of the outstanding capital stock of the Bank. iii. Voting Trust Holders of 5% or More
The Bank knows of no one holding more than 5% of common shares under a
voting trust or similar agreement.
iv. Changes in Control
No change of control in the Bank has occurred since the beginning of its last fiscal year.
4

(e) Certain Relationships and Related Transactions
Included in the Parent Bank’s financial statements are various transactions of BPI with its domestic and foreign subsidiaries and affiliates and with its directors, officers, stockholders and related interest (DOSRI). These transactions usually arise from normal banking activities such as deposit arrangements, trading of government securities and commercial papers, sale of assets, lending/borrowing of funds, lease of bank premises, investment advisory/management, service arrangements and advances for operating expenses. Related Party transactions which are not included in the consolidation process are considered immaterial. In the ordinary course of business, the Bank has entered into various transactions with its DOSRI including loan transactions. As of December 31, 2010 and in previous years, the Bank and all its subsidiaries are in full compliance with the General Banking Act and the Bangko Sentral ng Pilipinas Circulars and regulations on DOSRI loans and transactions.
Item 5. Directors and Executive Officers
(a) The Board of Directors/Nominees for election at the Annual Stockholders’ Meeting
Per Article V of the Amended By-Laws of the Bank, all nominations to the Board for election at the annual stockholders’ meeting shall be submitted in writing to the Board through the Corporate Secretary, together with the written acceptance of the nominee, not later than the date prescribed by law, rules and regulations or at such earlier or later date as the Board may fix. No nominee shall qualify to be elected as Director unless this requirement is complied with. In accordance with the resolution of the Board on 15 December 2010, which resolution was reported to the PSE and SEC, the last day for submission of nomination for the term 2011-2012 was set on 26 January 2011. As of said date, there were only 15 nominees received by the Corporate Secretary and all the nominees confirmed their acceptance of said nomination. The nominations were subsequently processed and evaluated by the Nomination Committee of the Bank in a meeting called for that purpose. It was determined by the Committee that all the nominees (both regular directors and independent directors) possess all the qualifications required by law, rules, regulations and BPI’s By-Laws and Manual on Corporate Governance and no provision on disqualification would apply to any of them. The Nomination Committee is composed of Mr. Jaime Augusto Zobel de Ayala II as Chairman and Messrs. Xavier P. Loinaz, Romeo L. Bernardo and Ms. Chng Sok Hui as members. The following are the list of current directors and the final list of candidates eligible for election/re-election as members of the Board of Directors of BPI for the term 2011-2012 as approved by the Nomination Committee. i. Current Board of Directors (as of January 31, 2011)
Name
Age (as of last birthday)
Citizenship
1. Jaime Augusto Zobel de Ayala II 51 Filipino 2. Aurelio R. Montinola III 59 Filipino 3. Fernando Zobel de Ayala 50 Filipino 4. Gerardo C. Ablaza, Jr. 57 Filipino 5. Romeo L. Bernardo (Independent Director) 56 Filipino 6. Chng Sok Hui 50 Singaporean 7. Cezar P. Consing (Independent Director) 51 Filipino 8. Octavio V. Espiritu (Independent Director) 67 Filipino
5

9. Rebecca G. Fernando 62 Filipino 10. Khoo Teng Cheong 46 Singaporean 11. Xavier P. Loinaz (Independent Director) 67 Filipino 12. Ma Yuen Lin Annie 44 British 13. Mercedita S. Nolledo 69 Filipino 14. Artemio V. Panganiban (Independent Director) 74 Filipino 15. Oscar S. Reyes 64 Filipino
ii. Final list of candidates eligible for election/re-election as members of the Board
Name
Age (as of last birthday)
Citizenship
1. Jaime Augusto Zobel de Ayala II 51 Filipino 2. Aurelio R. Montinola III 59 Filipino 3. Fernando Zobel de Ayala 50 Filipino 4. Gerardo C. Ablaza, Jr. 57 Filipino 5. Romeo L. Bernardo (Independent Director) 56 Filipino 6. Chng Sok Hui 50 Singaporean 7. Cezar P. Consing (Independent Director) 51 Filipino 8. Octavio V. Espiritu (Independent Director) 67 Filipino 9. Rebecca G. Fernando 62 Filipino 10. Khoo Teng Cheong 46 Singaporean 11. Xavier P. Loinaz (Independent Director) 67 Filipino 12. Ma Yuen Lin Annie 44 British 13. Mercedita S. Nolledo 69 Filipino 14. Artemio V. Panganiban (Independent Director) 74 Filipino 15. Oscar S. Reyes 64 Filipino
Of the above-named nominees, five (5) were nominated and are eligible as Independent Directors. They are: Messrs. Romeo L. Bernardo, Octavio V. Espiritu, Xavier P. Loinaz, Cezar P. Consing and Artemio V. Panganiban. These candidates were nominated by Atty. Primer B. Leonen, a long-time stockholder of the Bank. None of the aforementioned nominees has any business or personal relations with Atty. Leonen. The Bank always undertakes to abide by the SRC Rule 38 and compliance therewith has always been observed.
No one among the above-named nominees has declined to stand for election or re-election to the Board of Directors in the forthcoming stockholder’s meeting and all of them have confirmed their acceptance of the said nomination.
THE EXECUTIVE OFFICERS (As of February 16, 2011) Name Rank/Title Age Citizenshi
p 1. Aurelio R. Montinola III President & CEO 59 Filipino
2. Gil A. Buenaventura Sr. Executive Vice Pres. & Chief Operating Officer
58 Filipino
3. Antonio V. Paner EVP and Treasurer 52 Filipino 4. Alfonso L. Salcedo, Jr. Executive Vice-President 55 Filipino 5. Ma. Ysabel P. Sylianteng Executive Vice-President 59 Filipino 6. Teresita B. Tan Executive Vice-President 59 Filipino 7. Natividad N. Alejo Senior Vice-President 54 Filipino 8. Cesario A. de Leon III Senior Vice President 59 Filipino 9. Georgina O. Espaldon Senior Vice-President 59 Filipino 10. Elvira V. Mayo Senior Vice-President 59 Filipino
Please refer to attached Annex “A” for the brief background of the
Directors/Nominees and Executive Officers. Per Article V of the By-Laws of the Bank, the term of office of a director is one (1) year or until his successor is duly elected and qualified.
6

(b) Significant Employees
The Bank values its human resources and considers its entire workforce as significant employees. It expects each employee to do his share in achieving the Bank’s set goals and objectives.
(c) Family Relationships The Chairman of the Board of BPI, Mr. Jaime Augusto Zobel de Ayala II and Mr.
Fernando Zobel de Ayala, a member of the Board, are brothers. (d) Legal Proceedings
To the knowledge and/or information of the Bank, the nominees for election as Directors and its Executive Officers are not presently or in the last five (5) years included in any material legal proceeding involving themselves and/or their property before any court of law or administrative body in the Philippines or elsewhere nor said persons have been convicted by final judgement of any offense punishable by laws of the Philippines or laws of any other nation.
(e) Resignation of Directors Mr. Wong Ann Chai, a member of the Board of Directors, voluntarily resigned on 1 May 2010, not due to any disagreement with the Bank relative to its operations, policies or practices. He was replaced by Mr. Khoo Teng Cheong.
Item 6. Compensation of Directors and Executive Officers
2009
Position Salary Bonuses Other
Salary
Aurelio R. Montinola III President & CEO
Gil A. Buenaventura Senior EVP & COO
Antonio V. Paner EVP & Treasurer Natividad N. Alejo SVP Georgina O. Espaldon SVP Cesario A. de Leon III SVP Elvira V. Mayo SVP Ma. Corazon S. Remo SVP Ma. Ysabel P. Sylianteng SVP Teresita B. Tan SVP All above-named Officers as a group
154,259,876.57
26,684,230.00
All other unnamed Officers as a group
2,672,660,006.26
208,837,160.00
N.A.
All Directors 18,000,000.00
2010
Position Salary Bonuses Other
Salary
Aurelio R. Montinola III President & CEO
Gil A. Buenaventura Senior EVP & COO
Antonio V. Paner EVP & Treasurer Alfonso L. Salcedo, Jr. Executive VP
7

Teresita B. Tan Executive VP Natividad N. Alejo SVP Georgina O. Espaldon SVP Cesario A. de Leon III SVP Elvira V. Mayo SVP Ma. Ysabel P. Sylianteng SVP All above-named Officers as a group
169,513,462.59
34,995,000.00
All other unnamed Officers as a group
2,797,795,283.78
295,728,865.00
N.A.
All Directors 18,000,000.00
2011 Estimate
Position Salary Bonuses Other
Salary
Aurelio R. Montinola III President & CEO
Gil A. Buenaventura Senior EVP & COO
Antonio V. Paner EVP & Treasurer Alfonso L. Salcedo, Jr. Executive VP Ma. Ysabel P. Sylianteng Executive VP Teresita B. Tan Executive VP Natividad N. Alejo SVP Georgina O. Espaldon SVP Cesario A. de Leon III SVP Elvira V. Mayo SVP All above-named Officers as a group
180,531,837.66
37,269,675.00
All other unnamed Officers as a group
2,979,651,977.23
314,951,241.23
N.A.
All Directors 28,500,000.00 Bonus or Profit Sharing At the 2010 annual stockholders’ meeting of the Bank, the stockholders approved the
grant of P1,200,000.00 bonus to each member of the Board for the services rendered by them to the Bank for the year 2009. Said bonus was pro-rated with respect to Directors who served for less than one (1) year. For this year’s stockholders meeting, the Board of Directors will determine prior to the stockholders meeting its proposal for Directors Bonus for the year 2010 to be submitted to the stockholders for approval.
The Directors’ Bonus to be proposed to the stockholders at the annual meeting on
April 14, 2011 is different from last year Directors’ Bonus taken up and approved during the 2010 stockholders’ meeting. What was approved in 2010 was for services rendered by the Directors for the year 2009. Historically, for the last ten years, the Bank has been paying Directors’ Bonus equivalent to an average of 0.26% of the net income of the Bank. Said Bonus is always pro-rated with respect to Directors who have served for less than one year.
Standard Arrangement
Other than the usual per diem arrangement for Board and Board Committee meetings attended and the abovementioned Directors’ Bonus, there is no other arrangement with regards to compensation of Directors, directly or indirectly for any services provided by them as Directors, including any additional amounts payable to committee participation or special assignments, for the last completed fiscal year.
8

Item 7. Independent Public Accountants
(a) The external auditor of the Bank is the accounting firm of Isla Lipana & Co. (formerly known as Joaquin Cunanan & Co.)
(b) The same accounting firm is being recommended for appointment as the Bank’s
external auditors for the year 2011 at the annual stockholders’ meeting of the Bank.
(c) Representatives of Isla Lipana & Co. are expected to be present at the annual
stockholders’ meeting. They will have the opportunity to make a statement if they desire to do so and they are expected to be available to respond to appropriate questions.
Pursuant to the General Requirements of SRC Rule 68, Par. 3 (Qualifications and Reports of Independent Auditors), the Bank has engaged Isla Lipana & Co., as the external auditor with Ms. Blesilda A. Pestaño as the Partner-in-Charge starting year 2009.]
The signing partner from Isla Lipana & Co. (external auditing firm) assigned to the
Bank is rotated every 5 years in accordance with Article 5.A (v) of SEC Memorandum Circular 6, Series of 2009 and SRC Rule 68.3b (iv). A partner can reassume the role of a signing partner for the Bank only after the 2-year period has elapsed (the “cooling off” period). Ms. Blesilda A. Pestaño, the partner signing the audit opinion on the Bank’s December 31, 2010 financial statements is on the second year of her fresh 5-year allowable term.
(d) Changes in and Disagreements with Accountants on Accounting and Financial Disclosure
The Bank has engaged the services of Isla Lipana & Co. during the two most recent fiscal years. There are no disagreements with accountants on accounting and financial disclosure.
(e) Audit and Audit-Related Fees BPI has paid the following fees to its external auditors in the past two (2) years:
Fiscal Year Audit Fees and Other-related Fees
Tax Fees
2008 paid in 2009 10,032,383.20 - 2009 paid in 2010 10,786,462.40 -
The above audit fees are inclusive of the following: (a) other assurance and related services by the external auditor that are reasonably related to the performance of the audit or review of the Bank’s financial statements and (b) all other fees.
The appointment or re-appointment of the Bank’s external auditor is subject to the approval by the Audit Committee and subsequent confirmation and approval by the Board of Directors and stockholders. The Audit Committee approved the scope of services to be rendered by the Bank’s external auditor, Isla Lipana & Co. (a member firm of PricewaterhouseCoopers) for the year 2011 in its meeting held on 15 December 2010. The Audit Committee is chaired by Mr. Xavier P. Loinaz with Mr. Khoo Teng Cheong, Mr. Octavio V. Espiritu, and Mr. Oscar S. Reyes as members.
9

Item 8. Compensation Plans As provided for in Article VII of the Amended Articles of Incorporation of BPI, not more than one and one half percent (1 ½%) of the Authorized Capital Stock of BPI is set aside for an Executive Stock Option Plan (ESOP) and another one and one half percent (1 ½ %) for Stock Purchase Plan (SPP) for employees and officers of BPI and its subsidiaries, over which shares the stockholders shall have no pre-emptive rights. Said provision was approved by the Bangko Sentral ng Pilipinas, Securities and Exchange Commission and the Stockholders. Stock Option granted in 2005 aggregated to 10,568,445 shares and well within the approved allocation provided for in the Articles of Incorporation, while for the year 2006, 2007, 2008, 2009 and 2010 there was no new stock option granted. The Bank has adjusted the number of shares and the exercise price of the option awarded to its executives in 2005 due to the stock dividends declared on 06 April 2006 and 03 April 2008, respectively.
C. ISSUANCE AND EXCHANGE OF SECURITIES
Item 9. Authorization or Issuance of Securities Other than for Exchange
There are no matters or actions to be taken up in the meeting with respect to the authorization or issuance of securities other than for exchange
Item 10. Modification or Exchange of Securities
There are no matters or actions to be taken up in the meeting with respect to the modification of any class of the Banks securities or the issuance of authorization for issuance of one class of the Bank’s securities in exchange for outstanding securities of another class.
Item 11. Financial and Other Information
The audited financial statements as of 31 December 2010, management’s discussion and analysis, market price of shares and dividends and other data related to the Company’s financial information are attached hereto as Annexes “B” and “C”.
Item 12. Mergers, Consolidations, Acquisitions and Similar Matters
There are no matters or actions to be taken up in the meeting with respect to mergers, consolidations, acquisitions and similar matters.
Item 13. Acquisition or Disposition of Property
There are no matters or actions to be taken up in the meeting with respect to material acquisition or disposition of any property by the Bank.
Item 14. Restatement of Accounts
There are no matters or actions to be taken up in the meeting with respect to restatement of accounts.
D. OTHER MATTERS Item 15. Action with Respect to Reports
(a) Approval of the minutes of the annual meeting of the stockholders on April 15, 2010 containing:
10

i) Annual report and approval of the Bank’s statement of condition
as of December 31, 2009 incorporated in the annual report. ii) Approval, confirmation and ratification of all acts and resolutions
during the past year of the Board of Directors, Executive Committee, all other Board and management committees and officers of BPI.
iii) Election of 15 members of the Board of Directors. iv) Election of external auditors and fixing their remuneration. v) Director’s bonus
(b) Approval of the annual report and the Bank’s statement of condition as of 31 December 2010 containing the performance of the Bank and its financial
condition.
Item 16. Matters Not Required to be Submitted All matters or actions that will require the vote of the security holders will be submitted in the meeting
Item 17. Amendment of Charter, By-Laws or Other Documents
Pursuant to Article XVII of the Bank’s amended By-Laws delegating to the Board of Directors the authority to amend, alter or repeal in whole or in part the By-Laws of the Bank, the Board was advised in its last meeting that certain amendments to the Bank’s By-Laws particularly in the second paragraph of Article IV, Article V, par. 5 of Article VII and second paragraph of Article VII-A will be submitted to the Board in its next meeting for approval. The amendments will bring about increased speed in communication as stockholders may access information from the Bank on the day of publication and will provide a lower ceiling on the compensation of directors than what is legally permissible. After approval, these amendments will be reported to the stockholders for information as provided for in the By-Laws of the Bank. These amendments are as follows:
Article IV
STOCKHOLDERS’ MEETING
Xxx
Stockholder’s meeting shall be called by written or printed notice, in paper, digital or compact disc form or electronic medium, delivered personally or electronically, or deposited in the post office, addressed to each stockholder at his last known place of residence or office or at his e-mail or electronic address as disclosed by the Registry Book of the Bank, at least fourteen (14) days prior to the date of the meeting. In addition, and within the same period of time, notice of the meeting shall be published in newspaper of general circulation in Greater Manila. In case of a special meeting, the notice shall include, in addition to the date, hour and place of assembly, a statement of the matters to be taken up therein.
The notice of any regular or special meeting of the stockholders shall be deemed to have been given at the time when delivered personally or deposited in the post office, postage prepaid, or sent electronically or by e-mail and addressed to each stockholders as herein provided.
The Bank may provide information or documents to a stockholder by e-mail or by posting the information or documents on the website of the Bank or another electronic network provided that a separate notice is given to the stockholder of
11

such posting. In case the Bank provides information or documents by electronic posting, the information or documents shall be deemed delivered or given upon the later of (i) the posting of the information or documents or (ii) the giving of a separate notice to the stockholder of such specific posting.
The Bank shall give notice and provide information or documents
electronically, as provided above, only to stockholders who have consented to receive notices, information or documents by e-mail or electronic transmission. A stockholder shall be deemed to have consented to receiving notices, information or documents electronically if he has provided an e-mail or electronic address to the Bank and he has not notified the Bank in writing that he requires notices, information or documents to be given to him in physical paper form or digital or compact disc form.
Xxx
ARTICLE V BOARD OF DIRECTORS
Xxx
Each director shall be entitled to receive from the Bank, pursuant to a resolution of the Board of Directors, fees and other compensation for his services as director. The Board of Directors shall have the sole authority to determine the amount, form and structure of the fees and other compensation of the directors. In no case shall the total yearly compensation of directors exceed one percent (1%) of the net income before income tax of the Bank during the preceding year.
The Personnel and Compensation Committee of the Board of Directors shall have the responsibility for recommending to the Board of Directors the fees and other compensation for directors. In discharging this duty, the Committee shall be guided by the objective of ensuing that compensation should fairly pay directors for work required in a company of the Bank’s size and scope. Xxx
ARTICLE VII
EXECUTIVE COMMITTEE Xxx For each attendance at any meeting of the Executive Committee, a member of the Committee, except the executive officers of the Bank, is entitled to a fee (of One Thousand Pesos (P1,000.00) or) as may be determined by the Board of Directors which shall take the industry practice into consideration.
ARTICLE VII-A
PERSONNEL AND COMPENSATION COMMITTEE Xxx
The Committee shall have the following powers and duties:
Xxx
12

2. To review and recommend to the Board of Directors the fees and
other compensation for directors.
Xxx Item 18. Other Proposed Action
(a) Confirmation/ratification of all acts and resolutions of management, the Board, all Board and Management Committees and the Officers of the Bank done in the regular course of business for the period covering January 01, 2010 through December 31, 2010 and from January 01, 2011 up to the date of the annual stockholders’ meeting such as but not limited to approval of all transactions and contracts entered into by the Bank, approval of credit/loan transactions, manpower related decisions/approvals, approval of reports, among others.
(b) Election of 15 members of the Board of Directors, including Independent
Directors for the ensuing year. (c) Election of external auditors and fixing their remuneration.
The accounting firm of Isla Lipana & Co. is being proposed to be re-elected/re-appointed as the Bank’s external auditors for the fiscal year 2011, the remuneration to be agreed upon between BPI management and the external Auditors.
(d) Director’s Bonus
The proposal for the Directors’ bonus will be taken up by the Board before the date of the annual stockholders meeting for endorsement to and approval of the stockholders.
Item 19. Voting Procedures (a) the vote required for approval or election
Article IV of the By-Laws of the Bank provides that in all regular or special meeting of stockholders, the presence of shareholders who represent a majority of the outstanding/subscribed capital stock entitled to vote shall constitute a quorum and all decisions made by the majority of the quorum shall be final, unless pertaining to resolutions where the law requires a greater number. With regard to the election of the members of the Board, the nominees receiving the highest number of votes shall be declared elected pursuant to Section 24 of the Corporation Code of the Philippines.
(b) the method by which the votes will be counted
Votes will be counted by shares and not per capita. Any stockholder may cumulate his vote as provided in the Corporation Code for purposes of election of the members of the Board. Should there be an event that will require voting, the votes to be cast shall be counted by the Bank’s auditors.
13


ANNEX “A”
THE NOMINEES TO THE BPI BOARD FOR THE TERM 2011-2012 1. JAIME AUGUSTO ZOBEL DE AYALA II, 51, Filipino, is the Chairman of the Board of
BPI. He has been the Chairman of the Board of BPI since March 25, 2004. He was first elected as a member of the Board of BPI in 1994 and then as Vice-Chairman from 1995 to March 2004. He is also currently the Chairman of the Executive Committee and Nomination Committee of BPI. He also holds the following significant positions: Chairman of the Board of Directors of BPI Family Savings Bank, Inc. and BPI Capital Corporation; Vice-Chairman of BPI-Philam Life Assurance Corporation; Chairman and Chief Executive Officer of Ayala Corporation; Chairman of the Board of Directors of Integrated Microelectronics, Inc., Globe Telecom, Inc., Al North America and Azalea Technology Investments, Inc.; Co-Vice Chairman of the Board of Mermac, Inc., Ayala Land, Inc. and Manila Water Company, Inc.; member of the Board of Directors of: Alabang Commercial Corporation, Ayala International Pte. Ltd., and Ayala Hotels, Inc.. He is also the Chairman of the Board of Trustees of Ramon Magsaysay Awards Foundation and World Wildlife Fund Philippines; Vice-Chairman of the Board of Trustees of Asia Society Philippine Foundation, Inc., Ayala Foundation, Inc. and Makati Business Club. He is a member of various international and local business and socio-civic organization including the Children’s Hour Philippines, Inc., Asian Institute of Management, JP Morgan International Council, Mitsubishi Corporation International Advisory Committee, Toshiba International Advisory Group, Harvard Business School Asia Advisory Committee, Harvard University Asia Center Advisory Committee, The Asia Society, The Conference Board, World Wildlife Fund (U.S.), Asia Business Council and Pacific Basin Economic Council. He graduated with a B.A. in Economics (Cum Laude) at the Harvard University in 1981 and took up his MBA at the Harvard Graduate School of Business Administration in 1987.
2. FERNANDO ZOBEL DE AYALA, 50, Filipino, has been a member of the Board of
Directors of BPI since 1994 up to the present. He also holds the following significant positions: Chairman of the Personnel and Compensation Committee and Vice-Chairman of the Executive Committee and Trust Committee of BPI; Chairman of the Board of Trustees of BPI Foundation, Inc.; Vice-Chairman of the Board of Directors, President and Chief Operating Officer of Ayala Corporation; Chairman of the Board of Ayala Land, Inc., Manila Water Company, Inc.; Alabang Commercial Corporation, Ayala Hotels, Inc., Ayala DBS Holdings, Inc., AC International Finance Ltd., and Ayala International Pte. Ltd.; Vice-Chairman of the Board of Directors of Aurora Properties, Inc., Azalea Technology Investment, Inc., CECI Realty, Inc. and Vesta Property Holdings, Inc.; Co-Vice Chairman of the Board of Directors of Mermac, Inc. and Vice-Chairman of the Board of Trustees of Ayala Foundation, Inc.; Member of the Board of Directors of Asiacom Philippines, Inc., Globe Telecom and Integrated Micro-Electronic, Inc. He is also a Member of the Board of Directors of Caritas Manila, Pasig Development, Manila Peninsula, Pilipinas Shell Corporation and Pilipinas Shell Foundation. Currently he is the Chairman of Habitat for Humanity Asia Pacific Campaign Steering Committee, A member of The Asia Society, World Economic Forum, Insead East Asia Council, World President’s Organization, Phils., Inc., World President’s Organization, International, Management Association of the Philippines and Philippine-Singapore Business Council. He is also the Trustee of International Council of Shopping Centers and Habitat for Humanity International. He graduated with B.A. Liberal Arts degree at the Harvard College in 1982.
3. AURELIO R. MONTINOLA III, 59, Filipino, assumed his post as President of BPI on 01
January 2005. He has been a member of the Board of Directors of BPI since January 2004. He is the Chairman of Credit Committee and member of the Executive Committee, Trust Committee, Risk Management Committee and Retirement/Pension Committee of BPI. He is also a Director of BPI Family Savings Bank, Inc. and BPI Capital Corporation; Chairman of the Board of Directors of BPI Direct Savings Bank, Inc., BPI/MS Insurance Corporation, BPI Computer Systems Corporation, LGU Guarantee Corporation, Armon Realty, Seyrel Investment & Realty Corp., Desrey, Inc., Monti-rey, Inc., Derrc, Inc., and Amon Trading Corp.; Chairman and Executive Director of Bank of the Philippine Islands (Europe) Plc; Chairman of the Board of Directors and Trustee of East Asia Educational

2
Foundation; Vice-Chairman & President of BPI Foundation, Inc.; Vice-Chairman of BPI Globe BanKO, Inc., A Savings Bank , and Republic Cement Corporation; Vice-Chairman and Trustee of Far Eastern University and Philippine Business for Education, Inc.; Vice-Chairman of A/P Regional Advisory Board of Directors of Mastercard Incorporated; President of Bankers Association of the Philippines; Director of Ayala Land, Inc., BPI PhilamLife Assurance Corporation, BPI Bancassurance, Inc., Mere, Inc. and Western Resources Corp.; Member of the Board of Trustees of Ayala Foundation, Inc., International School Manila, Pres. Manuel A. Roxas Foundation, Inc., Management Association of the Philippines, and Makati Business Club. He graduated with BS Management Engineering degree at the Ateneo de Manila University in 1973 and obtained his MBA at the Harvard Business School in 1977.
4. GERARDO C. ABLAZA, JR., 57, Filipino, is a member of the Board of Directors of BPI
since 2001. He is a member of the Trust Committee and Risk Management Committee of BPI. He also holds the following positions: Chairman of the Board of Directors of BPI Globe BanKO, Inc., A Savings Bank; Chairman, President and CEO of Manila Water Company, Inc.; member of the Board of Directors of BPI Family Savings Bank, Inc., Asiacom Philippines, Inc. and Livelt Investments Limited; Director and Co-Vice-Chairman of Globe Telecom, Inc. and Senior Managing Director of Ayala Corporation. He graduated with a degree in AB major in Mathematics (Honors Program) at the De La Salle University in 1974.
5. ROMEO L. BERNARDO, (Independent Director) 56, Filipino, has served as a member of
the Board of Directors of BPI from February 1998 to April 2001. He was again elected as an Independent Director in August 2002 up to present. He is a member of the Corporate Governance Committee, Nomination Committee, Personnel & Compensation Committee, Risk Management Committee and Trust Committee of BPI. He also sits as Independent Director of BPI Family Savings Bank, Inc. , BPI Capital Corporation, BPI Direct Savings Bank, Inc., BPI Leasing Corporation, BPI Rental Corporation,Ayala Plans, Inc., BPI/MS Insurance Corporation. BPI Globe BanKO, Inc., A Savings Bank, BPI Forex Corporation, BPI Bancassurance, Inc., BPI PhilamLife Assurance Corporation , Philippine Investment Management, Inc., Aboitiz Power Corporation, National Reinsurance Investment Corporation of the Philippines, Globe Telecom, Inc. and RFM Corporation; Director of Philippine Institute for Development Studies and Institute for Development & Econometric Analysis, Inc.; Chairman of the Board and Independent Director of Ayala Life Fixed-Income Fund Peso, Dollar, Euro Bond Funds and Philippine Stock Index Fund, Inc.; President and Managing Director of Lazaro Bernardo Tiu & Associates, Inc.; Vice-Chairman and Founding Fellow of Foundation for Economic Freedom; Advisor of Global Source/Latin Source and Vice President of Financial Executives Institute of the Philippines (FINEX). He graduated with B.S. Business Economics degree (Magna Cum Laude) from the University of the Philippines in 1974. He obtained his M.A. Development Economics (Top of the Class) at the Williams College, Williamstown, Massachusetts, USA in 1977.
6. CHNG SOK HUI, 50, Singaporean, has been a Member of the Board of Directors of BPI
since April 2003. She is a Member of the Executive Committee, Corporate Governance Committee, Nomination Committee and Personnel and Compensation Committee of BPI and currently a Managing Director and Chief Financial Officer of DBS Bank Ltd. (Singapore) and Supervisor of DBS China, Ltd. At present, she is also a Director of Ayala DBS Holdings, Inc., Asean Finance Corporation Ltd., and Asfinco Singapore, Ltd. She is also a Member of Housing and Development Board, Accounting Standards Council and Tax Advisory Committee. She was awarded a DBS scholarship and joined DBS Bank, Ltd. in 1983. She finished Accountancy at the National University of Singapore and was a recipient of several awards including the Harvard Club of Singapore Prize, the Tan Siak Kew Gold Medal Award and the Singapore International Chamber of Commerce Prize. She is a CFA charterholder, as well as a Certified Financial Risk Manager.
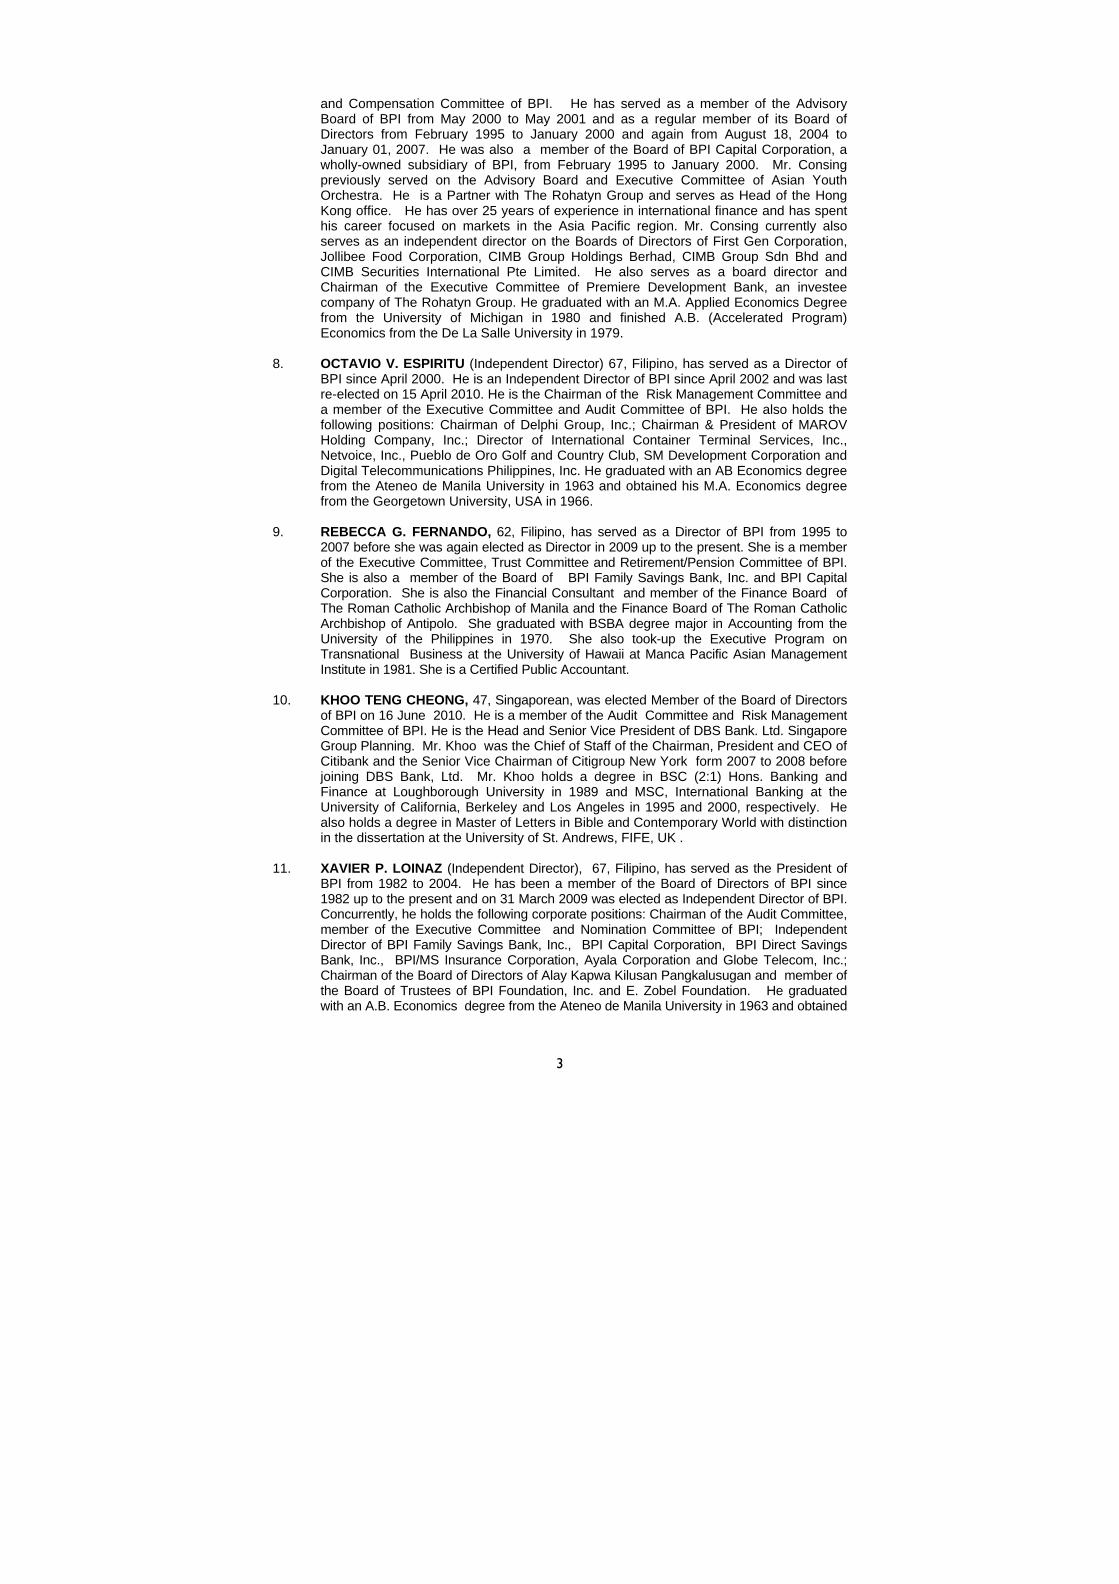
7. CEZAR P. CONSING (Independent Director) 51, Filipino, was elected as Independent
Director of BPI on April 15, 2010. He is a member of Risk Management and Personnel
3
and Compensation Committee of BPI. He has served as a member of the Advisory Board of BPI from May 2000 to May 2001 and as a regular member of its Board of Directors from February 1995 to January 2000 and again from August 18, 2004 to January 01, 2007. He was also a member of the Board of BPI Capital Corporation, a wholly-owned subsidiary of BPI, from February 1995 to January 2000. Mr. Consing previously served on the Advisory Board and Executive Committee of Asian Youth Orchestra. He is a Partner with The Rohatyn Group and serves as Head of the Hong Kong office. He has over 25 years of experience in international finance and has spent his career focused on markets in the Asia Pacific region. Mr. Consing currently also serves as an independent director on the Boards of Directors of First Gen Corporation, Jollibee Food Corporation, CIMB Group Holdings Berhad, CIMB Group Sdn Bhd and CIMB Securities International Pte Limited. He also serves as a board director and Chairman of the Executive Committee of Premiere Development Bank, an investee company of The Rohatyn Group. He graduated with an M.A. Applied Economics Degree from the University of Michigan in 1980 and finished A.B. (Accelerated Program) Economics from the De La Salle University in 1979.
8. OCTAVIO V. ESPIRITU (Independent Director) 67, Filipino, has served as a Director of
BPI since April 2000. He is an Independent Director of BPI since April 2002 and was last re-elected on 15 April 2010. He is the Chairman of the Risk Management Committee and a member of the Executive Committee and Audit Committee of BPI. He also holds the following positions: Chairman of Delphi Group, Inc.; Chairman & President of MAROV Holding Company, Inc.; Director of International Container Terminal Services, Inc., Netvoice, Inc., Pueblo de Oro Golf and Country Club, SM Development Corporation and Digital Telecommunications Philippines, Inc. He graduated with an AB Economics degree from the Ateneo de Manila University in 1963 and obtained his M.A. Economics degree from the Georgetown University, USA in 1966.
9. REBECCA G. FERNANDO, 62, Filipino, has served as a Director of BPI from 1995 to
2007 before she was again elected as Director in 2009 up to the present. She is a member of the Executive Committee, Trust Committee and Retirement/Pension Committee of BPI. She is also a member of the Board of BPI Family Savings Bank, Inc. and BPI Capital Corporation. She is also the Financial Consultant and member of the Finance Board of The Roman Catholic Archbishop of Manila and the Finance Board of The Roman Catholic Archbishop of Antipolo. She graduated with BSBA degree major in Accounting from the University of the Philippines in 1970. She also took-up the Executive Program on Transnational Business at the University of Hawaii at Manca Pacific Asian Management Institute in 1981. She is a Certified Public Accountant.
10. KHOO TENG CHEONG, 47, Singaporean, was elected Member of the Board of Directors
of BPI on 16 June 2010. He is a member of the Audit Committee and Risk Management Committee of BPI. He is the Head and Senior Vice President of DBS Bank. Ltd. Singapore Group Planning. Mr. Khoo was the Chief of Staff of the Chairman, President and CEO of Citibank and the Senior Vice Chairman of Citigroup New York form 2007 to 2008 before joining DBS Bank, Ltd. Mr. Khoo holds a degree in BSC (2:1) Hons. Banking and Finance at Loughborough University in 1989 and MSC, International Banking at the University of California, Berkeley and Los Angeles in 1995 and 2000, respectively. He also holds a degree in Master of Letters in Bible and Contemporary World with distinction in the dissertation at the University of St. Andrews, FIFE, UK .
11. XAVIER P. LOINAZ (Independent Director), 67, Filipino, has served as the President of
BPI from 1982 to 2004. He has been a member of the Board of Directors of BPI since 1982 up to the present and on 31 March 2009 was elected as Independent Director of BPI. Concurrently, he holds the following corporate positions: Chairman of the Audit Committee, member of the Executive Committee and Nomination Committee of BPI; Independent Director of BPI Family Savings Bank, Inc., BPI Capital Corporation, BPI Direct Savings Bank, Inc., BPI/MS Insurance Corporation, Ayala Corporation and Globe Telecom, Inc.; Chairman of the Board of Directors of Alay Kapwa Kilusan Pangkalusugan and member of the Board of Trustees of BPI Foundation, Inc. and E. Zobel Foundation. He graduated with an A.B. Economics degree from the Ateneo de Manila University in 1963 and obtained

4
his MBA Finance at the Wharton School of Pennsylvania in 1965. 12. MA YUEN LIN ANNIE, 44, British, has been a member of the Board of Directors of
BPI since 2007. She is also a member of the BPI Trust Committee. She is currently the Managing Director, Sales and Distribution Group of DBS Bank (HK) Ltd. Her scope of responsibilities encompasses products, customer segmentation and marketing communications, a key position in shaping the customer strategy of Consumer Banking in Hong Kong. Ms. Annie manages the deposits and bancassurance business of DBS Bank (HK) Ltd. particularly the business strategies and delivery of business results. She also takes on a regional role in the Priority Banking segment. She was one of the key leaders in managing and supporting the merger of the 3 banks in Hong Kong to become DBS Bank in 2003. She holds a Bachelor Degree in Marketing, Business Administration and is recently awarded by the Hong Kong Institute of Bankers as a Certified Financial Management Planner.
13. MERCEDITA S. NOLLEDO, 69, Filipino, has served as a Director of BPI since 1991 up
to the present . She is the Chairman of the Trust Committee and Retirement/Pension Committee and member of Corporate Governance Committee of BPI. She also holds the following significant positions: Director of BPI Family Savings Bank, Inc. and BPI Capital Corporation; Chairman of the Board of Directors of BPI Investment Management, Inc. and AG Counselors Corporation; Director, Senior Managing Director, Corporate Secretary and Senior Counsel of Ayala Corporation; Director and Corporate Secretary of Ayala Land, Inc.; member of the Board of Trustees of Ayala Foundation, Inc. and BPI Foundation, Inc.; Director of Anvaya Cove, Ayala Automotive Holdings, Inc., Ayalafil, Inc., Honda Cars Cebu, Inc., Honda Cars Makati, Inc., HCMI Insurance Agency, Inc., Isuzu Automotive Dealership, Inc., Isuzu Cebu, Inc. and Mandaue Primeland, Inc.; Treasurer of JMY Realty Development Corporation and Philippine Tuberculosis Society, Inc.. She graduated with the degree of Bachelor of Science in Business Administration major in Accounting from the University of the Philippines in 1960 and topped the CPA exams (second place) given in the same year. In 1965, she finished Bachelor of Laws degree also from the University of the Philippines where she also topped the Bar exams (second place) given in the same year.
14. ARTEMIO V. PANGANIBAN, (Independent Director), 74, Filipino, was elected as
Independent Director of BPI on April 15, 2010. At present, he is also an Independent Director of the following listed corporations: Manila Electric Company, Petron Corporation, First Philippine Holdings Corporation, Metro Pacific Investment Corporation, Metro Pacific Toolways Corporation, Robinsons Land Corporation, GMA Network, Inc., GMA Holdings, Inc. and Asian Terminals. Likewise, he also holds the following positions in various companies, to wit: Independent Adviser, Philippine Long Distance Telephone Company; Senior Adviser, Metropolitan Bank and Trust Company; Chairman, Board of Advisers, Metrobank Foundation, Inc.; Chairman, Board of Trustee, Philippine Dispute Resolution Center, Inc.; President, Manila Cathedral – Basilica Foundation; Adviser: Mapa Blue Falcon Honor Society, Dela Salle University College of Law, Asian Institute of Management Corporate Governance Center, World Bank, and Johann Strauss Society. He is also a Columnist in the Philippine Daily Inquirer. He has held various positions in government, such as Chief Justice and Associate Justice of the Supreme Court, Chairman of the Presidential Electoral Tribunal, Judicial and Bar Council, Philippine Judicial Academy and House of Representatives Electoral Tribunal and member of the Senate Electoral Tribunal. He graduated with the degree of Bachelor of Laws from Far Eastern University in 1960 and obtained his Doctor of Laws (Honoris Causa) degree at various universities, to wit: University of Iloilo (1997), Far Eastern University (2002), University of Cebu (2006) Angeles University (2006) and Bulacan State University (2006).
15. OSCAR S. REYES, 64, Filipino, was elected member of the Board of Directors of BPI in
April 2003 and has been a director since that time. He is a member of the Audit Committee, Corporate Governance Committee and Personnel & Compensation Committee of BPI. Among his other positions are: Chairman of Link Edge, Inc. and MRL Gold Philippines, Inc.; Independent Director of the following Companies: Ayala Land, Inc., Alcorn Gold Resources

5
Corporation, Manila Water Company, Pepsi Cola Products Philippines, Inc., Basic Energy Corporation, Sun Life Financial Plans, Inc., Sunlife Prosperity Dollar Abundance Fund, Sunlife Prosperity Dollar Advantage Fund, and Petrolift Corporation; Director of Philippine Long Distance Telephone Co., SMART Communications, Inc., and Mindoro Resources Ltd; and Chief Operating Officer of Manila Electric Company. He finished Bachelor of Arts, Major in Economics (Cum Laude) from the Ateneo de Manila University in 1965. He also took up the following courses: Business Management Consultants and Trainers Program from the Japan Productivity Center/Asian Productivity Organization, Tokyo, Japan and Hongkong in 1968; International Management Development Program leading to (1) Diploma in Business Administration and (2) Certificate in Export Promotion from the Waterloo University, Ontario, Canada in 1969-1970; European Business Program from UK, Netherlands, France, Germany, Switzerland in 1970; Master of Business Administration (Academic report completed) from the Ateneo Graduate School of Business Administration in 1971; Program for Management Development from the Harvard Business School, Boston, USA in 1976; and Commercial Management Study Program from the Lensbury Centre, Shell International Petroleum Co., United Kingdom.
THE KEY OFFICERS OF BPI AS OF FEBRUARY 16, 2011 1. JAIME AUGUSTO ZOBEL DE AYALA II* - Chairman of the Board of Directors 2. AURELIO R. MONTINOLA III* - President & Chief Executive Officer 3. GIL A. BUENAVENTURA - Senior Executive Vice- President & Chief Operating Officer
58 years old, Filipino, has served as the Head of the Corporate Banking Group of BPI since 1996. He also holds the following positions: Chairman of the Board of Directors and Chairman of the Nomination Committee of BPI Leasing Corporation; Chairman of the Board of Directors of: BPI Bancassurance, Inc., Citytrust Realty Corporation, BPI Rental Corporation, BPI International Finance Ltd., and BPI Express Remittance Corporation, Member of the Board of Directors of: BPI Family Savings Bank, Inc., BPI Computer Systems Corporation, Citytrust Securities Corporation and FGU Insurance Corporation. He is also a member of the Board of Directors and Chairman of the Corporate Governance Committee, Member of the Executive Committee and Risk Management Committee of BPI Direct Savings Bank, Inc., Member of the Board of Directors and Chairman of the Personnel and Compensation Committee and Member of the Nomination Committee of Ayala Plans, Inc., and Member of the Board of Trustees of BPI Foundation, Inc. He graduated with a degree of BA in Economics from the University of San Francisco in 1973 and finished his MBA - Finance at the University of Wisconsin in 1975.
4. ANTONIO V. PANER - Executive Vice-President & Treasurer
52 years old, Filipino, has served as the Treasurer and Head of Financial Markets Group of BPI since November 2002 up to present. Currently, he holds the following positions Chairman of the Board AF Money Brokers, Inc. and member of the Board of Directors of of City Trust Securities Corporation and BPI International Finance, Ltd. He is also the Director and Treasurer of Santiago Land Development Corporation and Citytrust Realty Corporation and Treasurer of BPI Computer Systems Corporation, BPI Operations Management Corporation and BPI Foundation, Inc.. He has also held various positions in BPI since 1989 such as but not limited to the following: Head of Risk Taking Business, Local Currency Portfolio Management Desk and Money Management Division. He finished AB Economics from the Ateneo de Manila University in 1979 and took up various courses in Business and Finance including Strategic Financial Management and Advanced Management Program at Harvard Business School in Boston, USA.
5. ALFONSO L. SALCEDO, JR. - Executive Vice-President

6
55 years old, Filipino, is the Head of the Corporate Banking Division of BPI. At present he is the member of the Board of Directors of BPI/MS Insurance Corporation, Chamber of Thrift Banks and National Reinsurance Corporation. He has held the following positions: President of BPI Family Savings Bank, Inc., BPI Insurance Group, BPI Bancassurance, Inc., Ayala Life Assurance, Inc. and Ayala Plans, Inc. He graduated from Ateneo de Manila in 1977 with a degree of AB Economics Honors Program (graduated with honors) and took up Advanced Management Program at the Harvard Business School in 2006.
6 MA. YSABEL P. SYLIANTENG - Executive Vice-President
59 years old, Filipino, is the Group Head of Cardbanking and BDW Group. She has also served as Head of Corporate Planning as well as the Financial Control Group of BPI from 1996 to December 2004. She joined BPI in 1983 as head of Financial Planning and Control as Assistant Vice-President and headed Corporate Planning by 1987. At present, she holds the following positions: Director and Member of the Audit, Risk Management and Executive Committees of BPI Direct Savings Bank, Inc.; Member of the Board of Directors of BPI Computer Systems Corporation, BPI Operations Management Corporation, FGU Insurance Corporation, BPI Express Remittance Corporation (USA), BPI Remittance Center Hong Kong, Ltd., BPI International Finance Ltd. Hong Kong, BPI Remittance Center S.p.a., BPI Express Remittance Spain, S.A., FEB Speed International, Inc., FEB Stock Brokers, Inc., and CityTrust Realty Corporation; Chairman of the Board of Directors of Ayala Plans, Inc., Santiago Land Development Corporation, BPI Card Finance Corporation and First Far East Development Corporation. She is a member of the Board of Trustees of Assumption College. She obtained her Bachelor of Liberal Arts cum Bachelor of Science in Commerce degrees, and major in Accounting (Magna Cum Laude) from Assumption College in 1973 and placed first in the CPA Board examination in the same year. She obtained her MBA from Stanford University in 1977 and her Certificate of Management Accounting in the U.S. in 1978.
7. TERESITA B. TAN - Executive Vice-President
59 years old, Filipino, is the Head of Overseas Banking and Channel Services Group since 2005. She joined BPI in 1987 as Assistant Vice President assigned in the Information Systems and Systems Marketing. She handled BPI – Consumer Banking, Card Banking from 1996 to 2005. She is the Chairman of the Board of Directors of the following corporations: BPI Forex Corporation, BPI Operations Management Corporation, BPI Remittance UK Plc-United Kingdom, BPI Express Remittance Spain, S.A., and BPI Express Remittance (Europe) – Italy. Concurrently, she is the President and member of the Board of Directors BPI Globe BanKO, Inc., A Savings Bank (formerly Pilipinas Savings Bank, Inc.) and Director of the following corporations: BPI Direct Savings Bank, Inc. where she is a member of the Corporate Governance Committee, Bank of the Philippine Islands (Europe), Plc., BPI Card Finance Corporation, BPI Express Remittance Corporation-USA and BPI Remittance Center Hongkong, Ltd.. She is also the Corporate Secretary of Anta Construction Corporation and Treasurer of Anta Realty Corporation. She graduated with a degree of Bachelor of Arts in Mathematics at Maryknoll College (Magna Cum Laude) in 1973 and obtained her post graduate degree in M.S. Operations Research at the Stanford University in 1975.
8. NATIVIDAD N. ALEJO - Senior Vice-President
54 years old, Filipino, is the Head of Consumer Banking Group of BPI. She has also served as the President and Director of BPI Capital Corporation and BPI Securities Corporation from 2001 to 2006. She joined BPI in 1989 with the rank of Senior Manager. She is also a member of the Board of Directors of the following corporations: BPI Family Savings Bank, Inc., Beacon Property Ventures, Inc., BPI Bancasssurance, Inc., Santiago Land Development Corporation, Cebu Holdings Inc., Cebu Property Ventures & Development Corporation, FEB Speed International, Inc., and Shemberg Biotech. At present, she is also a Director and Member of the Investment Committee of BPI-Philam Life Assurance Corporation (formerly Ayala Life Assurance, Inc.). She is also a member of the Board of Regents of the Leyte Normal University. She graduated with AB Economics degree (Summa Cum Laude) from the Divine Word University (Tacloban City) in 1976. She took up MA Economics at the University of the Philippines
7
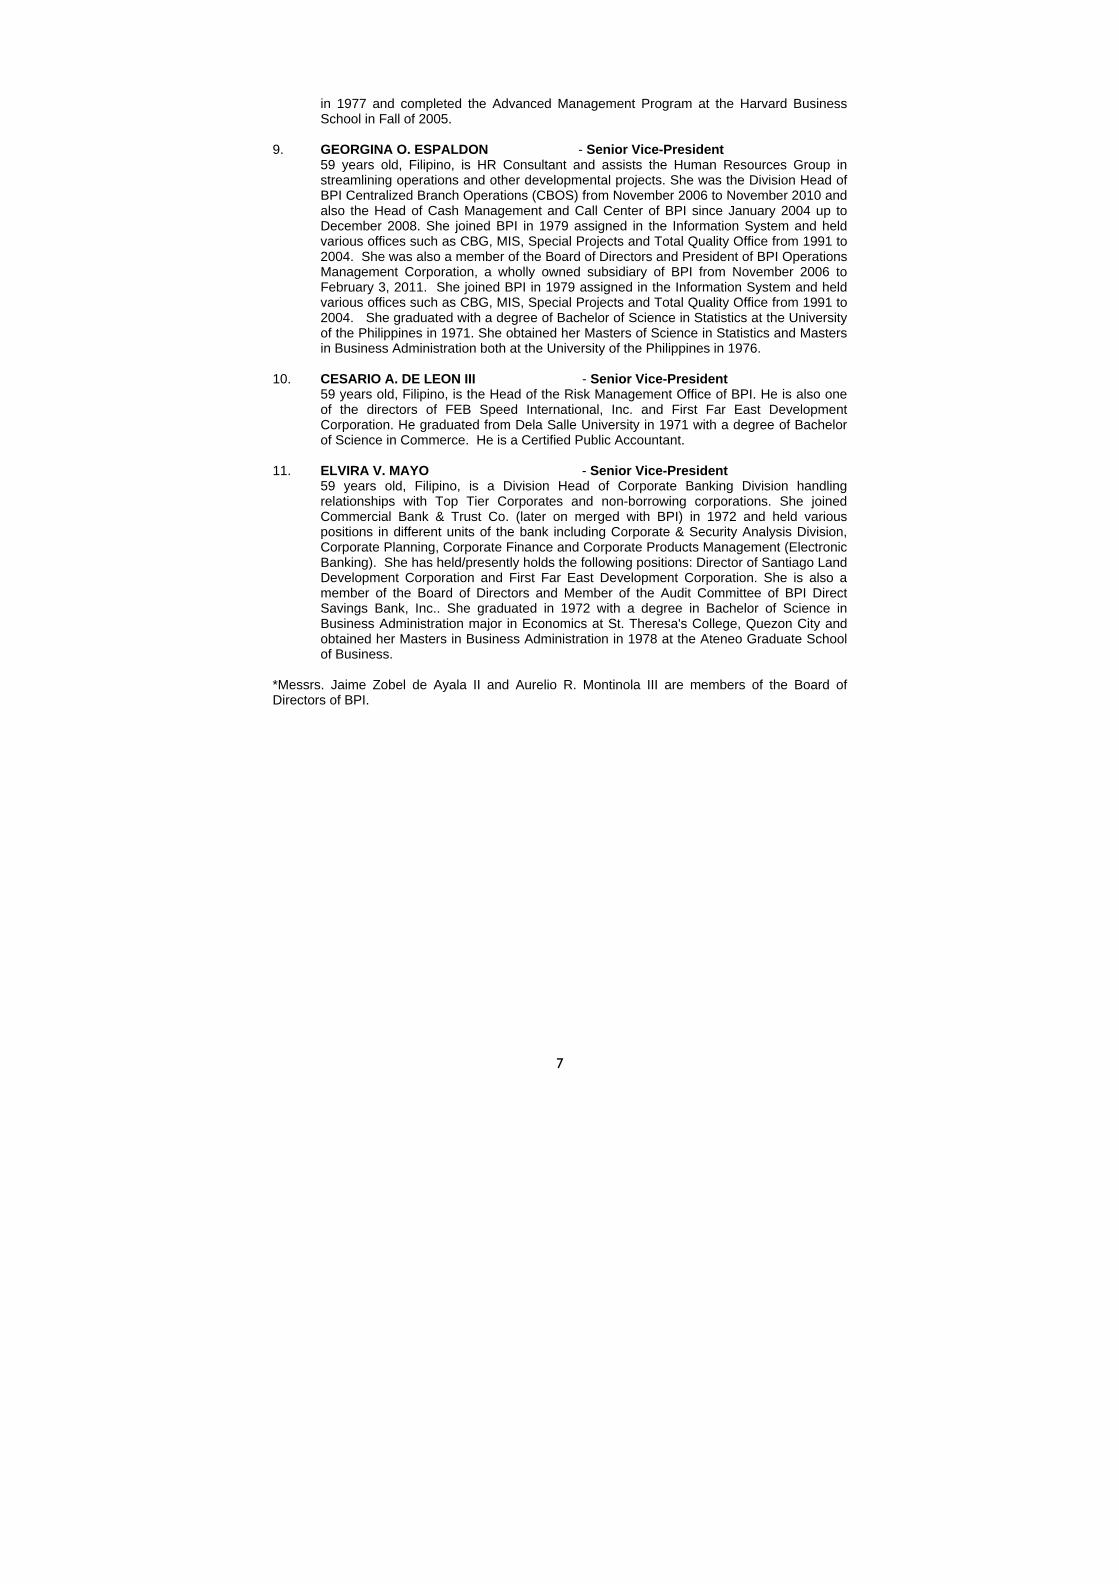
in 1977 and completed the Advanced Management Program at the Harvard Business School in Fall of 2005.
9. GEORGINA O. ESPALDON - Senior Vice-President
59 years old, Filipino, is HR Consultant and assists the Human Resources Group in streamlining operations and other developmental projects. She was the Division Head of BPI Centralized Branch Operations (CBOS) from November 2006 to November 2010 and also the Head of Cash Management and Call Center of BPI since January 2004 up to December 2008. She joined BPI in 1979 assigned in the Information System and held various offices such as CBG, MIS, Special Projects and Total Quality Office from 1991 to 2004. She was also a member of the Board of Directors and President of BPI Operations Management Corporation, a wholly owned subsidiary of BPI from November 2006 to February 3, 2011. She joined BPI in 1979 assigned in the Information System and held various offices such as CBG, MIS, Special Projects and Total Quality Office from 1991 to 2004. She graduated with a degree of Bachelor of Science in Statistics at the University of the Philippines in 1971. She obtained her Masters of Science in Statistics and Masters in Business Administration both at the University of the Philippines in 1976.
10. CESARIO A. DE LEON III - Senior Vice-President
59 years old, Filipino, is the Head of the Risk Management Office of BPI. He is also one of the directors of FEB Speed International, Inc. and First Far East Development Corporation. He graduated from Dela Salle University in 1971 with a degree of Bachelor of Science in Commerce. He is a Certified Public Accountant.
11. ELVIRA V. MAYO - Senior Vice-President
59 years old, Filipino, is a Division Head of Corporate Banking Division handling relationships with Top Tier Corporates and non-borrowing corporations. She joined Commercial Bank & Trust Co. (later on merged with BPI) in 1972 and held various positions in different units of the bank including Corporate & Security Analysis Division, Corporate Planning, Corporate Finance and Corporate Products Management (Electronic Banking). She has held/presently holds the following positions: Director of Santiago Land Development Corporation and First Far East Development Corporation. She is also a member of the Board of Directors and Member of the Audit Committee of BPI Direct Savings Bank, Inc.. She graduated in 1972 with a degree in Bachelor of Science in Business Administration major in Economics at St. Theresa's College, Quezon City and obtained her Masters in Business Administration in 1978 at the Ateneo Graduate School of Business.
*Messrs. Jaime Zobel de Ayala II and Aurelio R. Montinola III are members of the Board of Directors of BPI.

ANNEX “B”

www.pwc.com
Bank of thePhilippine IslandsFinancial StatementsAs of December 31, 2010 and 2009and for each of the three yearsin the period ended December 31, 2010
www.pwc.com/ph
Bank of thePhilippine IslandsFinancial StatementsAs of December 31, 2010 and 2009and for each of the three yearsin the period ended December 31, 2010
Philippine Islands

Isla Lipana & Co. is a Philippine member firm of the PricewaterhouseCoopers global network. “PwC” refers to the network of member firms of PricewaterhouseCoopersInternational Limited, each of which is a separate and independent legal entity.
Isla Lipana & Co., 29th Floor, Philamlife Tower, 8767 Paseo de Roxas, 1226 Makati City, PhilippinesT: +63 (2) 845 2728, F: +63 (2) 845 2806, www.pwc.com
Independent Auditor’s Report
To the Board of Directors and Shareholders ofBank of the Philippine IslandsBPI Building, Ayala AvenueMakati City
Report on the Financial Statements
We have audited the accompanying consolidated financial statements of Bank of the PhilippineIslands and Subsidiaries (the BPI Group) and the parent financial statements of Bank of thePhilippine Islands (the Parent Bank), which comprise the consolidated and parent statements ofcondition as at December 31, 2010 and 2009, and the consolidated and parent statements ofincome, statements of total comprehensive income, statements of changes in capital funds andstatements of cash flows for each of the three years in the period ended December 31, 2010, and asummary of significant accounting policies and other explanatory information.
Management’s Responsibility for the Financial Statements
Management is responsible for the preparation and fair presentation of these financialstatements in accordance with Philippine Financial Reporting Standards, and for such internalcontrol as management determines is necessary to enable the preparation of consolidated andparent financial statements that are free from material misstatement, whether due to fraud orerror.
Auditor’s Responsibility
Our responsibility is to express an opinion on these financial statements based on our audits. Weconducted our audits in accordance with Philippine Standards on Auditing. Those standardsrequire that we comply with ethical requirements and plan and perform the audit to obtainreasonable assurance about whether the financial statements are free from materialmisstatement.
An audit involves performing procedures to obtain audit evidence about the amounts anddisclosures in the financial statements. The procedures selected depend on the auditor’sjudgment, including the assessment of the risks of material misstatement of the financialstatements, whether due to fraud or error. In making those risk assessments, the auditorconsiders internal control relevant to the entity’s preparation and fair presentation of thefinancial statements in order to design audit procedures that are appropriate in thecircumstances, but not for the purpose of expressing an opinion on the effectiveness of theentity’s internal control. An audit also includes evaluating the appropriateness of accountingpolicies used and the reasonableness of accounting estimates made by management, as well asevaluating the overall presentation of the financial statements.

2 of 2 pages
Independent Auditor’s ReportTo the Board of Directors and Shareholders ofBank of the Philippine IslandsPage 2
We believe that the audit evidence we have obtained is sufficient and appropriate to provide abasis for our audit opinion.
Opinion
In our opinion, the accompanying consolidated and parent financial statements present fairly, inall material respects, the financial position of the BPI Group and of the Parent Bank as atDecember 31, 2010 and 2009, and their financial performance and their cash flows for each ofthe three years in the period ended December 31, 2010 in accordance with Philippine FinancialReporting Standards.
Report on Bureau of Internal Revenue Requirement
Our audit was conducted for the purpose of forming an opinion on the basic financial statementsas a whole. The supplementary information on taxes and licenses in Note 34 to the financialstatements is presented for purposes of filing with the Bureau of Internal Revenue and is not arequired part of the basic financial statements. Such information has been subjected to theauditing procedures applied in the audit of the basic financial statements and, in our opinion, isfairly stated in all material respects in relation to the basic financial statements taken as a whole.
Isla Lipana & Co.
Blesilda A. PestañoPartnerCPA Cert. No. 40446P.T.R. No. 0007713, issued on January 4, 2011, Makati CitySEC A.N. (Individual) as general auditors 0049-AR-2SEC A.N. (Firm) as general auditors 0009-FR-2TIN 112-071-927BIR A.N. 08-000745-7-2010, issued on May 31, 2010; effective until May 30, 2013BOA/PRC Reg. No. 0142, effective until December 31, 2013
Makati CityFebruary 22, 2011
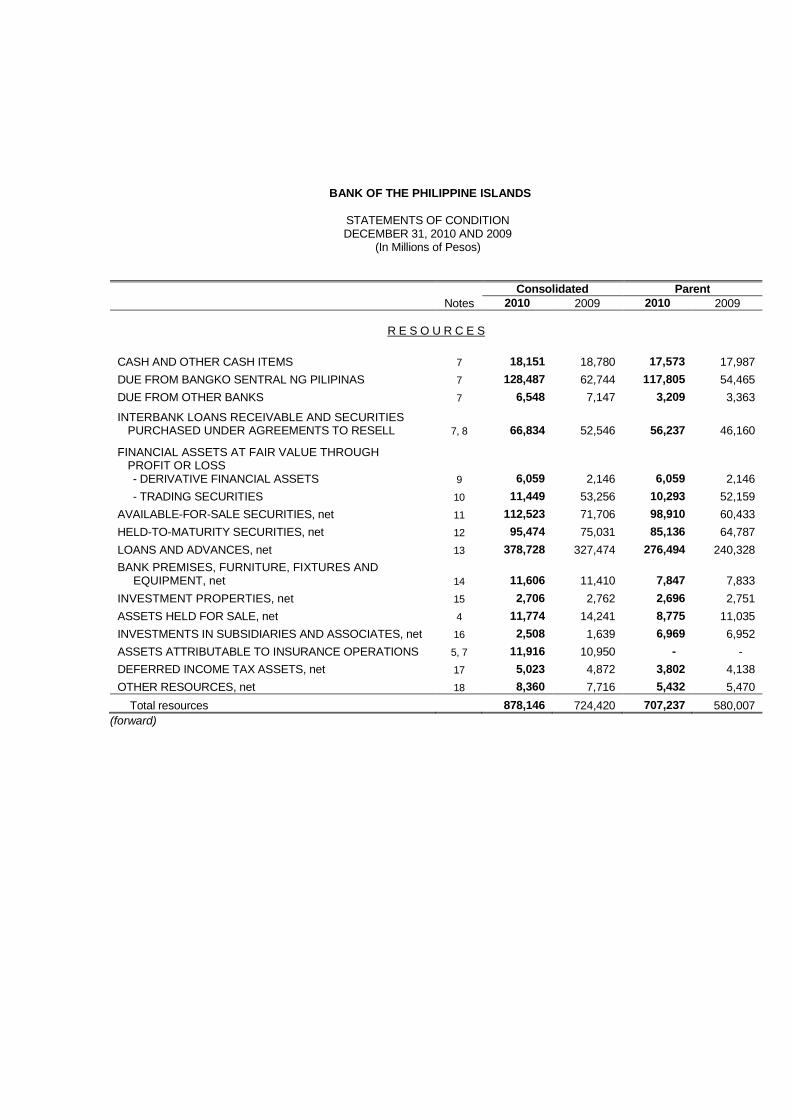
BANK OF THE PHILIPPINE ISLANDS
STATEMENTS OF CONDITIONDECEMBER 31, 2010 AND 2009
(In Millions of Pesos)
Consolidated ParentNotes 2010 2009 2010 2009
R E S O U R C E S
CASH AND OTHER CASH ITEMS 7 18,151 18,780 17,573 17,987DUE FROM BANGKO SENTRAL NG PILIPINAS 7 128,487 62,744 117,805 54,465DUE FROM OTHER BANKS 7 6,548 7,147 3,209 3,363
INTERBANK LOANS RECEIVABLE AND SECURITIESPURCHASED UNDER AGREEMENTS TO RESELL 7, 8 66,834 52,546 56,237 46,160
FINANCIAL ASSETS AT FAIR VALUE THROUGHPROFIT OR LOSS- DERIVATIVE FINANCIAL ASSETS 9 6,059 2,146 6,059 2,146- TRADING SECURITIES 10 11,449 53,256 10,293 52,159
AVAILABLE-FOR-SALE SECURITIES, net 11 112,523 71,706 98,910 60,433HELD-TO-MATURITY SECURITIES, net 12 95,474 75,031 85,136 64,787LOANS AND ADVANCES, net 13 378,728 327,474 276,494 240,328BANK PREMISES, FURNITURE, FIXTURES AND
EQUIPMENT, net 14 11,606 11,410 7,847 7,833INVESTMENT PROPERTIES, net 15 2,706 2,762 2,696 2,751ASSETS HELD FOR SALE, net 4 11,774 14,241 8,775 11,035INVESTMENTS IN SUBSIDIARIES AND ASSOCIATES, net 16 2,508 1,639 6,969 6,952ASSETS ATTRIBUTABLE TO INSURANCE OPERATIONS 5, 7 11,916 10,950 - -DEFERRED INCOME TAX ASSETS, net 17 5,023 4,872 3,802 4,138OTHER RESOURCES, net 18 8,360 7,716 5,432 5,470
Total resources 878,146 724,420 707,237 580,007(forward)

BANK OF THE PHILIPPINE ISLANDSSTATEMENTS OF CONDITIONDECEMBER 31, 2010 AND 2009(In Millions of Pesos)
Consolidated ParentNotes 2010 2009 2010 2009
LIABILITIES AND CAPITAL FUNDS
DEPOSIT LIABILITIES 19 719,766 579,471 591,936 472,031DERIVATIVE FINANCIAL LIABILITIES 9 5,329 1,593 5,329 1,593BILLS PAYABLE 20 24,868 32,009 17,243 24,616DUE TO BANGKO SENTRAL NG PILIPINAS AND
OTHER BANKS 2,000 1,933 2,003 1,935
MANAGER’S CHECKS AND DEMAND DRAFTSOUTSTANDING 4,187 3,059 3,483 2,506
ACCRUED TAXES, INTEREST AND OTHER EXPENSES 5,119 4,448 3,874 3,299UNSECURED SUBORDINATED DEBT 21 5,000 5,000 5,000 5,000LIABILITIES ATTRIBUTABLE TO INSURANCE
OPERATIONS 5 9,213 8,762 - -DEFERRED CREDITS AND OTHER LIABILITIES 22 20,389 20,380 16,915 17,731
Total liabilities 795,871 656,655 645,783 528,711CAPITAL FUNDS ATTRIBUTABLE TO THE EQUITY
HOLDERS OF BPI 23Share capital 35,562 32,467 35,562 32,467Share premium 8,317 1,412 8,317 1,412Reserves 1,367 1,394 1,336 1,351Surplus 35,318 33,160 16,542 17,390Accumulated other comprehensive income (loss) 467 (1,635) (303) (1,324)
81,031 66,798 61,454 51,296NON-CONTROLLING INTEREST 1,244 967 - -
Total capital funds 82,275 67,765 61,454 51,296Total liabilities and capital funds 878,146 724,420 707,237 580,007
(The notes on pages 1 to 91 are an integral part of these financial statements.)

BANK OF THE PHILIPPINE ISLANDS
STATEMENTS OF INCOMEFOR EACH OF THE THREE YEARS IN THE PERIOD ENDED DECEMBER 31, 2010
(In Millions of Pesos, Except Per Share Amounts)
Consolidated ParentNotes 2010 2009 2008 2010 2009 2008
INTEREST INCOMEOn loans and advances 25,270 24,440 24,100 15,944 16,059 16,565On held-to-maturity securities 5,787 5,285 4,058 5,017 4,542 3,339On available-for-sale securities 3,333 2,127 3,668 3,113 2,006 3,145On deposits with BSP and other banks 3,409 3,018 2,428 2,952 2,602 1,919On trading securities 582 361 372 539 330 325Gross receipts tax (1,394) (1,344) (1,329) (1,063) (1,040) (1,027)
36,987 33,887 33,297 26,502 24,499 24,266INTEREST EXPENSE
On deposits 19 12,069 11,229 13,352 8,081 7,299 8,958On bills payable and other borrowings 1,290 1,256 482 971 983 282
13,359 12,485 13,834 9,052 8,282 9,240NET INTEREST INCOME 23,628 21,402 19,463 17,450 16,217 15,026IMPAIRMENT LOSSES 4, 11, 13, 18 3,454 2,535 1,930 2,165 1,983 1,484NET INTEREST INCOME AFTER
IMPAIRMENT LOSSES 20,174 18,867 17,533 15,285 14,234 13,542OTHER INCOME
Fees and commissions 4,160 3,430 3,056 2,834 2,254 2,137Income from foreign exchange trading 2,204 1,693 1,712 2,089 1,564 1,450Trading gain (loss) on securities 3,536 1,527 (516) 3,200 1,354 (547)Income attributable to insurance
operations 5 802 798 588 - - -Other operating income 25 5,825 6,417 6,098 4,430 7,905 8,301Gross receipts tax (1,158) (872) (617) (1,039) (740) (497)
15,369 12,993 10,321 11,514 12,337 10,844OTHER EXPENSES
Compensation and fringe benefits 30 9,137 9,155 8,098 6,664 6,631 5,823Occupancy and equipment-related
expenses 14, 15, 26 6,083 5,645 5,303 4,714 4,370 4,066Other operating expenses 27 5,734 4,876 4,911 4,407 3,882 3,958
20,954 19,676 18,312 15,785 14,883 13,847INCOME BEFORE INCOME TAX 14,589 12,184 9,542 11,014 11,688 10,539PROVISION FOR INCOME TAX
CurrentDeferred
28
173,456(346)
2,597922
2,123862
2,581127
1,8801,055
1,370864
3,110 3,519 2,985 2,708 2,935 2,234NET INCOME FOR THE YEAR 11,479 8,665 6,557 8,306 8,753 8,305
Attributable to:Equity holders of BPI 11,312 8,516 6,423 8,306 8,753 8,305Non-controlling interest 167 149 134 - - -
11,479 8,665 6,557 8,306 8,753 8,305Earnings per share for net income
attributable to the equity holders of BPIduring the year:
Basic and diluted 23 3.38 2.62 1.98 2.48 2.69 2.56
(The notes on pages 1 to 91 are an integral part of these financial statements.)

BANK OF THE PHILIPPINE ISLANDS
STATEMENTS OF TOTAL COMPREHENSIVE INCOMEFOR EACH OF THE THREE YEARS IN THE PERIOD ENDED DECEMBER 31, 2010
(In Millions of Pesos)
Consolidated ParentNote 2010 2009 2008 2010 2009 2008
NET INCOME FOR THE YEAR 11,479 8,665 6,557 8,306 8,753 8,305OTHER COMPREHENSIVE INCOME 23
Net change in fair value reserve onavailable-for-sale securities, net oftax effect 1,207 390 (4,255) 1,021 395 (2,696)
Fair value reserve on investments ofinsurance subsidiaries, net of taxeffect 323 929 (1,211) - - -
Share in other comprehensive incomeof associates 830 (134) - - - -
Currency translation differences (215) 79 (112) - - -Total other comprehensive income (loss),
net of tax effect 2,145 1,264 (5,578) 1,021 395 (2,696)TOTAL COMPREHENSIVE INCOME
FOR THE YEAR 13,624 9,929 979 9,327 9,148 5,609
Attributable to:Equity holders of BPI 13,414 9,732 943 9,327 9,148 5,609Non-controlling interest 210 197 36 - - -
13,624 9,929 979 9,327 9,148 5,609
(The notes on pages 1 to 91 are an integral part of these financial statements.)

BANK OF THE PHILIPPINE ISLANDS
STATEMENTS OF CHANGES IN CAPITAL FUNDSFOR EACH OF THE THREE YEARS IN THE PERIOD ENDED DECEMBER 31, 2010
(In Millions of Pesos)
ConsolidatedAttributable to equity holders of BPI (Note 23)
Sharecapital
Sharepremium Reserves Surplus
Accumulatedother
comprehensiveincome (loss)
Non-controlling
interest TotalBalance, January 1, 2008 27,044 1,360 1,193 37,785 2,629 1,120 71,131Comprehensive incomeNet income for the year - - - 6,423 - 134 6,557Other comprehensive income (loss)Net change in fair value reserve on
available-for-sale securities, net of taxeffect - - - - (4,255) - (4,255)
Fair value reserve on investments ofinsurance subsidiaries, net of tax effect - - - - (1,113) (98) (1,211)
Share in other comprehensive income ofassociates - - - - - - -
Currency translation differences - - - - (112) - (112)Total other comprehensive income (loss) - - - - (5,480) (98) (5,578)Total comprehensive income - - - 6,423 (5,480) 36 979Transactions with ownersEmployee stock option plan:
Value of employee services - - 44 - - - 44Exercise of options 3 14 (21) - - - (4)
Cash dividends - - - (8,060) - - (8,060)Stock dividends 5,409 - - (5,409) - - -Total transactions with owners 5,412 14 23 (13,469) - - (8,020)Transfer from surplus to reserves - - 80 (80) - - -Other changes in non-controlling interest - - - - - (218) (218)Balance, December 31, 2008 32,456 1,374 1,296 30,659 (2,851) 938 63,872Comprehensive incomeNet income for the year - - - 8,516 - 149 8,665Other comprehensive incomeNet change in fair value reserve on
available-for-sale securities, net of taxeffect - - - - 390 - 390
Fair value reserve on investments ofinsurance subsidiaries, net of tax effect - - - - 881 48 929
Share in other comprehensive income ofassociates - - - - (134) - (134)
Currency translation differences - - - - 79 - 79Total other comprehensive income - - - - 1,216 48 1,264Total comprehensive income - - - 8,516 1,216 197 9,929Transactions with ownersEmployee stock option plan:
Exercise of options 11 38 (74) - - - (25)Cash dividends - - - (5,843) - - (5,843)Total transactions with owners 11 38 (74) (5,843) - - (5,868)Transfer from surplus to reserves - - 172 (172) - - -Other changes in non-controlling interest - - - - - (168) (168)Balance, December 31, 2009 32,467 1,412 1,394 33,160 (1,635) 967 67,765(forward)

BANK OF THE PHILIPPINE ISLANDSSTATEMENTS OF CHANGES IN CAPITAL FUNDSFOR EACH OF THE THREE YEARS IN THE PERIOD ENDED DECEMBER 31, 2010(In Millions of Pesos)
ConsolidatedAttributable to equity holders of BPI (Note 23)
Sharecapital
Sharepremium Reserves Surplus
Accumulatedother
comprehensiveincome (loss)
Non-controlling
interest TotalBalance, December 31, 2009 32,467 1,412 1,394 33,160 (1,635) 967 67,765Comprehensive incomeNet income for the year - - - 11,312 - 167 11,479Other comprehensive incomeNet change in fair value reserve on
available-for-sale securities, net of taxeffect - - - - 1,207 - 1,207
Fair value reserve on investments ofinsurance subsidiaries, net of tax effect - - - - 280 43 323
Share in other comprehensive income ofassociates - - - - 830 - 830
Currency translation differences - - - - (215) - (215)Total other comprehensive income - - - - 2,102 43 2,145Total comprehensive income - - - 11,312 2,102 210 13,624Transactions with ownersIssuance of shares 3,077 6,829 - - - - 9,906Employee stock option plan:
Exercise of options 18 76 (137) - - - (43)Cash dividends - - - (9,044) - - (9,044)Total transactions with owners 3,095 6,905 (137) (9,044) - - 819Transfer from surplus to reserves - - 110 (110) - - -Other changes in non-controlling interest - - - - - 67 67Balance, December 31, 2010 35,562 8,317 1,367 35,318 467 1,244 82,275
(The notes on pages 1 to 91 are an integral part of these financial statements.)

BANK OF THE PHILIPPINE ISLANDS
STATEMENTS OF CHANGES IN CAPITAL FUNDSFOR EACH OF THE THREE YEARS IN THE PERIOD ENDED DECEMBER 31, 2010
(In Millions of Pesos)
Parent (Note 23)
Sharecapital
Sharepremium Reserves Surplus
Accumulatedother
comprehensiveincome (loss) Total
Balance, January 1, 2008 27,044 1,360 1,145 19,896 977 50,422Comprehensive incomeNet income for the year - - - 8,305 - 8,305Other comprehensive incomeNet change in fair value reserve on
available-for-sale securities, net of taxeffect - - - - (2,696) (2,696)
Total other comprehensive income - - - - (2,696) (2,696)Total comprehensive income (loss) - - - 8,305 (2,696) 5,609Transactions with ownersEmployee stock option plan:
Value of employee services - - 37 - - 37Exercise of options 3 14 (21) - - (4)
Cash dividends - - - (8,060) - (8,060)Stock dividends 5,409 - - (5,409) - -Total transactions with owners 5,412 14 16 (13,469) - (8,027)Transfer from surplus to reserves - - 80 (80) - -Balance, December 31, 2008 32,456 1,374 1,241 14,652 (1,719) 48,004Comprehensive incomeNet income for the year - - - 8,753 - 8,753Other comprehensive incomeNet change in fair value reserve on
available-for-sale securities, net of taxeffect - - - - 395 395
Total other comprehensive income - - - - 395 395Total comprehensive income - - - 8,753 395 9,148Transactions with ownersEmployee stock option plan:
Exercise of options 11 38 (62) - - (13)Cash dividends - - - (5,843) - (5,843)Total transactions with owners 11 38 (62) (5,843) - (5,856)Transfer from surplus to reserves - - 172 (172) - -Balance, December 31, 2009 32,467 1,412 1,351 17,390 (1,324) 51,296
(forward)

BANK OF THE PHILIPPINE ISLANDSSTATEMENTS OF CHANGES IN CAPITAL FUNDSFOR EACH OF THE THREE YEARS IN THE PERIOD ENDED DECEMBER 31, 2010(In Millions of Pesos)
Parent (Note 23)
Sharecapital
Sharepremium Reserves Surplus
Accumulatedother
comprehensiveincome (loss) Total
Balance, December 31, 2009 32,467 1,412 1,351 17,390 (1,324) 51,296Comprehensive incomeNet income for the year - - - 8,306 - 8,306Other comprehensive incomeNet change in fair value reserve on
available-for-sale securities, net of taxeffect - - - - 1,021 1,021
Total other comprehensive income - - - - 1,021 1,021Total comprehensive income - - - 8,306 1,021 9,327Transactions with ownersIssuance of shares 3,077 6,829 - - - 9,906Employee stock option plan:
Exercise of options 18 76 (125) - - (31)Cash dividends - - - (9,044) - (9,044)Total transactions with owners 3,095 6,905 (125) (9,044) - 831Transfer from surplus to reserves - - 110 (110) - -Balance, December 31, 2010 35,562 8,317 1,336 16,542 (303) 61,454
(The notes on pages 1 to 91 are an integral part of these financial statements.)
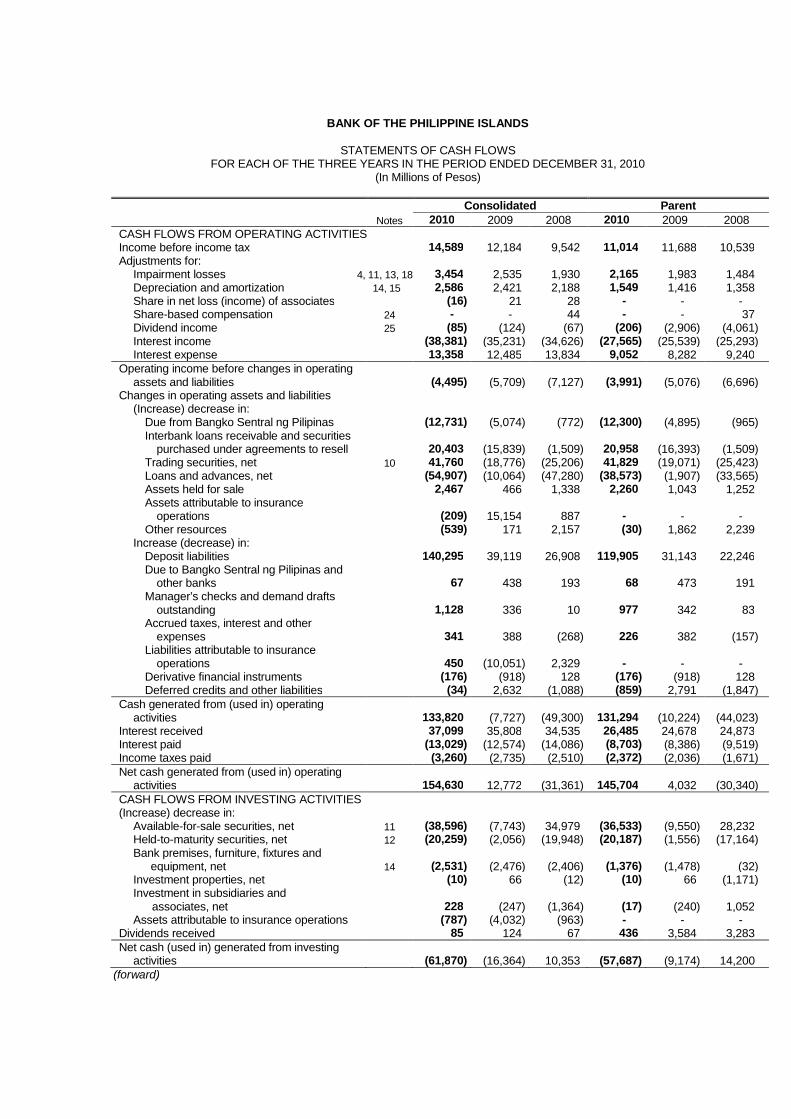
BANK OF THE PHILIPPINE ISLANDS
STATEMENTS OF CASH FLOWSFOR EACH OF THE THREE YEARS IN THE PERIOD ENDED DECEMBER 31, 2010
(In Millions of Pesos)
Consolidated ParentNotes 2010 2009 2008 2010 2009 2008
CASH FLOWS FROM OPERATING ACTIVITIESIncome before income tax 14,589 12,184 9,542 11,014 11,688 10,539Adjustments for:
Impairment losses 4, 11, 13, 18 3,454 2,535 1,930 2,165 1,983 1,484Depreciation and amortization 14, 15 2,586 2,421 2,188 1,549 1,416 1,358Share in net loss (income) of associates (16) 21 28 - - -Share-based compensation 24 - - 44 - - 37Dividend income 25 (85) (124) (67) (206) (2,906) (4,061)Interest income (38,381) (35,231) (34,626) (27,565) (25,539) (25,293)Interest expense 13,358 12,485 13,834 9,052 8,282 9,240
Operating income before changes in operatingassets and liabilities (4,495) (5,709) (7,127) (3,991) (5,076) (6,696)
Changes in operating assets and liabilities(Increase) decrease in:
Due from Bangko Sentral ng Pilipinas (12,731) (5,074) (772) (12,300) (4,895) (965)Interbank loans receivable and securities
purchased under agreements to resell 20,403 (15,839) (1,509) 20,958 (16,393) (1,509)Trading securities, net 10 41,760 (18,776) (25,206) 41,829 (19,071) (25,423)Loans and advances, net (54,907) (10,064) (47,280) (38,573) (1,907) (33,565)Assets held for sale 2,467 466 1,338 2,260 1,043 1,252Assets attributable to insurance
operations (209) 15,154 887 - - -Other resources (539) 171 2,157 (30) 1,862 2,239
Increase (decrease) in:Deposit liabilities 140,295 39,119 26,908 119,905 31,143 22,246Due to Bangko Sentral ng Pilipinas and
other banks 67 438 193 68 473 191Manager’s checks and demand drafts
outstanding 1,128 336 10 977 342 83Accrued taxes, interest and other
expenses 341 388 (268) 226 382 (157)Liabilities attributable to insurance
operations 450 (10,051) 2,329 - - -Derivative financial instruments (176) (918) 128 (176) (918) 128Deferred credits and other liabilities (34) 2,632 (1,088) (859) 2,791 (1,847)
Cash generated from (used in) operatingactivities 133,820 (7,727) (49,300) 131,294 (10,224) (44,023)
Interest received 37,099 35,808 34,535 26,485 24,678 24,873Interest paid (13,029) (12,574) (14,086) (8,703) (8,386) (9,519)Income taxes paid (3,260) (2,735) (2,510) (2,372) (2,036) (1,671)Net cash generated from (used in) operating
activities 154,630 12,772 (31,361) 145,704 4,032 (30,340)CASH FLOWS FROM INVESTING ACTIVITIES(Increase) decrease in:
Available-for-sale securities, net 11 (38,596) (7,743) 34,979 (36,533) (9,550) 28,232Held-to-maturity securities, net 12 (20,259) (2,056) (19,948) (20,187) (1,556) (17,164)Bank premises, furniture, fixtures and
equipment, net 14 (2,531) (2,476) (2,406) (1,376) (1,478) (32)Investment properties, net (10) 66 (12) (10) 66 (1,171)Investment in subsidiaries and
associates, net 228 (247) (1,364) (17) (240) 1,052Assets attributable to insurance operations (787) (4,032) (963) - - -
Dividends received 85 124 67 436 3,584 3,283Net cash (used in) generated from investing
activities (61,870) (16,364) 10,353 (57,687) (9,174) 14,200(forward)

BANK OF THE PHILIPPINE ISLANDSSTATEMENTS OF CASH FLOWSFOR EACH OF THE THREE YEARS IN THE PERIOD ENDED DECEMBER 31, 2010(In Millions of Pesos)
Consolidated ParentNotes 2010 2009 2008 2010 2009 2008
CASH FLOWS FROM FINANCING ACTIVITIESCash dividends paid (9,044) (5,843) (8,060) (9,044) (5,843) (8,060)Proceeds from stock rights offering 23 9,906 9,906Increase (decrease) in bills payable (7,141) 22,074 4,559 (7,372) 19,242 3,283Increase in derivative liabilities 21 - - 5,000 - - 5,000Net cash (used in) generated from financing
activities (6,279) 16,231 1,499 (6,510) 13,399 223NET INCREASE (DECREASE) IN CASH
AND CASH EQUIVALENTS 86,481 12,639 (19,509) 81,507 8,257 (15,917)CASH AND CASH EQUIVALENTS
January 1 7 75,429 62,790 82,299 57,447 49,190 65,107December 31 161,910 75,429 62,790 138,954 57,447 49,190
(The notes on pages 1 to 91 are an integral part of these financial statements.)
BANK OF THE PHILIPPINE ISLANDS
NOTES TO FINANCIAL STATEMENTSAS OF DECEMBER 31, 2010 AND 2009
AND FOR EACH OF THE THREE YEARSIN THE PERIOD ENDED DECEMBER 31, 2010
Note 1 - General Information
Bank of the Philippine Islands (BPI or the “Parent Bank”) is a domestic commercial bank with an expandedbanking license and with principal office at BPI Building, Ayala Avenue corner Paseo de Roxas, Makati City.BPI and its subsidiaries (collectively referred to as the “BPI Group”) offer a whole breadth of financial servicesthat include corporate banking, consumer banking, investment banking, asset management, corporate finance,securities distribution, and insurance services. At December 31, 2010, the BPI Group has 12,035 employees(2009 - 12,155 employees) and operated 812 branches and 1,656 ATMs to support its delivery of services.The BPI Group also serves its customers through alternative electronic banking channels such as telephone,mobile phone and the internet. The BPI shares have been traded in the Philippine Stock Exchange sinceOctober 12, 1971. The Parent Bank was registered with the Securities and Exchange Commission (SEC) onJanuary 4, 1943. This license was extended for another 50 years on January 4, 1993.
These financial statements have been approved and authorized for issuance by the Board of Directors of theParent Bank on February 16, 2011. There are no material events that occurred subsequent to February 16,2011 until February 22, 2011.
Note 2 - Summary of Significant Accounting Policies
The principal accounting policies applied in the preparation of these financial statements are set out below.These policies have been consistently applied to all the years presented, unless otherwise stated.
2.1 Basis of preparation
The financial statements of the BPI Group have been prepared in accordance with Philippine FinancialReporting Standards (PFRS). The term PFRS in general includes all applicable PFRS, PhilippineAccounting Standards (PAS), and interpretations of the Philippine Interpretations Committee (PIC), StandingInterpretations Committee (SIC), and International Financial Reporting Interpretations Committee (IFRIC)which have been approved by the Financial Reporting Standards Council (FRSC) and adopted by the SEC.
As allowed by the SEC, the pre-need subsidiary of the Parent Bank continues to follow the provisions of thePre-Need Uniform Chart of Accounts (PNUCA) prescribed by the SEC.
The financial statements comprise the statement of condition, statement of income and statement of totalcomprehensive income shown as two statements, statement of changes in capital funds, the statement of cashflows and the notes.
These financial statements have been prepared under the historical cost convention, as modified by therevaluation of trading securities, available-for-sale financial assets, and all derivative contracts.
The preparation of financial statements in conformity with PFRS requires the use of certain criticalaccounting estimates. It also requires management to exercise its judgment in the process of applying theBPI Group’s accounting policies. Changes in assumptions may have a significant impact on the financialstatements in the period the assumptions changed. Management believes that the underlying assumptionsare appropriate and that the BPI Group’s financial statements therefore present the financial position andresults fairly. The areas involving a higher degree of judgment or complexity, or areas where assumptionsand estimates are significant to the financial statements are disclosed in Note 4.

(2)
2.2 New standards, interpretations and amendments to published standards
The BPI Group adopted the following accounting standards and interpretations approved by the FRSCwhich are effective for the BPI Group beginning January 1, 2010:
Amendment to IFRIC 9 and IAS 39, Embedded Derivatives (effective for annual periods beginning on orafter June 30, 2009). The amendment clarifies that subsequent reassessment of embedded derivativesis prohibited unless there is either (a) a change in the terms of the contract that significantly modifies thecash flows that otherwise would be required under the contract or (b) a reclassification of a financialasset out of the fair value through profit or loss category, in which cases an reassessment is required.An entity determines whether a modification to cash flows is significant by considering the extent towhich the expected future cash flows associated with the embedded derivative, the host contract orboth have changed and whether the change is significant relative to the previously expected cash flowson the contract. The adoption of this amendment did not have a significant impact on the financialstatements of the BPI Group.
Amendment to PAS 39, Eligible Hedged Items (effective for annual periods beginning on or after July 1,2009). The amendment provides that an entity can designate all changes in the cash flows or fair valueof a hedged item in a hedging relationship. An entity can also designate only changes in the cash flowsor fair value of a hedged item above or below a specified price or other variable (a one-sided risk). Theintrinsic value of a purchased option hedging instrument (assuming that it has the same principal termsas the designated risk), but not its time value, reflects a one-sided risk in a hedged item. For example,an entity can designate the variability of future cash flow outcomes resulting from a price increase of aforecast commodity purchase. In such a situation, only cash flow losses that result from an increase inthe price above the specified level are designated. The hedged risk does not include the time value of apurchased option because the time value is not a component of the forecast transaction that affectsprofit or loss. The amendment did not have a significant impact on the financial statements of the BPIGroup as there are currently no accounting hedges.
PAS 27 (Revised), Consolidated and Separate Financial Statements (effective for annual periodsbeginning on or after July 1, 2009). The revised standard requires the effects of all transactions withnon-controlling interests to be recorded in equity if there is no change in control and these transactionswill no longer result in goodwill or gains and losses. The standard also specifies the accounting whencontrol is lost; any remaining interest in the entity is re-measured to fair value, and a gain or loss isrecognized in profit or loss. The adoption of this revised standard did not have a significant impact onthe BPI Group’s financial statements.
PFRS 3 (Revised), Business Combinations (effective for annual periods beginning on or after July 1,2009). The revised standard continues to apply the acquisition method to business combinations, withsome significant changes. For example, all payments to purchase a business are to be recorded at fairvalue at the acquisition date, with contingent payments classified as debt subsequently re-measuredthrough the income statement. There is a choice, on an acquisition-by-acquisition basis, to measurethe non-controlling interest in the acquiree either at fair value or at the non-controlling interest’sproportionate share of the acquiree’s net assets. All acquisition-related costs should be expensed. Theadoption of this revised standard did not have a significant impact on the BPI Group’s financialstatements.

(3)
Philippine Interpretation IFRIC 17, Distribution of Non-Cash Assets to Owners (effective for annualperiods beginning on or after July 1, 2009). This interpretation addresses accounting by an entity thatmakes a non-cash asset distribution to owners. An entity shall measure a liability to distribute non-cashassets as a dividend to its owners at the fair value of the assets to be distributed. If an entity gives itsowners a choice of receiving either a non-cash asset or a cash alternative, the entity shall estimate thedividend payable by considering both the fair value of each alternative and the associated probability ofowners selecting each alternative. At the end of each reporting period and at the date of settlement, theentity shall review and adjust the carrying amount of the dividend payable, with any changes in thecarrying amount of the dividend payable recognized in equity as adjustments to the amount of thedistribution. The adoption of this interpretation did not have a significant impact on the BPI Group’sfinancial statements.
PFRS 2 (Amendment), Group Cash-settled Share-based Payment Transactions (effective January 1,2010). In addition to incorporating Philippine Interpretation IFRIC 8, Scope of PFRS 2, and PhilippineInterpretation IFRIC 11, PFRS 2 - Group and Treasury Share Transactions, the amendments expand onthe guidance in Philippine Interpretation IFRIC 11 to address the classification of group arrangementsthat were not covered by that interpretation.
Likewise, the FRSC has approved new standards, amendments and interpretations to existing standardsthat are effective after January 1, 2010 which are not early adopted by the BPI Group as discussed below:
PFRS 9, Financial Instruments (effective January 1, 2013). This standard is the first step in the processto replace PAS 39, Financial Instruments: Recognition and Measurement. PFRS 9 introduces newrequirements for classifying and measuring financial assets and is likely to affect the Group’saccounting for its financial assets. The adoption of PFRS 9 will affect the BPI Group’s accounting for itsdebt available-for-sale financial assets as the standard will only allow the recognition of fair value gainsand losses in other comprehensive income if they relate to equity investments that are not held fortrading. Fair value gains and losses on available-for-sale debt investments will therefore have to berecognized directly in profit or loss. As of December 31, 2010, the fair value loss on available-for-saledebt securities recognized in other comprehensive income amounts to P77 million. The BPI Group iscurrently assessing the full impact of PFRS 9.
Additions to International Financial Reporting Standards 9, Financial Instruments, were issued late in2010. The new requirements address the problem of volatility in profit or loss arising from an issuerchoosing to measure its own debt at fair value. With the new requirements, an entity choosing tomeasure a liability at fair value will present the portion of the change in fair value due to changes in theentity’s own credit risk in the other comprehensive income section of financial statements rather than inthe statements of income. This new requirement is not expected to have a significant impact on theBPI Group’s financial statements as there are currently no debts carried at fair value.
PAS 24 (Revised), Related Party Disclosures (effective January 1, 2011). The revised standardclarifies and simplifies the definition of a related party and removes the requirement for government-related entities to disclose details of all transactions with the government and other government-relatedentities. The BPI Group will apply the revised standard from January 1, 2011. When the revisedstandard is applied, the Parent Bank and the BPI Group as a whole will need to disclose anytransactions between its subsidiaries and its associates. The BPI Group is currently enhancing itsexisting processes to fully capture the necessary information.

(4)
PAS 32 (Amendment), Financial Instruments: Presentation - Classification of Rights Issues (effectiveFebruary 1, 2010). The amendment addresses the accounting for rights issues that are denominated ina currency other than the functional currency of the issuer. Provided certain conditions are met, suchrights issues are now classified as equity regardless of the currency in which the exercise price isdenominated. Previously, these issues had to be accounted for as derivative liabilities. Theamendment applies retrospectively in accordance with PAS 8, Accounting Policies, Changes inAccounting Estimates and Errors. The BPI Group will apply the amended standard from January 1,2011. The application of the said standard is not expected to have a significant impact on the BPIGroup’s financial statements as there are currently no plans yet for a rights issue denominated in aforeign currency other than its functional currency.
Philippine Interpretation IFRIC 14, PAS 19 - The Limit on a Defined Benefit Asset, Minimum FundingRequirements and their Interaction (Amendment) (effective January 1, 2011). The amendment correctsan unintended consequence of Philippine Interpretations IFRIC 14. Without the amendments, entitiesare not permitted to recognize as an asset for some voluntary prepayments for minimum fundingcontributions. This was not intended when Philippine Interpretation IFRIC 14 was issued, and theamendment corrects this. The amendment should be applied retrospectively to the earliestcomparative period presented. The Group will apply these amendments for the financial reportingperiod commencing on January 1, 2011. The application of the amendment is not expected to have asignificant impact on the financial statements of the BPI Group.
Philippine Interpretation IFRIC 19, Extinguishing Financial Liabilities with Equity Instruments (effectiveJuly 1, 2010). The interpretation clarifies the accounting by an entity when the terms of a financialliability are renegotiated and result in the entity issuing equity instruments to a creditor of the entity toextinguish all or part of the financial liability (debt for equity swap). It requires a gain or loss to berecognized in profit or loss, which is measured as the difference between the carrying amount of thefinancial liability and the fair value of the equity instruments issued. If the fair value of the equityinstruments issued cannot be reliably measured, the equity instruments should be measured to reflectthe fair value of the financial liability extinguished. The adoption of this interpretation on January 1,2011 is not expected to have any impact on the BPI Group’s financial statements.
2010 Improvements to PFRS (effective for annual period on or after January 1, 2011)
The following are the relevant amendments to PFRS which contains amendments that result in accountingchanges, presentation, recognition and measurement. It also includes amendments that are terminology oreditorial changes only which have either minimal or no effect on accounting (effective January 1, 2011).These amendments are part of the IASB’s annual improvements project published in August 2009.
PFRS 1 (Revised), First-time Adoption of Philippine Financial Reporting Standards (effective fromJanuary 1, 2011). The amendment clarifies that, if a first-time adopter changes its accounting policiesor its use of the exemptions in PFRS 1 after it has published an interim financial report in accordancewith PAS 34, Interim Financial Reporting’, it should explain those changes and update thereconciliations between previous GAAP and PFRS. The amendment also allows first-time adopters touse an event-driven fair value as deemed cost, even if the event occurs after the date of transition, butbefore the first PFRS financial statements are issued. When such re-measurement occurs after thedate of transition to PFRSs, but during the period covered by its first PFRS financial statements, anysubsequent adjustment to that event-driven fair value is recognized in equity.
It also clarifies that entities subject to rate regulation are allowed to use previous GAAP carryingamounts of property, plant and equipment or intangible assets as deemed cost on an item-by-itembasis. Entities that use this exemption are required to test each item for impairment under PAS 36 atthe date of transition.

(5)
PFRS 3, Business Combinations (effective July 1, 2010). The amendment clarifies that theamendments to PFRS 7, Financial Instruments: Disclosures, PAS 32, Financial Instruments:Presentation, and PAS 39, Financial instruments: Recognition and Measurement, that eliminate theexemption for contingent consideration, do not apply to contingent consideration that arose frombusiness combinations whose acquisition dates precede the application of PFRS 3 (as revised in 2008).
The amendment also clarifies that the choice of measuring non-controlling interests at fair value or atthe proportionate share of the acquiree’s net assets applies only to instruments that represent presentownership interests and entitle their holders to a proportionate share of the net assets in the event ofliquidation. All other components of non-controlling interest are measured at fair value unless anothermeasurement basis is required by PFRS.
It also clarifies that the application guidance in PFRS 3 applies to all share-based payment transactionsthat are part of a business combination, including unreplaced and voluntarily replaced share-basedpayment awards.
PFRS 7, Financial Instruments: Disclosures (effective January 1, 2011). The amendment emphasizesthe interaction between quantitative and qualitative disclosures about the nature and extent of risksassociated with financial instruments.
PFRS 7, Financial Instruments: Disclosures – Transfers of Financial Assets (effective July 1, 2011).The amendments will help users of financial statements evaluate the risk exposures relating to transfersof financial assets and the effect of those risks on an entity’s financial position and will promotetransparency in the reporting of transfer transactions, particularly those that involve securitization offinancial assets.
PAS 1, Presentation of Financial Statements (effective January 1, 2011). The amendment clarifies thatan entity will present an analysis of other comprehensive income for each component of equity, either inthe statement of changes in equity or in the notes to the financial statements.
PAS 27, Consolidated and Separate Financial Statements (effective July 1, 2010). The amendmentclarifies that the consequential amendments from PAS 27 made to PAS 21, The Effect of Changes inForeign Exchange Rates’, PAS 28, Investments in Associates’, and PAS 31, Interests in Joint Ventures,apply prospectively for annual periods beginning on or after July 1, 2009, or earlier when PAS 27 isapplied earlier.
PAS 34, Interim Financial Reporting (effective January 1, 2011). The amendment provides guidance toillustrate how to apply disclosure principles in PAS 34 and add disclosure requirements around:
- The circumstances likely to affect fair values of financial instruments and their classification;- Transfers of financial instruments between different levels of the fair value hierarchy;- Changes in classification of financial assets; and- Changes in contingent liabilities and assets
Philippines Interpretation IFRC 13, Customer Loyalty Program (effective January 1, 2011). Theamendment clarifies the meaning of ‘fair value’ in the context of measuring award credits undercustomer loyalty program.

(6)
2.3 Consolidation
The consolidated financial statements comprise the financial statements of the Parent Bank and all itsconsolidated subsidiaries. The subsidiaries’ financial statements are prepared for the same reportingperiods as the Parent Bank. The percentages of effective ownership of BPI in consolidated subsidiaries atDecember 31, 2010 and 2009 are as follows:
NameCountry of
incorporation Principal activities% of ownership
2010 2009BPI Family Savings Bank, Inc. Philippines Banking 100 100BPI Capital Corporation (BPICC) Philippines Investment house 100 100BPI Leasing Corporation Philippines Leasing 100 100BPI Direct Savings Bank, Inc. Philippines Banking 100 100BPI International Finance Limited Hong Kong Financing 100 100BPI Europe Plc. England and Wales Banking (deposit) 100 100BPI Securities Corp. Philippines Securities dealer 100 100BPI Card Finance Corp. Philippines Financing 100 100Filinvest Algo Financial Corp. Philippines Financing 100 100BPI Rental Corporation. Philippines Rental 100 100BPI Investment Management Inc. (BIMI) Philippines Investment management 100 100Santiago Land Dev. Corp. Philippines Land holding 100 100BPI Operations Management Corp. Philippines Operations management 100 100BPI Computer Systems Corp. Philippines Business systems service 100 100BPI Foreign Exchange Corp. Philippines Foreign exchange 100 100BPI Express Remittance Corp. USA USA Remittance 100 100BPI Express Remittance Center HK (Ltd.) Hong Kong Remittance 100 100BPI Express Remittance Europe, S.p.A. Italy Remittance 100 100FEB Insurance Brokers, Inc Philippines Insurance brokers 100 100Prudential Investments, Inc. Philippines Investment house 100 100First Far - East Development Corporation Philippines Real estate 100 100FEB Stock Brokers, Inc. Philippines Securities dealer 100 100Citytrust Securities Corporation Philippines Securities dealer 100 100BPI Asset Management, Inc. (BAMI) Philippines Investment management - 100BPI Express Remittance Spain S.A Spain Remittance 100 100Speed International Philippines Remittance 100 100BPI Bancassurance, Inc. (BPIBI) Philippines Bancassurance 100 100Ayala Plans, Inc. Philippines Pre-need 100 100FGU Insurance Corporation Philippines Non-life insurance 94.62 94.62Prudential Venture Capital Corporation Philippines Venture capital 60 60BPI/MS Insurance Corporation Philippines Non-life insurance 50.85 50.85BPI Globe BanKO Philippines Banking 40 -
On February 23, 2010, the articles of merger of BIMI and BAMI were approved by the SEC with BIMI assurviving entity.
Likewise, the articles of merger of BPICC and BPIBI were filed with the SEC on December 30, 2010. Theproposed merger which will make BPICC as the surviving entity has not yet been approved by the SEC as ofreporting date.
(a) Subsidiaries
Subsidiaries are all entities over which the BPI Group has the power to govern the financial and operatingpolicies generally accompanying a shareholding of more than one half of the voting rights. The existenceand effect of potential voting rights that are currently exercisable or convertible are considered whenassessing whether the BPI Group controls another entity. Subsidiaries are fully consolidated from the dateon which control is transferred to the BPI Group. They are de-consolidated from the date on which controlceases.

(7)
The BPI Group uses the acquisition method of accounting to account for business combinations. Theconsideration transferred for the acquisition of a subsidiary is the fair values of the assets transferred, theliabilities incurred and the equity interests issued by the BPI Group. The consideration transferred includesthe fair value of any asset or liability resulting from a contingent consideration arrangement. Acquisition-related costs are expensed as incurred. Identifiable assets acquired and liabilities and contingent liabilitiesassumed in a business combination are measured initially at their fair values at the acquisition date. On anacquisition-by-acquisition basis, the BPI Group recognizes any non-controlling interest in the acquiree eitherat fair value or at the non-controlling interest’s proportionate share of the acquiree’s net assets.
Investments in subsidiaries are accounted for at cost less impairment. Cost is adjusted to reflect changes inconsideration arising from contingent consideration amendments. Cost also includes direct attributablecosts of investment.
The excess of the consideration transferred, the amount of any non-controlling interest in the acquiree andthe acquisition-date fair value of any previous equity interest in the acquiree over the fair value of the BPIGroup’s share of the identifiable net assets acquired is recorded as goodwill. If this is less than the fairvalue of the net assets of the subsidiary acquired in the case of a bargain purchase, the difference isrecognized directly in the statement of total comprehensive income.
Inter-company transactions, balances and unrealized gains on transactions between group companies areeliminated. Unrealized losses are also eliminated. Accounting policies of subsidiaries have been changedwhere necessary to ensure consistency with the policies adopted by the BPI Group.
(b) Transactions with non-controlling interests
The BPI Group treats transactions with non-controlling interests as transactions with equity owners of thegroup. For purchases from non-controlling interests, the difference between any consideration paid and therelevant share acquired of the carrying value of net assets of the subsidiary is recorded in equity. Gains orlosses on disposals to non-controlling interests are also recorded in equity.
When the group ceases to have control or significant influence, any retained interest in the entity is re-measured to its fair value, with the change in carrying amount recognized in profit or loss. The fair value isthe initial carrying amount for the purposes of subsequently accounting for the retained interest as anassociate, joint venture or financial asset. In addition, any amounts previously recognized in othercomprehensive income in respect of that entity are accounted for as if the group had directly disposed of therelated assets or liabilities. This may mean that amounts previously recognized in other comprehensiveincome are reclassified to profit or loss.
If the ownership interest in an associate is reduced but significant influence is retained, only a proportionateshare of the amounts previously recognized in other comprehensive income are reclassified to profit or losswhere appropriate.

(8)
(c) Associates
Associates are all entities over which the BPI Group has significant influence but not control, generallyaccompanying a shareholding of between 20% and 50% of the voting rights. Investments in associates inthe consolidated financial statements are accounted for by the equity method of accounting and are initiallyrecognized at cost. The BPI Group’s investment in associates includes goodwill identified on acquisition(net of any accumulated impairment loss).
The BPI Group’s share of its associates’ post-acquisition profits or losses is recognized in the statement ofincome, and its share of post-acquisition movements in reserves is recognized in the statement of capitalfunds. The cumulative post-acquisition movements are adjusted against the carrying amount of theinvestment. When the BPI Group’s share of losses in an associate equals or exceeds its interest in theassociate, including any other unsecured receivables, it does not recognize further losses, unless it hasincurred obligations or made payments on behalf of the associate.
Intragroup gains on transactions between the BPI Group and its associates are eliminated to the extent of itsinterest in the associates. Intragroup losses are also eliminated unless the transaction provides evidence ofan impairment of the asset transferred. Accounting policies of associates have been changed wherenecessary to ensure consistency with the policies adopted by the BPI Group.
2.4 Investments in subsidiaries and associates
The financial statements include the consolidated financial statements of the BPI Group and the separatefinancial statements of the Parent Bank.
Investments in subsidiaries and associates in the Parent Bank’s separate financial statements areaccounted for at cost method in accordance with PAS 27. Under the cost method, income from investmentis recognized in the statement of income only to the extent that the investor receives distributions fromaccumulated net income of the investee arising subsequent to the date of acquisition.
The Parent Bank recognizes a dividend from a subsidiary or associate in the statement of income in itsseparate financial statements when its right to receive the dividend is established.
2.5 Segment reporting
Operating segments are reported in a manner consistent with the internal reporting provided to the chiefexecutive officer who allocates resources to and assesses the performance of the operating segments of theBPI Group.
All transactions between business segments are conducted on an arm´s length basis, with intra-segmentrevenue and costs being eliminated upon consolidation. Income and expenses directly associated with eachsegment are included in determining business segment performance.
In accordance with PFRS 8, the BPI Group has the following main banking business segments: consumerbanking, corporate banking and investment banking. Its insurance business is assessed separately fromthese banking business segments (Note 5).

(9)
2.6 Cash and cash equivalents
Cash and cash equivalents consist of Cash and other cash items, Due from Bangko Sentral ng Pilipinas(BSP) - clearing account, Due from other banks, and Interbank loans receivable and securities purchasedunder agreements to resell with maturities of less than three months from the date of acquisition and that aresubject to insignificant risk of changes in value.
2.7 Sale and repurchase agreements
Securities sold subject to repurchase agreements (‘repos’) are reclassified in the financial statements aspledged assets when the transferee has the right by contract or custom to sell or repledge the collateral; thecounterparty liability is included in deposits from banks or deposits from customers, as appropriate.Securities purchased under agreements to resell (‘reverse repos’) are treated as loans and advances andincluded in the statement condition under “Interbank loans receivable and securities purchased underagreements to resell” account. The difference between sale and repurchase price is treated as interest andaccrued over the life of the agreements using the effective interest method. Securities lent to counterpartiesare also retained in the financial statements.
2.8 Financial assets
2.8.1 Classification
The BPI Group classifies its financial assets in the following categories: financial assets at fair value throughprofit or loss, loans and receivables, held-to-maturity securities, and available-for-sale securities.Management determines the classification of its financial assets at initial recognition.
(a) Financial assets at fair value through profit or loss
This category has two sub-categories: financial assets held for trading, and those designated at fair valuethrough profit or loss at inception.
A financial asset is classified as held for trading if it is acquired principally for the purpose of selling orrepurchasing in the near term or if it is part of a portfolio of identified financial instruments that are managedtogether and for which there is evidence of a recent actual pattern of short-term profit-taking. Financialassets held for trading (other than derivatives) are shown as “Trading securities” in the statement ofcondition.
Financial assets designated at fair value through profit or loss at inception are those that are managed andtheir performance is evaluated on a fair value basis, in accordance with a documented investment strategy.Information about these financial assets is provided internally on a fair value basis to the BPI Group entity’skey management personnel. The BPI Group has no financial assets that are specifically designated at fairvalue through profit or loss.
Derivatives are also categorized as held for trading unless they are designated as hedging instruments.
(b) Loans and receivables
Loans and receivables are non-derivative financial assets with fixed or determinable payments (i) that arenot quoted in an active market, (ii) with no intention of trading, and (iii) that are not designated as available-for-sale. Significant accounts falling under this category are Loans and advances, Due from BSP (liquidityand statutory reserve account) and other banks, Interbank loans receivable and securities purchased underagreements to resell and other receivables under Other resources.
(c) Held-to-maturity securities
Held-to-maturity securities are non-derivative financial assets with fixed or determinable payments and fixedmaturities that the BPI Group’s management has the positive intention and ability to hold to maturity. If theBPI Group were to sell other than an insignificant amount of held-to-maturity assets, the entire categorywould be tainted and reclassified as available-for-sale.
(10)
(d) Available-for-sale securities
Available-for-sale securities are non-derivatives that are either designated in this category or not classified inany of the other categories.
2.8.2 Recognition and measurement
Regular-way purchases and sales of financial assets at fair value through profit or loss, held-to-maturitysecurities and available-for-sale securities are recognized on trade-date, the date on which the BPI Groupcommits to purchase or sell the asset. Loans and receivables recognized upon origination when cash isadvanced to the borrowers. Financial assets are initially recognized at fair value plus transaction costs forall financial assets not carried at fair value through profit or loss.
Available-for-sale securities and financial assets at fair value through profit or loss are subsequently carriedat fair value. Loans and receivables and held-to-maturity securities are subsequently carried at amortizedcost using the effective interest method. Gains and losses arising from changes in the fair value of thefinancial assets at fair value through profit or loss are included in the statement of income (as “Tradinggain/loss on securities”) in the year in which they arise. Gains and losses arising from changes in the fairvalue of available-for-sale securities are recognized directly in the statement of comprehensive income, untilthe financial asset is derecognized or impaired at which time the cumulative gain or loss previouslyrecognized in the statement of comprehensive income should be recognized in the statement of income.However, interest calculated on these securities using the effective interest method and foreign currencygains and losses on monetary assets classified as available-for-sale are recognized in the statement ofincome. Dividends on equity instruments are recognized in the statement of income when the BPI Group’sright to receive payment is established.
2.8.3 Financial asset reclassification
The BPI Group may choose to reclassify a non-derivative trading financial asset out of the held for tradingcategory if the financial asset is no longer held for the purpose of selling it in the near term. Financial assetsother than loans and receivables are permitted to be reclassified out of the held for trading category only inrare circumstances arising from a single event that is unusual and highly unlikely to recur in the near term.In addition, the BPI Group may choose to reclassify financial assets that would meet the definition of loansand receivables out of the held-for-trading or available-for-sale categories if the BPI Group has the intentionand ability to hold these financial assets for the foreseeable future or until maturity at the date ofreclassification.
Reclassifications are made at fair value as of the reclassification date. Fair value becomes the new cost oramortized cost as applicable, and no reversals of fair value gains or losses recorded before reclassificationdate are subsequently made. Effective interest rates for financial assets reclassified to loans andreceivables and held-to-maturity categories are determined at the reclassification date. Further increases inestimates of cash flows adjust effective interest rates prospectively.
2.8.4 Derecognition of financial assets
Financial assets are derecognized when the contractual rights to receive the cash flows from these assetshave ceased to exist or the assets have been transferred and substantially all the risks and rewards ofownership of the assets are also transferred (that is, if substantially all the risks and rewards have not beentransferred, the BPI Group tests control to ensure that continuing involvement on the basis of any retainedpowers of control does not prevent de-recognition).
2.9 Impairment of financial assets
(a) Assets carried at amortized cost
The BPI Group assesses at each balance sheet date whether there is objective evidence that a financialasset or group of financial assets is impaired. A financial asset or a group of financial assets is impaired andimpairment losses are incurred only if there is objective evidence of impairment as a result of one or moreevents that occurred after the initial recognition of the asset (a ‘loss event’) and that loss event (or events)has an impact on the estimated future cash flows of the financial asset or group of financial assets that canbe reliably estimated.

(11)
The criteria that the BPI Group uses to determine that there is objective evidence of an impairment lossinclude: Delinquency in contractual payments of principal or interest; Cash flow difficulties experienced by the borrower; Breach of loan covenants or conditions; Initiation of bankruptcy proceedings; Deterioration of the borrower’s competitive position; and Deterioration in the value of collateral
The BPI Group first assesses whether objective evidence of impairment exists individually for financialassets that are individually significant, and collectively for financial assets that are not individually significant.If the BPI Group determines that no objective evidence of impairment exists for an individually assessedfinancial asset, whether significant or not, it includes the asset in a group of financial assets with similarcredit risk characteristics and collectively assesses them for impairment. Financial assets that areindividually assessed for impairment and for which an impairment loss is or continues to be recognized arenot included in a collective assessment of impairment.
The amount of impairment loss is measured as the difference between the financial asset’s carrying amountand the present value of estimated future cash flows (excluding future credit losses that have not beenincurred) discounted at the asset’s original effective interest rate (recoverable amount). The calculation ofrecoverable amount of a collateralized financial asset reflects the cash flows that may result from foreclosureless costs of obtaining and selling the collateral, whether or not foreclosure is probable. If a loan or held-to-maturity investment has a variable interest rate, the discount rate for measuring any impairment loss is thecurrent effective interest rate determined under the contract. Impairment loss is recognized in the statementof income and the carrying amount of the asset is reduced through the use of an allowance account.
For the purposes of a collective evaluation of impairment, financial assets are grouped on the basis ofsimilar credit risk characteristics (i.e., on the basis of the BPI Group’s grading process that considers assettype, industry, geographical location, collateral type, past-due status and other relevant factors). Thosecharacteristics are relevant to the estimation of future cash flows for groups of such assets by beingindicative of the debtors’ ability to pay all amounts due according to the contractual terms of the assets beingevaluated.
Future cash flows in a group of financial assets that are collectively evaluated for impairment are estimatedon the basis of the contractual cash flows of the assets in the BPI Group and historical loss experience forassets with credit risk characteristics similar to those in the BPI Group. Historical loss experience is adjustedon the basis of current observable data to reflect the effects of current conditions that did not affect theperiod on which the historical loss experience is based and to remove the effects of conditions in thehistorical period that do not currently exist. The methodology and assumptions used for estimating futurecash flows are reviewed regularly to reduce any differences between loss estimates and actual lossexperience.
When a loan is uncollectible, it is written off against the related provision for loan impairment. Such loans arewritten off after all the necessary procedures have been completed and the amount of the loss has beendetermined.
If in a subsequent period, the amount of the impairment loss decreases and the decrease can be relatedobjectively to an event occurring after the impairment was recognized (such as an improvement in thedebtor’s credit rating), the previously recognized impairment loss is reversed by adjusting the allowanceaccount. The amount of the reversal is recognized in the statement of income as a reduction of impairmentlosses for the year.

(12)
(b) Assets classified as available-for-sale
The BPI Group assesses at each balance sheet date whether there is evidence that a debt securityclassified as available-for-sale is impaired. For an equity security classified as available-for-sale, asignificant or prolonged decline in the fair value below cost is considered in determining whether thesecurities are impaired. The cumulative loss (difference between the acquisition cost and the current fairvalue) is removed from capital funds and recognized in the statement of income when the asset isdetermined to be impaired. If in a subsequent period, the fair value of a debt instrument previously impairedincreases and the increase can be objectively related to an event occurring after the impairment loss wasrecognized, the impairment loss is reversed through the statement of income. Reversal of impairmentlosses recognized previously on equity instruments is made directly to capital funds.
(c) Renegotiated loans
Loans that are either subject to collective impairment assessment or individually significant and whose termshave been renegotiated are no longer considered to be past due but are treated as new loans.
2.10 Financial liabilities
The BPI Group classifies its financial liabilities in the following categories: financial liabilities at fair valuethrough profit or loss, and financial liabilities at amortized cost.
2.10.1 Classification and measurement of financial liabilities
(a) Financial liabilities at fair value through profit or loss
This category comprises two sub-categories: financial liabilities classified as held for trading, and financialliabilities designated by the BPI Group as at fair value through profit or loss upon initial recognition.
A financial liability is classified as held for trading if it is acquired or incurred principally for the purpose ofselling or repurchasing it in the near term or if it is part of a portfolio of identified financial instruments thatare managed together and for which there is evidence of a recent actual pattern of short-term profit-taking.Derivatives are also categorized as held for trading unless they are designated and effective as hedginginstruments. Gains and losses arising from changes in fair value of financial liabilities classified held fortrading are included in the statement of income. The BPI Group has no financial liabilities that aredesignated at fair value through profit loss.
(b) Other liabilities measured at amortized cost
Financial liabilities that are not classified as at fair value through profit or loss fall into this category and aremeasured at amortized cost. Financial liabilities measured at amortized cost include deposits fromcustomers and banks, amounts due to BSP, subordinated notes and other financial liabilities under Deferredcredits and other liabilities.
2.10.2 Derecognition of financial liabilities
Financial liabilities are derecognized when they have been redeemed or otherwise extinguished. Collateral(shares and bonds) furnished by the BPI Group under standard repurchase agreements and securitieslending and borrowing transactions is not de-recognized because the BPI Group retains substantially all therisks and rewards on the basis of the predetermined repurchase price, and the criteria for de-recognition aretherefore not met.
2.11 Determination of fair value of financial instruments
For financial instruments traded in active markets, the determination of fair values of financial assets andfinancial liabilities is based on quoted market prices or dealer price quotations. This includes listed equitysecurities and quoted debt instruments on major exchanges and broker quotes mainly from Bloomberg.

(13)
A financial instrument is regarded as quoted in an active market if quoted prices are readily and regularlyavailable from an exchange, dealer, broker, industry group, pricing service or regulatory agency, and thoseprices represent actual and regularly occurring market transactions on an arm’s length basis. If the abovecriteria are not met, the market is regarded as being inactive. Indications that a market is inactive are whenthere is a wide bid-offer spread or significant increase in the bid-offer spread or there are few recenttransactions.
For all other financial instruments, fair value is determined using valuation techniques. In these techniques,fair values are estimated from observable data in respect of similar financial instruments, using models toestimate the present value of expected future cash flows or other valuation techniques, using inputs (forexample, LIBOR yield curve, FX rates, volatilities and counterparty spreads) existing at reporting dates. TheBPI Group uses widely recognized valuation models for determining fair values of non-standardized financialinstruments of lower complexity, such as options or interest rate and currency swaps. For these financialinstruments, inputs into models are generally market observable.
For more complex instruments, the BPI Group uses internally developed models, which are usually basedon valuation methods and techniques generally recognized as standard within the industry. Valuationmodels are used primarily to value derivatives transacted in the over-the-counter market, unlisted debtsecurities (including those with embedded derivatives) and other debt instruments for which markets were orhave become illiquid. Some of the inputs to these models may not be market observable and are thereforeestimated based on assumptions.
The BPI Group uses its own credit risk spreads in determining the current value for its derivative liabilities.When the BPI Group’s credit spreads widen, the BPI Group recognizes a gain on these liabilities becausethe value of the liabilities has decreased. When the BPI Group’s credit spreads narrow, the BPI Grouprecognizes a loss on these liabilities because the value of the liabilities has increased.
The output of a model is always an estimate or approximation of a value that cannot be determined withcertainty, and valuation techniques employed may not fully reflect all factors relevant to the positions the BPIGroup holds. Valuations are therefore adjusted, where appropriate, to allow for additional factors includingmodel risks, liquidity risk and counterparty credit risk. Based on the established fair value modelgovernance policies, and related controls and procedures applied, management believes that thesevaluation adjustments are necessary and appropriate to fairly state the values of financial instrumentscarried at fair value in the statement of condition. Price data and parameters used in the measurementprocedures applied are generally reviewed carefully and adjusted, if necessary - particularly in view of thecurrent market developments.
The fair value of over-the-counter (OTC) derivatives is determined using valuation methods that arecommonly accepted in the financial markets, such as present value techniques and option pricing models.The fair value of foreign exchange forwards is generally based on current forward exchange rates.Structured interest rate derivatives are measured using appropriate option pricing models (for example, theBlack-Scholes model) or other procedures such as Monte Carlo simulation.
In cases when the fair value of unlisted equity instruments cannot be determined reliably, the instrumentsare carried at cost less impairment. The fair value for loans and advances as well as liabilities to banks andcustomers are determined using a present value model on the basis of contractually agreed cash flows,taking into account credit quality, liquidity and costs. The fair values of contingent liabilities and irrevocableloan commitments correspond to their carrying amounts.

(14)
2.12 Classes of financial instruments
The BPI Group classifies the financial instruments into classes that reflect the nature of information and takeinto account the characteristics of those financial instruments. The classification made can be seen in thetable below:
Classes (as determined by the BPI Group)Categories
(as defined by PAS 39) Main classes Sub-classesFinancialassets
Financial assets at fairvalue through profit orloss
- Trading securities - Debt securities- Equity securities
- Derivative financial assets
Loans and receivables
- Loans and advances to banks
- Loans and advancesto customers
- Loans toindividuals(retail)
- Real estatemortgages
- Auto loans- Credit cards- Others
- Loans tocorporateentities
- Large corporatecustomers
- Small andmediumenteprises
Held-to-maturityinvestments
- Investment securities(debt securities)
- Government- Others
Available-for-salefinancial assets
- Investment securities(debt securities)
- Government- Others
- Investment securities(equity securities)
- Listed- Unlisted
FinancialLiabilities
Financial liabilities at fairvalue through profit orloss
Derivative financial liabilities
Financial liabilities atamortized cost
- Deposits fromcustomers
- Demand- Savings- Time
- Deposits from banks- Unsecured subordinated debts- Bills payable- Other liabilities
Off-balancesheetfinancialinstruments
Loan commitments
Guarantees, acceptances and other financial facilities
2.13 Offsetting of financial instruments
Financial assets and liabilities are offset and the net amount reported in the statement of condition whenthere is a legally enforceable right to offset the recognized amounts and there is an intention to settle on anet basis, or realize the asset and settle the liability simultaneously.

(15)
2.14 Derivative financial instruments
Derivatives are initially recognized at fair value on the date on which a derivative contract is entered into andare subsequently re-measured at their fair value. Fair values are obtained from quoted market prices inactive markets, including recent market transactions, and valuation techniques, including discounted cashflow models and options pricing models, as appropriate. All derivatives are carried as assets when fair valueis positive and as liabilities when fair value is negative.
Certain derivatives embedded in other financial instruments are treated as separate derivatives when theireconomic characteristics and risks are not closely related to those of the host contract and the host contractis not carried at fair value through profit or loss. The assessment of whether an embedded derivative isrequired to be separated from the host contract is done when the BPI Group first becomes a party to thecontract. Reassessment of embedded derivative is only done when there are changes in the contract thatsignificantly modify the contractual cash flows. The embedded derivatives are measured at fair value withchanges in fair value recognized in the statement of income.
The BPI Group’s derivative instruments do not qualify for hedge accounting. Changes in the fair value ofany derivative instrument that does not qualify for hedge accounting are recognized immediately in thestatement of income under “Trading gain/loss on securities”.
2.15 Bank premises, furniture, fixtures and equipment
Land and buildings comprise mainly of branches and offices. All bank premises, furniture, fixtures andequipment are stated at historical cost less accumulated depreciation. Historical cost includes expenditurethat is directly attributable to the acquisition of the items which comprises its purchase price, import dutiesand any directly attributable costs of bringing the asset to its working condition and location for its intendeduse.
Subsequent costs are included in the asset’s carrying amount or are recognized as a separate asset, asappropriate, only when it is probable that future economic benefits associated with the item will flow to theBPI Group and the cost of the item can be measured reliably. All other repairs and maintenance arecharged to the statement of income during the year in which they are incurred.
Depreciation for buildings and furniture and equipment is calculated using the straight-line method toallocate cost or residual values over the estimated useful lives of the assets, as follows:
Building 25-50 yearsFurniture and equipment 3-5 yearsEquipment for lease 2-8 years
Leasehold improvements are depreciated over the shorter of the lease term (normally ranging from 5 - 10years) and the useful life of the related improvement. Major renovations are depreciated over the remaininguseful life of the related asset.
The assets’ residual values and useful lives are reviewed, and adjusted if appropriate, at each reportingdate. Assets are reviewed for impairment whenever events or changes in circumstances indicate that thecarrying amount may not be recoverable.
An asset’s carrying amount is written down immediately to its recoverable amount if the asset’s carryingamount is greater than its estimated recoverable amount. The recoverable amount is the higher of anasset’s fair value less costs to sell and value in use.
An item of bank premises, furniture, fixtures and equipment is derecognized upon disposal or when no futureeconomic benefits are expected to arise from the continued use of the asset. Any gain or loss arising onderecognition of the asset (calculated as the difference between the net disposal proceeds and the carryingamount of the item) is included in profit or loss in the period the item is derecognized.
Gains and losses on disposals are determined by comparing proceeds with carrying amount and arerecognized in the statement of income.

(16)
2.16 Investment properties
Properties that are held either to earn rental income or for capital appreciation or for both and that are notsignificantly occupied by the BPI Group are classified as investment properties.
Investment properties comprise land and building. Investment properties are measured initially at cost,including transaction costs. Subsequent to initial recognition, investment properties are stated at cost lessaccumulated depreciation. Depreciation on investment property is determined using the same policy asapplied to Bank premises, furniture, fixtures, and equipment. Impairment test is conducted when there is anindication that the carrying amount of the asset may not be recovered. An impairment loss is recognized forthe amount by which the property’s carrying amount exceeds its recoverable amount, which is the higher ofthe property’s fair value less costs to sell and value in use.
2.17 Foreclosed assets
Assets foreclosed shown as Assets held for sale in the statement of condition are accounted for at the lowerof cost and fair value less cost to sell similar to the principles of PFRS 5. The cost of assets foreclosedincludes the carrying amount of the related loan less allowance for impairment at the time of foreclosure.Impairment loss is recognized for any subsequent write-down of the asset to fair value less cost to sell.
Foreclosed assets not classified as Assets held for sale are accounted for in any of the followingclassification using the measurement basis appropriate to the asset as follows:
(a) Investment property is accounted for using the cost model under PAS 40;
(b) Bank-occupied property is accounted for using the cost model under PAS 16; and
(c) Financial assets are classified as available-for-sale
2.18 Intangible assets
(a) Goodwill
Goodwill represents the excess of the cost of an acquisition over the fair value of the BPI Group’s share inthe net identifiable assets of the acquired subsidiary/associate at the date of acquisition. Goodwill onacquisitions of subsidiaries is included in “Miscellaneous assets” under Other resources. Goodwill onacquisitions of associates is included in Investments in subsidiaries and associates. Separately recognizedgoodwill is tested annually for impairment and carried at cost less accumulated impairment losses. Gainsand losses on the disposal of a subsidiary/associate include carrying amount of goodwill relating to thesubsidiary/associate sold.
Goodwill is allocated to cash-generating units for the purpose of impairment testing. Each cash-generatingunit is represented by each primary reporting segment.
(b) Computer software
Acquired computer software licenses are capitalized on the basis of the costs incurred to acquire and bringto use the specific software. These costs are amortized on the basis of the expected useful lives (three tofive years). Computer software is included in “Miscellaneous assets” under Other resources.

(17)
Costs associated with developing or maintaining computer software programs are recognized as an expenseas incurred. Development costs that are directly attributable to the design and testing of identifiable andunique software products controlled by the BPI Group are recognized as intangible assets when the followingcriteria are met:
it is technically feasible to complete the software product so that it will be available for use; management intends to complete the software product and use or sell it; there is an ability to use or sell the software product; it can be demonstrated how the software product will generate probable future economic benefits; adequate technical, financial and other resources to complete the development and to use or sell the
software product are available; and the expenditure attributable to the software product during its development can be reliably measured.
2.19 Borrowings
The BPI Group’s borrowings consist mainly of bills payable and unsecured subordinated debt. Borrowingsare recognized initially at fair value, being their issue proceeds, net of transaction costs incurred.Borrowings are subsequently stated at amortized cost; any difference between the proceeds, net oftransaction costs and the redemption value is recognized in the statement of income over the period of theborrowings using the effective interest method.
Effective January 1, 2009, borrowing costs that are directly attributable to the acquisition, construction orproduction of a qualifying asset are capitalized as part of the cost of the asset. All other borrowing costs areexpensed as incurred.
2.20 Interest income and expense
Interest income and expense are recognized in the statement of income for all interest-bearing financialinstruments using the effective interest method.
The effective interest method is a method of calculating the amortized cost of a financial asset or a financialliability and of allocating the interest income or interest expense over the relevant period. The effectiveinterest rate is the rate that exactly discounts estimated future cash payments or receipts through theexpected life of the financial instrument or when appropriate, a shorter period to the net carrying amount ofthe financial asset or financial liability.
When calculating the effective interest rate, the BPI Group estimates cash flows considering all contractualterms of the financial instrument but does not consider future credit losses. The calculation includes all feespaid or received between parties to the contract that are an integral part of the effective interest rate,transaction costs and all other premiums or discounts.
Once a financial asset or a group of similar financial assets has been written down as a result of animpairment loss, interest income is recognized using the rate of interest used to discount future cash flowsfor the purpose of measuring impairment loss.
2.21 Fee and commission income
Fees and commissions are generally recognized on an accrual basis when the service has been provided.Commission and fees arising from negotiating or participating in the negotiation of a transaction for a thirdparty (i.e. the arrangement of the acquisition of shares or other securities, or the purchase or sale ofbusinesses) are recognized on completion of underlying transactions. Portfolio and other managementadvisory and service fees are recognized based on the applicable service contracts, usually on a time-proportionate basis. Asset management fees related to investment funds are recognized ratably over theperiod in which the service is provided.
2.22 Dividend income
Dividend income is recognized in the statement of income when the BPI Group’s right to receive payment isestablished.

(18)
Change in accounting policy
The BPI Group has changed its accounting policy for dividends paid out of pre-acquisition profits fromJuly 1, 2009 when the revised PAS 27, ‘Consolidated and separate financial statements’, became effective.Previously, dividends paid out of pre-acquisition profits were deducted from the cost of the investment. Thenew accounting policy is applied prospectively in accordance with the transition provisions. It was thereforenot necessary to make any adjustments to any of the amounts previously recognized in the financialstatements.
2.23 Credit card income
Credit card income is recognized upon receipt from merchants of charges arising from credit cardtransactions. These are computed based on rates agreed with merchants and are deducted from thepayments to establishments.
2.24 Foreign currency translation
(a) Functional and presentation currency
Items in the financial statements of each entity in the BPI Group are measured using the currency of theprimary economic environment in which the entity operates (“the functional currency”). The financialstatements are presented in Philippine Peso, which is the Parent Bank’s functional and presentationcurrency.
(b) Transactions and balances
Foreign currency transactions are translated into the functional currency using the exchange rates prevailingat the dates of the transactions. Foreign exchange gains and losses resulting from the settlement of suchtransactions and from the translation at year-end exchange rates of monetary assets and liabilitiesdenominated in foreign currencies are recognized in the statement of income. Non-monetary itemsmeasured at historical cost denominated in a foreign currency are translated at exchange rate as at the dateof initial recognition. Non-monetary items in a foreign currency that are measured at fair value are translatedusing the exchange rate at the date when the fair value is determined.
Changes in the fair value of monetary securities denominated in foreign currency classified as available-for-sale are analyzed between translation differences resulting from changes in the amortized cost of thesecurity, and other changes in the carrying amount of the security. Translation differences are recognized inprofit or loss, and other changes in carrying amount are recognized in capital funds.
Translation differences on non-monetary financial instruments, such as equities held at fair value throughprofit or loss, are reported as part of the fair value gain or loss. Translation differences on non-monetaryfinancial instruments, such as equities classified as available-for-sale, are included in Accumulated othercomprehensive income (loss) in the capital funds.
(c) Foreign subsidiaries
The results and financial position of BPI’s foreign subsidiaries (none of which has the currency of ahyperinflationary economy) that have a functional currency different from the presentation currency aretranslated into the presentation currency as follows:
(i) assets and liabilities are translated at the closing rate at reporting date;
(ii) income and expenses are translated at average exchange rates (unless this average is not areasonable approximation of the cumulative effect of the rates prevailing on the transaction dates,in which case income and expenses are translated at the dates of the transactions); and
(iii) all resulting exchange differences are recognized as a separate component (Translationadjustments) of Accumulated other comprehensive income (loss) in the capital funds. When aforeign operation is sold, such exchange differences are recognized in the statement of income aspart of the gain or loss on sale.

(19)
2.25 Accrued expenses and other liabilities
Accrued expenses and other liabilities are recognized in the period in which the related money, goods orservices are received or when a legally enforceable claim against the BPI Group is established.
2.26 Provisions for legal or contractual obligations
Provisions are recognized when the BPI Group has a present legal or constructive obligation as a result of pastevents; it is more likely than not that an outflow of resources will be required to settle the obligation; and theamount has been reliably estimated. Provisions are not recognized for future operating losses.
Provisions are measured at the present value of the expenditures expected to be required to settle theobligation using a pre-tax rate that reflects the current market assessment of the time value of money and therisk specific to the obligation. The increase in the provision due to the passage of time is recognized as interestexpense.
2.27 Income taxes
(a) Current income tax
Income tax payable is calculated on the basis of the applicable tax law in the respective jurisdiction and isrecognized as an expense for the year except to the extent that current tax related to items (for example,current tax on available-for-sale investments) that are charged or credited in other comprehensive income ordirectly to capital funds.
The BPI Group has substantial income from its investment in government securities subject to final withholdingtax. Such income is presented at its gross amount and the tax paid or withheld is included in Current provisionfor income tax.
(b) Deferred income tax
Deferred income tax is provided in full, using the liability method, on temporary differences arising betweenthe tax bases of assets and liabilities and their carrying amounts in the financial statements. The deferredincome tax is not accounted for if it arises from initial recognition of an asset or liability in a transaction, otherthan a business combination, that at the time of the transaction affects neither accounting nor taxable profitor loss. Deferred income tax is determined using tax rates (and laws) that have been enacted orsubstantially enacted by the reporting date and are expected to apply when the related deferred income taxasset is realized or the deferred income tax liability is settled.
Deferred income tax assets are recognized for all deductible temporary differences, carry-forward of unusedtax losses (net operating loss carryover or NOLCO) and unused tax credits (excess minimum corporateincome tax or MCIT) to the extent that it is probable that future taxable profit will be available against whichthe temporary differences can be utilized.
The BPI Group reassesses at each balance sheet date the need to recognize a previously unrecognizeddeferred income tax asset.
(c) Recent tax laws and significant regulations
Republic Act 9337 (the Act), which was passed into law in May 2005, amended certain provisions of theNational Internal Revenue Code of 1997. The more salient provisions of the Act included: 1) change innormal corporate income tax from 32% to 35% effective November 1, 2005 and from 35% to 30% effectiveJanuary 1, 2009; 2) change in allowable deduction for interest expense from 38% to 42% effectiveNovember 1, 2005 and from 42% to 33% beginning January 1, 2009; and 3) revision of gross receipts tax(GRT) rates.
On December 20, 2008, Revenue Regulations No. 16-2008 on the Optional Standard Deduction (OSD) waspublished. The regulation prescribed the rules for the OSD application by corporations in the computation oftheir final taxable income. The BPI Group did not avail of the OSD for purposes of income tax calculation in2010 and 2009.

(20)
On December 28, 2010, Revenue Regulation (RR) No. 15-2010 became effective and amended certainprovisions of RR No. 21-2002 prescribing the manner of compliance with any documentary and/or proceduralrequirements in connection with the preparation and submission of financial statements, income tax returnsand information on taxes, duties and license fees paid or accrued during the year.
2.28 Employee benefits
(a) Pension obligations
The BPI Group operates various pension schemes. The schemes are funded through payments to trustee-administered funds, determined by periodic actuarial calculations. The BPI Group has a defined benefit planthat shares risks among entities within the group. A defined benefit plan is a pension plan that defines anamount of pension benefit that an employee will receive on retirement, usually dependent on one or morefactors such as age, years of service and compensation.
The liability recognized in the statement of condition in respect of defined benefit pension plan is the presentvalue of the defined benefit obligation at the reporting date less the fair value of plan assets, together withadjustments for unrecognized actuarial gains or losses and past service costs. The defined benefitobligation is calculated annually by independent actuaries using the projected unit credit method. Thepresent value of the defined benefit obligation is determined by discounting the estimated future cashoutflows using interest rates of government bonds that are denominated in the currency in which the benefitswill be paid, and that have terms to maturity approximating the terms of the related pension liability.
Cumulative actuarial gains and losses arising from experience adjustments and changes in actuarialassumptions in excess of the greater of 10% of the value of plan assets or 10% of the defined benefitobligation are spread to income over the employees’ expected average remaining working lives.
Past-service costs are recognized immediately in income, unless the changes to the pension plan areconditional on the employees remaining in service for a specified period of time (the vesting period). In thiscase, the past-service costs are amortized on a straight-line basis over the vesting period.
Where the calculation results in a benefit to the BPI Group, the recognized asset is limited to the net total ofany unrecognized actuarial losses and past service costs, and the present value of any reductions in futurecontributions to the plan.
For individual financial reporting purposes, the unified plan assets are allocated among the BPI Groupentities based on the level of the defined benefit obligation attributable to each entity to arrive at the netliability or asset that should be recognized in the individual financial statements.
(b) Share-based compensation
The BPI Group engages in equity settled share-based payment transaction in respect of services receivedfrom certain of its employees.
The fair value of the services received is measured by reference to the fair value of the shares or shareoptions granted on the date of the grant. The cost employee services received in respect of the shares orshare options granted is recognized in the statement of income (with a corresponding increase in reserve incapital funds) over the period that the services are received, which is the vesting period.
The fair value of the options granted is determined using option pricing models which take into account theexercise price of the option, the current share price, the risk-free interest rate, the expected volatility of theshare price over the life of the option and other relevant factors.
When the stock options are exercised, the proceeds received, net of any directly attributable transactioncosts, are credited to capital stock (par value) and paid-in surplus for the excess of exercise price over parvalue.

(21)
2.29 Capital funds
Common shares are classified as share capital.
Share premium includes any premiums or consideration received in excess of par value on the issuance ofshare capital.
Incremental costs directly attributable to the issue of new shares or options are shown in capital funds as adeduction from the proceeds, net of tax.
2.30 Earnings per share (EPS)
Basic EPS is calculated by dividing income applicable to common shares by the weighted average numberof common shares outstanding during the year with retroactive adjustments for stock dividends. DilutedEPS is computed in the same manner as basic EPS, however, net income attributable to common sharesand the weighted average number of shares outstanding are adjusted for the effects of all dilutive potentialcommon shares.
2.31 Dividends on common shares
Dividends on common shares are recognized as a liability in the BPI Group’s financial statements in the year inwhich they are approved by the Board of Directors and the BSP.
2.32 Fiduciary activities
The BPI Group commonly acts as trustees and in other fiduciary capacities that result in the holding or placingof assets on behalf of individuals, trusts, retirement benefit plans and other institutions. These assets andincome arising thereon are excluded from these financial statements, as they are not assets of the BPI Group(Note 31).
2.33 Leases
(a) BPI Group is the lessee
(i) Operating lease - leases in which substantially all risks and rewards of ownership are retained byanother party, the lessor, are classified as operating leases. Payments, including prepayments,made under operating leases (net of any incentives received from the lessor) are charged to thestatement of income on a straight-line basis over the period of the lease.
(ii) Finance lease - leases of assets where the BPI Group has substantially all the risks and rewards ofownership are classified as finance leases. Finance leases are capitalized at the commencementof the lease at the lower of the fair value of the leased property and the present value of theminimum lease payments. Each lease payment is allocated between the liability and financecharges so as to achieve a constant rate on the finance balance outstanding. The interest elementof the finance cost is charged to the statement of income over the lease period so as to produce aconstant periodic rate of interest on the remaining balance of the liability for each period.
(b) BPI Group is the lessor
(i) Operating lease - properties (land and building) leased out under operating leases are included in“Investment properties” in the statement of condition. Rental income under operating leases isrecognized in the statement of income on a straight-line basis over the period of the lease.
(ii) Finance lease - when assets are leased out under a finance lease, the present value of the leasepayments is recognized as a receivable. The difference between the gross receivable and thepresent value of the receivable is recognized as unearned finance income.
(22)
Lease income under finance lease is recognized over the term of the lease using the net investment methodbefore tax, which reflects a constant periodic rate of return.
2.34 Insurance operations
(a) Life insurance
The BPI’s life insurance subsidiary issues contracts that transfer insurance risk or financial risk or both.Insurance contracts are those contracts that transfer significant insurance risk. Such risks include thepossibility of having to pay benefits on the occurrence of an insured event such as death, accident, ordisability. The subsidiary may also transfer insurance risk in insurance contracts through its reinsurancearrangements; to hedge against a greater possibility of claims occurring than expected. As a generalguideline, the subsidiary defines as significant insurance risk the possibility of having to pay benefits on theoccurrence of an insured event that are at least 10% more than the benefits payable if the insured event didnot occur.
Investment contracts are those contracts that transfer financial risk with no significant insurance risk.
The more significant of the accounting principles of the life insurance subsidiary follow: (a) premiums arisingfrom insurance contracts are recognized as revenue when received and on the issue date of the insurancepolicies for the first year premiums; (b) commissions and other acquisition costs are expensed as incurred; (c)financial assets and liabilities are measured following the classification and valuation provisions of PAS 39;and (d) a liability adequacy test is performed at each balance sheet date which compares the subsidiary’sreported insurance contract liabilities against current best estimates of future cash flows and claimshandling, and policy administration expenses as well as investment income from assets backing suchliabilities, with any deficiency immediately charged to income by establishing a provision for losses arisingfrom liability adequacy tests.
(b) Non-life insurance
The more significant accounting policies observed by the non-life insurance subsidiary follow: (a) grosspremiums written from short term insurance contracts are recognized at the inception date of the risksunderwritten and are earned over the period of cover in accordance with the incidence of risk using the 24thmethod; (b) acquisition costs are deferred and charged to expense in proportion to the premium revenuerecognized; reinsurance commissions are deferred and deducted from the applicable deferred acquisitioncosts, subject to the same amortization method as the related acquisition costs; (c) a liability adequacy test isperformed which compares the subsidiary’s reported insurance contract liabilities against current bestestimates of all contractual future cash flows and claims handling, and policy administration expenses aswell as investment income backing up such liabilities, with any deficiency immediately charged to income;(d) amounts recoverable from reinsurers and loss adjustment expenses are classified as assets, with anallowance for estimated uncollectible amounts; and (e) financial assets and liabilities are measured followingthe classification and valuation provisions of PAS 39.
(c) Pre-need
The more significant provisions of the PNUCA as applied by the pre-need subsidiary follow: (a) premiumincome from sale of pre-need plans is recognized as earned when collected; (b) costs of contracts issuedand other direct costs and expenses are recognized as expense when incurred; (c) pre-need reserves whichrepresent the accrued net liabilities of the subsidiary to its planholders are actuarially computed based onstandards and guidelines set forth by the SEC; the increase or decrease in the account is charged orcredited to other costs of contracts issued in the statement of income; and (d) insurance premium reserveswhich represent the amount that must be set aside by the subsidiary to pay for premiums for insurancecoverage of fully paid planholders, are actuarially computed based on standards and guidelines set forth bythe SEC.

(23)
2.35 Related party relationships and transactions
Related party relationship exists when one party has the ability to control, directly, or indirectly through one ormore intermediaries, the other party or exercise significant influence over the other party in making financialand operating decisions. Such relationship also exists between and/or among entities which are undercommon control with the reporting enterprise, or between, and/or among the reporting enterprise and its keymanagement personnel, directors, or its shareholders. In considering each possible related party relationship,attention is directed to the substance of the relationship, and not merely the legal form.
2.36 Comparatives
Except when a standard or an interpretation permits or requires otherwise, all amounts are reported ordisclosed with comparative information.
Where PAS 8 applies, comparative figures have been adjusted to conform with changes in presentation in thecurrent year.
2.37 Subsequent events (or Events after balance sheet date)
Post year-end events that provide additional information about the BPI Group’s financial position at balancesheet date (adjusting events) are reflected in the financial statements. Post year-end events that are notadjusting events are disclosed in the notes to financial statements when material.
Note 3 - Financial Risk and Capital Management
Risk management in the BPI Group covers all perceived areas of risk exposure, even as it continuouslyendeavors to uncover hidden risks. Capital management is understood to be a facet of risk management. TheBoard of Directors sets the Group’s management tone by specifying the parameters by which business risksare to be taken and by allocating the appropriate capital for absorbing potential losses from such risks.
The primary objective of the BPI Group is the generation of recurring acceptable returns to shareholders’capital. To this end, the BPI Group’s policies, business strategies, and business activities are directed towardsthe generation of cash flows that are in excess of its fiduciary and contractual obligations to its depositors, andto its various other funders and stakeholders.
To generate acceptable returns to its shareholders’ capital, the BPI Group understands that it has to bear risk,that risk-taking is inherent in its business. Risk is understood by the BPI Group as the uncertainty in its futureincomes - an uncertainty that emanates from the possibility of incurring losses that are due to unplanned andunexpected drops in revenues, increases in expenses, impairment of asset values, or increases in liabilities.
The possibility of incurring losses is, however, compensated by the possibility of earning more than expectedincomes. Risk-taking is, therefore, not entirely bad to be avoided. Risk-taking presents opportunities if risksare accounted, deliberately taken, and are kept within rationalized limits.
The Risk Management Office (RMO) and the Finance and Risk Management Committee (FRMC) areresponsible for the management of market and liquidity risks. Their objective is to minimize adverse impactson the BPI Group’s financial performance due to the unpredictability of financial markets. Market and creditrisks management is carried out through policies approved by the Risk Management Committee(RMC)/Executive Committee/Board of Directors. In addition, Internal Audit is responsible for the independentreview of risk assessment measures and procedures and the control environment. For risk managementpurposes, risks emanating from Treasury activities are managed independently.
The most important risks that the BPI Group manages are credit risk, liquidity risk, market risk and otheroperational risk. Market risk includes currency exchange risk, interest rate and other price risks.

(24)
3.1 Credit risk
The BPI Group takes on exposure to credit risk, which is the risk that a counterparty will cause a financial lossto the BPI Group by failing to discharge an obligation. Significant changes in the economy, or in the prospectsof a particular industry segment that may represent a concentration in the BPI Group’s portfolio, could result inlosses that are different from those provided for at the reporting date. Management therefore carefullymanages its exposure to credit risk. Credit exposures arise principally in loans and advances, debt securitiesand other bills. There is also credit risk in off-balance sheet financial arrangements. The Credit Policy Groupworks with the Credit Committee in managing credit risk, and reports are regularly provided to the Board ofDirectors.
3.1.1 Credit risk management
(a) Loans and advances
In measuring credit risk of loans and advances at a counterparty level, the BPI Group considers threecomponents: (i) the probability of default by the client or counterparty on its contractual obligations; (ii)current exposures to the counterparty and its likely future development; and (iii) the likely recovery ratio onthe defaulted obligations. In the evaluation process, the BPI Group also considers the conditions of theindustry/sector to which the counterparty is exposed, other existing exposures to the group where thecounterparty may be related, as well as the client and the BPI Group’s fallback position assuming the worst-case scenario. Outstanding and potential credit exposures are reviewed to likewise ensure that theyconform to existing internal credit policies.
The BPI Group assesses the probability of default of individual counterparties using internal rating toolstailored to the various categories of counterparty. The BPI Group has internal credit risk rating systemsdesigned for corporate, small and medium-sized enterprises (SMEs), and retail accounts. For corporate andSMEs, the rating system is a 10-point scale that measures the borrower's credit risk based on quantitativeand qualitative factors. The ratings of individual exposures may subsequently migrate between classes asthe assessment of their probabilities of default changes. For retail, the consumer credit scoring system is aformula-based model for evaluating each credit application against a set of characteristics that experiencehas shown to be relevant in predicting repayment. The BPI Group regularly validates the performance of therating systems and their predictive power with regard to default events, and enhances them if necessary.The BPI Group's internal ratings are mapped to the following standard BSP classifications:
Unclassified - these are loans that do not have a greater-than-normal risk and do not possess thecharacteristics of loans classified below. The counterparty has the ability to satisfy the obligation in fulland therefore minimal loss, if any, is anticipated.
Loans especially mentioned - these are loans that have potential weaknesses that deservemanagement’s close attention. These potential weaknesses, if left uncorrected, may affect therepayment of the loan and thus increase the credit risk of the BPI Group.
Substandard - these are loans which appear to involve a substantial degree of risk to the BPI Groupbecause of unfavorable record or unsatisfactory characteristics. Further, these are loans with well-defined weaknesses which may include adverse trends or development of a financial, managerial,economic or political nature, or a significant deterioration in collateral.
Doubtful - these are loans which have the weaknesses similar to those of the substandard classificationwith added characteristics that existing facts, conditions, and values make collection or liquidation in fullhighly improbable and substantial loss is probable.
Loss - these are loans which are considered uncollectible and of such little value that their continuanceas bankable assets is not warranted although the loans may have some recovery or salvage value.
(25)
(b) Debt securities and other bills
For debt securities and other bills, external ratings such as Standard & Poor’s, Moody’s and Fitch’s ratingsor their equivalents are used by the BPI Group for managing credit risk exposures. Investments in thesesecurities and bills are viewed as a way to gain better credit quality mix and at the same time, maintain areadily available source to meet funding requirements.
3.1.2 Risk limit control and mitigation policies
The BPI Group manages, limits and controls concentrations of credit risk wherever they are identified - inparticular, to individual counterparties and groups, to industries and sovereigns.
The BPI Group structures the levels of credit risk it undertakes by placing limits on the amount of riskaccepted in relation to one borrower, or groups of borrowers, and to geographical and industry segments.Such risks are monitored on a regular basis and subject to an annual or more frequent review, whenconsidered necessary. Limits on large exposures and credit concentration are approved by the Board ofDirectors.
The exposure to any one borrower is further restricted by sub-limits covering on- and off-balance sheetexposures. Actual exposures against limits are monitored regularly.
Exposure to credit risk is also managed through regular analysis of the ability of existing and potentialborrowers to meet interest and capital repayment obligations and by changing these lending limits whereappropriate.
The BPI Group employs a range of policies and practices to mitigate credit risk. Some of these specificcontrol and mitigation measures are outlined below.
(a) Collateral
One of the most traditional and common practice in mitigating credit risk is requiring security particularly forloans and advances. The BPI Group implements guidelines on the acceptability of specific classes ofcollateral for credit risk mitigation. The principal collateral types for loans and advances are:
Mortgages over real estate properties and chattels; and Hold-out on financial instruments such as debt securities deposits, and equities
In order to minimize credit loss, the BPI Group seeks additional collateral from the counterparty whenimpairment indicators are observed for the relevant individual loans and advances.
(b) Derivatives
The BPI Group maintains strict market limits on net open derivative positions (i.e., the difference betweenpurchase and sale contracts). Credit risk is limited to the net current fair value of instruments, which in relationto derivatives is only a small fraction of the contract, or notional values used to express the volume ofinstruments outstanding. This credit risk exposure is managed as part of the overall lending limits withcustomers, together with potential exposures from market movements. Collateral or other security is notusually obtained for credit risk exposures on these instruments (except where the BPI Group requires margindeposits from counterparties).
Settlement risk arises in any situation where a payment in cash, securities, foreign exchange currencies, orequities is made in the expectation of a corresponding receipt in cash, securities, foreign exchange currencies,or equities. Daily settlement limits are established for each counterparty to cover the aggregate of allsettlement risk arising from the BPI Group’s market transactions on any single day. The introduction of thedelivery versus payment facility in the local market has brought down settlement risk significantly.

(26)
(c) Master netting arrangements
The BPI Group further restricts its exposure to credit losses by entering into master netting arrangements withcounterparties with which it undertakes a significant volume of transactions. Master netting arrangements donot generally result in an offset of balance sheet assets and liabilities, as transactions are usually settled on agross basis. However, the credit risk associated with favorable contracts (asset position) is reduced by amaster netting arrangement to the extent that if a default occurs, all amounts with the counterparty areterminated and settled on a net basis. The BPI Group’s overall exposure to credit risk on derivativeinstruments subject to master netting arrangements can change substantially within a short period, as it isaffected by each transaction subject to the arrangement.
(d) Credit-related commitments
The primary purpose of these instruments is to ensure that funds are available to a customer as required.Standby letters of credit carry the same credit risk as loans. Documentary and commercial letters of credit -which are written undertakings by the BPI Group on behalf of a customer authorizing a third party to drawdrafts on the BPI Group up to a stipulated amount under specific terms and conditions - are collateralized bythe underlying shipments of goods to which they relate and therefore carry less risk than a direct loan.
Commitments to extend credit represent unused portions of authorizations to extend credit in the form of loans,or letters of credit. With respect to credit risk on commitments to extend credit, the BPI Group is potentiallyexposed to loss in an amount equal to the total unused commitments. However, the likely amount of loss isless than the total unused commitments, as most commitments to extend credit are contingent upon customersmaintaining specific credit standards. The BPI Group monitors the term to maturity of credit commitmentsbecause longer-term commitments generally have a greater degree of credit risk than shorter-termcommitments.
3.1.3 Impairment and provisioning policies
As described in Note 3.1.1, the BPI Group’s credit-quality mapping on loans and advances is based on thestandard BSP loan classifications. Impairment provisions are recognized for financial reporting purposesbased on objective evidence of impairment (Note 2.8).
The table below shows the percentage of the BPI Group’s loans and advances and the related allowance forimpairment.
Consolidated2010 2009
Loans andadvances (%)
Allowance forimpairment (%)
Loans andadvances (%)
Allowance forimpairment (%)
Unclassified 95.81 0.45 95.46 0.42Loans especially mentioned 0.70 5.04 0.70 5.57Substandard 1.34 23.98 1.45 17.34Doubtful 0.91 65.94 1.07 61.42Loss 1.24 100.00 1.32 100.00
100.00 100.00

(27)
Parent2010 2009
Loans andadvances (%)
Allowance forimpairment (%)
Loans andadvances (%)
Allowance forimpairment (%)
Unclassified 95.99 0.42 95.41 0.41Loans especially mentioned 0.80 5.03 0.64 5.02Substandard 0.87 16.09 1.52 16.54Doubtful 0.99 63.78 0.95 62.56Loss 1.35 100.00 1.48 100.00
100.00 100.00
3.1.4 Maximum exposure to credit risk before collateral held or other credit enhancements
Credit risk exposures relating to significant on-balance sheet financial assets are as follows:
Consolidated Parent2010 2009 2010 2009
(In Millions of Pesos)Due from BSP 128,487 62,744 117,805 54,465Due from other banks 6,548 7,147 3,209 3,363Interbank loans receivable and securities
purchased under agreements to resell (SPAR) 66,834 52,546 56,237 46,160Financial assets at fair value through profit or loss
Derivative financial assets 6,059 2,146 6,059 2,146Trading securities - debt securities 11,172 53,018 10,293 52,159
Available-for-sale - debt securities 111,453 70,429 98,701 60,290Held-to-maturity securities, net 95,474 75,031 85,136 64,787Loans and advances, net 378,728 327,474 276,494 240,328Other financial assets
Sales contracts receivable, net 534 299 303 271Accounts receivable, net 1,397 2,215 1,138 2,063Other accrued interest and fees receivable 667 416 481 366Others, net 1,822 1,316 306 54
Credit risk exposures relating to off-balance sheet items are as follows:
Consolidated Parent2010 2009 2010 2009
(In Millions of Pesos)Undrawn loan commitments 102,853 185,065 98,937 181,777Bills for collection 18,521 15,582 18,513 15,556Unused letters of credit 12,894 9,759 12,894 9,607Others 707 1,915 606 1,807

(28)
The preceding table represents the maximum credit risk exposure at December 31, 2010 and 2009, withouttaking into account any collateral held or other credit enhancements. For on-balance-sheet assets, theexposures set out above are based on net carrying amounts as reported in the statements of condition.
Management is confident in its ability to continue to control and sustain minimal exposure to credit risk of theBPI Group resulting from its loan and advances portfolio based on the following:
97% of the loans and advances portfolio is categorized in the top two classifications of the internalrating system in 2010 (2009 - 96%);
Mortgage loans are backed by collateral; 94% of the loans and advances portfolio is considered to be neither past due nor impaired (2009 -
94%); and The BPI Group continues to implement stringent selection process of granting loans and advances.
3.1.5 Credit quality of loans and advances
Loans and advances are summarized as follows:
Consolidated Parent2010 2009 2010 2009
(In Millions of Pesos)Neither past due nor impaired 370,409 316,725 271,001 234,177Past due but not impaired 2,250 4,519 1,398 1,663Impaired 16,311 15,186 11,366 11,282
388,970 336,430 283,765 247,122Allowance for impairment (10,242) (8,956) (7,271) (6,794)
378,728 327,474 276,494 240,328
Impaired category as shown in the table above includes loan accounts which are individually (Note 3.1.5c) andcollectively assessed for impairment.
The total consolidated impairment provision for loans and advances is P2,574 million (2009 - P2,400 million), ofwhich P2,064 million (2009 - P450 million) represents provision for individually impaired loans and theremaining amount of P510 million (2009 - P1,950 million) represents the portfolio provision. Further informationof the impairment allowance for loans and advances is provided in Note 13.
When entering into new markets or new industries, the BPI Group focuses on corporate accounts and retailcustomers with good credit rating and customers providing sufficient collateral, where appropriate ornecessary.
Collaterals held as security for Loans and advances are described in Note 13.

(29)
(a) Loans and advances neither past due nor impaired
Loans and advances that were neither past due nor impaired consist mainly of accounts with Unclassifiedrating and those loans accounts in a portfolio to which an impairment has been allocated on a collective basis.Details of these accounts follow:
Consolidated Parent2010 2009 2010 2009
(In Millions of Pesos)Corporate entities:
Large corporate customers 215,184 184,209 208,451 176,497Small and medium enterprises 70,029 56,374 46,806 41,812
Retail customers:Mortgages 65,873 56,661 314 429Credit cards 15,251 14,066 15,251 14,066Others 4,072 5,415 179 1,373
370,409 316,725 271,001 234,177
(b) Loans and advances past due but not impaired
The table below presents the gross amount of loans and advances that were past due but not impaired andclassified by type of borrowers. Collateralized past due loans are not considered impaired when the cash flowsthat may result from foreclosure of the related collateral are higher than the carrying amount of the loans.
Consolidated
2010 2009Large
corporatecustomers
Small andmedium
enterprisesRetail
customers Total
Largecorporatecustomers
Small andmedium
enterprisesRetail
customers Total(In Millions of Pesos)
Past due up to 30 days 29 82 831 942 247 136 597 980Past due 31 - 90 days 10 56 802 868 12 147 607 766Past due 91 - 180 days 5 111 43 159 13 114 1,410 1,537Over 180 days 26 253 2 281 51 75 1,110 1,236
70 502 1,678 2,250 323 472 3,724 4,519
Fair value of collateral 5,381 3,809

(30)
Parent
2010 2009Large
corporatecustomers
Small andmedium
enterprisesRetail
customers Total
Largecorporatecustomers
Small andmedium
enterprisesRetail
customers Total(In Millions of Pesos)
Past due up to 30 days 14 15 736 765 239 22 504 765Past due 31 - 90 days - 17 534 551 - 50 455 505Past due 91 - 180 days - 22 2 24 - 24 293 317Over 180 days 1 57 - 58 31 26 19 76
15 111 1,272 1,398 270 122 1,271 1,663
Fair value of collateral 338 200
(c) Loans and advances individually impaired
The breakdown of the gross amount of individually impaired loans and advances (included in Impairedcategory) by class, along with the fair value of related collateral held by the BPI Group as security, are asfollows:
Consolidated Parent2010 2009 2010 2009
(In Millions of Pesos)Corporate entities:
Large corporate customers 5,150 4,726 5,103 4,554Small and medium enterprises 6,613 6,343 4,546 5,202
Retail customers:Mortgages 703 551 45 23Credit cards 1,305 1,098 1,305 1,098
13,771 12,718 10,999 10,877Fair value of collateral 11,723 11,998 9,989 10,512
(d) Loans and advances renegotiated/restructured
Renegotiated loans amounted to P523 million in 2010 (2009 – 540 million).
3.1.6 Credit quality of other financial assets
a. Due from Bangko Sentral ng Pilipinas
Due from BSP amounting to P128,487 million and P62,744 million as of December 31, 2010 and 2009,respectively are made with a sovereign counterparty and are considered fully performing.

(31)
b. Due from other banks and interbank loans receivable
Due from other banks and interbank loans receivable are considered fully performing at December 31, 2010and 2009. The table below presents the credit ratings of counterparty banks based on Standard and Poor’s.
Consolidated Parent2010 2009 2010 2009
(In Millions of Pesos)AAA 71 31 71 31AA- to AA+ 9,198 23,521 9,129 22,201A- to A+ 12,108 11,331 12,124 11,150Lower than A- - 21,743 - 14,804Unrated 4,995 3,067 3,035 1,337
26,372 59,693 24,359 49,523
Interbank loans receivable and securities purchased under agreements to resell includes reverserepurchase agreements amounting to P47,010 million (2009 - nil). These are made with a sovereigncounterparty and are considered fully performing.
c. Derivative financial assets
The table below presents the Standard and Poor’s credit ratings of counterparties for derivative financial assetspresented in the consolidated and parent financial statements.
2010 2009(In Millions of Pesos)
AAA - -AA- to AA+ 872 361A- to A+ 3,199 789Lower than A- 880 782Unrated 1,108 214
6,059 2,146
d. Debt securities, treasury bills and other government securities
The table below presents the ratings of debt securities, treasury bills and other government securities atDecember 31, 2010 and 2009 based on Standard & Poor’s:
At December 31, 2010
Consolidated ParentTrading
securitiesHeld-to-maturity
Available-for-sale Total
Tradingsecurities
Held-to-maturity
Available-for-sale Total
(In Millions of Pesos)AAA 2,854 6,479 10,007 19,340 2,854 6,346 6,027 15,227AA- to AA+ - 220 7,055 7,275 - 220 6,011 6,231A- to A+ - 1,624 2,399 4,023 - - 2,399 2,399Lower than A- 8,313 87,151 89,429 184,893 7,439 78,570 81,755 167,764Unrated 5 - 2,563 2,568 - - 2,509 2,509
11,172 95,474 111,453 218,099 10,293 85,136 98,701 194,130

(32)
At December 31, 2009
Consolidated ParentTrading
securitiesHeld-to-maturity
Available-for-sale Total
Tradingsecurities
Held-to-maturity
Available-for-sale Total
(In Millions of Pesos)AAA 27,637 466 15,415 43,518 27,637 466 8,755 36,858AA- to AA+ 49 1,028 2,286 3,363 49 467 2,286 2,802A- to A+ 1,566 180 4,100 5,846 1,443 - 3,831 5,274Lower than A- 23,110 73,288 44,437 140,835 22,503 63,830 41,625 127,958Unrated 656 69 4,191 4,916 527 24 3,793 4,344
53,018 75,031 70,429 198,478 52,159 64,787 60,290 177,236
e. Other financial assets
The BPI Group’s other financial assets (shown under Other resources) as of December 31, 2010 and 2009consist mainly of sales contracts receivable, accounts receivable, accrued interest and fees receivable fromvarious unrated counterparties.
3.1.7 Repossessed or foreclosed collaterals
In 2010, the BPI Group acquired assets by taking possession of collaterals held as security for loans andadvances with carrying amount of P1,297 million (2009 - P1,912 million). The related foreclosed collateralshave aggregate fair value of P1,640 million (2009 - P2,615 million). Foreclosed collaterals include real estate(land, building, and improvements), auto or chattel, bond and stocks.
Repossessed properties are sold as soon as practicable and are classified as “Assets held for sale” in thestatement of condition.

(33)
3.1.8 Concentrations of risks of financial assets with credit risk exposure
The BPI Group’s main credit exposure at their carrying amounts, as categorized by industry sectors follow:
Consolidated
Financialinstitutions Consumer Manufacturing Real estate Others
Less –allowance Total
(In Millions of Pesos)Due from BSP 128,487 - - - - - 128,487Due from other banks 6,548 - - - - - 6,548Interbank loans receivable
and SPAR 66,834 - - - - - 66,834Financial assets at fair valuethrough profit or loss
Derivative financial assets 6,010 5 15 14 15 - 6,059Trading securities - debt
securities 123 - 34 - 11,015 - 11,172Available-for-sale - debt
securities 14,861 - 477 470 95,645 - 111,453Held-to-maturity securities 1,635 - - - 93,839 - 95,474Loans and advances, net 23,399 44,617 74,928 96,066 149,960 (10,242) 378,728Other financial assets
Sales contractsreceivable, net - - - - 539 (5) 534
Accounts receivable, net - - - - 2,064 (667) 1,397Other accrued interest
and fees receivable - - - - 667 - 667Others, net - - - - 1,844 (22) 1,822
At December 31, 2010 247,897 44,622 75,454 96,550 355,588 (10,936) 809,175

(34)
Financialinstitutions Consumer Manufacturing Real estate Others
Less –allowance Total
(In Millions of Pesos)Due from BSP 62,744 - - - - - 62,744Due from other banks 7,147 - - - - - 7,147Interbank loans receivable
and SPAR 52,546 - - - - - 52,546Financial assets at fair valuethrough profit or loss
Derivative financial assets 2,127 - 6 - 13 - 2,146Trading securities - debt
securities 1,060 - 638 54 51,266 - 53,018Available-for-sale - debt
securities 12,431 - 665 466 56,867 - 70,429Held-to-maturity securities 1,461 - - - 73,570 - 75,031Loans and advances, net 15,827 37,155 70,289 83,385 129,774 (8,956) 327,474Other financial assets
Sales contractsreceivable, net - - - - 301 (2) 299
Accounts receivable, net - - - - 2,828 (613) 2,215Other accrued interest
and fees receivable - - - - 416 - 416Others, net - - - - 1,721 (405) 1,316
At December 31, 2009 155,343 37,155 71,598 83,905 316,756 (9,976) 654,781

(35)
Parent
Financialinstitutions Consumer Manufacturing Real estate Others
Less -allowance Total
(In Millions of Pesos)Due from BSP 117,805 - - - - - 117,805Due from other banks 3,209 - - - - - 3,209Interbank loans receivable
and SPAR 56,237 - - - - - 56,237Financial assets at fair valuethrough profit or loss
Derivative financial assets 6,010 5 15 14 15 - 6,059Trading securities - debt
securities 120 - 34 - 10,139 - 10,293Available-for-sale - debt
securities 14,230 - 477 470 83,524 - 98,701Held-to-maturity securities 243 - - - 84,893 - 85,136Loans and advances, net 21,583 18,359 72,202 42,275 129,346 (7,271) 276,494Other financial assets
Sales contractsreceivable, net - - - - 308 (5) 303
Accounts receivable, net - - - - 1,765 (627) 1,138Other accrued interest
and fees receivable - - - - 481 - 481Others, net - - - - 320 (14) 306
At December 31, 2010 219,437 18,364 72,728 42,759 310,791 (7,917) 656,162

(36)
Financialinstitutions Consumer Manufacturing Real estate Others
Less -allowance Total
(In Millions of Pesos)Due from BSP 54,465 - - - - - 54,465Due from other banks 3,363 - - - - - 3,363Interbank loans receivable
and SPAR 46,160 - - - - - 46,160Financial assets at fair valuethrough profit or loss
Derivative financial assets 2,127 - 6 - 13 - 2,146Trading securities - debt
securities 1,060 - 514 49 50,536 - 52,159Available-for-sale - debt
securities 11,707 - 665 466 47,452 - 60,290Held-to-maturity securities 491 - - - 64,296 - 64,787Loans and advances, net 14,743 30,549 64,627 30,782 106,421 (6,794) 240,328Other financial assets
Sales contractsreceivable, net - - - - 273 (2) 271
Accounts receivable, net - - - - 2,649 (586) 2,063Other accrued interest
and fees receivable - - - - 366 - 366Others, net - - - - 442 (388) 54
At December 31, 2009 134,116 30,549 65,812 31,297 272,448 (7,770) 526,452
Trading, available-for-sale and held-to-maturity securities under “Others” category include local and UStreasury bills. Likewise, Loans and advances under the same category pertain to loans granted to individualand retail borrowers belonging to various industry sectors.
3.2 Market risk management
The BPI Group is exposed to market risk - the risk that the fair value or future cash flows of a financialinstrument will fluctuate because of changes in market prices. Market risk is managed by the FRMC guidedby policies and procedures approved by the RMC and confirmed by the Executive Committee/Board ofDirectors.
The BPI Group reviews and controls market risk exposures of both its trading and non-trading portfolios.Trading portfolios include those positions arising from the BPI Group’s market-making transactions. Non-trading portfolios primarily arise from the interest rate management of the BPI Group’s retail and commercialbanking assets and liabilities.
As part of the management of market risk, the BPI Group undertakes various hedging strategies. The BPIGroup also enters into interest rate swaps to match the interest rate risk associated with fixed-rate long-termdebt securities.
The BPI Group uses the 1-day, 99% confidence, Value-at-Risk (VaR) as metric of its exposure to marketrisk. This metric estimates, at 99% confidence level, the maximum loss that a trading portfolio may incurover a trading day. This metric indicates as well that there is 1% statistical probability that the tradingportfolios’ actual loss would be greater than the computed VaR.
VaR measurement is an integral part of the BPI Group’s market risk control system. Actual market riskexposures vis-à-vis market risk limits are reported daily to the FRMC. VaR limits for all trading portfolios areset by the RMC. The RMC has set a 1-day VaR limit for the BPI Group aggregate trading portfolio. The BPIGroup also has a year-to-date mark-to-market plus trading loss limit at which management action would betriggered.
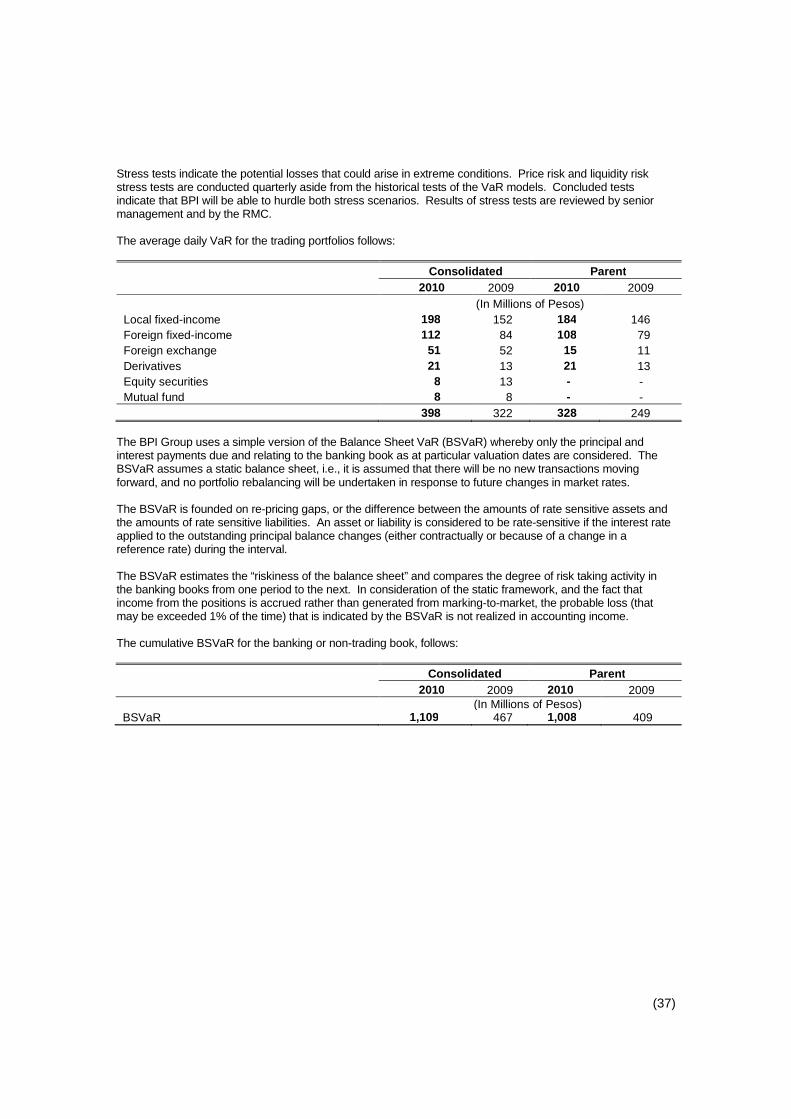
(37)
Stress tests indicate the potential losses that could arise in extreme conditions. Price risk and liquidity riskstress tests are conducted quarterly aside from the historical tests of the VaR models. Concluded testsindicate that BPI will be able to hurdle both stress scenarios. Results of stress tests are reviewed by seniormanagement and by the RMC.
The average daily VaR for the trading portfolios follows:
Consolidated Parent2010 2009 2010 2009
(In Millions of Pesos)Local fixed-income 198 152 184 146Foreign fixed-income 112 84 108 79Foreign exchange 51 52 15 11Derivatives 21 13 21 13Equity securities 8 13 - -Mutual fund 8 8 - -
398 322 328 249
The BPI Group uses a simple version of the Balance Sheet VaR (BSVaR) whereby only the principal andinterest payments due and relating to the banking book as at particular valuation dates are considered. TheBSVaR assumes a static balance sheet, i.e., it is assumed that there will be no new transactions movingforward, and no portfolio rebalancing will be undertaken in response to future changes in market rates.
The BSVaR is founded on re-pricing gaps, or the difference between the amounts of rate sensitive assets andthe amounts of rate sensitive liabilities. An asset or liability is considered to be rate-sensitive if the interest rateapplied to the outstanding principal balance changes (either contractually or because of a change in areference rate) during the interval.
The BSVaR estimates the “riskiness of the balance sheet” and compares the degree of risk taking activity inthe banking books from one period to the next. In consideration of the static framework, and the fact thatincome from the positions is accrued rather than generated from marking-to-market, the probable loss (thatmay be exceeded 1% of the time) that is indicated by the BSVaR is not realized in accounting income.
The cumulative BSVaR for the banking or non-trading book, follows:
Consolidated Parent2010 2009 2010 2009
(In Millions of Pesos)BSVaR 1,109 467 1,008 409

(38)
3.2.1 Foreign exchange risk
The BPI Group takes on exposure to the effects of fluctuations in the prevailing exchange rates on its foreigncurrency financial position and cash flows. The table below summarizes the BPI Group’s exposure to foreigncurrency exchange rate risk at December 31, 2010 and 2009. Included in the table are the BPI Group’sfinancial instruments at carrying amounts, categorized by currency.
Consolidated
USD JPY EUR GBPLess -
allowance Total(In Millions of Pesos)
As at December 31, 2010Financial AssetsCash and other cash items 1,888 38 99 16 - 2,041Due from other banks 1,629 39 351 1,239 - 3,258Interbank loans receivable and
SPAR 19,633 - - 102 - 19,735Financial assets at fair value
through profit or lossDerivative financial assets 1,005 - 45 - - 1,050Trading securities - debt
Securities 3,624 - 58 - - 3,682Available-for-sale - debt securities 32,269 - 821 216 - 33,306Held-to-maturity securities 33,781 - 1,663 238 - 35,682Loans and advances, net 26,588 1,568 81 26 (270) 27,993Others financial assets, net 1,326 202 216 63 (4) 1,803Total financial assets 121,743 1,847 3,334 1,900 (274) 128,550Financial LiabilitiesDeposit liabilities 104,344 1,070 2,841 530 - 108,785Derivative financial liabilities 1,039 - 45 - - 1,084Due to BSP and other banks 95 - - - - 95Manager’s checks and demand
drafts outstanding 55 1 4 - - 60Other financial liabilities 3,625 188 345 30 - 4,188Total financial liabilities 109,158 1,259 3,235 560 - 114,212Net on-balance sheet financial
position (in Philippine Peso) 12,585 588 99 1,340 (274) 14,338

(39)
USD JPY EUR GBPLess -
allowance Total(In Millions of Pesos)
As at December 31, 2009Financial AssetsCash and other cash items 2,079 52 67 9 - 2,207Due from other banks 2,449 142 463 1,557 - 4,611Interbank loans receivable and
SPAR 30,609 - - 37 - 30,646Financial assets at fair value
through profit or lossDerivative financial assets 399 - - - - 399Trading securities - debt
securities 30,480 - 14 - - 30,494Available-for-sale - debt securities 28,628 - 1,514 232 - 30,374Held-to-maturity securities 17,710 - 825 - - 18,535Loans and advances, net 23,048 1,681 70 18 (355) 24,462Others financial assets, net 405 1 177 27 (1) 609Total financial assets 135,807 1,876 3,130 1,880 (356) 142,337Financial LiabilitiesDeposit liabilities 104,969 1,259 2,535 435 - 109,198Derivative financial liabilities 305 - - - - 305Due to BSP and other banks 189 - - - - 189Manager’s checks and demand
drafts outstanding 52 - 10 - - 62Other financial liabilities 1,240 26 145 6 - 1,417Total financial liabilities 106,755 1,285 2,690 441 - 111,171Net on-balance sheet financial
position (in Philippine Peso) 29,052 591 440 1,439 (356) 31,166

(40)
Parent
USD JPY EUR GBPLess -
allowance Total(In Millions of Pesos)
As at December 31, 2010Financial AssetsCash and other cash items 1,756 38 63 15 - 1,872Due from other banks 1,322 37 149 76 - 1,584Interbank loans receivable and
SPAR 19,633 - - 102 - 19,735Financial assets at fair value
through profit or lossDerivative financial assets 1,005 - 45 - - 1,050Trading securities - debt
securities 3,624 - 58 - - 3,682Available-for-sale - debt securities 27,031 - 821 216 - 28,068Held-to-maturity securities 29,984 - 1,634 - - 31,618Loans and advances, net 26,588 1,568 80 - (270) 27,966Other financial assets, net 1,310 202 171 33 (4) 1,712Total financial assets 112,253 1,845 3,021 442 (274) 117,287Financial LiabilitiesDeposit liabilities 95,387 1,070 2,814 399 - 99,670Derivative financial liabilities 1,039 - 45 - - 1,084Due to BSP and other banks 95 - - - - 95Manager’s checks and demand
drafts outstanding 31 1 4 - - 36Other financial liabilities 3,612 188 142 29 - 3,971Total financial liabilities 100,164 1,259 3,005 428 - 104,856Net on-balance sheet financial
position (in Philippine Peso) 12,089 586 16 14 (274) 12,431

(41)
USD JPY EUR GBPLess -
allowance Total(In Millions of Pesos)
As at December 31, 2009Financial AssetsCash and other cash items 1,715 52 63 9 - 1,839Due from other banks 2,015 140 264 59 - 2,478Interbank loans receivable and
SPAR 30,609 - - 37 - 30,646Financial assets at fair value
through profit or lossDerivative financial assets 393 - - - - 393Trading securities - debt
securities 30,480 - 14 - - 30,494Available-for-sale - debt securities 20,841 - 1,514 232 - 22,587Held-to-maturity securities 16,126 - 792 - - 16,918Loans and advances, net 23,048 1,681 69 - (355) 24,443Other financial assets, net 738 156 459 18 (1) 1,370Total financial assets 125,965 2,029 3,175 355 (356) 131,168Financial LiabilitiesDeposit liabilities 95,549 1,259 2,530 339 - 99,677Derivative financial liabilities 305 - - - - 305Due to BSP and other banks 189 - - - - 189Manager’s checks and demand
drafts outstanding 41 - - - - 41Other financial liabilities 1,217 26 41 - - 1,284Total financial liabilities 97,301 1,285 2,571 339 - 101,496Net on-balance sheet financial
position (in Philippine Peso) 28,664 744 604 16 (356) 29,672
3.2.2 Interest rate risk
There are two types of interest rate risk - (i) fair value interest risk and (ii) cash flow interest risk. Fair valueinterest rate risk is the risk that the fair value of a financial instrument will fluctuate because of changes inmarket interest rates. Cash flow interest rate risk is the risk that the future cash flows of a financial instrumentwill fluctuate because of changes in market interest rates. The BPI Group takes on exposure to the effects offluctuations in the prevailing levels of market interest rates on both its fair value which affects mainly the BPIGroup’s trading securities portfolio and cash flow risks on available for sale securities portfolio which is carriedat market.
Interest rate risk in the banking book arises from the BPI Group’s core banking activities. The main source ofthis type of interest rate risk is repricing risk, which reflects the fact that the BPI Group’s assets and liabilitiesare of different maturities and are priced at different interest rates. Interest margins may increase as a result ofsuch changes but may also result in losses in the event that unexpected movements arise. The Board ofDirectors sets limits on the level of mismatch of interest rate repricing that may be undertaken, which ismonitored monthly by the FRMC.

(42)
The table below summarizes the BPI Group’s exposure to interest rate risk, categorized by the earlier ofcontractual repricing or maturity dates.
Consolidated
Repricing
Up to 1 yearOver 1 up to
3 years Over 3 yearsNon-
repricing Total(In Millions of Pesos)
As at December 31, 2010Financial AssetsDue from BSP - - - 128,487 128,487Due from other banks - - - 6,548 6,548Interbank loans receivable and SPAR - - - 66,834 66,834Financial assets at fair value through
profit or lossDerivative financial assets 6,059 - - - 6,059Trading securities - debt securities - - - 11,172 11,172
Available-for-sale - debt securities - - - 111,453 111,453Held-to-maturity securities - - - 95,474 95,474Loans and advances, net 275,154 17,786 40,515 45,273 378,728Other financial assets
Sales contracts receivable, net - - - 534 534Accounts receivable, net - - - 1,397 1,397Other accrued interest and fees
receivable - - - 667 667Others, net - - - 1,822 1,822
Total financial assets 281,213 17,786 40,515 469,661 809,175Financial LiabilitiesDeposit liabilities 325,202 256,420 17,690 120,454 719,766Derivative financial liabilities 5,329 - - - 5,329Bills payable - - - 24,868 24,868Due to BSP and other banks - - - 2,000 2,000Manager’s checks and demand drafts
outstanding 4,187 4,187Unsecured subordinated debt - - - 5,000 5,000Other financial liabilities
Accounts payable - - - 2,937 2,937Others - - - 4,655 4,655
Total financial liabilities 330,531 256,420 17,690 164,101 768,742Total interest gap (49,318) (238,634) 22,825 305,560 40,433

(43)
Repricing
Up to 1 yearOver 1 up to
3 years Over 3 yearsNon-
repricing Total(In Millions of Pesos)
As at December 31, 2009Financial AssetsDue from BSP - - - 62,744 62,744Due from other banks - - - 7,147 7,147Interbank loans receivable and SPAR - - - 52,546 52,546Financial assets at fair value through
profit or lossDerivative financial assets 2,146 - - - 2,146Trading securities - debt securities - - - 53,018 53,018
Available-for-sale - debt securities - - - 70,429 70,429Held-to-maturity securities - - - 75,031 75,031Loans and advances, net 224,509 20,608 43,990 38,367 327,474Other financial assets
Sales contracts receivable, net - - - 299 299Accounts receivable, net - - - 2,215 2,215Other accrued interest and fees
receivable - - - 416 416Others, net - - - 1,316 1,316
Total financial assets 226,655 20,608 43,990 363,528 654,781Financial LiabilitiesDeposit liabilities 245,189 15,033 209,943 109,306 579,471Derivative financial liabilities 1,593 - - - 1,593Bills payable 74 - - 31,935 32,009Due to BSP and other banks - - - 1,933 1,933Manager’s checks and demand drafts
outstanding - - - 3,059 3,059Unsecured subordinated debt - - - 5,000 5,000Other financial liabilities
Accounts payable - - - 2,486 2,486Others - - - 4,055 4,055
Total financial liabilities 246,856 15,033 209,943 157,774 629,606Total interest gap (20,201) 5,575 (165,953) 205,754 25,175

(44)
Parent
Repricing
Up to 1 yearOver 1 up to
3 years Over 3 yearsNon-
repricing Total(In Millions of Pesos)
As at December 31, 2010Financial AssetsDue from BSP - - - 117,805 117,805Due from other banks - - - 3,209 3,209Interbank loans receivable and SPAR - - - 56,237 56,237Financial assets at fair value through
profit or lossDerivative financial assets 6,509 - - - 6,509Trading securities - debt securities - - - 10,293 10,293
Available-for-sale - debt securities - - - 98,701 98,701Held-to-maturity securities - - - 85,136 85,136Loans and advances, net 234,743 6,393 14,511 20,847 276,494Other financial assets
Sales contracts receivable, net - - - 303 303Accounts receivable, net - - - 1,138 1,138Other accrued interest and fees
receivable - - - 481 481Others, net - - - 306 306
Total financial assets 241,252 6,393 14,511 394,456 656,612Financial LiabilitiesDeposit liabilities 261,619 217,078 22 113,217 591,936Derivative financial liabilities 5,329 - - - 5,329Bills payable - - - 17,243 17,243Due to BSP and other banks - - - 2,003 2,003Manager’s checks and demand drafts
outstanding - - - 3,483 3,483Unsecured subordinated debt - - - 5,000 5,000Other financial liabilities
Accounts payable - - - 1,778 1,778Others - - - 2,715 2,715
Total financial liabilities 266,948 217,078 22 145,439 629,487Total interest gap (25,696) (210,685) 14,489 249,017 27,125

(45)
Repricing
Up to 1 yearOver 1 up to
3 years Over 3 yearsNon-
repricing Total(In Millions of Pesos)
As at December 31, 2009Financial AssetsDue from BSP - - - 54,465 54,465Due from other banks - - - 3,363 3,363Interbank loans receivable and SPAR - - - 46,160 46,160Financial assets at fair value through
profit or lossDerivative financial assets 2,146 - - - 2,146Trading securities - debt securities - - - 52,159 52,159
Available-for-sale - debt securities - - - 60,290 60,290Held-to-maturity securities - - - 64,787 64,787Loans and advances, net 193,691 3,632 13,377 29,628 240,328Other financial assets
Sales contracts receivable, net - - - 271 271Accounts receivable, net - - - 2,063 2,063Other accrued interest and fees
receivable - - - 366 366Others, net - - - 54 54
Total financial assets 195,837 3,632 13,377 313,606 526,452Financial LiabilitiesDeposit liabilities 190,536 5,298 174,849 101,348 472,031Derivative financial liabilities 1,593 - - - 1,593Bills payable 74 - - 24,542 24,616Due to BSP and other banks - - - 1,935 1,935Manager’s checks and demand drafts
outstanding - - - 2,506 2,506Unsecured subordinated debt - - - 5,000 5,000Other financial liabilities
Accounts payable - - - 1,803 1,803Others - - - 3,714 3,714
Total financial liabilities 192,203 5,298 174,849 140,848 513,198Total interest gap 3,634 (1,666) (161,472) 172,758 13,254
3.3 Liquidity risk
Liquidity risk is the risk that the BPI Group will be unable to meet its payment obligations associated with itsfinancial liabilities when they fall due and to replace funds when they are withdrawn. The consequence maybe the failure to meet obligations to repay depositors and fulfill commitments to lend.

(46)
3.3.1 Liquidity risk management process
The BPI Group’s liquidity management process, as carried out within the BPI Group and monitored by theRMC and the FRMC includes:
Day-to-day funding, managed by monitoring future cash flows to ensure that requirements can be met.This includes replenishment of funds as they mature or are borrowed by customers;
Maintaining a portfolio of highly marketable assets that can easily be liquidated as protection againstany unforeseen interruption to cash flow;
Monitoring liquidity gaps against internal and regulatory requirements; Managing the concentration and profile of debt maturities; and Performing periodic liquidity stress testing on the BPI Group’s liquidity position by assuming a faster
rate of withdrawals in its deposit base.
Monitoring and reporting take the form of cash flow measurement and projections for the next day, week andmonth as these are key periods for liquidity management. The starting point for these projections is ananalysis of the contractual maturity of the financial liabilities (Notes 3.3.3 and 3.3.4) and the expectedcollection date of the financial assets.
The BPI Group also monitors unmatched medium-term assets, the level and type of undrawn lendingcommitments, the usage of overdraft facilities and the impact of contingent liabilities such as standby lettersof credit.
3.3.2 Funding approach
Sources of liquidity are regularly reviewed by the BPI Group to maintain a wide diversification by currency,geography, counterparty, product and term.
3.3.3 Non-derivative cash flows
The table below presents the significant cash flows payable by the BPI Group under non-derivative financialliabilities by contractual maturities at the reporting date. The amounts disclosed in the table are the expectedundiscounted cash flows, which the BPI Group uses to manage the inherent liquidity risk.

(47)
Consolidated
Up to 1 yearOver 1 up to
3 years Over 3 years Total(In Millions of Pesos)
As at December 31, 2010Financial LiabilitiesDeposit liabilities 326,619 260,159 143,697 730,475Bills payable 22,386 657 2,806 25,849Due to BSP and other banks 2,000 - - 2,000Manager’s checks and demand drafts
outstanding 4,187 - - 4,187Unsecured subordinated debt 423 845 7,112 8,380Other financial liabilities
Accounts payable 2,937 - - 2,937Others 4,655 - - 4,655
363,207 261,661 153,615 778,483
Up to 1 yearOver 1 up to
3 years Over 3 years Total(In Millions of Pesos)
As at December 31, 2009Financial LiabilitiesDeposit liabilities 266,495 219,803 121,310 607,608Bills payable 20,296 8,298 5,037 33,631Due to BSP and other banks 1,933 - - 1,933Manager’s checks and demand drafts
outstanding 3,059 - - 3,059Unsecured subordinated debt 423 845 7,535 8,803Other financial liabilities
Accounts payable 2,486 - - 2,486Others 4,055 - - 4,055
298,747 228,946 133,882 661,575

(48)
Parent
Up to 1 yearOver 1 up to
3 years Over 3 years Total(In Millions of Pesos)
As at December 31, 2010Financial LiabilitiesDeposit liabilities 262,584 219,664 113,243 595,491Bills payable 15,161 549 2,148 17,858Due to BSP and other banks 2,003 - - 2,003Manager’s checks and demand drafts
outstanding57,8283,483
--
--
57,8283,483
Unsecured subordinated debt 423 845 7,112 8,380Other financial liabilities
Accounts payable 1,778 - - 1,778Others 2,715 - - 2,715
345,975 221,058 122,503 689,536
Up to 1 yearOver 1 up to
3 years Over 3 years Total(In Millions of Pesos)
As at December 31, 2009Financial LiabilitiesDeposit liabilities 191,029 181,948 101,345 474,322Bills payable 14,083 7,902 3,955 25,940Due to BSP and other banks 1,935 - - 1,935Manager’s checks and demand drafts
outstanding 2,506 - - 2,506Unsecured subordinated debt 423 845 7,535 8,803Other financial liabilities
Accounts payable 1,803 - - 1,803Others 3,714 - - 3,714
215,493 190,695 112,835 519,023
Assets available to meet all of the liabilities include cash and other cash items, due from BSP and otherbanks, trading securities, available-for-sale securities and loans and advances to customers. In the normalcourse of business, a proportion of customer loans contractually repayable within one year will be extended.The BPI Group would also be able to meet unexpected net cash outflows by accessing additional fundingsources.

(49)
3.3.4 Derivative cash flows
(a) Derivatives settled on a net basis
The BPI Group’s derivatives that are settled on a net basis consist only of interest rate swaps and non-deliverable forwards. The table below presents the contractual undiscounted cash outflows of interest rateswaps based on the remaining period from December 31 to the contractual maturity dates.
Consolidated and Parent
Up to 1 yearOver 1 upto 3 years
Over 3years Total
(In Millions of Pesos)Interest rate swap contracts - held for trading
2010 (52) (307) (1,920) (2,279)2009 - (39) (210) (249)
Non-deliverable forwards - held for trading2010 (1,274) (851) - (2,125)2009 (67) - - (67)
(b) Derivatives settled on a gross basis
The BPI Group’s derivatives that are settled on a gross basis include foreign exchange derivatives mainly,currency forwards, currency swaps and spot contracts. The table below presents the contractualundiscounted cash flows of foreign exchange derivatives based on the remaining period from reporting dateto the contractual maturity dates.
Consolidated and Parent
Up to 1 yearOver 1 up to 3
years Total(In Millions of Pesos)
Foreign exchange derivatives - held for trading2010- Outflow (66,715) - (66,715)- Inflow 65,792 - 65,7922009- Outflow (133,261) - (133,261)- Inflow 132,052 - 132,052

(50)
3.4 Fair value of financial assets and liabilities
The table below summarizes the carrying amount and fair value of those significant financial assets andliabilities not presented on the statement of condition at fair value at December 31.
Consolidated
Carrying amount Fair value2010 2009 2010 2009
(In Millions of Pesos)Financial assetsDue from BSP 128,487 62,744 128,487 62,744Due from other banks 6,548 7,147 6,548 7,147Interbank loans receivable and SPAR 66,834 52,546 66,834 52,546Held-to-maturity, net 95,474 75,031 101,302 78,044Loans and advances, net 378,728 327,474 413,436 335,189Other financial assets
Sales contracts receivable, net 534 299 534 299Accounts receivable, net 1,397 2,215 1,397 2,215Other accrued interest and fees receivable 667 416 667 416Others, net 1,822 1,316 1,822 1,316
Financial liabilitiesDeposit liabilities 719,766 579,471 719,766 579,471Bills payable 24,868 32,009 24,868 32,009Due to BSP and other banks 2,000 1,933 2,000 1,933Manager’s checks and demand drafts
outstanding 4,187 3,059 4,187 3,059Unsecured subordinated debt 5,000 5,000 5,023 5,166Other financial liabilities
Accounts payable 2,937 2,486 2,937 2,486Others 4,655 4,055 4,655 4,055

(51)
Parent
Carrying amount Fair value2010 2009 2010 2009
(In Millions of Pesos)Financial assetsDue from BSP 117,805 54,465 117,805 54,465Due from other banks 3,209 3,363 3,209 3,363Interbank loans receivable and SPAR 56,237 46,160 56,237 46,160Held-to-maturity, net 85,136 64,787 90,629 67,606Loans and advances, net 276,494 240,328 299,780 244,484Other financial assets
Sales contracts receivable, net 303 271 303 271Accounts receivable, net 1,138 2,063 1,138 2,063Other accrued interest and fees receivable 481 366 481 366Others, net 306 54 306 54
Financial liabilitiesDeposit liabilities 591,936 472,031 591,936 472,031Bills payable 17,243 24,616 17,243 24,616Due to BSP and other banks 2,003 1,935 2,003 1,935Manager’s checks and demand drafts
outstanding 3,483 2,506 3,483 2,506Unsecured subordinated debt 5,000 5,000 5,023 5,166Other financial liabilities
Accounts payable 1,778 1,803 1,778 1,803Others 2,715 3,714 2,715 3,714
(i) Due from BSP and other banks and Interbank loans receivable and SPAR
The fair value of floating rate placements and overnight deposits approximates their carrying amount. Theestimated fair value of fixed interest bearing deposits is based on discounted cash flows using prevailingmoney-market interest rates for debts with similar credit risk and remaining maturity.
(ii) Investment securities
Fair value of held-to-maturity assets is based on market prices or broker/dealer price quotations. Where thisinformation is not available, fair value is estimated using quoted market prices for securities with similarcredit, maturity and yield characteristics.
(iii) Loans and advances
The estimated fair value of loans and advances represents the discounted amount of estimated future cashflows expected to be received. Expected cash flows are discounted at current market rates to determine fairvalue.

(52)
(iv) Financial liabilities
The estimated fair value of deposits with no stated maturity, which includes non-interest-bearing deposits, isthe amount repayable on demand.
The estimated fair value of fixed interest-bearing deposits and other borrowings not quoted in an activemarket is based on discounted cash flows using interest rates for new debts with similar remaining maturity.
(v) Other financial assets / liabilities
Carrying amounts of other financial assets / liabilities which have no definite repayment dates are assumedto be their fair values.
3.5 Fair value hierarchy
PFRS 7 specifies a hierarchy of valuation techniques based on whether the inputs to those valuationtechniques are observable or unobservable. Observable inputs reflect market data obtained fromindependent sources; unobservable inputs reflect the BPI Group’s market assumptions. These two types ofinputs have created the following fair value hierarchy:
Level 1 - Quoted prices (unadjusted) in active markets for identical assets or liabilities. This levelincludes listed equity securities and debt instruments on exchanges (for example, Philippine StockExchange, Inc., Philippine Dealing and Exchange Corp., etc.).
Level 2 - Inputs other than quoted prices included within Level 1 that are observable for the asset orliability, either directly (that is, as prices) or indirectly (that is, derived from prices). This level includesthe majority of the OTC derivative contracts. The primary source of input parameters like LIBOR yieldcurve or counterparty credit risk is Bloomberg.
Level 3 - Inputs for the asset or liability that are not based on observable market data (unobservableinputs). This level includes equity investments and debt instruments with significant unobservablecomponents. This hierarchy requires the use of observable market data when available. The BPI Groupconsiders relevant and observable market prices in its valuations where possible.
The following table presents the BPI Group’s assets and liabilities that are measured at fair value atDecember 31, 2010.
Consolidated
Level 1 Level 2 TotalDecember 31, 2010 (In Millions of Pesos)Financial assetsFinancial assets at fair value through profit or lossDerivative financial assets - 6,059 6,059Trading securities- Debt securities 11,172 - 11,172- Equity securities 277 - 277
Available-for-sale financial assets- Debt securities 102,959 8,494 111,453- Equity securities 318 - 318
114,726 14,553 129,279Financial liabilitiesDerivative financial liabilities - 5,329 5,329

(53)
Level 1 Level 2 TotalDecember 31, 2009 (In Millions of Pesos)Financial assetsFinancial assets at fair value through profit or lossDerivative financial assets - 2,146 2,146Trading securities- Debt securities 52,766 252 53,018- Equity securities 238 - 238
Available-for-sale financial assets- Debt securities 60,918 9,511 70,429- Equity securities 1,051 - 1,051
114,973 11,909 126,882Financial liabilitiesDerivative financial liabilities - 1,593 1,593
Parent
Level 1 Level 2 TotalDecember 31, 2010 (In Millions of Pesos)Financial assetsFinancial assets at fair value through profit or loss- Derivative financial assets - 6,059 6,059- Trading securities - debt securities 10,293 - 10,293Available-for-sale financial assets- Debt securities 92,158 6,543 98,701- Equity securities 134 - 134
102,585 12,602 115,187Financial liabilitiesDerivative financial liabilities - 5,329 5,329
Level 1 Level 2 TotalDecember 31, 2009 (In Millions of Pesos)Financial assetsFinancial assets at fair value through profit or loss- Derivative financial assets - 2,146 2,146- Trading securities - debt securities 52,159 - 52,159Available-for-sale financial assets- Debt securities 51,472 8,818 60,290- Equity securities 15 - 15
103,646 10,964 114,610Financial liabilitiesDerivative financial liabilities - 1,593 1,593
The BPI Group has no financial instruments that fall under the Level 3 category as of December 31, 2010and 2009. There were no transfers between Level 1 and Level 2 during the year.
3.6 Insurance risk management
The life and non-life insurance entities decide on the retention, or the absolute amount that they are ready toassume insurance risk from one event. The retention amount is a function of capital, experience, actuarialstudy and risk appetite or aversion.
In excess of the retention, these entities arrange reinsurances either thru treaties or facultative placements.They also accredit reinsurers based on certain criteria and set limits as to what can be reinsured. Thereinsurance treaties and the accreditation of reinsurers require Board of Directors’ approval.

(54)
3.7 Capital management
Cognizant of its exposure to risks, the BPI Group understands that it must maintain sufficient capital toabsorb unexpected losses, to stay in business for the long haul, and to satisfy regulatory requirements. TheBPI Group further understands that its performance, as well as the performance of its various units, shouldbe measured in terms of returns generated vis-à-vis allocated capital and the amount of risk borne in theconduct of business.
The BPI Group manages its capital following the framework of Basel Committee on Banking SupervisionAccord II (Basel II) and its implementation in the Philippines by the BSP. The BSP through its Circular 538requires each bank and its financial affiliated subsidiaries to keep its Capital Adequacy Ratio (CAR) - theratio of qualified capital to risk-weighted exposures - to be no less than 10%. In quantifying its CAR, BPIcurrently uses the Standardized Approach (for credit risk and market risk) and the Basic Indicator Approach(for operational risk). Capital adequacy reports are filed with the BSP every quarter.
Qualifying capital and risk-weighted assets are computed based on BSP regulations. The qualifying capitalof the Parent Bank consists of core tier 1 capital and tier 2 capital. Tier 1 capital comprises paid-up capitalstock, paid-in surplus, surplus including net income for the year, surplus reserves and minority interest lessdeductions such as deferred income tax, unsecured credit accommodations to DOSRI, goodwill andunrealized fair value losses on available-for-sale securities. Tier 2 capital includes unsecured subordinateddebt (see Note 21), net unrealized fair value gains on available-for-sale investments, and general loan lossprovisions for BSP reporting purposes.
The Basel II framework following BSP Circular 538 took into effect on July 1, 2007. The table belowsummarizes the CAR under the Basel II framework for the years ended December 31, 2010 and 2009.
Consolidated Parent2010 2009 2010 2009
(In Millions of Pesos)Tier 1 capital 68,133 56,352 69,430 57,433Tier 2 capital 8,908 8,426 8,104 7,679Gross qualifying capital 77,041 64,778 77,534 65,112Less: Required deductions 2,473 2,826 22,722 20,582Total qualifying capital 74,568 61,952 54,812 44,530
Risk weighted assets 482,788 422,646 386,150 333,099CAR (%) 15.45 14.66 14.19 13.37
The BPI Group has fully complied with the CAR requirement of the BSP.

(55)
Note 4 - Critical Accounting Estimates and Judgments
The BPI Group makes estimates and assumptions that affect the reported amounts of assets and liabilities.Estimates and judgments are continually evaluated and are based on historical experience and other factors,including expectations of future events that are believed to be reasonable under the circumstances. It isreasonably possible that the outcomes within the next financial year could differ from assumptions made atreporting date and could result in the adjustment to the carrying amount of affected assets or liabilities.
A. Critical accounting estimates
(i) Impairment losses on loans and advances (Note 13)
The BPI Group reviews its loan portfolios to assess impairment at least on a monthly basis. In determiningwhether an impairment loss should be recorded in the statement of income, the BPI Group makes judgmentsas to whether there is any observable data indicating that there is a measurable decrease in the estimatedfuture cash flows from a portfolio of loans before the decrease can be identified with an individual loan in thatportfolio. This evidence may include observable data indicating that there has been an adverse change in thepayment status of borrowers in a group, or national or local economic conditions that correlate with defaults onassets in the group. Management uses estimates based on historical loss experience for loans with credit riskcharacteristics and objective evidence of impairment similar to those in the portfolio when scheduling its futurecash flows. The methodology and assumptions used for estimating both the amount and timing of future cashflows are reviewed regularly to reduce any differences between loss estimates and actual loss experience. Tothe extent that the net present value of estimated cash flows of individually impaired accounts and theestimated impairment for collectively assessed accounts differs by +/- 5%, impairment provision for the yearended December 31, 2010 would be an estimated P393 million (2009 – P396 million) higher or lower.
(ii) Fair value of derivatives and other financial instruments (Notes 3.4 and 9)
The fair value of financial instruments that are not quoted in active markets are determined by using valuationtechniques. Where valuation techniques (for example, models) are used to determine fair values, they arevalidated and periodically reviewed by qualified personnel independent of the area that created them. Allmodels are approved by the Board of Directors before they are used, and models are calibrated to ensure thatoutputs reflect actual data and comparative market prices. To the extent practical, the models use onlyobservable data; however, areas such as credit risk (both own and counterparty), volatilities and correlationsrequire management to make estimates. Changes in assumptions about these factors could affect reportedfair value of financial instruments.
(iii) Pension liability on defined benefit plan (Note 30)
The BPI Group estimates its pension benefit obligation and expense for defined benefit pension plans basedon the selection of certain assumptions used by actuaries in calculating such amounts. Those assumptionsare described in Note 30 and include, among others, the discount rate, expected return on plan assets andfuture salary increases. The present value of the defined benefit obligations of the BPI Group at December31, 2010 and 2009 are determined using the market yields on Philippine government bonds with termsconsistent with the expected payments of employee benefits. Plan assets are invested in either equitysecurities, debt securities or other forms of investments. Equity markets may experience volatility, whichcould affect the value of pension plan assets. This volatility may make it difficult to estimate the long-termrate of return on plan assets. Actual results that differ from the BPI Group’s assumptions are accumulatedand amortized over future periods and therefore generally affect the BPI Group’s recognized expense andrecorded obligation in such future periods. The BPI Group’s assumptions are based on actual historicalexperience and external data regarding compensation and discount rate trends.

(56)
B. Critical accounting judgments
(i) Impairment of available-for-sale securities (Note 11)
The BPI Group follows the guidance of PAS 39 to determine when an available-for-sale security is impaired.This determination requires significant judgment. In making this judgment, the BPI Group evaluates, amongother factors, the duration and extent to which the fair value of an investment is less than its cost; and thefinancial health and near-term business outlook of the issuer, including factors such as industry and sectorperformance, changes in technology and operational and financing cash flows.
(ii) Held-to-maturity securities (Note 12)
The BPI Group follows the guidance of PAS 39 in classifying non-derivative financial assets with fixed ordeterminable payments and fixed maturity as held-to-maturity. This classification requires significant judgment.In making this judgment, the BPI Group evaluates its intention and ability to hold such investments to maturity.If the BPI Group fails to keep these investments to maturity other than for the specific circumstances - forexample selling an insignificant amount close to maturity - it will be required to reclassify the entire class asavailable-for-sale. The investments would therefore be measured at fair value and not at amortized cost.
(iii) Classification of assets held for sale
Management follows the principles in PFRS 5 in classifying certain foreclosed assets (consisting of real estateand auto or chattel), as assets held for sale when the carrying amount of the assets will be recoveredprincipally through sale. Management is committed to a plan to sell these foreclosed assets and the assets areactively marketed for sale at a price that is reasonable in relation to their current fair value. In determining thefair value of assets held for sale, sales prices are analyzed by applying appropriate units of comparison,adjusted by differences between the subject asset or property and related market data. Should there be asubsequent write-down of the asset to fair value less cost to sell, such write-down is recognized as impairmentloss in the statement of income.
In 2010, the BPI Group has recognized an impairment loss on its foreclosed assets amounting to P267 million(2009 - P199 million).
(iv) Realization of deferred income tax assets (Note 17)
Management reviews at each reporting date the carrying amounts of deferred tax assets. The carrying amountof deferred tax assets is reduced to the extent that the related tax assets can not be utilized due to insufficienttaxable profit against which the deferred tax losses will be applied. Management believes that sufficienttaxable profit will be generated to allow all or part of the deferred income tax assets to be utilized.

(57)
Note 5 - Assets and Liabilities Attributable to Insurance Operations
Details of the assets and liabilities attributable to insurance operations as of December 31 are as follows:
2010 2009(In Millions of Pesos)
AssetsCash and cash equivalents (Note 7) 54 48Insurance balances receivable, net 1,680 1,760Investment securities
Available-for-sale 1,621 2,609Held-to-maturity 7,180 5,405
Land, building and equipment 174 201Accounts receivable and other assets, net 1,207 927
11,916 10,950
LiabilitiesReserves and other balances 8,610 8,311Accounts payable, accrued expenses and other payables 603 451
9,213 8,762
Details of income attributable to insurance operations, before income tax and minority interest for the yearsended December are as follows:
2010 2009 2008(In Millions of Pesos)
Premiums earned and related incomeInvestment and other income
2,188410
5,817910
4,534333
2,598 6,727 4,867Benefits, claims and maturitiesIncrease in actuarial reserve liabilitiesManagement and general expensesCommissionsOther expenses
9617
38141829
1,8862,574
698515256
1,6691,068
755581206
1,796 5,929 4,279Income before income tax and minority interest 802 798 588
In September 2009, the BPI Group lost control over a life insurance subsidiary following the sale of itsmajority stake in the said subsidiary (see Note 16).
Note 6 - Business Segments
In 2009, segment reporting by the BPI Group was prepared for the first time in accordance with PFRS 8.Following the management approach of PFRS 8, operating segments are reported in accordance with theinternal reporting provided to the chief executive officer, who is responsible for allocating resources to thereportable segments and assesses their performance. All operating segments used by the BPI Group meetthe definition of a reportable segment under PFRS 8.
The BPI Group has determined the operating segments based on the nature of the services provided and thedifferent markets served representing a strategic business unit.

(58)
The BPI Group’s main operating business segments follow:
Consumer Banking - this segment addresses the individual and retail markets. It covers deposit takingand servicing, consumer lending such as home mortgages, auto loans and credit card finance as well asthe remittance business. It includes the entire transaction processing and service delivery infrastructureconsisting of the BPI and BPI Family Bank network of branches, ATMs and point-of-sale terminals as wellas phone and Internet-based banking platforms.
Corporate Banking - this segment consists of the entire lending, leasing, trade and cash managementservices provided by the BPI Group to corporate and institutional customers. These customers includeboth high-end corporations as well as various middle market clients.
Investment Banking - this segment includes the various business groups operating in the investmentmarkets, and dealing in activities other than lending and deposit taking. These services cover corporatefinance, securities distribution, asset management, trust and fiduciary services as well as proprietarytrading and investment activities.
The performance of the Parent Bank is assessed as a single unit using financial information presented in theseparate or Parent only financial statements. Likewise, the chief executive officer assesses the performance ofits insurance business as a separate segment from its banking and allied financial undertakings. Informationon the assets, liabilities and results of operations of the insurance business is fully disclosed in Note 5.
The BPI Group and the Parent Bank mainly derive revenue (more than 90%) within the Philippines,accordingly, no geographical segment is presented.
Revenues of the BPI Group’s segment operations are derived from interest (net interest income). The segmentreport forms part of management’s assessment of the performance of the segment, among other performanceindicators.
There were no changes in the reportable segments during the year. Transactions between the businesssegments are carried out at arm’s length. The revenue from external parties reported to the management ismeasured in a manner consistent with that in the statement of income.
Funds are ordinarily allocated between segments, resulting in funding cost transfers disclosed in inter-segmentnet interest income. Interest charged for these funds is based on the BPI Group’s cost of capital.
Internal charges and transfer pricing adjustments have been reflected in the performance of each business.Revenue-sharing agreements are used to allocate external customer revenues to a business segment on areasonable basis. Inter-segment revenues however, are deemed insignificant for financial reporting purposes,thus, not reported in segment analysis below.
The BPI Group’s management reporting is based on a measure of operating profit comprising net income, loanimpairment charges, fee and commission income, other income and non-interest income.
Segment assets and liabilities comprise majority of operating assets and liabilities as shown in the statement ofcondition, but exclude items such as taxation.
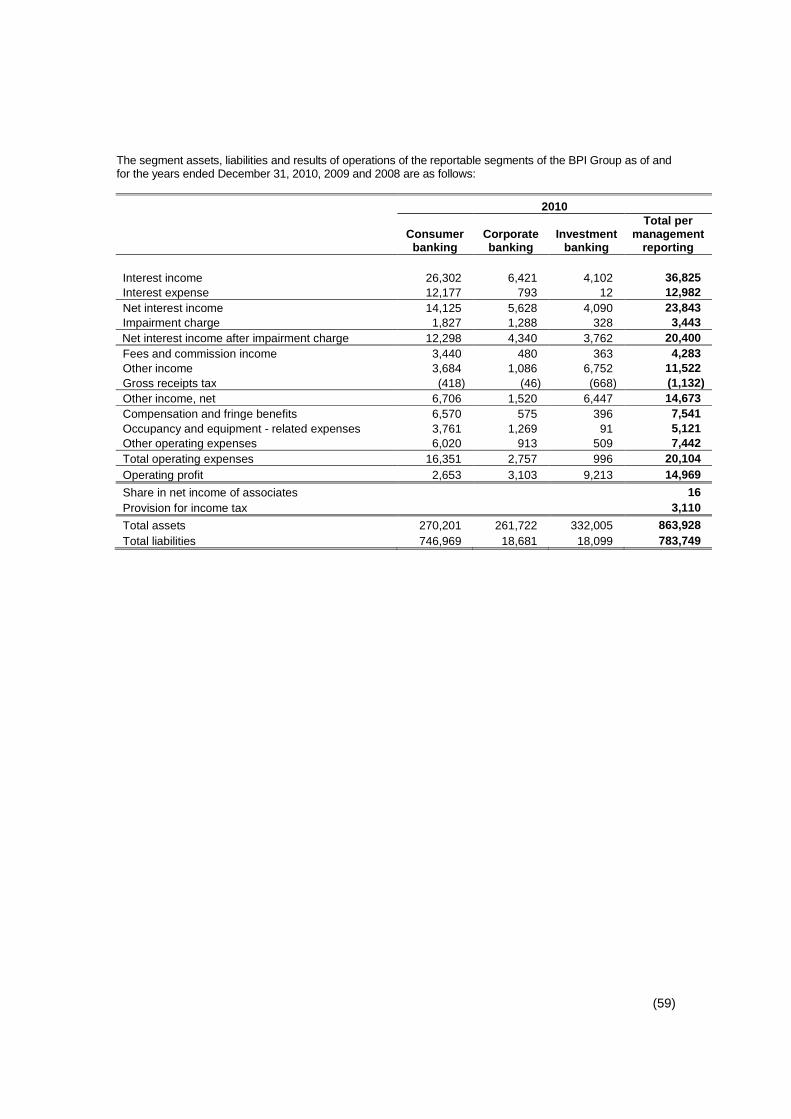
(59)
The segment assets, liabilities and results of operations of the reportable segments of the BPI Group as of andfor the years ended December 31, 2010, 2009 and 2008 are as follows:
2010
Consumerbanking
Corporatebanking
Investmentbanking
Total permanagement
reporting
Interest income 26,302 6,421 4,102 36,825Interest expense 12,177 793 12 12,982Net interest income 14,125 5,628 4,090 23,843Impairment charge 1,827 1,288 328 3,443Net interest income after impairment charge 12,298 4,340 3,762 20,400Fees and commission income 3,440 480 363 4,283Other income 3,684 1,086 6,752 11,522Gross receipts tax (418) (46) (668) (1,132)Other income, net 6,706 1,520 6,447 14,673Compensation and fringe benefits 6,570 575 396 7,541Occupancy and equipment - related expenses 3,761 1,269 91 5,121Other operating expenses 6,020 913 509 7,442Total operating expenses 16,351 2,757 996 20,104Operating profit 2,653 3,103 9,213 14,969Share in net income of associates 16Provision for income tax 3,110Total assets 270,201 261,722 332,005 863,928Total liabilities 746,969 18,681 18,099 783,749

(60)
2009
Consumerbanking
Corporatebanking
Investmentbanking
Total permanagement
reporting(In Millions of Pesos)
Interest income 23,712 7,107 3,113 33,932Interest expense 11,282 804 57 12,143Net interest income 12,430 6,303 3,056 21,789Impairment charge 1,476 1,059 - 2,535Net interest income after impairment charge 10,954 5,244 3,056 19,254Fees and commission income 2,875 399 292 3,566Other income 3,362 856 4,742 8,960Gross receipts tax (361) (28) (412) (801)Other income, net 5,876 1,227 4,622 11,725Compensation and fringe benefits 6,456 548 382 7,386Occupancy and equipment - related expenses 3,407 1,143 92 4,642Other operating expenses 5,450 864 423 6,737Total operating expenses 15,313 2,555 897 18,765Operating profit 1,517 3,916 6,781 12,214Share in net loss of associates (21)Provision for income tax 3,510Total assets 239,711 221,206 249,471 710,388Total liabilities 606,170 33,786 2,820 642,776
2008
Consumerbanking
Corporatebanking
Investmentbanking
Total permanagement
reporting(In Millions of Pesos)
Interest income 26,278 6,089 2,443 34,810Interest expense 13,368 368 171 13,907Net interest income 12,910 5,721 2,272 20,903Impairment charge 800 1,129 1 1,930Net interest income after impairment charge 12,110 4,592 2,271 18,973Fees and commission income 1,035 322 1,835 3,192Other income 5,778 1,003 448 7,229Gross receipts tax (392) (45) (167) (604)Other income, net 6,421 1,280 2,116 9,817Compensation and fringe benefits 5,901 521 348 6,770Occupancy and equipment - related expenses 3,303 1,028 96 4,427Other operating expenses 4,909 1,145 430 6,484Total operating expenses 14,113 2,694 874 17,681Operating profit 4,418 3,178 3,513 11,109Share in net loss of associates (28)Provision for income tax 2,980Total assets 218,480 224,565 202,127 645,172Total liabilities 561,584 9,716 8,370 579,670

(61)
Reconciliation of segment results to consolidated results of operations:
2010
Total permanagement
reporting
Consolidationadjustments/
Others
Total perconsolidated
financialstatements
(In Millions of Pesos)Interest income 36,825 162 36,987Interest expense 12,982 377 13,359Net interest income 23,843 (215) 23,628Impairment charge 3,443 11 3,454Net interest income after impairment charge 20,400 (226) 20,174Fees and commission income 4,283 (123) 4,160Other income 11,522 845 12,367Gross receipts tax (1,132) (26) (1,158)Other income, net 14,673 696 15,369Compensation and fringe benefits 7,541 1,596 9,137Occupancy and equipment - related expenses 5,121 962 6,083Other operating expenses 7,442 (1,708) 5,734Total operating expenses 20,104 850 20,954Operating profit 14,969 (380) 14,589Share in net loss of associates 16 - 16Provision for income tax 3,110 - 3,110Total assets 863,928 14,218 878,146Total liabilities 783,749 12,122 795,871
2009
Total permanagement
reporting
Consolidationadjustments/
Others
Total perconsolidated
financialstatements
(In Millions of Pesos)Interest income 33,932 (45) 33,887Interest expense 12,143 342 12,485Net interest income 21,789 (387) 21,402Impairment charge 2,535 - 2,535Net interest income after impairment charge 19,254 (387) 18,867Fees and commission income 3,566 (136) 3,430Other income 8,960 1,475 10,435Gross receipts tax (801) (71) (872)Other income, net 11,725 1,268 12,993Compensation and fringe benefits 7,386 1,769 9,155Occupancy and equipment - related expenses 4,642 1,003 5,645Other operating expenses 6,737 (1,861) 4,876Total operating expenses 18,765 911 19,676Operating profit 12,214 (30) 12,184Share in net loss of associates (21) - (21)Provision for income tax 3,510 9 3,519Total assets 710,388 14,032 724,420Total liabilities 642,776 13,879 656,655

(62)
2008
Total permanagement
reporting
Consolidationadjustments/
Others
Total perconsolidated
financialstatements
(In Millions of Pesos)Interest income 34,810 (1,513) 33,297Interest expense 13,907 (73) 13,834Net interest income 20,903 (1,440) 19,463Impairment charge 1,930 - 1,930Net interest income after impairment charge 18,973 (1,440) 17,533Fees and commission income 3,192 (136) 3,056Other income 7,229 653 7,882Gross receipts tax (604) (13) (617)Other income, net 9,817 504 10,321Compensation and fringe benefits 6,770 1,328 8,098Occupancy and equipment - related expenses 4,427 876 5,303Other operating expenses 6,484 (1,573) 4,911Total operating expenses 17,681 631 18,312Operating profit 11,109 (1,567) 9,542Share in net loss of associates (28) - (28)Provision for income tax 2,980 5 2,985Total assets 645,172 21,440 666,612Total liabilities 579,670 23,070 602,740
“Consolidation adjustments/Others” pertains to balances of support units and inter-segment elimination inaccordance with the BPI Group’s internal reporting.
Note 7 - Cash and Cash Equivalents
This account at December 31 consists of:
Consolidated Parent2010 2009 2008 2010 2009 2008
(In Millions of Pesos)Cash and other cash items 18,151 18,780 22,366 17,573 17,987 21,781Due from Bangko Sentral ng Pilipinas 74,184 21,172 11,924 65,795 14,755 6,613Due from other banks 6,548 7,147 14,278 3,209 3,363 8,114Interbank loans receivable and securities
purchased under agreements to resell 62,973 28,282 14,159 52,377 21,342 12,682Cash and cash equivalents attributable to
insurance operations 54 48 63 - - -161,910 75,429 62,790 138,954 57,447 49,190

(63)
Note 8 - Interbank Loans Receivable and Securities Purchased under Agreements to Resell (SPAR)
The account at December 31 consists of transactions with:
Consolidated Parent2010 2009 2010 2009
(In Millions of Pesos)BSP 46,904 21,737 35,000 14,800BPI Leasing Corporation - - 1,132 553Other banks 19,817 30,787 20,011 30,787
66,721 52,524 56,143 46,140Accrued interest receivable 113 22 94 20
66,834 52,546 56,237 46,160
Interbank loans receivable and SPAR maturing within 90 days from the date of acquisition are classified ascash equivalents in the statement of cash flows (Note 7).
Average effective interest rate (%) of interbank loans receivable of the BPI Group at December 31 follow:
2010 2009Peso-denominated 4.11 4.32US dollar-denominated 0.28 0.65
Note 9 - Derivative Financial Instruments
Derivatives held by the BPI Group for non-hedging purposes are as follows:
Foreign exchange forwards represent commitments to purchase or sell one currency against another atan agreed forward rate on a specified date in the future. Settlement can be made via full delivery offorward proceeds or via payment of the difference (non-deliverable forward) between the contractedforward rate and the prevailing market rate on maturity.
Foreign exchange swaps refer to spot purchase or sale of one currency against another with anagreement to sell or purchase the same currency at an agreed forward rate in the future.
Interest rate swaps refer to agreement to exchange fixed rate versus floating interest payments (or viceversa) on a reference notional amount over an agreed period of time.
Cross currency swaps refer to spot exchange of notional amounts on two currencies at a givenexchange rate and with an agreement to re-exchange the same notional amounts at a specifiedmaturity date based on the original exchange rate. Parties on the transaction agree to pay a statedinterest rate on the borrowed notional amount and receive a stated interest rate on the lent notionalamount, payable or receivable periodically over the term of the transaction.
The BPI Group’s credit risk represents the potential cost to replace the swap contracts if counterparties failto fulfill their obligation. This risk is monitored on an ongoing basis with reference to the current fair value, aproportion of the notional amount of the contracts and the liquidity of the market. To control the level ofcredit risk taken, the BPI Group assesses counterparties using the same techniques as for its lendingactivities.
The notional amounts of certain types of financial instruments provide a basis for comparison withinstruments recognized on the statement of condition. They do not necessarily represent the amounts offuture cash flows involved or the current fair values of the instruments and therefore are not indicative of theBPI Group’s exposure to credit or price risks. The derivative instruments become favorable (assets) orunfavorable (liabilities) as a result of fluctuations in market interest rates or foreign exchange rates relative totheir terms. The aggregate contractual or notional amount of derivative financial instruments on hand andthe extent at which the instruments can become favorable or unfavorable in fair values can fluctuatesignificantly from time to time. The fair values of derivative instruments held are set out below.

(64)
Consolidated and Parent
Contract/ Fair ValuesNotional Amount Assets Liabilities2010 2009 2010 2009 2010 2009
(In Millions of Pesos)Freestanding derivatives
Foreign exchange derivativesCurrency swaps 173,123 129,714 1,700 1,491 (853) (851)Currency forwards 90,239 21,754 1,684 78 (2,195) (130)
Interest rate swaps 24,206 26,637 2,651 569 (2,279) (610)Embedded credit derivatives - - 24 8 (2) (2)Total derivatives assets (liabilities)
held for trading 6,059 2,146 (5,329) (1,593)
Note 10 - Trading Securities
The account at December 31 consists of:
Consolidated Parent2010 2009 2010 2009
(In Millions of Pesos)Debt securities
Government securities 11,046 52,600 10,179 51,997Commercial papers of private companies 5 249 - -
11,051 52,849 10,179 51,997Accrued interest receivable 121 169 114 162
11,172 53,018 10,293 52,159Equity securities - listed 277 238 - -
11,449 53,256 10,293 52,159
Note 11 - Available-for-Sale Securities
This account at December 31 consists of:
Consolidated Parent2010 2009 2010 2009
Debt securities (In Millions of Pesos)Government securities 91,572 54,630 79,960 45,374Others 18,104 15,046 17,141 14,209
109,676 69,676 97,101 59,583Accrued interest receivable 1,777 753 1,600 707
111,453 70,429 98,701 60,290Equity securities
Listed 318 1,051 134 15Unlisted 1,316 480 288 346
1,634 1,531 422 361113,087 71,960 99,123 60,651
Allowance for impairment (564) (254) (213) (218)112,523 71,706 98,910 60,433
Consolidated Parent2010 2009 2010 2009
(In Millions of Pesos)Current 12,350 22,207 8,927 14,027Non-current 100,737 49,753 90,196 46,624
113,087 71,960 99,123 60,651
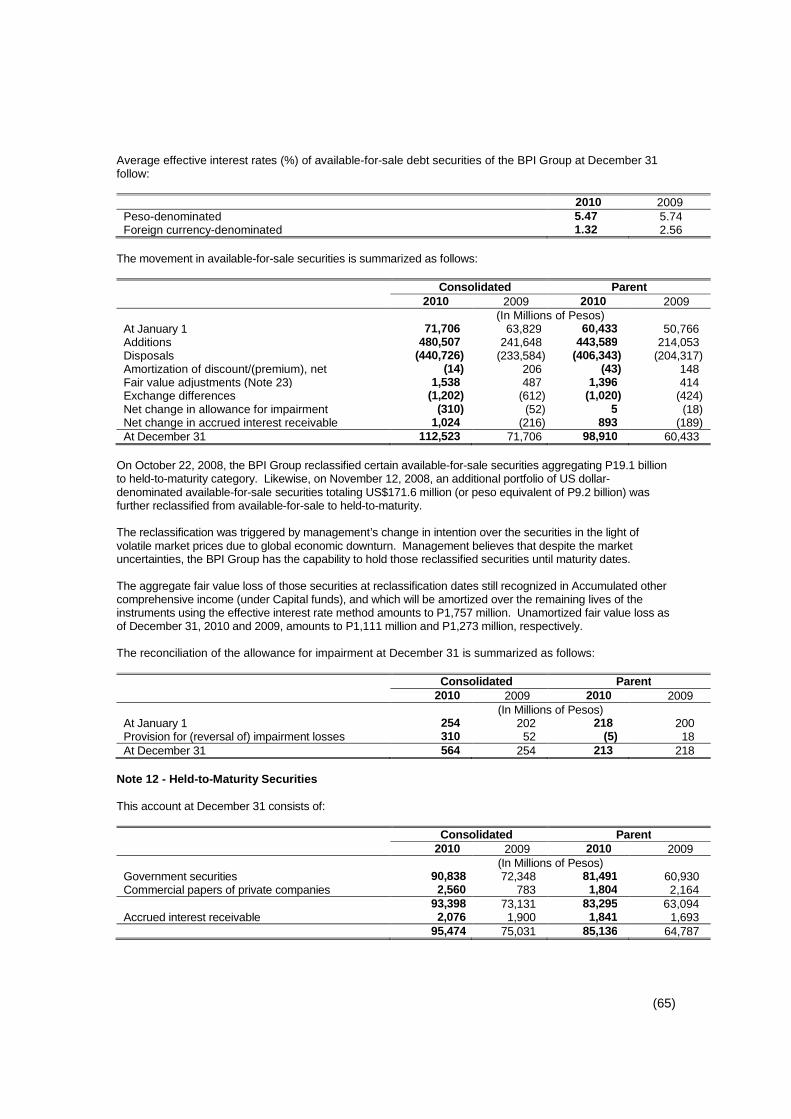
(65)
Average effective interest rates (%) of available-for-sale debt securities of the BPI Group at December 31follow:
2010 2009Peso-denominated 5.47 5.74Foreign currency-denominated 1.32 2.56
The movement in available-for-sale securities is summarized as follows:
Consolidated Parent2010 2009 2010 2009
(In Millions of Pesos)At January 1 71,706 63,829 60,433 50,766Additions 480,507 241,648 443,589 214,053Disposals (440,726) (233,584) (406,343) (204,317)Amortization of discount/(premium), net (14) 206 (43) 148Fair value adjustments (Note 23) 1,538 487 1,396 414Exchange differences (1,202) (612) (1,020) (424)Net change in allowance for impairment (310) (52) 5 (18)Net change in accrued interest receivable 1,024 (216) 893 (189)At December 31 112,523 71,706 98,910 60,433
On October 22, 2008, the BPI Group reclassified certain available-for-sale securities aggregating P19.1 billionto held-to-maturity category. Likewise, on November 12, 2008, an additional portfolio of US dollar-denominated available-for-sale securities totaling US$171.6 million (or peso equivalent of P9.2 billion) wasfurther reclassified from available-for-sale to held-to-maturity.
The reclassification was triggered by management’s change in intention over the securities in the light ofvolatile market prices due to global economic downturn. Management believes that despite the marketuncertainties, the BPI Group has the capability to hold those reclassified securities until maturity dates.
The aggregate fair value loss of those securities at reclassification dates still recognized in Accumulated othercomprehensive income (under Capital funds), and which will be amortized over the remaining lives of theinstruments using the effective interest rate method amounts to P1,757 million. Unamortized fair value loss asof December 31, 2010 and 2009, amounts to P1,111 million and P1,273 million, respectively.
The reconciliation of the allowance for impairment at December 31 is summarized as follows:
Consolidated Parent2010 2009 2010 2009
(In Millions of Pesos)At January 1 254 202 218 200Provision for (reversal of) impairment losses 310 52 (5) 18At December 31 564 254 213 218
Note 12 - Held-to-Maturity Securities
This account at December 31 consists of:
Consolidated Parent2010 2009 2010 2009
(In Millions of Pesos)Government securities 90,838 72,348 81,491 60,930Commercial papers of private companies 2,560 783 1,804 2,164
93,398 73,131 83,295 63,094Accrued interest receivable 2,076 1,900 1,841 1,693
95,474 75,031 85,136 64,787

(66)
Consolidated Parent2010 2009 2010 2009
(In Millions of Pesos)Current 15,664 7,945 11,147 4,894Non-current 79,810 67,086 73,989 59,893
95,474 75,031 85,136 64,787
Average effective interest rates (%) of held-to-maturity securities of the BPI Group at December 31 follow:
2010 2009Peso-denominated 7.75 7.92Foreign currency-denominated 4.62 5.49
The movement in held-to-maturity securities is summarized as follows:
Consolidated Parent2010 2009 2010 2009
(In Millions of Pesos)At January 1 75,031 72,884 64,787 63,196Additions 42,267 55,656 38,838 53,336Maturities (22,290) (52,008) (19,054) (50,365)Amortization of premium, net (1,759) (1,076) (1,711) (1,000)Exchange differences 2,049 (467) 2,128 (429)Net change in accrued interest receivable 176 42 148 49At December 31 95,474 75,031 85,136 64,787
Note 13 - Loans and Advances
Major classifications of this account at December 31 are as follows:
Consolidated Parent2010 2009 2010 2009
Corporate entities (In Millions of Pesos)Large corporate customers 231,231 189,445 223,161 180,488Small and medium enterprise 66,129 63,422 40,700 46,543
Retail customersCredit cards 18,507 17,003 18,507 17,003Mortgages 72,371 63,282 404 759Others 4,594 5,964 202 1,402
392,832 339,116 282,974 246,195Accrued interest receivable 1,528 1,613 1,144 1,255Unearned discount/income (5,390) (4,299) (353) (328)
388,970 336,430 283,765 247,122Allowance for impairment (10,242) (8,956) (7,271) (6,794)
378,728 327,474 276,494 240,328
Consolidated Parent2010 2009 2010 2009
(In Millions of Pesos)Current 91,178 80,898 76,709 63,636Non-current 297,792 255,532 207,056 183,486
388,970 336,430 283,765 247,122

(67)
The amount of loans and advances above include finance lease receivables as follows:
Consolidated2010 2009
(In Millions of Pesos)Total future minimum lease collections 5,918 4,472Unearned finance income (938) (707)Present value of future minimum lease collections 4,980 3,765Allowance for impairment (63) (50)
4,917 3,715
Details of future minimum lease collections follow:
Consolidated2010 2009(In Millions of Pesos)
Not later than one year 2,320 1,884Later than one year but not later than five years 3,598 2,588
5,918 4,472Unearned finance income (938) (707)
4,980 3,765
The Parent Bank has no finance lease receivables as of December 31, 2010 and 2009.
Details of the loans and advances portfolio of the BPI Group at December 31 are as follows:
1) As to industry/economic sector (in %)
Consolidated Parent2010 2009 2010 2009
ConsumerManufacturingReal estate, renting and other related
activitiesAgriculture and forestryWholesale and retail tradeFinancial institutionsOthers
29.8018.71
10.6810.5011.94
5.8212.55
30.7220.47
9.499.31
11.824.62
13.57
6.8825.47
13.8214.3716.01
7.5815.87
7.5327.68
12.6612.6415.80
6.2817.41
100.00 100.00 100.00 100.00
2) As to collateral
Consolidated Parent2010 2009 2010 2009
(In Millions of Pesos)Secured loans
Real estate mortgage 132,958 122,411 67,286 61,406Chattel mortgage 24,536 20,602 1,470 2,090Others 85,431 69,848 80,155 67,845
242,925 212,861 148,911 131,341Unsecured loans 144,517 121,956 133,710 114,526
387,442 334,817 282,621 245,867
Other collaterals include hold-out deposits, mortgage trust indentures, government securities and bonds,quedan/warehouse receipts, standby letters of credit, trust receipts, and deposit substitutes.
Loans and advances aggregating P15,564 million (2009 - P32,009 million) and P7,939 million(2009 - P24,616 million) are used as security for bills payable (Note 20) of the BPI Group and Parent Bank,respectively.

(68)
Average effective interest rates (%) of loans and advances of the BPI Group at December 31 follow:
2010 2009Commercial loans
Peso-denominated loans 5.83 6.66Foreign currency-denominated loans 2.31 3.12
Real estate mortgages 9.44 9.84Auto loans 10.46 10.71
Non-performing accounts (over 30 days past due) of the BPI Group and the Parent Bank, net of accounts inthe “loss” category and covered with 100% reserves (excluded under BSP Circular 351), are as follows:
Consolidated Parent2010 2009 2010 2009
(In Millions of Pesos)Non-performing accounts (NPL 30) 12,288 13,059 8,036 9,370“Loss” category loans with 100% reserves 2,771 2,006 2,134 1,964Net NPL 30 9,517 11,053 5,902 7,406
Reconciliation of allowance for impairment by class at December 31 follows:
Consolidated
2010Corporate entities Retail customers
Largecorporatecustomers
Small andmedium
enterprises MortgagesCreditcards Others Total
(In Millions of Pesos)At January 1 2,154 3,323 855 1,694 930 8,956Provision for (reversal of)
impairment losses 947 365 179 852 231 2,574Write-off/disposal (335) (154) (60) (601) (21) (1,171)Unwind of discount (51) (52) - - - (103)Others (74) 55 1 - 4 (14)At December 31 2,641 3,537 975 1,945 1,144 10,242

(69)
2009Corporate entities Retail customers
Largecorporatecustomers
Small andmedium
enterprises MortgagesCreditcards Others Total
(In Millions of Pesos)At January 1 2,490 2,205 766 1,381 675 7,517Provision for (reversal of)
impairment losses (41) 1,206 53 928 254 2,400Write-off/disposal (296) (50) - (614) - (960)Unwind of discount (11) (18) - - - (29)Others 12 (20) 36 (1) 1 28At December 31 2,154 3,323 855 1,694 930 8,956
Parent
2010Corporate entities Retail customers
Largecorporatecustomers
Small andmedium
enterprises MortgagesCreditcards Others Total
(In Millions of Pesos)At January 1 2,272 2,747 67 1,694 14 6,794Provision for (reversal of)
impairment losses 892 (54) 52 852 1 1,743Write-off/disposal (335) (154) (60) (601) - (1,150)Unwind of discount (51) (50) - - - (101)Others (26) 12 1 - (2) (15)At December 31 2,752 2,501 60 1,945 13 7,271
2009Corporate entities Retail customers
Largecorporatecustomers
Small andmedium
enterprises MortgagesCreditcards Others Total
(In Millions of Pesos)At January 1 2,608 1,660 202 1,381 15 5,866Provision for (reversal of)
impairment losses (41) 1,137 (135) 928 (1) 1,888Write-off/disposal (296) (50) - (614) - (960)Unwind of discount (11) (17) - - - (28)Others 12 17 - (1) - 28At December 31 2,272 2,747 67 1,694 14 6,794

(70)
Note 14 - Bank Premises, Furniture, Fixtures and Equipment
This account at December 31 consists of:
Consolidated
2010
Land
Buildings andleasehold
improvements
Furnitureand
equipmentEquipmentfor lease Total
(In Millions of Pesos)Cost
January 1, 2010 3,372 5,118 11,586 3,896 23,972Additions - 656 1,181 1,990 3,827Disposals (106) (61) (786) (1,671) (2,624)Amortization - (196) - - (196)Transfers (3) (16) (7) - (26)December 31, 2010 3,263 5,501 11,974 4,215 24,953
Accumulated depreciationJanuary 1, 2010 - 1,865 9,278 1,419 12,562Depreciation - 203 1,042 847 2,092Disposals/transfers - (46) (559) (702) (1,307)December 31, 2010 - 2,022 9,761 1,564 13,347
Net book value, December 31, 2010 3,263 3,479 2,213 2,651 11,606
2009
Land
Buildings andleasehold
improvements
Furnitureand
equipmentEquipmentfor lease Total
(In Millions of Pesos)Cost
January 1, 2009 3,527 4,597 11,101 3,573 22,798Additions 38 782 1,199 1,303 3,322Disposals (194) (69) (711) (980) (1,954)Amortization - (159) - - (159)Transfers 1 (33) (3) - (35)December 31, 2009 3,372 5,118 11,586 3,896 23,972
Accumulated depreciationJanuary 1, 2009 - 1,732 8,769 1,121 11,622Depreciation - 170 1,093 756 2,019Disposals/transfers - (37) (584) (458) (1,079)December 31, 2009 - 1,865 9,278 1,419 12,562
Net book value, December 31, 2009 3,372 3,253 2,308 2,477 11,410

(71)
Parent
2010
Land
Buildings andleasehold
improvementsFurniture and
equipment Total(In Millions of Pesos)
CostJanuary 1, 2010 2,933 4,444 10,717 18,094Additions - 547 1,048 1,595Disposals (106) (61) (690) (857)Amortization - (159) - (159)Transfers - - - -December 31, 2010 2,827 4,771 11,075 18,673
Accumulated depreciationJanuary 1, 2010 - 1,643 8,618 10,261Depreciation - 177 941 1,118Disposals/transfers - (43) (510) (553)December 31, 2010 - 1,777 9,049 10,826
Net book value, December 31, 2010 2,827 2,994 2,026 7,847
2009
Land
Buildings andleasehold
improvementsFurniture and
equipment Total(In Millions of Pesos)
CostJanuary 1, 2009 3,079 3,959 10,337 17,375Additions 38 680 1,058 1,776Disposals (187) (67) (678) (932)Amortization - (128) - (128)Transfers 3 - - 3December 31, 2009 2,933 4,444 10,717 18,094
Accumulated depreciationJanuary 1, 2009 - 1,525 8,196 9,721Depreciation - 146 960 1,106Disposals/transfers - (28) (538) (566)December 31, 2009 - 1,643 8,618 10,261
Net book value, December 31, 2009 2,933 2,801 2,099 7,833
Depreciation is included in Occupancy and equipment-related expenses in the statement of income.

(72)
Note 15 - Investment Properties
This account at December 31 consists of:
Consolidated Parent2010 2009 2010 2009
(In Millions of Pesos)Land 3,208 3,208 3,202 3,202Buildings 1,764 1,754 1,757 1,747
4,972 4,962 4,959 4,949Accumulated depreciation (1,013) (947) (1,010) (945)Allowance for impairment (1,253) (1,253) (1,253) (1,253)
2,706 2,762 2,696 2,751
The movement in investment properties is summarized as follows:
Consolidated Parent2010 2009 2010 2009
(In Millions of Pesos)At January 1 2,762 2,828 2,751 2,817Additions 10 10Transfers - (2) - (2)Disposals - - - -Depreciation (66) (64) (65) (64)At December 31 2,706 2,762 2,696 2,751
Investment properties have aggregate fair value of P12,365 million as of December 31, 2010(2009 - P14,302 million). Fair value of investment property is determined on the basis of appraisal made byan internal or an external appraiser duly certified by the BPI Group’s credit policy group. Valuation methodsemployed by the appraisers include the cost approach, market data approach, reproduction cost approach,development cost approach and income approach.
Depreciation is included in Occupancy and equipment-related expenses in the statement of income.
Rental income earned from investment properties amount to P216 million for the year endedDecember 31, 2010 (2009 – P195 million; 2008 – P182 million).
Note 16 - Investments in Subsidiaries and Associates
This account at December 31 consists of investments in shares of stock:
Consolidated Parent2010 2009 2010 2009
(In Millions of Pesos)Carrying value (net of impairment)
Investments at equity methodInvestments at cost method
2,508-
1,639-
-6,969
-6,952
2,508 1,639 6,969 6,952

(73)
Investments in associates carried at equity method in the consolidated statement of condition follow:
Percentage of ownershipinterest (%) Acquisition cost
Name of entity 2010 2009 2010 2009(In Millions of Pesos)
BPI - Philamlife Assurance Corporation* 47.67 47.67 371 371National Reinsurance Corporation** 15.74 15.74 204 204Beacon Properties 20.00 20.00 100 100BPI Globe BanKO - 40.00 - 200Victoria 1552 Investments, LP 35.00 35.00 7 7Citytrust Realty Corporation 40.00 40.00 2 2
684 884Allowance for impairment (7) -
677 884*Became an associate due to loss of control in 2009**BPI Group has significant influence
Details and movements of investments in associates carried at equity method in the consolidated financialstatements follow:
2010 2009(In Millions of Pesos)
Acquisition costAt January 1 884 313Additions - 571Effect of consolidation of BPI Globe BanKO, Inc. (200) -Allowance for impairment (7) -At December 31 677 884
Accumulated equity in net incomeAt January 1 820 348Share in net loss for the year 195 (21)Share in accumulated net income of former subsidiaries - 507Dividends received (14) (14)Effect of consolidation of BPI Globe BanKO, Inc. 65 -At December 31 1,066 820
Accumulated share in other comprehensive income (loss)At January 1 (65) 69Share in accumulated other comprehensive income (loss) of former
subsidiaries - (69)Share in other comprehensive loss for the year 830 (65)At December 31 765 (65)
2,508 1,639
“Additions” in acquisition cost represents costs of remaining investments in former subsidiaries whichbecame associates in 2009 due to loss of control. Similarly, the BPI Group’s accumulated share in netincome and other comprehensive income based on the remaining equity interest in the associates are alsoreclassified following the loss of control (Note 23).
Summarized unaudited financial information of associates follows:
2010 2009(In Millions of Pesos)
Total assets 33,278 33,862Total liabilities 23,947 19,681Total revenues 1,514 2,205

(74)
The details of equity investments at cost method in the separate financial statements of the Parent Bankfollow:
Acquisition costAllowance forimpairment Carrying value
2010 2009 2010 2009 2010 2009(In Millions of Pesos)
SubsidiariesBPI Europe Plc. 1,910 1,910 - - 1,910 1,910Ayala Plans, Inc. (API) 863 863 - - 863 863BPI Leasing Corporation 644 644 - - 644 644BPI Capital Corporation 573 573 - - 573 573BPI Direct Savings Bank 392 392 - - 392 392FGU Insurance Corporation 303 303 - - 303 303Prudential Investments 300 300 - - 300 300BPI Foreign Exchange
Corporation 195 195 - - 195 195BPI Express Remittance
Corporation 191 191 - - 191 191BPI Family Savings Bank, Inc. 150 150 - - 150 150BPI Globe BanKO 200 - - - 200 -Others 675 651 (104) (104) 571 547
Associates (see above) 684 884 (7) - 677 8847,080 7,056 (111) (104) 6,969 6,952
In November 2009, ALAI declared its entire equity holdings in API as property dividend to its shareholders,which include the Parent Bank. Consequently, the Parent Bank recognized dividend income of P863 millionon its separate financial statements (see Note 25) and API became a direct subsidiary of the Parent Bankwith 100% equity interest.
In September 2009, BPI and the Philippine American Life and General Insurance Company (Philamlife)signed a strategic bancassurance joint venture (the Joint Venture), wherein Philamlife agreed to acquire a51% stake in ALAI. Proceeds from the sale calculated based on the initial net worth valuation amounted toP1,696 million which allowed BPI to generate a gain of P680 million in 2009. In 2010, BPI received anamount of P119 million as an additional consideration for the sale following the finalization of the net worthvaluation.
The Joint Venture is expected to benefit from the combined synergies, first-class resources and strength ofthe two leading companies in the Philippines’ financial industry. Following the sale, BPI’s ownership in ALAIwas reduced to 47.67% and the latter ceased to be a subsidiary of BPI due to loss of control. As a result,ALAI became an associate and is accounted for at equity method in the BPI Group’s December 31, 2009consolidated financial statements. Further, ALAI, as joint venture between Philamlife and BPI was renamedas BPI-Philamlife Assurance Corporation.
Also, in relation to the joint venture, BPI and Philamlife entered into a Distribution Agreement (the“Agreement”) whereby Philamlife will have access to BPI’s customer base for life insurance products andBPI will have reciprocal access to Philamlife's customers for banking products. The Agreement shall takeeffect for a period of 10 years starting in November 2009 and may be extended for another 5 years uponmutual agreement by the parties. Subject to performance of its obligations and meeting certain conditions,BPI will get a total distribution fee of P465 million under the said Agreement, of which a sum of P232.5million was received in 2010.

(75)
As approved by the BSP in October 2009, BPI sold 60% of its equity interest in PSB to Globe Telecom, Inc.(40%) and Ayala Corporation (20%). Subsequently, PSB was renamed as BPI-Globe BanKO Savings Bank.
Note 17 - Deferred Income Taxes
The significant components of deferred income tax assets and liabilities at December 31 are as follows:
Consolidated Parent2010 2009 2010 2009
(In Millions of Pesos)Deferred income tax assets
Allowance for impairment 4,995 4,530 3,810 3,704Net operating loss carry over (NOLCO) 11 475 - 466Fair value loss on available-for-sale securities (130) 201 (104) 271Minimum corporate income tax (MCIT) 668 467 623 461Others 1,179 556 735 506
Total deferred income tax assets 6,723 6,229 5,064 5,408Deferred income tax liabilities
Revaluation gain on properties (1,017) (1,068) (1,017) (1,068)Leasing income differential between finance
and operating leases - (6) - -Excess pension asset contribution (8) (10) - -Others (675) (273) (245) (202)
Total deferred income tax liabilities (1,700) (1,357) (1,262) (1,270)5,023 4,872 3,802 4,138
Consolidated Parent2010 2009 2010 2009
(In Millions of Pesos)Deferred income tax assets
Amount to be recovered within 12 months 797 1,132 729 1,082Amount to be recovered after 12 months 5,926 5,097 4,335 4,326
6,723 6,229 5,064 5,408Deferred income tax liabilities
Amount to be settled within 12 months 187 126 187 121Amount to be settled after 12 months 1,513 1,231 1,075 1,149
1,700 1,357 1,262 1,270
The movement in the deferred income tax account is summarized as follows:
Consolidated Parent2010 2009 2010 2009
(In Millions of Pesos)At January 1 4,872 5,676 4,138 4,981Income statement charge 346 (922) (127) (1,055)Fair value adjustment on available-for-sale securities (331) (97) (375) (19)Others 136 215 166 231At December 31 5,023 4,872 3,802 4,138

(76)
The deferred tax charge in the statement of income comprises the following temporary differences:
Consolidated Parent2010 2009 2008 2010 2009 2008
(In Millions of Pesos)Allowance for impairment (465) (438) (214) (106) (291) (188)NOLCO 464 954 708 466 946 722Pension (113) (229) (34) (77) (176) (12)Leasing income differential (6) (5) 57 - - -Others (226) 640 345 (156) 576 342
(346) 922 862 127 1,055 864
The outstanding NOLCO at December 31 consists of:
Consolidated ParentYear of Incurrence Year of Expiration 2010 2009 2010 2009
(In Millions of Pesos)2010 2013 7 - - -2009 2012 110 110 92 922008 2011 3 47 - -2007 2010 1,469 1,469 1,462 1,462
2004/2006 2009 - 3,245 - 3,2452005 2008 - - - -
1,589 4,871 1,554 4,799Used portion during the year (1,554) (44) (1,554) -Expired portion during the year - (3,245) - (3,245)
35 1,582 - 1,554Tax rate 30% 30% 30% 30%Deferred income tax asset on NOLCO 11 475 - 466
NOLCO which expired in 2009 includes losses sustained from sale of non-performing assets to specialpurpose vehicle (SPV) entities in 2004 which are carried forward for a period of five years in accordance withthe Philippine SPV law.
The details of MCIT at December 31 are as follows:
Consolidated ParentYear of Incurrence Year of Expiration 2010 2009 2010 2009
(In Millions of Pesos)2010 2013 194 - 190 -2009 2012 234 234 232 2322008 2011 268 268 229 2292007 2010 - 258 - 2282006 2009 - 3 -
696 763 651 689Used portion during the year - (68) - -Derecognized MCIT (28) (228) (28) (228)
668 467 623 461

(77)
Note 18 - Other Resources
The account at December 31 consists of the following:
Consolidated Parent2010 2009 2010 2009
(In Millions of Pesos)Accounts receivable 2,064 2,828 1,765 2,649Residual value of equipment for lease 1,471 1,160 - -Deferred charges 820 344 764 291Creditable withholding tax 738 677 547 483Other accrued interest and fees receivable 667 416 481 366Sales contracts receivable 539 301 309 273Prepaid expenses 400 459 311 381Inter-office float items 304 340 297 306Accrued trust income 241 213 233 206Returned checks and other cash items 152 134 139 122Documentary stamp tax 62 115 14 82Miscellaneous assets 2,234 1,749 1,852 1,287
Allowance for impairment9,692
(1,332)8,736
(1,020)6,712
(1,280)6,446(976)
8,360 7,716 5,432 5,470
Consolidated Parent2010 2009 2010 2009
(In Millions of Pesos)Current 3,909 4,770 3,236 4,112Non-current 5,783 3,966 3,476 2,334
9,692 8,736 6,712 6,446
Miscellaneous assets include deposits on leased properties, unused supplies and miscellaneous checks.
The reconciliation of the allowance for impairment at December 31 is summarized as follows:
Consolidated Parent2010 2009 2010 2009
(In Millions of Pesos)At January 1 1,020 1,026 976 990Provision for impairment losses 613 10 343 2Write-off (301) (16) (39) (16)At December 31 1,332 1,020 1,280 976

(78)
Note 19 - Deposit Liabilities
This account at December 31 consists of:
Consolidated Parent2010 2009 2010 2009
(In Millions of Pesos)Demand 120,528 108,040 113,281 101,348Savings 245,769 202,708 211,815 174,849Time 353,469 268,723 266,840 195,834
719,766 579,471 591,936 472,031
Consolidated Parent2010 2009 2010 2009
(In Millions of Pesos)Current 684,693 563,655 588,243 466,298Non-current 35,073 15,816 3,693 5,733
719,766 579,471 591,936 472,031
Related interest expense on deposit liabilities is broken down as follows:
Consolidated Parent2010 2009 2008 2010 2009 2008
(In Millions of Pesos)Demand 628 607 603 583 563 559Savings 1,608 1,136 1,049 1,345 938 875Time 9,833 9,486 11,700 6,153 5,798 7,524
12,069 11,229 13,352 8,081 7,299 8,958
Under existing BSP regulations, the BPI Group is subject to liquidity and statutory reserve requirements withrespect to certain deposit liabilities. The BPI Group is in full compliance with all applicable liquidity andstatutory reserve requirements.
The required liquidity and statutory reserves as reported to BSP as of December 31 comprise as follows:
Consolidated Parent2010 2009 2010 2009
Due from BSP (In Millions of Pesos)Reserve deposit account 53,828 40,810 51,662 38,953Special deposit account 27,050 17,773 22,517 14,386
Cash in vault 16,788 15,696 16,348 15,151Available for sale securities 2,222 2,084 1,682 1,544Due from local banks 3 3 - -
99,891 76,366 92,209 70,034

(79)
Note 20 - Bills Payable
This account at December 31 consists of:
Consolidated Parent2010 2009 2010 2009
(In Millions of Pesos)Bangko Sentral ng Pilipinas 9,252 26,334 7,363 23,782Private firms 3,441 4,174 - -Local banks 2,870 1,501 576 834Foreign banks 9,305 - 9,304 -
24,868 32,009 17,243 24,616
Average interest rates (%) of bills payable of the BPI Group follow:
2010 2009Bangko Sentral ng Pilipinas 3.87 3.56Private firms 4.79 8.97Local banks - peso-denominated 4.44 6.34Foreign banks 0.55 1.02
Bills payable include funds borrowed from Land Bank of the Philippines (LBP), Development Bank of thePhilippines (DBP) and Social Security System (SSS) which were relent to customers of the BPI Group inaccordance with the financing programs of LBP, DBP and SSS and credit balances of settlement bankaccounts. The average payment terms of these bills payable is 1.14 years. Loans and advances of the BPIGroup arising from these financing programs serve as security for the related bills payable (Note 13).
Note 21 - Unsecured Subordinated Debt
On December 12, 2008 (issue date), the Parent Bank issued P5,000 million worth of unsecuredsubordinated notes (the “Notes”) eligible as Lower Tier 2 capital pursuant to BSP Circular No. 280, series of2001, as amended. The Notes will at all times, rank pari passu and without any preference amongthemselves and at least equally with all other present and future unsecured and subordinated obligations ofthe Parent Bank, except obligations mandatorily preferred by law. The Notes bear interest at the rate of8.45% per annum and will mature on December 12, 2018 (maturity date). The interest is payable quarterlyin arrears from December 12, 2008 until December 11, 2018. The Notes are redeemable in whole and notonly in part at the exclusive option of the Parent Bank on December 13, 2013 (redemption date) subject tothe satisfaction of certain regulatory approval requirements. Unless the Notes are earlier redeemed onDecember 13, 2013, the applicable interest rate will be increased to the rate equal to 80% multiplied by the5-year on-the-run Philippine Treasury benchmark bid yield (benchmark rate) on the first day of the 21stinterest period plus the step-up spread. The step-up spread is equal to 150% of 8.45% less 80% of thebenchmark rate.
Interest expense on the unsecured subordinated notes recognized during the year is P423 million(2009 – P423 million).

(80)
Note 22 - Deferred Credits and Other Liabilities
The account at December 31 consists of the following:
Consolidated ParentNote 2010 2009 2010 2009
(In Millions of Pesos)Bills purchased - contra 10,429 11,388 10,422 11,376Accounts payable 2,937 2,486 1,778 1,803Deposit on lease contract 1,728 1,378 - -Acceptances outstanding 1,031 1,064 1,031 1,064Withholding tax payable 809 433 704 356Vouchers payable 459 583 459 583Other credits - dormant 566 413 498 367Due to the Treasurer of the Philippines 238 220 218 200Cash letters of credit 54 83 54 83Pension liability 30 - 817 - 838Miscellaneous liabilities 2,138 1,515 1,751 1,061
20,389 20,380 16,915 17,731
Bills purchased – contra represents liabilities arising from the outright purchases of checks before actualclearing as a means of immediate financing offered by the BPI Group. Miscellaneous liabilities includeinsurance and other employee-related payables and other deferred credits.
Consolidated Parent2010 2009 2010 2009
(In Millions of Pesos)Current 17,392 16,123 13,690 15,007Non-current 2,997 4,257 3,225 2,724
20,389 20,380 16,915 17,731
Note 23 - Capital Funds
Details of authorized capital stock of the Parent Bank follow:
2010 2009 2008(In Millions of Pesos
Except Par Value Per Share)Authorized capital (at P10 par value per share)
Common sharesPreferred A shares
49,000600
49,000600
49,000600
49,600 49,600 49,600
On March 18, 2008, the Parent Bank declared 20% stock dividends on total issued and outstandingcommon shares, distributed to all common shareholders of record 15 working days after the approval by theSEC of the increase in authorized capital stock of the Parent Bank as discussed below.
On June 24, 2008, the SEC approved the Parent Bank’s application for increase in its authorized capitalstock from P29.6 billion to P49.6 billion as follows:
From To
Number ofshares
Amount(In Millions of
Pesos)Number of
shares
Amount(In Millionsof Pesos)
Authorized shares (at P10 par value per share)Common sharesPreferred A shares
2,900,000,00060,000,000
29,000600
4,900,000,00060,000,000
49,000600
29,600 49,600
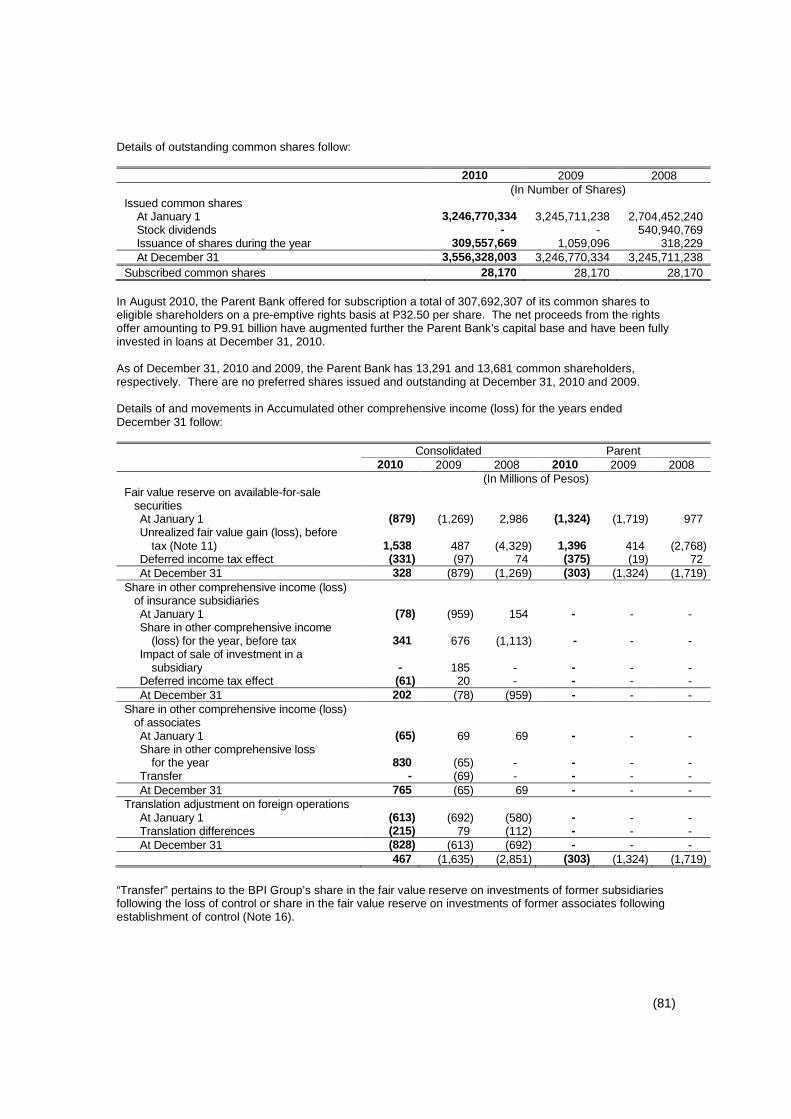
(81)
Details of outstanding common shares follow:
2010 2009 2008(In Number of Shares)
Issued common sharesAt January 1 3,246,770,334 3,245,711,238 2,704,452,240Stock dividends - - 540,940,769Issuance of shares during the year 309,557,669 1,059,096 318,229At December 31 3,556,328,003 3,246,770,334 3,245,711,238
Subscribed common shares 28,170 28,170 28,170
In August 2010, the Parent Bank offered for subscription a total of 307,692,307 of its common shares toeligible shareholders on a pre-emptive rights basis at P32.50 per share. The net proceeds from the rightsoffer amounting to P9.91 billion have augmented further the Parent Bank’s capital base and have been fullyinvested in loans at December 31, 2010.
As of December 31, 2010 and 2009, the Parent Bank has 13,291 and 13,681 common shareholders,respectively. There are no preferred shares issued and outstanding at December 31, 2010 and 2009.
Details of and movements in Accumulated other comprehensive income (loss) for the years endedDecember 31 follow:
Consolidated Parent2010 2009 2008 2010 2009 2008
(In Millions of Pesos)Fair value reserve on available-for-sale
securitiesAt January 1 (879) (1,269) 2,986 (1,324) (1,719) 977Unrealized fair value gain (loss), before
tax (Note 11) 1,538 487 (4,329) 1,396 414 (2,768)Deferred income tax effect (331) (97) 74 (375) (19) 72At December 31 328 (879) (1,269) (303) (1,324) (1,719)
Share in other comprehensive income (loss)of insurance subsidiariesAt January 1 (78) (959) 154 - - -Share in other comprehensive income
(loss) for the year, before tax 341 676 (1,113) - - -Impact of sale of investment in a
subsidiary - 185 - - - -Deferred income tax effect (61) 20 - - - -At December 31 202 (78) (959) - - -
Share in other comprehensive income (loss)of associatesAt January 1 (65) 69 69 - - -Share in other comprehensive loss
for the year 830 (65) - - - -Transfer - (69) - - - -At December 31 765 (65) 69 - - -
Translation adjustment on foreign operationsAt January 1 (613) (692) (580) - - -Translation differences (215) 79 (112) - - -At December 31 (828) (613) (692) - - -
467 (1,635) (2,851) (303) (1,324) (1,719)
“Transfer” pertains to the BPI Group’s share in the fair value reserve on investments of former subsidiariesfollowing the loss of control or share in the fair value reserve on investments of former associates followingestablishment of control (Note 16).

(82)
Details of and movements in Reserves for the years ended December 31 follow:
Consolidated Parent2010 2009 2008 2010 2009 2008
(In Millions of Pesos)Stock option scheme (Note 24)
At January 1 179 253 230 136 198 182Exercise of options (137) (74) (21) (125) (62) (21)Value of employee services - - 44 - - 37At December 31 42 179 253 11 136 198
Surplus reservesAt January 1 1,215 1,043 963 1,215 1,043 963Transfer from surplus 110 172 80 110 172 80At December 31 1,325 1,215 1,043 1,325 1,215 1,043
1,367 1,394 1,296 1,336 1,351 1,241
Surplus reserves consist of:
2010 2009 2008(In Millions of Pesos)
Reserve for trust businessReserve for self-insurance
1,29134
1,18134
1,00934
1,325 1,215 1,043
In compliance with existing BSP regulations, 10% of the Parent Bank’s income from trust business isappropriated to surplus reserve. This yearly appropriation is required until the surplus reserve for trustbusiness reaches 20% of the Parent Bank’s regulatory net worth.
Reserve for self-insurance represents the amount set aside to cover losses due to fire, defalcation by andother unlawful acts of personnel and third parties.
Cash dividends declared by the Board of Directors of the Parent Bank during the years 2007 to 2010 follow:
Date declared Date approved by the BSP
Amount of dividends
Per shareTotal
(In Millions of Pesos)
November 21, 2007November 21, 2007
January 18, 2008January 18, 2008
0.901.00
2,4342,705
June 18, 2008 August 3, 2008 0.90 2,921December 17, 2008 February 18, 2009 0.90 2,921June 17, 2009 August 3, 2009 0.90 2,922December 16, 2009May 20, 2010October 22, 2010
January 25, 2010June 22, 2010November 15, 2010
0.900.900.90
2,9222,9223,200
Cash dividends declared are payable to common shareholders of record as of 15th day from receipt by theParent Bank of the approval by the Bangko Sentral and distributable on the 15th day from the said recorddate.

(83)
The calculation of earnings per share (EPS) is shown below:
Consolidated Parent2010 2009 2008 2010 2009 2008
(In Millions, Except Earnings Per Share Amounts)a) Net income attributable to equity holders
of the Parent Bank 11,312 8,516 6,423 8,306 8,753 8,305b) Weighted average number of common
shares outstanding during the year afterretroactive effect of stock dividends 3,350 3,246 3,246 3,350 3,246 3,246
c) Basic EPS (a/b) 3.38 2.62 1.98 2.48 2.69 2.56
The equivalent common shares arising from potential exercise of stock options (Note 24) have insignificanteffect on the calculation of diluted EPS thus, basic and diluted EPS are the same for the years presented.
Note 24 - Stock Option Plan
The BPI Group grants options to qualified officers under its Executive Stock Option Plan (ESOP). The optionsvest over a period of three years as follows: (a) 40% after the second anniversary of the option grant date; and(b) 60% after the third anniversary of the option grant date. The option to purchase shares under this plan shallexpire five years from grant date.
Movements in the number of share options are as follows:
2010 2009At January 1 7,617,387 12,728,067Granted - -Exercised (7,438,864) (5,110,680)Cancelled (178,523) -At December 31 - 7,617,387Exercisable - 7,617,387
Options granted in 2008 represent additional entitlement as a result of the declaration of stock dividends by theParent Bank (Note 23). The fair value of options was determined using the Black-Scholes model. Thesignificant inputs into the model were share prices of P61.50 at the grant date, exercise price of P37.78,standard deviation of expected share price returns of 30%, option life of 3 years, and annual risk free interestrate of 5.25%. The volatility measured at the standard deviation of expected share price returns is based onstatistical analysis of daily share prices over the last three years.
The weighted average share price for share options exercised in 2010 and 2009 is P31.48. Optionsoutstanding at December 31, 2009 have remaining contractual life of 1 year (2008 - 2 years) and weightedexercise price of P31.48. All outstanding options are fully exercisable as at December 31, 2010.

(84)
Note 25 - Other Operating Income
Details of other operating income follow:
Consolidated Parent2010 2009 2008 2010 2009 2008
(In Millions of Pesos)
Trust and asset management fees 1,816 1,685 1,604 1,709 1,556 1,488Rental income 1,505 1,411 1,259 388 356 309Credit card income 1,180 1,063 785 1,180 1,063 785Gain on sale of assets 617 1,759 1,437 453 1,800 986Dividend income 85 124 67 206 2,906 4,061Others 622 375 946 494 224 672
5,825 6,417 6,098 4,430 7,905 8,301
Trust and asset management fees arise from the BPI Group’s asset management and trust services and arebased on agreed terms with the various managed funds and investments.
Rental income is earned by the BPI Group by leasing out its investment properties (Note 15) and other assets.
Gain on sale of assets arises mainly from disposals of properties (including equity investments), foreclosedcollaterals and non-performing assets.
Dividend income recognized by the Parent Bank substantially pertains to dividend distribution of subsidiaries.
Note 26 - Leases
The BPI Group and the Parent Bank have various lease agreements which are renewable under certain termsand conditions. The rentals (included in Occupancy and equipment-related expenses) under these leasecontracts are as follows:
Consolidated Parent(In Millions of Pesos)
2010 809 6342009 777 6072008 813 562
The future minimum lease payments under non-cancellable operating leases of the BPI Group are as follows:
2010 2009(In Millions of Pesos)
No later than 1 year 40 49Later than 1 year but no later than 5 years 76 73
116 122

(85)
Note 27 - Other Operating Expenses
Details of other operating expenses follow:
Consolidated Parent2010 2009 2008 2010 2009 2008
(In Millions of Pesos)Supervision and examination fees 1,477 1,347 1,219 1,227 1,100 997Advertising 1,206 833 802 1,054 708 628Travel and communication 576 503 511 436 392 388Litigation expenses 494 492 586 343 343 467Insurance 312 206 148 51 36 53Office supplies 235 223 226 194 184 183Management and other
professional fees 189 261 252 131 194 198Documentary stamps 41 48 118 12 21 58Representation and entertainment 41 38 38 35 32 30Others 1,163 925 1,011 924 872 956
5,734 4,876 4,911 4,407 3,882 3,958
Note 28 - Income Taxes
A reconciliation between the provision for income tax at the statutory tax rate and the actual provision forincome tax for the years ended December 31 follows:
Consolidated2010 2009 2008
AmountRate(%) Amount
Rate(%) Amount
Rate(%)
(In Millions of Pesos)Statutory income tax 4,377 30.00 3,655 30.00 3,340 35.00Effect of items not subject to statutory tax rate:
Income subjected to lower tax rates (1,503) (6.91) (368) (2.82) (285) (2.98)Tax-exempt income (1,317) (7.63) (2,115) (17.42) (1,768) (18.53)Others, net 1,553 6.96 2,347 18.76 1,698 17.80
Actual income tax 3,110 22.42 3,519 28.52 2,985 31.29
Parent2010 2009 2008
AmountRate(%) Amount
Rate(%) Amount
Rate(%)
(In Millions of Pesos)Statutory income tax 3,304 30.00 3,506 30.00 3,688 35.00Effect of items not subject to statutory tax rate:
Income subjected to lower tax rates (1,343) (7.38) (400) (3.42) (105) (1.00)Tax-exempt income (645) (4.08) (1,479) (12.66) (1,900) (18.03)Others, net 1,392 6.50 1,308 11.20 551 5.23
Actual income tax 2,708 25.04 2,935 25.12 2,234 21.20
“Others, net” in 2008 includes impact of change in corporate income tax rates from 35% to 30% on futuredeductible and taxable differences.
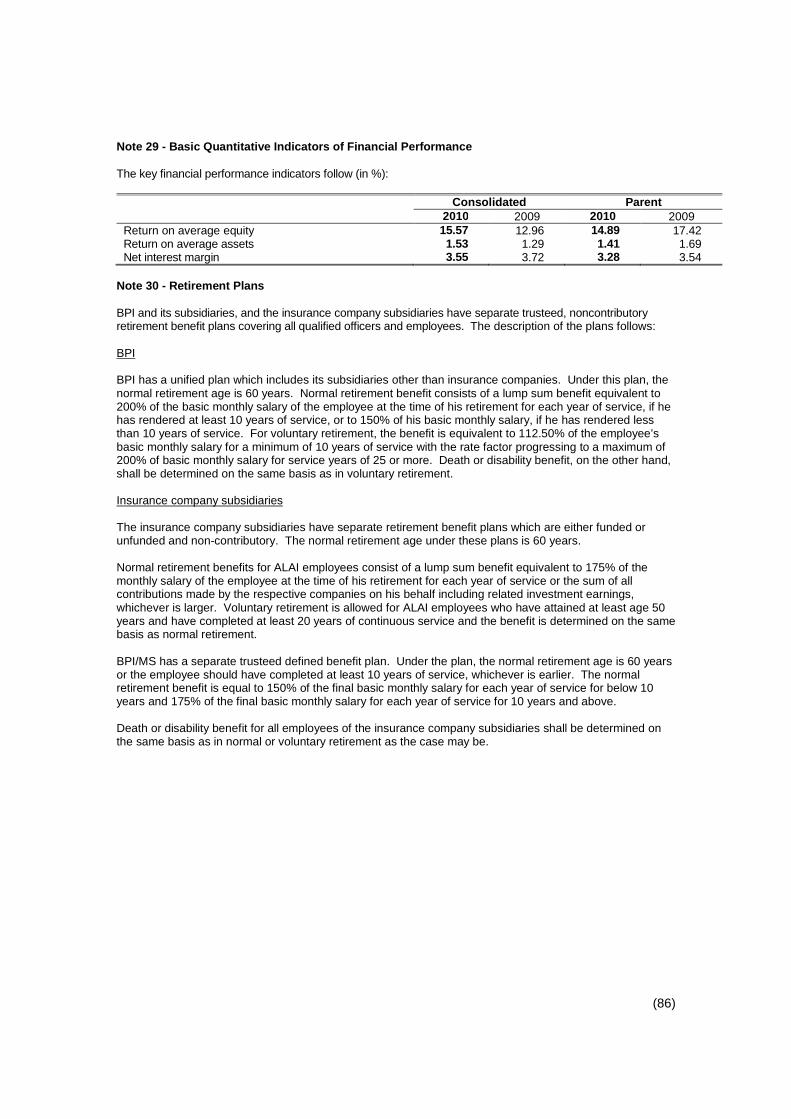
(86)
Note 29 - Basic Quantitative Indicators of Financial Performance
The key financial performance indicators follow (in %):
Consolidated Parent2010 2009 2010 2009
Return on average equityReturn on average assetsNet interest margin
15.571.533.55
12.961.293.72
14.891.413.28
17.421.693.54
Note 30 - Retirement Plans
BPI and its subsidiaries, and the insurance company subsidiaries have separate trusteed, noncontributoryretirement benefit plans covering all qualified officers and employees. The description of the plans follows:
BPI
BPI has a unified plan which includes its subsidiaries other than insurance companies. Under this plan, thenormal retirement age is 60 years. Normal retirement benefit consists of a lump sum benefit equivalent to200% of the basic monthly salary of the employee at the time of his retirement for each year of service, if hehas rendered at least 10 years of service, or to 150% of his basic monthly salary, if he has rendered lessthan 10 years of service. For voluntary retirement, the benefit is equivalent to 112.50% of the employee’sbasic monthly salary for a minimum of 10 years of service with the rate factor progressing to a maximum of200% of basic monthly salary for service years of 25 or more. Death or disability benefit, on the other hand,shall be determined on the same basis as in voluntary retirement.
Insurance company subsidiaries
The insurance company subsidiaries have separate retirement benefit plans which are either funded orunfunded and non-contributory. The normal retirement age under these plans is 60 years.
Normal retirement benefits for ALAI employees consist of a lump sum benefit equivalent to 175% of themonthly salary of the employee at the time of his retirement for each year of service or the sum of allcontributions made by the respective companies on his behalf including related investment earnings,whichever is larger. Voluntary retirement is allowed for ALAI employees who have attained at least age 50years and have completed at least 20 years of continuous service and the benefit is determined on the samebasis as normal retirement.
BPI/MS has a separate trusteed defined benefit plan. Under the plan, the normal retirement age is 60 yearsor the employee should have completed at least 10 years of service, whichever is earlier. The normalretirement benefit is equal to 150% of the final basic monthly salary for each year of service for below 10years and 175% of the final basic monthly salary for each year of service for 10 years and above.
Death or disability benefit for all employees of the insurance company subsidiaries shall be determined onthe same basis as in normal or voluntary retirement as the case may be.

(87)
Following are the amounts recognized based on recent actuarial valuations:
(a) Pension liability (asset) recognized in the statement of condition
Consolidated2010 2009 2008 2007 2006
(In Millions of Pesos)Present value of defined benefit obligations 10,388 10,260 9,607 9,262 8,645Fair value of plan assets (8,421) (6,576) (5,615) (6,664) (6,831)Deficit in the plan 1,967 3,684 3,992 2,598 1,814Unrecognized actuarial losses (1,995) (2,867) (3,938) (2,919) (2,138)Pension liability (asset) recognized in the
statement of condition (28) 817 54 (321) (324)
Parent2010 2009 2008 2007 2006
(In Millions of Pesos)Present value of defined benefit obligations 8,182 7,985 7,475 7,199 6,487Fair value of plan assets (6,775) (5,097) (4,373) (5,180) (4,968)Deficit in the plan 1,407 2,888 3,102 2,019 1,519Unrecognized actuarial losses (1,408) (2,050) (2,851) (2,053) (1,566)Pension liability (asset) recognized in the
statement of condition (1) 838 251 (34) (47)
Pension liability is included in “Deferred credits and other liabilities” (Note 22). Pension asset is shown aspart of “Miscellaneous assets” within Other resources (Note 18).
Experience adjustments at December 31 follow:
Consolidated2010 2009 2008 2007 2006
(In Millions of Pesos)Experience gain (loss) on plan liabilities (371) (151) 34 1,386 2,456Experience gain (loss) on plan assets 479 755 (1,223) (493) 1,033
Parent2010 2009 2008 2007 2006
(In Millions of Pesos)Experience gain (loss) on plan liabilities (255) (99) 16 1,349 1,898Experience gain (loss) on plan assets 406 583 (952) 5 707
The movement in plan assets is summarized as follows:
Consolidated Parent2010 2009 2010 2009
(In Millions of Pesos)At January 1 6,576 5,615 5,097 4,373Expected return on plan assets 692 344 536 268Contributions 1,813 496 1,598 383Benefit payments (1,139) (634) (862) (510)Actuarial gains (losses) 479 755 406 583At December 31 8,421 6,576 6,775 5,097

(88)
The plan assets are comprised of the following:
Consolidated Parent2010 2009 2010 2009
Amount % Amount % Amount % Amount %(In Millions of Pesos Except for Rates)
Debt securities 4,800 57 3,258 50 3,889 57 2,548 50Equity securities 3,537 42 3,255 49 2,845 42 2,498 49Others 84 1 63 1 41 1 51 1
8,421 100 6,576 100 6,775 100 5,097 100
Pension plan assets of the unified retirement plan include investment in BPI’s common shares with fair valueof P2,209 million and P2,597 million at December 31, 2010 and 2009, respectively. The actual return onplan assets was P1,171 million and P1,099 million gain in 2010 and 2009, respectively.
The movement in the present value of defined benefit obligation is summarized as follows:
Consolidated Parent2010 2009 2010 2009
(In Millions of Pesos)At January 1 10,260 9,607 7,985 7,475Current service cost 471 407 379 316Interest cost 1,097 1,056 854 821Benefit payments (1,139) (634) (862) (510)Actuarial gains (301) (176) (174) (117)At December 31 10,388 10,260 8,182 7,985
(b) Expense recognized in the statement of income
Consolidated Parent2010 2009 2008 2010 2009 2008
(In Millions of Pesos)Current service cost 471 407 536 379 316 417Interest cost 1,097 1,056 769 854 821 598Expected return on plan assets (692) (344) (553) (536) (268) (430)Net actuarial loss recognized during
the year 92 141 95 63 100 64Total expense included in Compensation
and fringe benefits 968 1,260 847 760 969 649
The principal assumptions used for the actuarial valuations of the unified plan of the BPI Group were asfollows:
2010 2009 2008Discount rate 10.79% 10.69% 10.98%Expected return on plan assets 10.00% 10.52% 6.13%Future salary increases 6.50% 6.00% 6.00%
The expected return on plan assets was determined by considering the expected returns available on theassets underlying the current investment policy. Expected yields on fixed interest investments are based ongross redemption yields as at the reporting date. Expected returns on equity securities and propertyinvestments reflect long-term real rates of return experienced in the respective markets.
Assumptions regarding future mortality and disability experience are based on published statistics generallyused for local actuarial valuation purposes.
The average remaining service life of employees under the BPI unified retirement plan as at December 31,2010 and 2009 is 21 years. The BPI Group’s expected retirement contribution for the year endingDecember 31, 2010 amounts to P923 million.

(89)
Note 31 - Trust Assets
On December 8, 2010, a Business Sale and Purchase Agreement (BSPA) was signed between BPI and INGBank N.V. - Manila (ING). Under the terms of the BSPA, BPI will acquire 100% of ING’s trust assets subject tocertain conditions, including regulatory approvals. As at reporting date, the final price has not yet beenfinalized and BPI has made initial payments to ING. The deal is expected to be completed within 2011.
At December 31, 2010 and 2009, the net asset value of trust assets administered by the BPI Group amounts toP480 billion and P435 billion, respectively.
Government securities deposited by the BPI Group and the Parent Bank with the Bangko Sentral incompliance with the requirements of the General Banking Act relative to the trust functions follow:
Consolidated Parent2010 2009 2010 2009
(In Millions of Pesos)Government securities 4,924 4,105 4,768 3,941
Note 32 - Related Party Transactions
Included in the financial statements are various transactions of the Parent Bank with its domestic and foreignsubsidiaries and affiliates, and with its directors, officers, stockholders and related interest (DOSRI). Thesetransactions usually arise from normal banking activities such as deposit arrangements, trading ofgovernment securities and commercial papers, sale of assets, lending/borrowing of funds, lease of bankpremises, investment advisory/management, service arrangements and advances for operating expenses.
Significant related party transactions are summarized below:
a) Loans and advances and deposits from related parties
Details of DOSRI loans are as follows:
Consolidated Parent2010 2009 2010 2009
(In Millions of Pesos)Outstanding DOSRI loans 6,296 7,184 6,233 7,123% to total outstanding loans and advances 1.62 2.15 2.21 2.90% to total outstanding DOSRI loans
Unsecured DOSRI loans 27.05 25.31 27.33 25.53Past due DOSRI loans Nil Nil Nil NilNon-performing DOSRI loans Nil Nil Nil Nil
At December 31, 2010 and 2009, the BPI Group is in full compliance with the General Banking Act and theBSP regulations on DOSRI loans.
Deposits from related parties at December 31, 2010 follow:
Consolidated Parent2010 2009 2010 2009
(In Millions of Pesos)Subsidiaries 2,610 1,897 2,474 1,811Associates 61 12,714 61 12,714
2,671 14,611 2,535 14,525
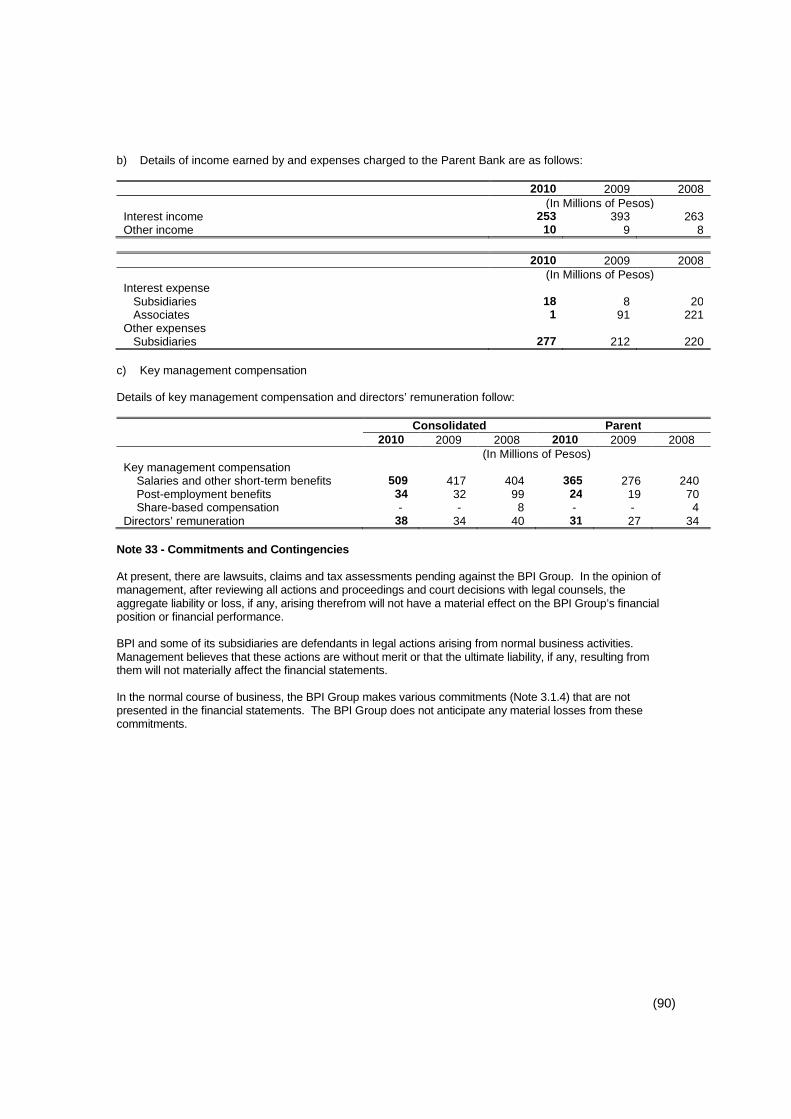
(90)
b) Details of income earned by and expenses charged to the Parent Bank are as follows:
2010 2009 2008(In Millions of Pesos)
Interest income 253 393 263Other income 10 9 8
2010 2009 2008(In Millions of Pesos)
Interest expenseSubsidiaries 18 8 20Associates 1 91 221
Other expensesSubsidiaries 277 212 220
c) Key management compensation
Details of key management compensation and directors’ remuneration follow:
Consolidated Parent2010 2009 2008 2010 2009 2008
(In Millions of Pesos)Key management compensation
Salaries and other short-term benefits 509 417 404 365 276 240Post-employment benefits 34 32 99 24 19 70Share-based compensation - - 8 - - 4
Directors’ remuneration 38 34 40 31 27 34
Note 33 - Commitments and Contingencies
At present, there are lawsuits, claims and tax assessments pending against the BPI Group. In the opinion ofmanagement, after reviewing all actions and proceedings and court decisions with legal counsels, theaggregate liability or loss, if any, arising therefrom will not have a material effect on the BPI Group’s financialposition or financial performance.
BPI and some of its subsidiaries are defendants in legal actions arising from normal business activities.Management believes that these actions are without merit or that the ultimate liability, if any, resulting fromthem will not materially affect the financial statements.
In the normal course of business, the BPI Group makes various commitments (Note 3.1.4) that are notpresented in the financial statements. The BPI Group does not anticipate any material losses from thesecommitments.

(91)
Note 34 - Supplementary information required by BIR Revenue Regulations No. 15-2010
On December 28, 2010, Revenue Regulation (RR) No. 15-2010 became effective and amended certainprovisions of RR No. 21-2002 prescribing the manner of compliance with any documentary and/or proceduralrequirements in connection with the preparation and submission of financial statements and income taxreturns. Section 2 of RR No. 21-2002 was further amended to include in the notes to financial statementsinformation on taxes, duties and license fees paid or accrued during the year in addition to what is mandatedby PFRS.
Below is the additional information required by RR No. 15-2010 that is relevant to the Parent Bank. Thisinformation is presented for purposes of filing with the Bureau of Internal Revenue (BIR) and is not a requiredpart of the basic financial statements.
a) Documentary stamp tax
Documentary stamp taxes paid for the year ended December 31, 2010 consist of:
TotalDeposit and loan documents 1,459Trade finance documents 219Mortgage documents 48Shares of stock 16Others 10
1,752
A portion of the amount disclosed above was passed on to the counterparties.
b) Withholding taxes
Withholding taxes paid/accrued and/or withheld for the year ended December 31, 2010 consist of:
Paid Accrued TotalFinal income taxes withheld on interest on deposits
and yield on deposit substitutesIncome taxes withheld on compensation
1,2071,191
150171
1,3571,362
Final income taxes withheld on income payment 535 314 849Creditable income taxes withheld (expanded) 520 58 578Fringe benefit taxVAT withholding tax
3622
92
4524
3,511 704 4,215
c) All other local and national taxes
All other local and national taxes paid/accrued for the year ended December 31, 2010 consist of:
Paid Accrued TotalGross receipts tax 2,066 188 2,254Real property tax 69 - 69Municipal taxes 62 - 62Others 6 - 6
2,203 188 2,391
d) Tax cases and assessments
As of reporting date, (i) the Parent Bank has outstanding cases filed in courts against local governmentunits contesting certain local tax assessments and the tax authorities for various claims for tax refund.Management is of the opinion that the ultimate outcome of these cases will not have a material impacton the financial statements of the Parent Bank and (ii) the only year that remains open and currentlyunder tax examination, for which no assessment has yet been received, is taxable year 2009.

ANNEX “C” MANAGEMENT REPORT Description of business BPI is the third largest commercial bank in the country in terms of total assets. It has a significant market share in deposits, lending, and asset management and trust business. It is recognized as among the top commercial bank in overseas Filipino (OF) remittances and enjoys a significant presence in the finance and operating lease business, government securities dealership, securities distribution and foreign exchange business. BPI is a recognized leader in electronic banking, having introduced most of the firsts in the industry, such as the automated teller machines (ATMs), a point-of-sale debit system, kiosk banking, phone banking, internet banking and mobile banking. Principal Subsidiaries. The bank’s principal subsidiaries are: (1) BPI Family Savings Bank, Inc. (BFSB) serves as BPI’s primary vehicle for retail deposits,
housing loans and auto finance. It has been in the business since 1985. (2) BPI Capital Corporation is an investment house focused on corporate finance and the
securities distribution business. It began operations as an investment house in December 1994. It merged with FEB Investments Inc. on December 27, 2002. It wholly owns BPI Securities Corporation, a stock brokerage company.
(3) BPI Leasing Corporation is a quasi-bank concentrating in lease finance. Its quasi-
banking license was inherited from the merger with CityTrust Investment Phils. Inc. in May 1998. It was originally established as Makati Leasing and Finance Corporation in 1970. It merged with FEB Leasing & Finance Corporation on February 20, 2001. It wholly owns BPI Rental Corporation which offers operating leases.
(4) BPI Direct Savings Bank is a savings bank that provides internet and mobile banking
services to its customers. It started operating as such on February 17, 2000 upon approval by the Bangko Sentral ng Pilipinas.
(5) BPI International Finance Limited, Hong Kong is a deposit taking company in Hong Kong.
It was originally established in August 1974. (6) BPI Express Remittance Corp. (U.S.A) is a remittance center for overseas Filipino and
was incorporated on September 24, 1990. (7) Bank of the Philippine Islands (Europe) Plc was granted a UK banking license by the
Financial Services Authority (FSA) on April 26, 2007. It was officially opened to the public on October 1, 2007. In July 2008, BPI Europe was permitted by the FSA to carry out cross-border services in other EEA Member States.
(8) Ayala Plans, Inc. is BPI’s wholly owned pre-need insurance company acquired through
the merger with Ayala Insurance Holdings Corp (AIHC) in April 2000. (9) BPI/MS Insurance Corporation is a non-life insurance company formed through a merger
of FGU Insurance Corporation and FEB Mitsui Marine Insurance Company on January 7, 2002. FGU and FEB Mitsui were acquired by BPI through its merger with AIHC and FEBTC in April 2000.
Legal Proceedings The Bank does not have any material pending legal proceedings to which the registrant or any of its subsidiaries or affiliates is a party or of which any of their property is the subject.

2
Market Information The common shares of BPI have been listed on the Philippine Stock Exchange (PSE) since 1966. The table below shows the high and low prices of BPI shares transacted at the PSE for each quarter within the last three (3) fiscal years.
High Low Year Ended December 31, 2008
1st Quarter............... P 52.92 39.582nd Quarter.............. 46.67 35.83 3rd Quarter............... 48.50 33.33 * 4th Quarter............... 48.00 34.00
Year Ended December 31, 2009
1st Quarter............... P 41.00 31.002nd Quarter.............. 46.50 34.00 3rd Quarter............... 46.00 41.50 4th Quarter............... 48.50 45.00
Year Ended December 31, 2010
1st Quarter............... P 49.50 40.002nd Quarter.............. 46.50 42.00 3rd Quarter............... 57.40 45.50 4th Quarter............... 61.00 54.15
* A 20% stock dividend took effect on 30 July 2008, hence BPI share price prior to
this date had been adjusted accordingly. The high and low prices of BPI at the Philippine Stock Exchange on 24 February 2011 were P53.60 and P53.00, respectively. Dividends Cash dividends declared and paid during the years ending December 31, 2008, 2009 & 2010 are as follows: BPI Amount Declared Amount Paid Year Ending December 31, 2008 5,842 Million 8,060 Million Year Ending December 31, 2009 5,844 Million 5,843 Million Year Ending December 31, 2010 6,123 Million 9,045 Million The difference between the amount declared and paid per year is due to the time lag in obtaining BSP approval to pay out the dividends. There are no known restrictions or impediments to the company’s ability to pay dividends on common equity, whether current or future. There were no unregistered securities sold during the year. Management Discussion and Analysis of Financial Condition and Results of Operations (Last Three Years: 2008, 2009 and 2010) The highlights of the balance sheet and income statement of BPI for each year and the compounded growth rate over the three year period (2008 - 2010) are shown below: In Million Pesos 2007 2008 2009 2010 CAGR Assets 637,285 666,612 724,420 878,146 11.28% Deposits 513,444 540,352 579,471 719,766 11.92% Loans (Net) 273,756 320,216 327,474 378,728 11.43% Capital 71,131 63,872 67,765 82,275 4.97%

3
The bank’s asset level for the period 2008 to 2010 showed a compounded annual growth rate (CAGR) of 11.3% on higher level of deposits of 11.9%. The increase in funds were extended as loans which expanded by a corresponding 11.4%. Capital likewise went up by 5.0% from annual earnings and a recent stock rights issue, net of regular cash dividends paid. 2008 Total resources at P666.6 billion ended higher by P29.3 billion or 4.6% driven by the P26.9 billion or 5.2% expansion in deposits to P540.4 billion. Deposit expansion came from increases in peso and foreign currency denominated Savings Deposits totaling P32.5 billion or 25.0% and Demand Deposits amounting to P5.6 billion or 6.4%. Time Deposits on the other hand contracted by P11.2 billion or 3.8% coming from peso time deposits in view of the bank’s strategy of offering higher yielding trust products to its price sensitive depositors. The bank issued P5.0 billion in Tier 2 eligible capital in December 2008 as reflected in Unsecured Subordinated Debt. Bills Payable likewise grew by P4.6 billion or 84.8% for gapping purposes and to fund new leases of the bank’s leasing subsidiaries. Liabilities Attributable to Insurance Operations went up by P2.3 billion or 14.1% on higher actuarial reserves set up for the year. Due to Bangko Sentral ng Pilipinas (BSP) and Other Banks ended higher by P193 million due to higher deposits maintained by foreign banks. Deferred Credits and Other Liabilities declined by P1.1 billion or 5.7% due to a drop in bills purchased – contra account. Derivative Financial Liability dropped by P813 million due to the decline in foreign exchange forward bought volume while Accrued Taxes, Interest and Other Expenses also went down by P520 million on lower accruals of expenses, taxes and interest on time deposits. Capital Funds ended at P63.9 billion, P7.3 billion or 10.2% lower than last year. The decrease came from the P7.1 billion or 18.9% drop in Surplus brought about by the P5.4 billion stock dividend and the P8.1 billion cash dividends paid which totally wiped out this year’s profits of P6.4 billion. Correspondingly, Capital Stock grew by P5.4 billion or 20.0%. Reserves also declined by P5.3 billion or 1.2x due to this year’s unrealized losses on mark-to-market valuation of available-for-sale securities. This year’s unrealized losses however included P1.6 billion related to available for sale securities transferred to held to maturity category based on a change in intention. This amount will be accreted over the life of these securities. The debit balance of Translation Adjustment pertaining to overseas subsidiaries further increased by P112 million or 19.3% due to the stronger peso against the dollar. Minority Interest in Subsidiaries dropped by P182 million or 16.3% with the declaration of cash dividends and downward valuation of investments of the insurance subsidiaries. On the asset side, Loans and Advances (Net) grew by P46.5 billion or 17.0% on strong demand from the corporate and individual borrowers. Trading Securities increased by P25.2 billion or 2.7x as the bank opted to invest its foreign currency funds into U.S. Treasury. The reclassification of Available for Sale Securities to Held-to-Maturity Securities resulted in the latter’s increase of P20.4 billion or 39.0%. Cash and Other Cash Items also went up by P9.1 billion or 68.9% on higher cash requirement especially towards the end of 2008. Due from Other banks ended higher by P7.3 billion largely from higher remittances. Above assets were funded not only by the increase in deposits but also by the proceeds from the sale of Available-for-Sale Securities, lower account balances under Due from BSP and maturities of Interbank Loans Receivable and Securities Purchased under Agreements to Resell, which declined by P39.8 billion, P24.5 billion and P9.2 billion, respectively. Assets Held for Sale was down by P2.0 billion or 11.9% due to the sale of foreclosed properties. Other Resources’ drop of P2.6 billion or 23.9% was due to the decline in miscellaneous assets and receivables. Derivative Financial Asset was lower by P941 million or 30.1% due to the drop in foreign exchange forward sold volume. Deferred Tax Assets fell by P475 million or 7.7% due to the utilization and partial write-off of expiring net operating loss carry over (NOLCO). Equity Investment’s decrease of P167 million was due to the receipt of dividends from unconsolidated subsidiaries. 2009 Total resources grew to P724.4 billion, P57.8 billion or 8.7% higher than last year as deposits and bills payable expanded by P39.1 billion or 7.2% and P22.1 billion, respectively. Deposit

4
growth was due to the P40.2 billion or 24.8% increase in Savings Deposits and the P15.5 billion or 16.8% rise in Demand Deposits. The bank focused on increasing these types of deposits by introducing new deposit products bundled with an insurance feature. Time Deposits however went down by a total of P16.7 billion or 5.8%. The bank also availed of the rediscounting facility with BSP thus increasing its Bills Payable level by P22.1 billion. Deferred Credits and Other Liabilities rose by P2.6 billion or 15.0% due to the increase in bills purchased – contra account. Due to BSP and Other Banks went up by P437 million due to higher tax collections for the Bureau of Internal Revenue. Manager’s Checks and Demand Draft Outstanding also increased by P336 million or 12.3% on higher unnegotiated manager’s checks issued this year. Accrued Taxes, Interest and Other Expenses were also up by P298 million due to higher year-end accruals of expenses. Liabilities Attributable to Insurance Operations however dropped by P10.1 billion or 53.4% following the sale of the bank’s 51% shareholdings in Ayala Life Assurance, Inc. to The Philam Life Assurance Corp. Said sale gave rise to BPI-Philam Life Assurance Corp, a joint venture that will serve as a platform for BPI and Philamlife’s strategic bancassurance partnership. Derivative Financial Liability was lower by P955 million or 37.5% due to this year’s mark-to-market gains on foreign exchange swaps and maturities of interest rate and cross-currency swaps. Capital Funds at P67.8 billion was P3.9 billion or 6.1% up against previous year of P63.9 billion. The growth came from the improvement in Surplus by P2.5 billion or 8.2% due to this year’s profits net of cash dividend paid. Accumulated other comprehensive loss’ debit balance was lower by P1.2 billion or 42.6% due to this year’s unrealized gains on mark-to-market valuation of available-for-sale securities and gains from the translation of the bank’s overseas subsidiaries on the strength of third currencies, particularly the British Pounds. Reserves rose by P98 million due to the additional reserves set-up for the trust business this year. Additional funds generated from the growth in deposits and borrowed funds from BSP were placed in Due from BSP which rose by P14.3 billion to comply with the corresponding reserve requirement for these accounts. Other investment outlets were Interbank Loans Receivable and Securities Purchased under Agreements to Resell and Trading Securities, which grew by P30.0 billion or 1.3x and P18.9 billion or 54.8%, respectively. Available for Sale Securities and net Loans and Advances likewise increased by P7.9 billion or 12.3% and P7.3B as funds in in the bank’s nostro accounts in Due from Other Banks (down by P7.1 billion) and Cash and Other Cash Items (down P3.6 billion or 16.0%) were shifted to these higher yielding assets. Equity Investments went up by P909 million or 124% on the shift to equity accounting of the bank’s minority stake in BPI-Philam Life Assurance Corp. (BPI Philam) and BPI Globe BanKO (formerly Pilipinas Savings Bank, Inc). Correspondingly, Assets Attributable to Insurance Operations declined by P11.1 billion or 50.4% Deferred Income Tax Assets also decreased by P804 million or 14.2% due to the write-off of taxes relative to the unutilized expiring net operating loss carry over (NOLCO) this year. Other resources dropped by P421 million or 5.2% on decrease of miscellaneous assets. 2010 This year’s Total Resources reached P878.1 billion, P153.7 billion or 21.2% more than last year’s P724.4 billion. Total Deposits grew by P140.3 billion or 24.2% coming from all types of deposits. Demand, Savings Deposits, and Time Deposits expanded by P12.5 billion, P43.1 billion and P84.8 billion, respectively. Derivative Financial Liability was up by P3.7 billion or 2.3x on increased volume and market valuation of derivative products. Manager’s Checks and Demand Draft Outstanding rose by P1.1 billion or 36.9% due to the higher balance of unnegotiated manager’s checks issued this year. Accrued Taxes, Interest and Other Expenses also went up by P671 million on accruals of interests on time deposits and interest rate swaps relative to volume growth, and of taxes and licenses as well as income taxes in view of the positive tax position of the bank. Liabilities Attributable to Insurance Operations likewise grew by P451 million or 5.1% on increased reserves corresponding to new policies issued at BPI MS Insurance Corp (BPI MS). On the other hand, Bills Payable contracted P7.1 billion due to maturities of borrowings under the BSP rediscounting facility. Capital Funds this year amounted to P82.3 billion, P14.5 billion or 21.4% higher than last year’s P67.8 billion. The bulk of the increase came from Paid-in Surplus and Capital Stock, which expanded by P6.9 billion and P3.1 billion, respectively on account of stock rights issue of P10 billion at P32.50 per share in August 2010. Surplus was up by P2.2 billion or 6.5% on the back
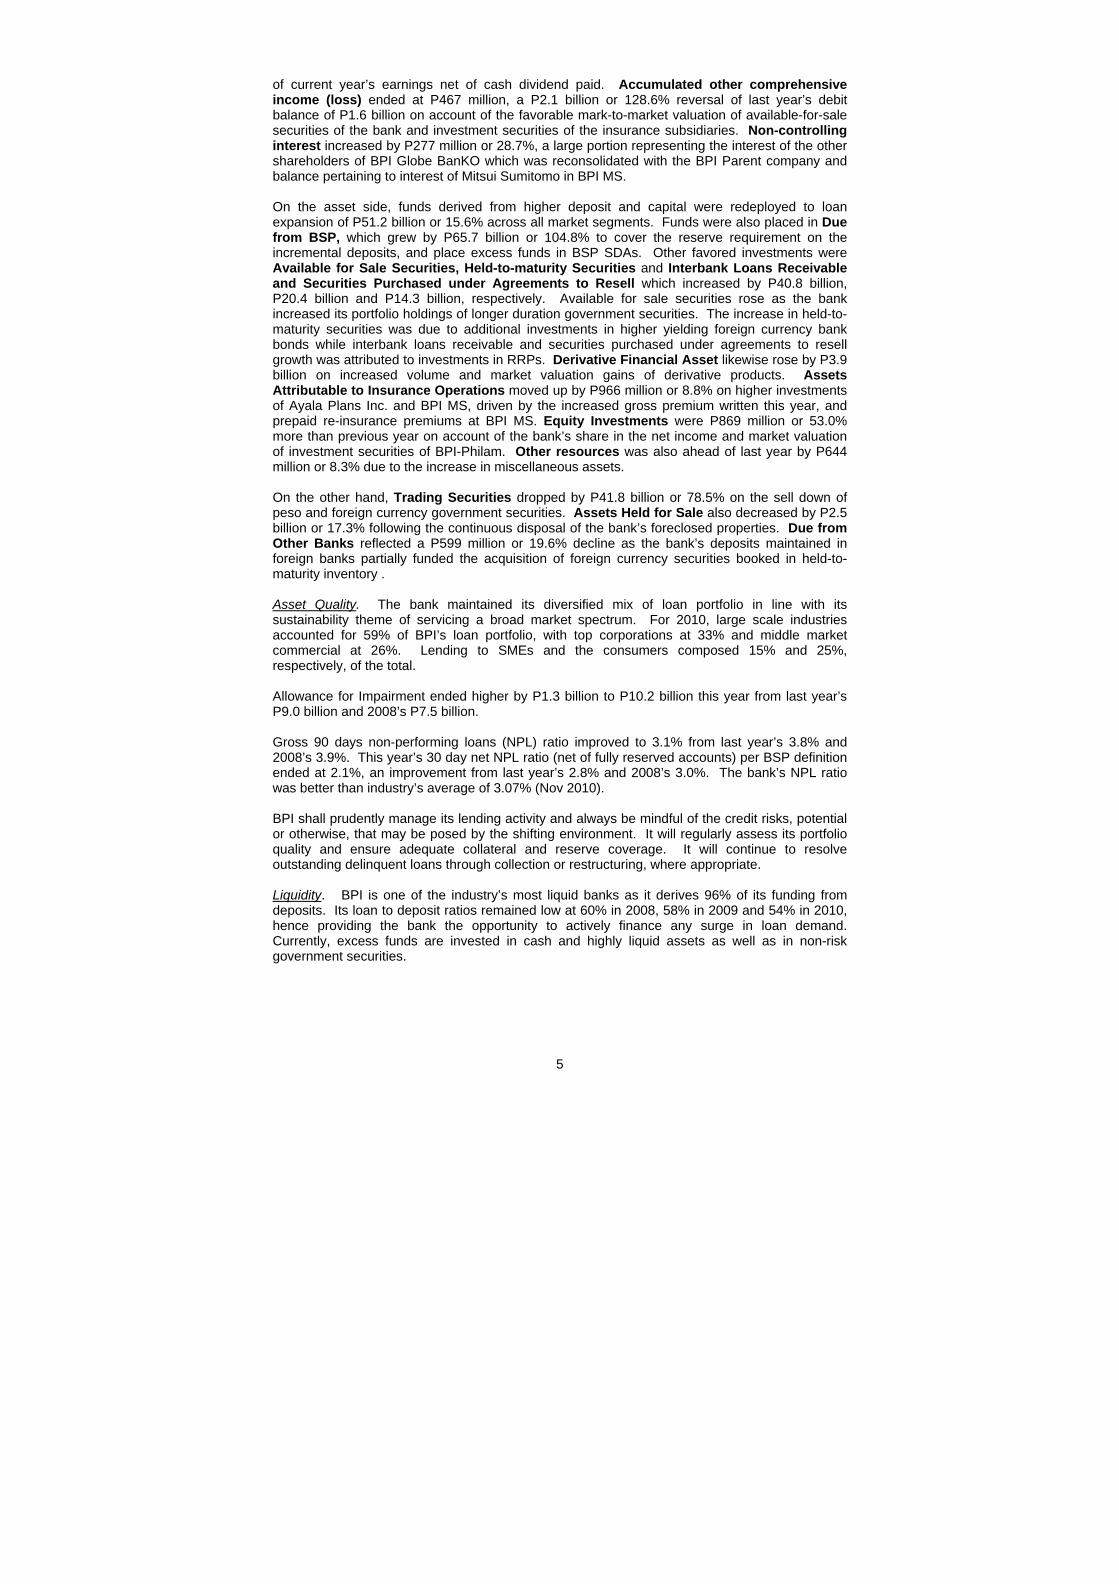
5
of current year’s earnings net of cash dividend paid. Accumulated other comprehensive income (loss) ended at P467 million, a P2.1 billion or 128.6% reversal of last year’s debit balance of P1.6 billion on account of the favorable mark-to-market valuation of available-for-sale securities of the bank and investment securities of the insurance subsidiaries. Non-controlling interest increased by P277 million or 28.7%, a large portion representing the interest of the other shareholders of BPI Globe BanKO which was reconsolidated with the BPI Parent company and balance pertaining to interest of Mitsui Sumitomo in BPI MS. On the asset side, funds derived from higher deposit and capital were redeployed to loan expansion of P51.2 billion or 15.6% across all market segments. Funds were also placed in Due from BSP, which grew by P65.7 billion or 104.8% to cover the reserve requirement on the incremental deposits, and place excess funds in BSP SDAs. Other favored investments were Available for Sale Securities, Held-to-maturity Securities and Interbank Loans Receivable and Securities Purchased under Agreements to Resell which increased by P40.8 billion, P20.4 billion and P14.3 billion, respectively. Available for sale securities rose as the bank increased its portfolio holdings of longer duration government securities. The increase in held-to-maturity securities was due to additional investments in higher yielding foreign currency bank bonds while interbank loans receivable and securities purchased under agreements to resell growth was attributed to investments in RRPs. Derivative Financial Asset likewise rose by P3.9 billion on increased volume and market valuation gains of derivative products. Assets Attributable to Insurance Operations moved up by P966 million or 8.8% on higher investments of Ayala Plans Inc. and BPI MS, driven by the increased gross premium written this year, and prepaid re-insurance premiums at BPI MS. Equity Investments were P869 million or 53.0% more than previous year on account of the bank’s share in the net income and market valuation of investment securities of BPI-Philam. Other resources was also ahead of last year by P644 million or 8.3% due to the increase in miscellaneous assets. On the other hand, Trading Securities dropped by P41.8 billion or 78.5% on the sell down of peso and foreign currency government securities. Assets Held for Sale also decreased by P2.5 billion or 17.3% following the continuous disposal of the bank’s foreclosed properties. Due from Other Banks reflected a P599 million or 19.6% decline as the bank’s deposits maintained in foreign banks partially funded the acquisition of foreign currency securities booked in held-to-maturity inventory . Asset Quality. The bank maintained its diversified mix of loan portfolio in line with its sustainability theme of servicing a broad market spectrum. For 2010, large scale industries accounted for 59% of BPI’s loan portfolio, with top corporations at 33% and middle market commercial at 26%. Lending to SMEs and the consumers composed 15% and 25%, respectively, of the total. Allowance for Impairment ended higher by P1.3 billion to P10.2 billion this year from last year’s P9.0 billion and 2008’s P7.5 billion. Gross 90 days non-performing loans (NPL) ratio improved to 3.1% from last year’s 3.8% and 2008’s 3.9%. This year’s 30 day net NPL ratio (net of fully reserved accounts) per BSP definition ended at 2.1%, an improvement from last year’s 2.8% and 2008’s 3.0%. The bank’s NPL ratio was better than industry’s average of 3.07% (Nov 2010). BPI shall prudently manage its lending activity and always be mindful of the credit risks, potential or otherwise, that may be posed by the shifting environment. It will regularly assess its portfolio quality and ensure adequate collateral and reserve coverage. It will continue to resolve outstanding delinquent loans through collection or restructuring, where appropriate. Liquidity. BPI is one of the industry’s most liquid banks as it derives 96% of its funding from deposits. Its loan to deposit ratios remained low at 60% in 2008, 58% in 2009 and 54% in 2010, hence providing the bank the opportunity to actively finance any surge in loan demand. Currently, excess funds are invested in cash and highly liquid assets as well as in non-risk government securities.

6
Results of Operations In Million Pesos 2007 2008 2009 2010 CAGR Net Interest Income 18,950 19,463 21,402 23,628 7.63%Non-Interest Income 13,604 10,321 12,993 15,369 4.15%Impairment Losses 1,250 1,930 2,535 3,454 40.32%Operating Expenses 18,311 18,312 19,676 20,954 4.60%Net Income 10,012 6,423 8,516 11,312 4.15%
The bank’s net income from 2008 to 2010 improved by 4.2% as net interest income and non-interest income grew by 7.6% and 4.2%, respectively. Operating expenses and impairment losses tempered the increment in revenues as they rose by 4.6% and by 40.3%, respectively. 2008 vs. 2007. Net Income for 2008 was P6.4 billion, P3.6 billion or 35.8% lower than the previous year. Revenues were down by P2.8 billion, and at the same time impairment losses and income taxes increased by P680 million and P218 million, respectively. Operating expenses were flat against last year. Net Interest Income at P19.5 billion was P513 million or 2.7% higher than the previous year despite the 7 basis points drop in spreads. This was primarily accounted for by the higher average asset base of P30.5 billion.
• Interest Income was higher by P882 million against previous year. This was brought about by the increase in interest income on loans and advances by P2.4 billion or 11.3% on higher volume. This increase in interest income was reduced by the P1.2 billion or 24.0% drop in interest on available-for-sale securities on lower portfolio and lower yields. Interest on held-to-maturity and on trading securities also went down by P286 million or 6.6% on lower volume and P143 million or 27.8% on lower yields, respectively. The improvement in interest income this year resulted to an increase in Gross Receipts Tax (GRT) by P76 million or 6.1%.
• Interest Expense rose by P369 million from last year as both interest expense on
Deposits and interest expense on Bills Payable and Other Borrowings increased by P350 million and P19 million, respectively.
Other Operating Income at P10.3 billion was P3.3 billion or 24.1% lower than 2007’s P13.6 billion. This came from the P3.0 billion or 120.6% drop in Trading Gain (Loss) on Securities as the bank pursued a cut-loss strategy and sold down part of its available for sale securities due to rising interest rates. Income Attributable to Insurance Operations was also down by P1.3 billion or 68.3% on non-recurring investment income of the previous year. The impact of these drops was partly cushioned by the increases in Income from Foreign Exchange trading by P712 million or 71.2% mainly on higher revaluation and Fees and Commissions of P309 million or 11.2% largely on higher volume of remittances and ATM transactions. As a consequence of the overall decline in other income, GRT dropped by P281 million or 31.3%. Other Expenses was flat at P18.3 billion. Occupancy and Equipment-Related Expenses increased by P450 million or 9.3% on higher depreciation on bank owned and leased out equipments, rent, contractual and software expenses. This was however offset by the savings in Other Operating Expenses and Compensation and Fringe Benefits of P354 million and P95 million, respectively. Lower other operating expenses were due to non-recurring prior period tax settlements paid the previous year. Provision for Income Tax ended higher by P218 million or 7.9% to P3.0 billion against 2007’s P2.8 billion despite the lower pre-tax income of the bank. This was due to increase in Deferred Taxes by P503 million or 1.4x due to the utilization and partial write-off of net operating loss carry over (NOLCO). The bank reverted to a positive tax position but was not able to fully utilize its expiring NOLCO. Current taxes were down by P285 million or 11.8% as corporate income taxes of the subsidiaries and final taxes declined. Net Income Attributable to Non-controlling Interest declined by P80 million or 37.4% due to lower profits of the insurance subsidiaries.

7
2009 vs. 2008. Net Income for 2009 reached P8.5 billion, P2.1 billion or 32.6% higher than the previous year’s P6.4 billion. Net income growth came from the P4.6 billion rise in revenues but tempered by increases in operating expenses, impairment losses and income taxes of P1.4 billion, P605 million, and P534 million, respectively.
Net Interest Income improved to P21.4 billion, a P1.9 billion or 10.0% increase over last year’s P19.5 billion. The increase in net interest income was brought about by the P52.4 billion average asset expansion and a slight improvement in net interest spread of 4 basis points.
• Interest Income ended higher than the previous year by P591 million reaching P33.9
billion. The increase was driven by improvements in interest income on held-to-maturity securities by P1.2 billion and on deposits with banks by P590 million due to higher volume. On the other hand, interest income on available-for-sale securities went down by P1.5 billion as yields dropped. Along with the increase in interest income, GRT also increased by P15 million.
• Interest Expense decreased significantly by P1.3 billion against last year on lower
interest expense on Deposits of P2.1 billion largely caused by the drop in the level of time deposits. This was partly offset by the increase in interest expense on Bills Payable and Other Borrowings of P774 million.
Other Income of P13.0 billion was higher by P2.7 billion or 25.9% compared to 2008’s P10.3 billion. Trading gain (loss) on securities posted a P2.0 billion or 4x increase on the back of the P1.5 billion securities trading gain this year against losses the previous year. Service charges and commissions rose by P374 million on higher transaction volume. Other Operating Income exhibited a P319 million or 5.2% growth fueled by higher income from asset sales, rentals and credit card business. Income Attributable to Insurance Operations also contributed a P210 million or 18.3% increase due to higher profits of the insurance business driven by higher premiums and higher investment income. Consequently, GRT rose by P255 million or 41.4%. Other Expenses at P19.7 billion was P1.4 billion or 7.4% higher than previous year’s P18.3 billion. Compensation and Fringe Benefits went up by P1.0 billion or 13.1% due to higher retirement fund contribution, early retirement program (ERP) expenses and annual salary increases. Occupancy and Equipment-Related Expenses rose by P341 million or 6.4% on higher depreciation of premises and equipment including leased out equipments and computer and software maintenance. Impairment losses for the year amounted to P2.5 billion, P605 million or 31.4 % higher than last year. Additional provisions were set-up for some corporate accounts and typhoon related credit losses. Provision for Income Tax was up by P534 million or 17.9% to P3.5 billion against last year’s P3.0 billion. Current taxes increased by P474 million or 22.3% due to higher income subject to final tax of the Parent bank and higher corporate taxable income of some bank subsidiaries. Deferred Taxes also rose by P60 million or 6.9% due to the equivalent tax on a higher level of NOLCO written-off this year. Income attributable to Non-Controlling Interest improved by P15 million or 11.1% on the insurance subsidiaries’ better performance. Comprehensive Income Total Comprehensive Income for the year 2009 reached P9.7 billion, P8.8 billion or over 9x better than last year’s P943 million. Other Comprehensive Income improved by a hefty P7.0 billion from last year’s loss of P5.6 billion to this year’s income of P1.3 billion.. As to other comprehensive income, Net change in fair value reserve on available for sale securities posted significant increase of P4.6 billion as it registered P390 million in mark to market gains this year as against the P4.2 billion losses in 2008. Fair value reserve on investments of insurance subsidiaries also improved by P2.1 billion as equities and other investments recovered from a valuation loss of P1.2 billion the previous year to a P929 million gain this year. Similarly, Currency translation differences grew by P190 million from losses of P112 million last year to gains of P79 million this year due to the appreciation of third currencies affecting the balances of the bank’s overseas subsidiaries. The negative balance of fair value

8
reserve on investment of insurance associates of P134 million represents mark to market valuation losses this year on equities and other investments of BPI-Philam. Correspondingly, Total Comprehensive Income of Non-Controlling Interest rose by P161 million or over 4x due to higher profits and upward market valuation of investments of the insurance subsidiaries. 2010 vs. 2009. The bank’s 2010 Net Income amounted to P11.3 billion, a P2.8 billion or 32.8% improvement over last year’s P8.5 billion. The improvement in net income was attributed to the growth in revenues by P4.6 billion and the decline in income taxes by P409 million. These positive variances were partly tempered by the rise in operating expenses and impairment losses by P1.3 billion and P919 million, respectively.
The growth in Revenues came from the increase in net interest income of P2.2 billion and non-interest income of P2.4 billion. Net Interest Income at P23.6 billion was higher by 10.4% from last year’s P21.4 billion. This improvement was driven by the P79.5 billion increment in average asset base partly softened by the 17 basis points drop in net interest margin.
• Interest Income was up by P3.1 billion or 9.1% to P37.0 billion from previous year’s
P33.9 billion. This growth was propelled by increases in the interest income of all interest bearing assets ranging from P221 million to P1.2 billion mostly due to higher level of balances. The P221 million increase in interest income on trading securities however was brought about by higher interest yield. Consequent to the increase in interest income, GRT rose by P50 million.
• Interest Expense was likewise higher by P874 million compared to the previous year
largely on the P839 million rise in interest expense on Deposits corresponding to the volume increase.
Other Income grew to P15.4 billion, 18.3% better than 2009’s P13.0 billion. Trading gain (loss) on securities was the biggest contributor to other income growth with a P2.0 billion or as it reached P3.5 billion, with a P2.0 billion or 131.6% increment to P3.5 billion from last year’s P1.5 billion. The bank sold down part of its trading portfolio following a declining interest rate environment. Income from foreign exchange trading rose by P511 million or 30% on higher realized gains on forwards and swaps. Fees and commissions also improved by P731 million on higher service charges and bancassurance fees. Other operating income reflected a drop of P593 million or 9.2% on substantial non-recurring gain on bank asset sales last year. The overall increase in other income resulted in a higher GRT of P286 million or 32.8%. Other Expenses at P21.0 billion was up by P1.3 billion or 6.5% against last year’s P19.7 billion. Other operating expenses increased by P858 million or 17.6% on higher regulatory costs, and variable product and service costs. Occupancy and equipment-related expenses also went up by P438 million or 7.8% on higher premises related costs and hardware and software maintenance costs. This year’s impairment losses reached P3.4 billion, P919 million or 36.2 % more than the previous year, inclusive of reserves for the eventual write-off of the P274 million in goodwill relative to the Prudential Bank acquisition. Provision for Income Tax was down by P409 million or 11.6% to P3.1 billion against last year’s P3.5 billion. The decline in the tax line was primarily due to the lower deferred taxes of P1.3 billion or 137.5% this year as last year carried the tax effect of the NOLCO write-off. Current taxes were higher by 859 million or 33.1% due to higher tax paid income and taxable income of the Parent bank and some subsidiaries. Income attributable to Non-Controlling Interest was higher by P18 million or 12.2% on the insurance subsidiaries’ improved operating performance. Comprehensive Income This year’s Total Comprehensive Income ended at P13.4 billion, P3.7 billion or 37.8% higher than previous year’s P9.7 billion. This improvement came from higher net income before minority
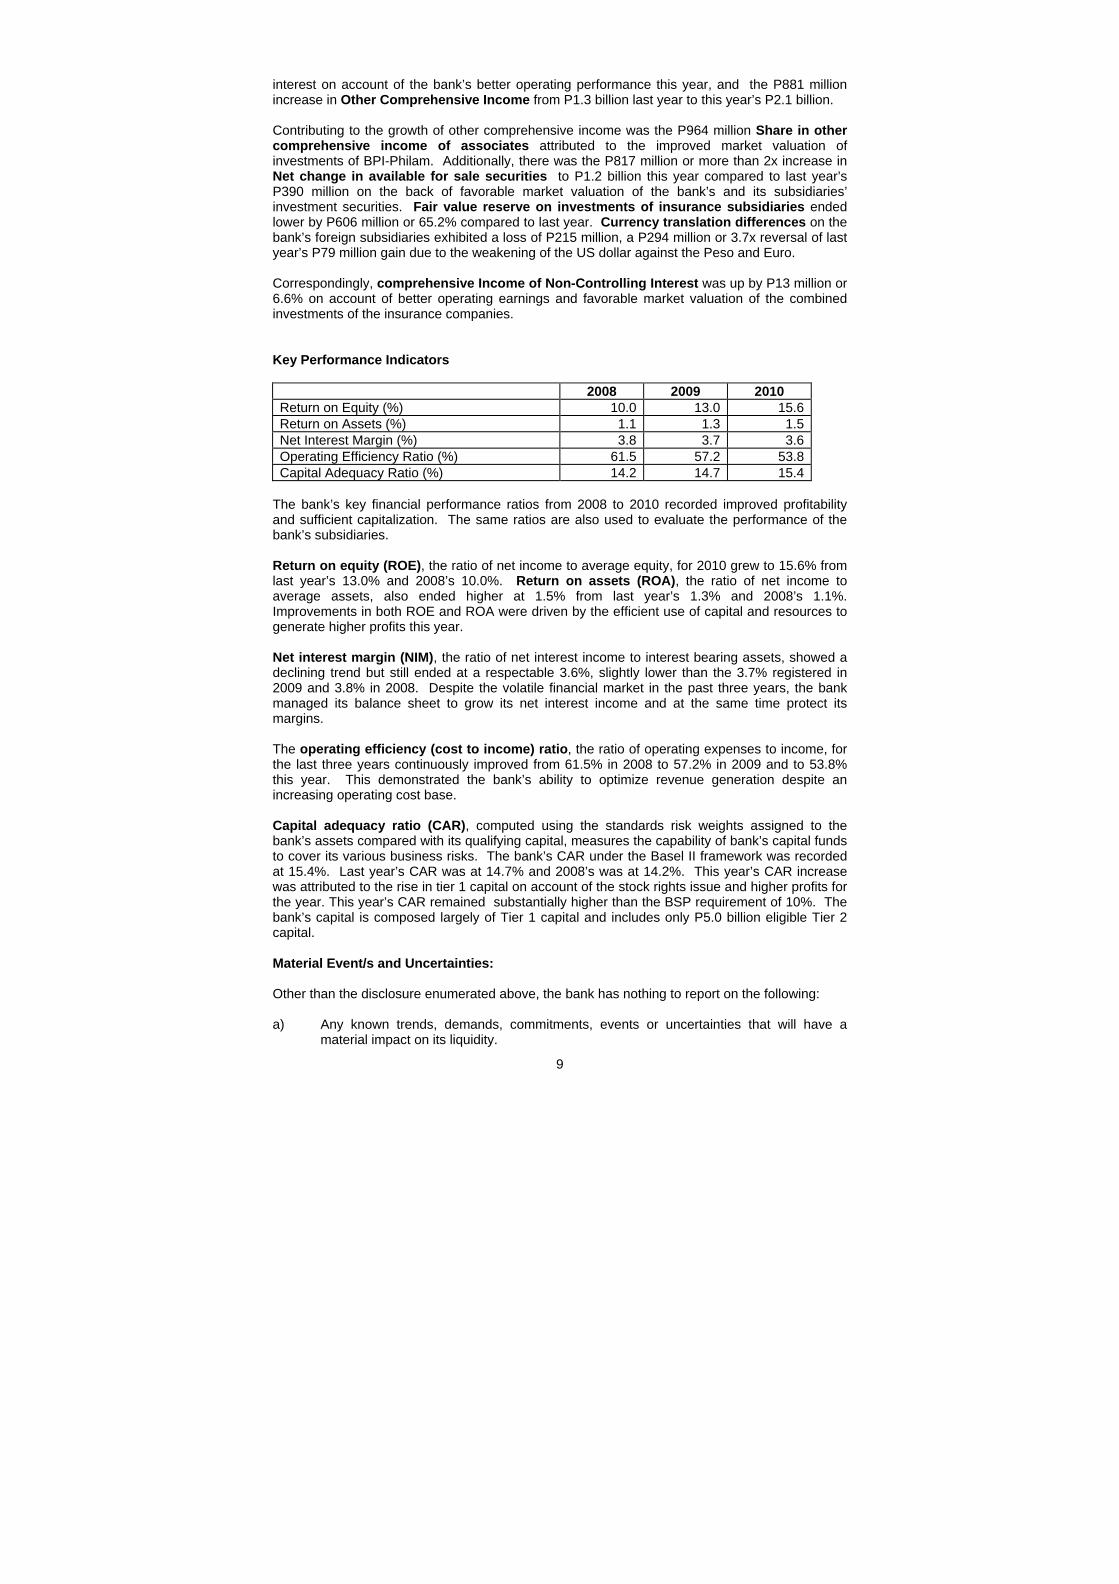
9
interest on account of the bank’s better operating performance this year, and the P881 million increase in Other Comprehensive Income from P1.3 billion last year to this year’s P2.1 billion. Contributing to the growth of other comprehensive income was the P964 million Share in other comprehensive income of associates attributed to the improved market valuation of investments of BPI-Philam. Additionally, there was the P817 million or more than 2x increase in Net change in available for sale securities to P1.2 billion this year compared to last year’s P390 million on the back of favorable market valuation of the bank’s and its subsidiaries’ investment securities. Fair value reserve on investments of insurance subsidiaries ended lower by P606 million or 65.2% compared to last year. Currency translation differences on the bank’s foreign subsidiaries exhibited a loss of P215 million, a P294 million or 3.7x reversal of last year’s P79 million gain due to the weakening of the US dollar against the Peso and Euro. Correspondingly, comprehensive Income of Non-Controlling Interest was up by P13 million or 6.6% on account of better operating earnings and favorable market valuation of the combined investments of the insurance companies. Key Performance Indicators 2008 2009 2010 Return on Equity (%) 10.0 13.0 15.6Return on Assets (%) 1.1 1.3 1.5Net Interest Margin (%) 3.8 3.7 3.6Operating Efficiency Ratio (%) 61.5 57.2 53.8Capital Adequacy Ratio (%) 14.2 14.7 15.4
The bank’s key financial performance ratios from 2008 to 2010 recorded improved profitability and sufficient capitalization. The same ratios are also used to evaluate the performance of the bank’s subsidiaries. Return on equity (ROE), the ratio of net income to average equity, for 2010 grew to 15.6% from last year’s 13.0% and 2008’s 10.0%. Return on assets (ROA), the ratio of net income to average assets, also ended higher at 1.5% from last year’s 1.3% and 2008’s 1.1%. Improvements in both ROE and ROA were driven by the efficient use of capital and resources to generate higher profits this year. Net interest margin (NIM), the ratio of net interest income to interest bearing assets, showed a declining trend but still ended at a respectable 3.6%, slightly lower than the 3.7% registered in 2009 and 3.8% in 2008. Despite the volatile financial market in the past three years, the bank managed its balance sheet to grow its net interest income and at the same time protect its margins. The operating efficiency (cost to income) ratio, the ratio of operating expenses to income, for the last three years continuously improved from 61.5% in 2008 to 57.2% in 2009 and to 53.8% this year. This demonstrated the bank’s ability to optimize revenue generation despite an increasing operating cost base. Capital adequacy ratio (CAR), computed using the standards risk weights assigned to the bank’s assets compared with its qualifying capital, measures the capability of bank’s capital funds to cover its various business risks. The bank’s CAR under the Basel II framework was recorded at 15.4%. Last year’s CAR was at 14.7% and 2008’s was at 14.2%. This year’s CAR increase was attributed to the rise in tier 1 capital on account of the stock rights issue and higher profits for the year. This year’s CAR remained substantially higher than the BSP requirement of 10%. The bank’s capital is composed largely of Tier 1 capital and includes only P5.0 billion eligible Tier 2 capital. Material Event/s and Uncertainties: Other than the disclosure enumerated above, the bank has nothing to report on the following: a) Any known trends, demands, commitments, events or uncertainties that will have a
material impact on its liquidity.

10
b) Events that will trigger direct or contingent financial obligation that is material to the
company, including any default or acceleration of an obligation. c) Material off-balance sheet transactions, arrangements, obligations (including contingent
obligations), and other relationships of the bank with unconsolidated entities or other persons created during the reporting period.
d) Any material commitments for capital expenditures. e) Any known trends, events or uncertainties that have had or that are reasonably expected
to have a material favorable or unfavorable impact on net sales/revenues/income from continuing operations.
f) Any significant elements of income or loss that did not arise from the bank’s continuing
operations. g) Any seasonal aspects that had a material effect on the financial condition or results of
operations. Future Prospects Near Term Prospects. 2011 is seen to be a challenging year for the Philippine economy. Global uncertainties, unpredictable investor preference, market reaction to regulatory policy changes and the global commodity and oil price hike are possible snags to economic development. However, the Philippine economy is still expected to grow, backed by sustained dollar inflows from OF remittances, increased local and foreign investments, and the continuing mild global economic recovery which will spur tourism and BPO industries. The Philippine government forecasted Gross Domestic Product (GDP) to grow between 7 to 8%, while full year inflation is seen to stay within 3.0 to 5.0%. BPI’s tagline of “Let’s Make it Easy” embodies the bank’s aim to make BPI more accessible, more convenient and more cost effective to more Filipinos. In 2011, the bank expects to further grow its customer base. Bank lending will remain robust given the continued expansion of the domestic economy and the relatively low interest rate environment. BPI sees its loan portfolio growth at 12% on the strength of consumer loan demand and the growing middle market and SME segment. Medium to Long Term Prospects. Higher infrastructure investments, especially via the Public-Private Partnership (PPP) scheme, are positive drivers to sustain economic growth in the medium to long term. The current administration’s line up of infrastructure projects such as power generation, building of more roads, bridges and irrigation projects, improvements of sea ports and airports and water projects are likely to bring regional and agricultural growth. Against this backdrop, the country’s average GDP is projected to grow by 5 - 6% and inflation is seen to average between 3 - 5%. Anchored on its 160 years of banking experience and its sustainability themes of Total Customer Experience, Servicing a Wider Market, Reducing Environmental Footprint and Engaging the Employees, BPI will continue to identify and seize the right opportunities. It will however proceed with caution bearing in mind the various challenges that the banking industry went though in the past. As always, the bank will ensure that it will remain a viable ongoing concern to continually provide financial advice and financial access to its ever increasing customer base. Aside from preserving its solid financial strength, it will continuously deliver of excellent and convenient service, introduce unique and innovative products to respond to the needs of its varied clientele, and always maintain value enhancing strategic partnerships. Approximate Number of Holders as of January 31, 2011 There were approximately 13,221 common shareholders of BPI as of January 31, 2011

11
Top 20 Stockholders as of January 31, 2011
Name of Stockholders Number of Shares Held
Percent of Holdings
1 PCD Nominee Corporation (Non-Filipino)
(Non-Filipino) 1,246,067,314 35.0378% (Filipino) 202,757,100 5.7013% 2 Ayala Corporation 775,700,589 21.8117% 3 Ayala DBS Holdings, Inc. 757,831,372 21.3092% 4 Roman Catholic Archbishop of Manila 301,063,606 8.4665% 5 Michigan Holdings, Inc. 73,450,441 2.0653% 6 TA # 10319838 - BPI Group of Companies 33,376,327 0.9385% 7 Vicente M. Warns 23,126,251 0.6503% 8 BPI Group of Companies Retirement Fund 4,657,040 0.1309% 9 Mercury Group of Companies 3,242,767 0.0912%
10 Xavier P. Loinaz 3,123,4655 0.0878% 11 Sahara Management & Dev. Corp. 2,535,146 0.0713% 12 Southwood Mindanao Corporation 2,013,860 0.0594% 13 TTC Development Corporation 2,001,041 0.0563% 14 Foresight Realty & Development Corp. 1,958,595 0.0551% 15 Hyland Realty & Dev't. Corporation 1,935,413 0.0544% 16 Ma. Immaculada Z. Ortoll 1,431,043 0.0402% 17 Ma. Rosario Ortoll Zaragoza 1,430,310 0.0402% 18 Aurelio R. Montinola III 1,416,148 0.0398% 19. Ma. Ysabel P. Sylianteng 1,342,674 0.0378% 20 Telengtan Brothers & Sons, Inc. 1,323,215 0.0372% Total 3,441,883,717 96.7812%
Discussion of compliance with leading practices on Corporate Governance (a) Assessment by the Board of Directors to measure or determine the level of
compliance/observance not only with its Manual of Corporate Governance but also other external regulations and rules prescribing good corporate governance practices is regularly done.
(b) Regular meetings and active role taken by Risk Management Committee, Audit
Committee in ensuring adequacy of internal control mechanisms, monitoring of events and development in local and global financial markets and establishing appropriate policy are in place. directives. Other duly constituted board committees, like the Corporate Governance Committee, Personnel and Compensation Committee, Trust Committee , etc. among others, ensure that the functions, duties and responsibilities prescribed in their respective charters are observed.
(c) Company’s vision, mission, strategic objectives, key policies and procedures for the
management of the company are clearly established and communicated down the line. (d) Continuously enhancing adherence to the principles of transparency, accountability and
fairness. Consistent timely disclosure of material information not only to the Philippine Stock Exchange but also to the Securities and Exchange Commission, the Bangko Sentral ng Pilipinas and in the Company’s own website. Participating actively and diligently in answering the Scorecard for publicly listed companies and banks initiated by BSP, SEC, PSE.
Upon the written request of the stockholders, the Corporation undertakes to furnish said stockholder with a copy of SEC Form 17-A free of charge. Any written request for a copy of SEC Form 17-A should be directed to the Office of the Corporate Secretary, Bank of the Philippine Islands, c/o Ms. Milagros B. Alianza 19th Floor BPI Building, Ayala Avenue corner Paseo de Roxas, Makati City.