annex a - who
TRANSCRIPT

22 WORLD HEALTH STATISTICS: 2018
ANNEX A Summaries of selected health-related SDG indicators
Explanatory notes
The statistics shown below represent official WHO statistics for selected health-related SDG indicators based on evidence available in early 2018. They have been compiled primarily from publications and databases produced and maintained by WHO or United Nations groups of which WHO is a member. A number of statistics have been derived from data produced and maintained by other international organizations. For each indicator, the source of the data series is provided. Member States may have more data than are available for global monitoring.
For the first time in the World Health Statistics series, the type of data used for each data series (comparable estimates, primary data or other data) is also provided. Please refer to Part 1 of this report for more information on these different data categories.
It is important to note that comparable estimates are subject to considerable uncertainty, especially for countries where the availability and quality of the underlying primary data is limited. Uncertainty intervals and other details on the indicators and statistics presented here can be found online at the WHO Global Health Observatory.1
While every effort has been made to maximize the comparability of statistics across countries and over time, users are advised that data series based on primary data may differ in terms of the definitions, data-collection methods, population coverage and estimation methods used. Please refer to the accompanying footnotes for more details.
In some cases, as SDG indicator definitions are being refined and baseline data are being collected, proxy indicators have been presented in this annex and have been clearly indicated as such through the use of accompanying footnotes.
For indicators with a reference period expressed as a range, country values refer to the latest available year in the range unless otherwise noted. Within each WHO region, countries are sorted in ascending order for mortality, incidence and risk-factor indicators, and in descending order for coverage and capacity indicators. Countries for which data are not available or applicable are sorted alphabetically at the end of the respective regional listing.
Changes in the values shown for indicators reported on in previous editions in the World Health Statistics series should not be assumed to accurately reflect underlying trends. This applies to all data types (comparable estimates, primary data and other data) and all reporting levels (country, regional and global). The data presented here may also differ from, and should not be regarded as, the official national statistics of individual WHO Member States.
1 The Global Health Observatory (GHO) is WHO’s portal providing access to data and analyses for monitoring the global health situation. See: http://www.who.int/gho/en/, accessed 29 March 2018.
Cabo Verde
Mauritius
Botswana
South Africa
Algeria
Sao Tome and Principe
Zambia
Namibia
Rwanda
Gabon
Senegal
Ghana
Comoros
Equatorial Guinea
Uganda
Ethiopia
Madagascar
Togo
Burkina Faso
Swaziland
United Republic of Tanzania
Benin
Congo
Zimbabwe
Angola
Lesotho
Mozambique
Eritrea
Kenya
Guinea-Bissau
Niger
Mali
Cameroon
Mauritania
Malawi
Côte d'Ivoire
Guinea
Democratic Republic of the Congo
Gambia
Burundi
Liberia
South Sudan
Nigeria
Chad
Central African Republic
Sierra Leone
Seychelles
882
856
814
789
725
712
706
693
679
645
634
602
596
587
553
549
510
501
489
487
477
443
442
405
398
389
371
368
353
353
343
342
335
319
315
291
290
265
224
156
140
138
129
53
42
1 360
AFRCanada
United States of America
Uruguay
Chile
Costa Rica
Barbados
Grenada
Belize
Mexico
Cuba
Brazil
Saint Vincent and the Grenadines
Saint Lucia
Argentina
El Salvador
Trinidad and Tobago
Colombia
Ecuador
Peru
Bahamas
Guatemala
Jamaica
Dominican Republic
Panama
Venezuela (Bolivarian Republic of)
Honduras
Paraguay
Nicaragua
Suriname
Bolivia (Plurinational State of)
Guyana
Haiti
Antigua and Barbuda
Dominica
Saint Kitts and Nevis
359
229
206
155
150
132
129
95
94
92
89
88
80
68
64
64
63
54
52
48
45
44
39
38
28
27
27
25
22
15
14
7
AMR
Thailand
Sri Lanka
Maldives
Democratic People's Republic ofKorea
Indonesia
Bhutan
India
Bangladesh
Myanmar
Timor-Leste
Nepal
126
148
174
176
178
215
258
20
30
68
82
SEAR
Finland
Greece
Iceland
Poland
Austria
Belarus
Czechia
Italy
Sweden
Israel
Norway
Spain
Switzerland
Denmark
Germany
Slovakia
Belgium
Cyprus
Montenegro
Netherlands
Croatia
France
Ireland
The former Yugoslav Republic of ..
Estonia
Malta
Slovenia
United Kingdom
Lithuania
Luxembourg
Portugal
Bosnia and Herzegovina
Bulgaria
Kazakhstan
Turkey
Hungary
Serbia
Latvia
Republic of Moldova
Ukraine
Armenia
Azerbaijan
Russian Federation
Albania
Romania
Tajikistan
Georgia
Uzbekistan
Turkmenistan
Kyrgyzstan
Andorra
Monaco
San Marino
76
42
36
36
32
31
29
25
25
25
24
23
18
17
17
16
12
11
11
10
10
10
9
9
9
9
8
8
8
8
7
7
7
7
6
6
6
5
5
5
5
4
4
4
4
4
3
3
3
3
EURKuwait
United Arab Emirates
Libya
Saudi Arabia
Qatar
Bahrain
Lebanon
Oman
Iran (Islamic Republic of)
Egypt
Iraq
Jordan
Tunisia
Syrian Arab Republic
Morocco
Pakistan
Djibouti
Sudan
Yemen
Afghanistan
Somalia 732
396
385
311
229
178
121
68
62
58
50
33
25
17
15
15
13
12
9
6
4
EMR
Japan
Australia
Singapore
New Zealand
Republic of Korea
Brunei Darussalam
China
Fiji
Malaysia
Mongolia
Samoa
Viet Nam
Vanuatu
Kiribati
Micronesia (Federated States of)
Philippines
Solomon Islands
Tonga
Cambodia
Lao People's Democratic Republic
Papua New Guinea
Cook Islands
Marshall Islands
Nauru
Niue
Palau
Tuvalu
215
197
161
124
114
114
100
90
78
54
51
44
40
30
27
23
11
11
10
6
5
WPRThe former Yugoslav Republic of Macedonia
23MONITORING HEALTH FOR THE SDGs
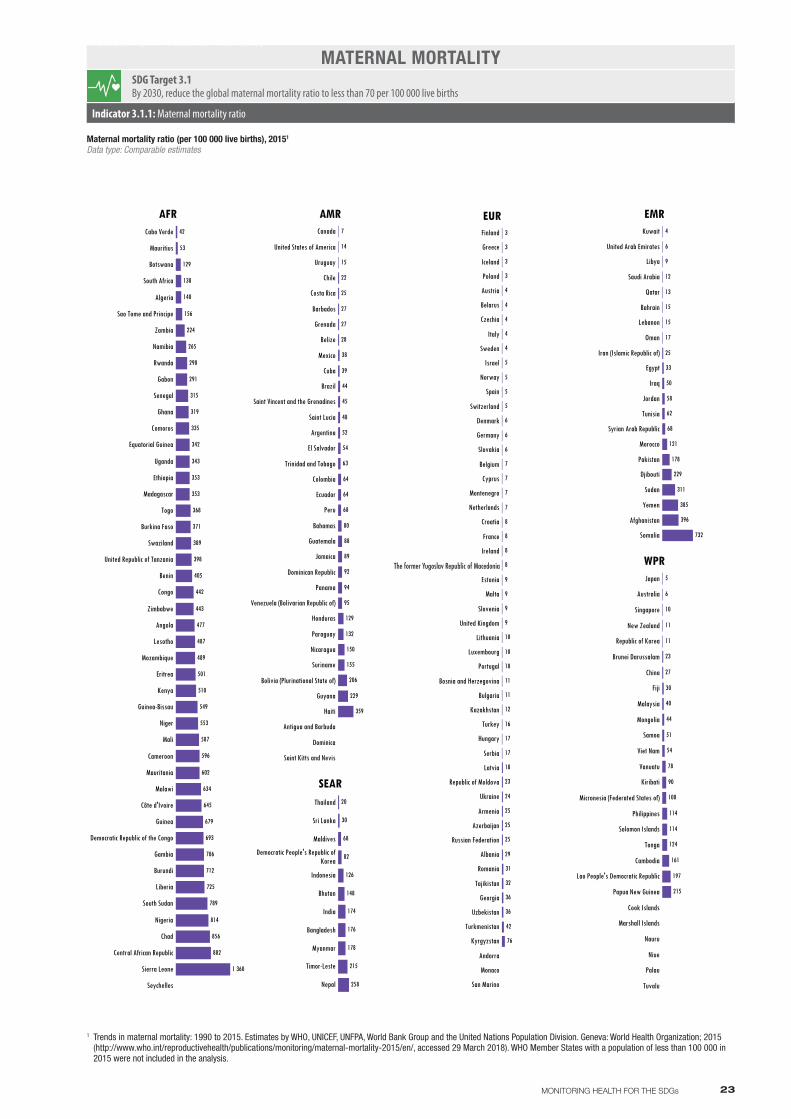
MATERNAL MORTALITYSDG Target 3.1By 2030, reduce the global maternal mortality ratio to less than 70 per 100 000 live births
Indicator 3.1.1: Maternal mortality ratio
Maternal mortality ratio (per 100 000 live births), 20151
Data type: Comparable estimates
Indicator 3.1.1 Maternal mortality
1 Trends in maternal mortality: 1990 to 2015. Estimates by WHO, UNICEF, UNFPA, World Bank Group and the United Nations Population Division. Geneva: World Health Organization; 2015 (http://www.who.int/reproductivehealth/publications/monitoring/maternal-mortality-2015/en/, accessed 29 March 2018). WHO Member States with a population of less than 100 000 in 2015 were not included in the analysis.

Botswana²
Mauritius³
Seychelles³
Algeria
South Africa
Sao Tome and Principe³
Cabo Verde
Congo
Rwanda³
Malawi³
Gabon³
Namibia
Swaziland
Burundi
Comoros
Burkina Faso
Democratic Republic of the Congo
Lesotho
Zimbabwe
Benin
Côte d'Ivoire
Uganda
Guinea³
Ghana
Mauritania
Equatorial Guinea³
Cameroon
United Republic of Tanzania³
Zambia
Kenya
Liberia
Sierra Leone
Senegal
Gambia
Mozambique³
Angola
Guinea-Bissau³
Togo
Madagascar
Mali
Nigeria
Central African Republic
Niger
Eritrea
Ethiopia³
Chad
South Sudan³
68
54
40
34
19
100
100
99
97
97
92
91
91
91
90
89
88
88
85
82
80
80
78
78
77
74
74
72
71
69
65
64
63
62
61
60
59
57
47
45
45
44
44
43
40
28
20
AFRAntigua and Barbuda³
Argentina
Bahamas²
Chile
Cuba²
Dominican Republic²
El Salvador
Saint Kitts and Nevis³
Trinidad and Tobago²
Uruguay
Barbados²
Brazil²
Grenada²
Jamaica³
Saint Lucia
Saint Vincent and the Grenadines³
United States of America
Canada²
Mexico
Belize
Ecuador
Colombia
Dominica²
Paraguay
Venezuela (Bolivarian Republic of)²
Panama
Peru
Bolivia (Plurinational State of)³
Costa Rica
Nicaragua³
Guyana
Honduras
Suriname²
Guatemala
Haiti³
99
100
100
100
100
100
100
100
100
100
100
99
99
99
99
99
99
98
98
97
97
96
96
96
96
95
92
90
90
88
86
83
80
66
42
AMR
Democratic People's Republic ofKorea
Sri Lanka
Thailand³
Maldives
Indonesia
Bhutan³
India³
Myanmar³
Nepal³
Timor-Leste³
Bangladesh³
100
50
57
58
60
86
89
93
96
99
99
SEAR
Armenia³
Azerbaijan³
Belarus³
Bosnia and Herzegovina
Bulgaria
Croatia
Czechia²
Finland²
Georgia
Ireland²
Italy²
Latvia²
Lithuania³
Luxembourg²
Malta²
Poland²
Republic of Moldova³
Russian Federation³
Serbia³
Slovenia²
The former Yugoslav Republic of ..
Turkmenistan
Ukraine³
Uzbekistan³
Albania
Estonia²
Germany²
Hungary³
Kazakhstan
Montenegro
Norway²
Portugal²
Austria²
Iceland²
Kyrgyzstan
Slovakia³
Cyprus²
France²
Turkey³
Romania³
Denmark²
Tajikistan³
Andorra
Belgium
Greece
Israel
Monaco
Netherlands
San Marino
Spain
Sweden
Switzerland
United Kingdom
100
99
100
100
100
100
100
100
100
100
100
100
100
100
100
100
100
100
100
100
100
100
100
100
100
99
99
99
99
99
99
99
98
98
98
98
97
97
97
95
94
90
EURBahrain²
Jordan
Kuwait²
Libya³
Oman³
Qatar
United Arab Emirates³
Iran (Islamic Republic of)³
Saudi Arabia³
Syrian Arab Republic³
Egypt
Djibouti³
Sudan³
Morocco
Tunisia
Iraq²
Pakistan³
Afghanistan³
Yemen³
Lebanon
Somalia
96
74
100
100
100
100
100
100
100
99
98
92
87
78
74
70
55
50
45
EMR
Australia²
Brunei Darussalam³
China³
Cook Islands³
Fiji³
Japan²
Micronesia (Federated States of)³
Niue³
Palau
Republic of Korea²
Singapore²
Malaysia³
Mongolia
Kiribati³
Nauru³
New Zealand²
Tonga
Viet Nam
Tuvalu
Marshall Islands
Cambodia³
Vanuatu³
Solomon Islands³
Samoa³
Philippines
Lao People's Democratic Republic
Papua New Guinea²
100
100
100
98
97
93
90
100
100
100
100
100
100
100
100
99
99
96
96
94
89
89
86
82
73
40
40
WPR
2012 or later Pre-2012
The former Yugoslav Republic of Macedonia3
24 WORLD HEALTH STATISTICS: 2018
SKILLED BIRTH ATTENDANCESDG Target 3.1By 2030, reduce the global maternal mortality ratio to less than 70 per 100 000 live births
Indicator 3.1.2: Proportion of births attended by skilled health personnel
Proportion of births attended by skilled health personnel (%), latest available data, 2007–20171
Data type: Primary data
Indicator 3.1.2 Skilled birth attendance
1 Joint UNICEF/WHO database 2018 of skilled health personnel, based on population-based national household survey data and routine health systems data. New York (NY): United Nations Children’s Fund; 2018 (https://data.unicef.org/wp-content/uploads/2018/02/Interagency-SAB-Database_UNICEF_WHO_Apr-2018.xlsx).
2 Proportion of institutional births (%) used as a proxy for the SDG indicator.3 Non-standard definition of skilled health personnel. For more details see the Joint UNICEF/WHO database 2018 of skilled health personnel.

25MONITORING HEALTH FOR THE SDGs
CHILD MORTALITYSDG Target 3.2By 2030, end preventable deaths of newborns and children under 5 years of age, with all countries aiming to reduce neonatal mortality to at least as low as 12 per 1000 live births and under-five mortality to at least as low as 25 per 1000 live births
Indicator 3.2.1: Under-five mortality rate / Indicator 3.2.2: Neonatal mortality rate
Under-five mortality (purple bar) and neonatal mortality (vertical line) rates (per 1000 live births), 20161
Data type: Comparable estimates
Iceland
Finland
Slovenia
Luxembourg
Cyprus
Norway
Andorra
San Marino
Estonia
Sweden
Czechia
Italy
Spain
Monaco
Austria
Portugal
Ireland
Israel
Germany
Greece
Montenegro
Netherlands
Belarus
Belgium
France
Switzerland
United Kingdom
Denmark
Latvia
Croatia
Poland
Hungary
Lithuania
Serbia
Slovakia
Bosnia and Herzegovina
Malta
Bulgaria
Russian Federation
Romania
Ukraine
Georgia
Kazakhstan
The former Yugoslav Republic of ..
Turkey
Armenia
Albania
Republic of Moldova
Kyrgyzstan
Uzbekistan
Azerbaijan
Tajikistan
Turkmenistan 51.0
13.5
10.7
11.4
12.2
12.7
13.4
15.9
21.1
24.1
30.9
43.1
3.3
3.4
3.5
3.5
3.6
3.6
3.8
3.8
3.8
3.8
3.9
3.9
3.9
4.1
2.7
4.4
4.6
4.7
4.7
5.2
5.3
5.8
5.9
6.0
6.8
7.6
7.7
9.0
2.1
2.3
2.3
2.4
2.6
2.6
4.3
2.8
2.9
2.9
3.2
3.3
9.1
EURBahrain
United Arab Emirates
Lebanon
Kuwait
Qatar
Oman
Libya
Saudi Arabia
Tunisia
Iran (Islamic Republic of)
Syrian Arab Republic
Jordan
Egypt
Morocco
Iraq
Yemen
Djibouti
Sudan
Afghanistan
Pakistan
Somalia 132.5
10.7
12.9
12.9
13.6
15.1
17.5
17.6
22.8
27.1
31.2
55.3
64.2
65.1
70.4
78.8
7.6
7.7
8.1
8.4
8.5
EMRCanada
Cuba
United States of America
Chile
Antigua and Barbuda
Costa Rica
Uruguay
Saint Kitts and Nevis
Bahamas
Argentina
Barbados
Saint Lucia
Mexico
Belize
El Salvador
Brazil
Colombia
Jamaica
Peru
Grenada
Venezuela (Bolivarian Republic of)
Panama
Saint Vincent and the Grenadines
Trinidad and Tobago
Honduras
Nicaragua
Paraguay
Suriname
Ecuador
Guatemala
Dominican Republic
Guyana
Dominica
Bolivia (Plurinational State of)
Haiti
15.3
20.0
20.9
28.5
30.7
32.4
34.0
36.9
10.6
11.1
12.3
13.3
14.6
14.9
15.0
15.1
15.3
67.0
15.3
16.0
16.3
16.4
16.6
18.5
18.7
19.7
19.9
5.5
6.5
8.3
8.5
8.8
9.2
9.3
4.9
AMR
Maldives
Sri Lanka
Thailand
Democratic People's Republic ofKorea
Indonesia
Bhutan
Bangladesh
Nepal
India
Timor-Leste
Myanmar
12.2
20.0
26.4
32.4
34.2
34.5
43.0
49.7
50.8
8.5
9.4
SEAR
Mauritius
Seychelles
Cabo Verde
Algeria
Sao Tome and Principe
Rwanda
Botswana
South Africa
Eritrea
Namibia
Madagascar
Senegal
Gabon
Kenya
Uganda
Congo
Malawi
Zimbabwe
United Republic of Tanzania
Ethiopia
Ghana
Zambia
Gambia
Liberia
Swaziland
Mozambique
Burundi
Comoros
Togo
Cameroon
Mauritania
Angola
Burkina Faso
Guinea-Bissau
Guinea
South Sudan
Equatorial Guinea
Niger
Côte d'Ivoire
Lesotho
Democratic Republic of the Congo
Benin
Nigeria
Mali
Sierra Leone
Central African Republic
Chad 127.3
104.3
110.6
113.5
123.6
38.5
40.6
43.3
44.5
45.2
46.4
47.1
47.4
49.2
53.0
54.1
55.1
56.4
56.7
58.4
58.8
63.4
65.3
67.4
70.4
71.3
71.7
73.3
75.7
79.7
81.4
82.5
84.6
88.1
89.0
90.7
13.7
91.3
91.8
93.5
94.3
90.9
14.3
21.4
25.2
33.8
97.6
AFR
Japan
Singapore
Republic of Korea
Australia
New Zealand
Cook Islands
Malaysia
Brunei Darussalam
China
Palau
Tonga
Samoa
Mongolia
Viet Nam
Fiji
Niue
Tuvalu
Solomon Islands
Philippines
Vanuatu
Cambodia
Micronesia (Federated States of)
Nauru
Marshall Islands
Kiribati
Papua New Guinea
Lao People's Democratic Republic
15.9
16.4
17.3
17.9
21.6
22.0
22.2
25.3
25.8
27.1
27.6
30.6
33.3
34.6
35.4
54.3
54.3
63.9
2.7
2.8
3.4
3.7
5.4
7.8
8.3
9.9
9.9
WPR
The former Yugoslav Republic of Macedonia
Under-five Neonatal
Indicators 3.2.1/3.2.2 Child mortality
1 Numbers next to the bars denote under-five mortality rates . Source: Levels & Trends in Child Mortality. Report 2017. Estimates developed by the UN Inter-agency Group for Child Mortality Estimation. United Nations Children’s Fund, World Health Organization, World Bank and United Nations. New York (NY): United Nations Children’s Fund; 2017 (http://www.childmortality.org/files_v21/download/IGME%20report%202017%20child%20mortality%20final.pdf, accessed 29 March 2018).

Comoros
Algeria
Senegal
Niger
Mauritania
Eritrea
Democratic Republic of the Congo
Madagascar
Burkina Faso
Burundi
Cabo Verde
Ethiopia
Mali
Benin
Chad
Togo
Gambia
Liberia
Guinea
Rwanda
Guinea-Bissau
Ghana
Côte d'Ivoire
Sierra Leone
Gabon
Angola
United Republic of Tanzania
Nigeria
South Sudan
Cameroon
Kenya
Uganda
Congo
Central African Republic
Malawi
Equatorial Guinea
Zimbabwe
Mozambique
Zambia
Namibia
Botswana
South Africa
Swaziland
Lesotho
Mauritius
Sao Tome and Principe
Seychelles
<0.01
12.68
9.37
5.58
5.52
4.37
4.08
3.63
3.03
2.71
2.29
1.80
1.65
1.50
1.46
1.39
1.35
1.23
1.19
0.94
0.92
0.86
0.86
0.78
0.72
0.70
0.67
0.66
0.65
0.59
0.34
0.34
0.33
0.33
0.31
0.20
0.19
0.18
0.17
0.15
0.12
0.09
0.08
0.02
AFRNicaragua
Peru
Bolivia (Plurinational State of)
Mexico
Honduras
Colombia
Ecuador
Argentina
Uruguay
El Salvador
Guatemala
Costa Rica
Paraguay
Venezuela (Bolivarian Republic of)
Brazil
Dominican Republic
Chile
Cuba
Trinidad and Tobago
Panama
Barbados
Suriname
Jamaica
Belize
Guyana
Haiti
Antigua and Barbuda
Bahamas
Canada
Dominica
Grenada
Saint Kitts and Nevis
Saint Lucia
Saint Vincent and the Grenadines
United States of America
0.77
0.77
0.75
0.63
0.62
0.58
0.34
0.29
0.29
0.28
0.24
0.24
0.21
0.20
0.19
0.18
0.16
0.15
0.13
0.12
0.12
0.11
0.10
0.10
0.09
0.06
AMR
Bangladesh
Nepal
Sri Lanka
India
Thailand
Indonesia
Myanmar
Bhutan
Democratic People's Republic ofKorea
Maldives
Timor-Leste
<0.01
0.03
0.03
0.06
0.10
0.19
0.22
SEAR
Croatia
Slovakia
The former Yugoslav Republic of ..
Bulgaria
Netherlands
Serbia
Slovenia
Czechia
Romania
Ireland
Italy
Malta
Sweden
Albania
Armenia
France
Lithuania
Spain
Azerbaijan
Montenegro
Kyrgyzstan
Tajikistan
Kazakhstan
Luxembourg
Latvia
Georgia
Republic of Moldova
Ukraine
Andorra
Austria
Belarus
Belgium
Bosnia and Herzegovina
Cyprus
Denmark
Estonia
Finland
Germany
Greece
Hungary
Iceland
Israel
Monaco
Norway
Poland
Portugal
Russian Federation
San Marino
Switzerland
Turkey
Turkmenistan
United Kingdom
Uzbekistan
0.38
0.38
0.28
0.23
0.18
0.16
0.15
0.13
0.11
0.10
0.09
0.09
0.09
0.09
0.08
0.06
0.06
0.06
0.06
0.04
0.04
0.03
0.03
0.03
0.03
0.02
0.02
0.02
EURJordan
Egypt
Kuwait
Lebanon
Qatar
Saudi Arabia
Afghanistan
Morocco
Tunisia
Bahrain
Yemen
Iran (Islamic Republic of)
Pakistan
Sudan
Somalia
Djibouti
Iraq
Libya
Oman
Syrian Arab Republic
United Arab Emirates
<0.01
0.58
0.17
0.13
0.10
0.06
0.04
0.04
0.03
0.03
0.03
0.02
0.02
0.02
0.02
0.02
EMR
Mongolia
Cambodia
Australia
Lao People's Democratic Republic
Philippines
Fiji
Viet Nam
Malaysia
Papua New Guinea
Brunei Darussalam
China
Cook Islands
Japan
Kiribati
Marshall Islands
Micronesia (Federated States of)
Nauru
New Zealand
Niue
Palau
Republic of Korea
Samoa
Singapore
Solomon Islands
Tonga
Tuvalu
Vanuatu
0.37
0.19
0.12
0.12
0.11
0.10
0.05
0.04
0.01
WPR
The former Yugoslav Republic of Macedonia
26 WORLD HEALTH STATISTICS: 2018
HIV INCIDENCESDG Target 3.3By 2030, end the epidemics of AIDS, tuberculosis, malaria and neglected tropical diseases and combat hepatitis, waterborne diseases and other communicable diseases
Indicator 3.3.1: Number of new HIV infections per 1000 uninfected population, by sex, age and key populations
New HIV infections (per 1000 uninfected population), 20161
Data type: Comparable estimates
Indicator 3.3.1 HIV incidence
1 AIDSinfo [online database]. Geneva: Joint United Nations Programme on HIV/AIDS (UNAIDS); 2017 (http://aidsinfo.unaids.org/, accessed 30 March 2018), and HIV/AIDS [online database]. Global Health Observatory (GHO) data. Geneva: World Health Organization (http://www.who.int/gho/hiv/epidemic_status/incidence/en/, accessed 30 March 2018).

Seychelles
Mauritius
Comoros
Togo
Rwanda
Burkina Faso
Mali
Benin
Algeria
Eritrea
Niger
Sao Tome and Principe
Mauritania
Burundi
Cabo Verde
Senegal
South Sudan
Chad
Côte d'Ivoire
Ghana
Malawi
Gambia
Guinea
Ethiopia
Equatorial Guinea
Uganda
Cameroon
Zimbabwe
Nigeria
Madagascar
United Republic of Tanzania
Sierra Leone
Liberia
Democratic Republic of the Congo
Botswana
Kenya
Angola
Guinea-Bissau
Zambia
Congo
Swaziland
Central African Republic
Namibia
Gabon
Mozambique
Lesotho
South Africa 781
724
551
485
446
407
398
378
376
374
370
348
326
323
308
304
287
237
219
208
203
201
181
177
176
174
159
156
153
153
146
140
137
118
102
99
93
74
70
59
56
51
50
46
35
22
15
AFRSaint Kitts and Nevis
Barbados
Saint Lucia
United States of America
Antigua and Barbuda
Jamaica
Canada
Saint Vincent and the Grenadines
Grenada
Cuba
Dominica
Costa Rica
Chile
Trinidad and Tobago
Mexico
Argentina
Guatemala
Bahamas
Suriname
Uruguay
Colombia
Venezuela (Bolivarian Republic of)
Belize
Honduras
Brazil
Paraguay
Nicaragua
Ecuador
Panama
Dominican Republic
El Salvador
Guyana
Bolivia (Plurinational State of)
Peru
Haiti 188
117
114
93
60
60
55
50
48
42
42
40
38
32
32
29
26
26
24
24
22
18
16
9.5
7.8
6.9
6.4
6.3
5.2
4.5
3.4
3.1
1.9
1.2
0
AMR
Maldives
Sri Lanka
Nepal
Thailand
Bhutan
India
Bangladesh
Myanmar
Indonesia
Timor-Leste
Democratic People's Republic ofKorea
154
172
178
211
221
361
391
498
513
49
65
SEAR
Monaco
San Marino
Iceland
Israel
Greece
Finland
Czechia
Cyprus
Luxembourg
Netherlands
Slovakia
Andorra
Denmark
Italy
Norway
Slovenia
Ireland
France
Switzerland
Germany
Austria
Sweden
Hungary
United Kingdom
Belgium
Spain
Croatia
Malta
Albania
Estonia
Montenegro
The former Yugoslav Republic of ..
Poland
Turkey
Serbia
Portugal
Bulgaria
Bosnia and Herzegovina
Latvia
Armenia
Belarus
Lithuania
Turkmenistan
Azerbaijan
Russian Federation
Kazakhstan
Romania
Uzbekistan
Tajikistan
Ukraine
Georgia
Republic of Moldova
Kyrgyzstan 145
101
92
87
85
76
74
67
66
66
60
53
52
44
37
32
27
20
19
18
18
16
16
16
16
13
12
10
10
9.9
8.8
8.2
8.2
8.1
7.8
7.7
7.1
6.5
6.1
6.1
6.1
6
5.9
5.9
5.8
5.6
5
4.7
4.4
3.5
2.1
0
0
EURUnited Arab Emirates
Jordan
Oman
Saudi Arabia
Bahrain
Lebanon
Egypt
Iran (Islamic Republic of)
Syrian Arab Republic
Qatar
Kuwait
Tunisia
Libya
Iraq
Yemen
Sudan
Morocco
Afghanistan
Pakistan
Somalia
Djibouti 335
270
268
189
103
82
48
43
40
38
24
23
21
14
14
12
12
10
9
5.6
0.79
EMR
Australia
New Zealand
Samoa
Tonga
Cook Islands
Japan
Niue
Singapore
Vanuatu
Fiji
China
Brunei Darussalam
Republic of Korea
Solomon Islands
Malaysia
Nauru
Palau
Viet Nam
Lao People's Democratic Republic
Micronesia (Federated States of)
Mongolia
Tuvalu
Cambodia
Marshall Islands
Papua New Guinea
Philippines
Kiribati 566
554
432
422
345
207
183
177
175
133
123
112
92
84
77
66
64
59
56
51
20
16
13
8.6
7.7
7.3
6.1
WPR
The former Yugoslav Republic of Macedonia
27MONITORING HEALTH FOR THE SDGs
TUBERCULOSIS INCIDENCESDG Target 3.3By 2030, end the epidemics of AIDS, tuberculosis, malaria and neglected tropical diseases and combat hepatitis, waterborne diseases and other communicable diseases
Indicator 3.3.2: Tuberculosis incidence per 100 000 population
Tuberculosis incidence (per 100 000 population), 20161
Data type: Comparable estimates
Indicator 3.3.2 Tuberculosis incidence
1 Global tuberculosis report 2017. Geneva: World Health Organization; 2017 (http://www.who.int/tb/publications/global_report/en/, accessed 30 March 2018).

Algeria
Cabo Verde
South Africa
Comoros
Swaziland
Botswana
Sao Tome and Principe
Eritrea
Namibia
Senegal
Ethiopia
Madagascar
Guinea-Bissau
Zimbabwe
Kenya
Mauritania
Angola
Gambia
United Republic of Tanzania
Burundi
South Sudan
Chad
Uganda
Zambia
Congo
Gabon
Côte d'Ivoire
Liberia
Equatorial Guinea
Malawi
Cameroon
Ghana
Democratic Republic of the Congo
Benin
Sierra Leone
Mozambique
Central African Republic
Nigeria
Togo
Niger
Guinea
Rwanda
Burkina Faso
Mali
Lesotho
Mauritius
Seychelles
459.7
423.3
392.7
386.5
378.9
360.4
349.6
311.6
307.8
303.5
297.3
291.9
285.6
271.3
249.1
238.8
237.0
223.2
206.2
204.7
189.8
187.2
167.6
159.0
156.2
144.2
129.6
120.3
88.5
85.3
77.9
73.0
64.4
53.1
49.0
29.3
17.2
11.2
2.4
1.9
1.8
1.1
0.7
0.0
AFRArgentina
Paraguay
Belize
Costa Rica
El Salvador
Dominican Republic
Mexico
Panama
Guatemala
Suriname
Honduras
Bolivia (Plurinational State of)
Ecuador
Brazil
Nicaragua
Haiti
Colombia
Peru
Venezuela (Bolivarian Republic of)
Guyana
Antigua and Barbuda
Bahamas
Barbados
Canada
Chile
Cuba
Dominica
Grenada
Jamaica
Saint Kitts and Nevis
Saint Lucia
Saint Vincent and the Grenadines
Trinidad and Tobago
United States of America
Uruguay
<0.1
<0.1
<0.1
77.7
44.7
17.8
17.2
13.9
7.8
6.7
3.8
2.7
1.7
1.4
0.8
0.4
0.4
0.3
0.0
0.0
AMR
Sri Lanka
Bhutan
Democratic People's Republic ofKorea
Bangladesh
Nepal
Timor-Leste
Thailand
Myanmar
Indonesia
India
Maldives
<0.1
18.8
0.0
0.5
0.6
0.9
0.9
1.6
7.2
9.2
SEAR
Azerbaijan
Georgia
Kyrgyzstan
Tajikistan
Turkey
Uzbekistan
Albania
Andorra
Armenia
Austria
Belarus
Belgium
Bosnia and Herzegovina
Bulgaria
Croatia
Cyprus
Czechia
Denmark
Estonia
Finland
France
Germany
Greece
Hungary
Iceland
Ireland
Israel
Italy
Kazakhstan
Latvia
Lithuania
Luxembourg
Malta
Monaco
Montenegro
Netherlands
Norway
Poland
Portugal
Republic of Moldova
Romania
Russian Federation
San Marino
Serbia
Slovakia
Slovenia
Spain
Sweden
Switzerland
The former Yugoslav Republic of ..
Turkmenistan
Ukraine
United Kingdom
0.0
0.0
0.0
0.0
0.0
0.0
EURIraq
Iran (Islamic Republic of)
Saudi Arabia
Djibouti
Pakistan
Yemen
Afghanistan
Sudan
Somalia
Bahrain
Egypt
Jordan
Kuwait
Lebanon
Libya
Morocco
Oman
Qatar
Syrian Arab Republic
Tunisia
United Arab Emirates
60.2
35.3
30.8
30.5
10.6
9.6
0.2
0.2
0.0
EMR
China
Viet Nam
Malaysia
Republic of Korea
Philippines
Lao People's Democratic Republic
Cambodia
Vanuatu
Solomon Islands
Papua New Guinea
Australia
Brunei Darussalam
Cook Islands
Fiji
Japan
Kiribati
Marshall Islands
Micronesia (Federated States of)
Mongolia
Nauru
New Zealand
Niue
Palau
Samoa
Singapore
Tonga
Tuvalu
<0.1
179.4
144.8
14.7
8.9
7.8
0.5
0.3
0.2
0.1
WPR
The former Yugoslav Republic of Macedonia
28 WORLD HEALTH STATISTICS: 2018
MALARIA INCIDENCESDG Target 3.3By 2030, end the epidemics of AIDS, tuberculosis, malaria and neglected tropical diseases and combat hepatitis, waterborne diseases and other communicable diseases
Indicator 3.3.3: Malaria incidence per 1000 population
Malaria incidence (per 1000 population at risk), 20161
Data type: Comparable estimates
Indicator 3.3.3 Malaria incidence
1 World malaria report 2017. Geneva: World Health Organization; 2017 (http://www.who.int/malaria/publications/world-malaria-report-2017/report/en/, accessed 30 March 2018).

Seychelles
Botswana
Algeria
Mauritius
Namibia
Cabo Verde
Eritrea
Swaziland
Kenya
Gambia
Sao Tome and Principe
Democratic Republic of the Congo
Lesotho
United Republic of Tanzania
Rwanda
South Africa
Zambia
Cameroon
Comoros
Guinea-Bissau
Burundi
Ethiopia
Nigeria
Malawi
Côte d'Ivoire
Chad
Uganda
Togo
Senegal
Ghana
Mozambique
Congo
Gabon
Burkina Faso
Mauritania
Madagascar
Zimbabwe
Angola
Mali
Benin
Niger
Central African Republic
Guinea
Liberia
Sierra Leone
Equatorial Guinea
South Sudan 21.13
8.66
8.18
7.75
7.47
6.62
6.01
5.55
4.88
4.85
4.38
4.36
4.29
4.29
4.16
4.11
3.67
3.61
3.48
3.36
3.16
3.08
3.04
3.03
2.61
2.61
2.59
2.12
1.96
1.90
1.84
1.74
1.74
1.69
1.64
1.43
1.36
1.17
0.86
0.85
0.74
0.71
0.66
0.61
0.22
0.19
0.15
AFRArgentina
Mexico
United States of America
Guatemala
Brazil
Cuba
Nicaragua
Jamaica
Costa Rica
Bolivia (Plurinational State of)
Colombia
Panama
Peru
Honduras
Chile
Bahamas
Ecuador
Barbados
Dominican Republic
Uruguay
Suriname
Antigua and Barbuda
Saint Kitts and Nevis
Dominica
Saint Lucia
Saint Vincent and the Grenadines
Trinidad and Tobago
Grenada
El Salvador
Venezuela (Bolivarian Republic of)
Paraguay
Guyana
Canada
Belize
Haiti 2.04
1.49
1.03
0.95
0.65
0.62
0.57
0.47
0.43
0.42
0.39
0.39
0.38
0.38
0.36
0.35
0.34
0.34
0.32
0.31
0.28
0.25
0.24
0.22
0.21
0.20
0.17
0.16
0.14
0.12
0.07
0.05
0.04
0.04
0.01
AMR
Thailand
Maldives
Nepal
India
Democratic People's Republic ofKorea
Sri Lanka
Bhutan
Timor-Leste
Indonesia
Bangladesh
Myanmar
0.17
0.19
0.31
0.51
0.53
0.64
0.81
0.87
1.07
1.38
2.03
SEAR
France
Ireland
Norway
Netherlands
Poland
Andorra
Portugal
Croatia
Serbia
Switzerland
Belgium
Lithuania
Spain
Belarus
Monaco
The former Yugoslav Republic of ..
Kazakhstan
United Kingdom
Turkmenistan
Germany
Luxembourg
Armenia
Georgia
Azerbaijan
Bosnia and Herzegovina
Bulgaria
Austria
San Marino
Sweden
Turkey
Estonia
Greece
Czechia
Malta
Hungary
Ukraine
Israel
Kyrgyzstan
Latvia
Slovakia
Cyprus
Uzbekistan
Italy
Montenegro
Republic of Moldova
Romania
Tajikistan
Denmark
Iceland
Russian Federation
Slovenia
Finland
Albania 1.29
1.05
1.04
0.88
0.88
0.79
0.71
0.65
0.65
0.65
0.61
0.60
0.60
0.56
0.51
0.50
0.48
0.46
0.44
0.39
0.39
0.37
0.36
0.32
0.32
0.32
0.32
0.31
0.30
0.27
0.26
0.25
0.24
0.24
0.23
0.22
0.21
0.20
0.20
0.20
0.19
0.19
0.18
0.17
0.11
0.11
0.10
0.08
0.04
0.04
0.01
0.01
0.01
EURIran (Islamic Republic of)
Iraq
United Arab Emirates
Kuwait
Bahrain
Qatar
Lebanon
Libya
Saudi Arabia
Syrian Arab Republic
Oman
Morocco
Afghanistan
Djibouti
Tunisia
Egypt
Jordan
Yemen
Pakistan
Sudan
Somalia 10.54
2.86
2.75
2.54
1.01
0.80
0.76
0.64
0.50
0.45
0.44
0.37
0.30
0.27
0.21
0.20
0.18
0.11
0.08
0.06
0.02
EMR
Australia
Malaysia
Palau
Cook Islands
Niue
Brunei Darussalam
Fiji
Singapore
Cambodia
Republic of Korea
Tuvalu
China
Micronesia (Federated States of)
Samoa
Philippines
New Zealand
Viet Nam
Marshall Islands
Mongolia
Lao People's Democratic Republic
Japan
Nauru
Papua New Guinea
Tonga
Solomon Islands
Kiribati
Vanuatu 8.48
3.65
2.93
2.35
2.24
2.11
1.95
1.94
1.72
1.56
1.20
1.20
1.07
1.05
0.89
0.83
0.70
0.69
0.56
0.47
0.34
0.34
0.24
0.22
0.21
0.17
0.15
WPR
The former Yugoslav Republic of Macedonia
29MONITORING HEALTH FOR THE SDGs
HEPATITIS B INCIDENCESDG Target 3.3By 2030, end the epidemics of AIDS, tuberculosis, malaria and neglected tropical diseases and combat hepatitis, waterborne diseases and other communicable diseases
Indicator 3.3.4: Hepatitis B incidence per 100 000 population
Hepatitis B surface antigen (HBsAg) prevalence among children under 5 years old (%), 20151
Data type: Comparable estimates
Indicator 3.3.4 Hepatitis B incidence
1 This indicator is used here as a proxy for the SDG indicator. Data source: Global and Country Estimates of immunization coverage and chronic HBV infection [online database]. Geneva: World Health Organization; 23 March 2017 update (http://whohbsagdashboard.com/#global-strategies, accessed 30 March 2018).

Algeria
Mauritius
Seychelles
Cabo Verde
Gambia
Swaziland
Sao Tome and Principe
Botswana
Equatorial Guinea
Comoros
Lesotho
Mauritania
Gabon
Namibia
Eritrea
Guinea-Bissau
Congo
Liberia
Central African Republic
Rwanda
Burundi
Chad
Togo
South Africa
Benin
Guinea
Sierra Leone
Zimbabwe
South Sudan
Malawi
Zambia
Senegal
Kenya
Burkina Faso
Angola
Niger
Ghana
Côte d'Ivoire
Mali
Madagascar
Cameroon
Uganda
Mozambique
United Republic of Tanzania
Democratic Republic of the Congo
Ethiopia
Nigeria
694
590
531
528
429
262
200
198
177
146
128 937
74 205
49 901
25 009
23 921
23 486
19 390
18 863
18 606
16 757
15 537
15 234
14 419
12 492
11 771
11 636
11 573
11 435
9 991
9 958
7 652
7 246
6 938
6 784
6 328
6 139
5 898
5 191
3 757
2 920
2 278
1 577
1 498
1 097
0.0
0.0
0.0
AFRCanada
Chile
Saint Vincent and the Grenadines
Saint Kitts and Nevis
Antigua and Barbuda
Grenada
United States of America
Barbados
Uruguay
Bahamas
Belize
Dominica
Trinidad and Tobago
Costa Rica
Saint Lucia
Cuba
Suriname
Argentina
Venezuela (Bolivarian Republic of)
Jamaica
Panama
Guyana
El Salvador
Paraguay
Nicaragua
Dominican Republic
Bolivia (Plurinational State of)
Ecuador
Honduras
Peru
Guatemala
Colombia
Haiti
Mexico
Brazil
<0.1
<0.1
971
927
791
743
720
453
348
282
80
58
44
27
24
19
10 461
9 532
7 581
7
7
4
3 761
3 266
2 815
2 752
1 943
1 880
1
1
0.9
0.2
0.2
0.1
0.0
AMR
Maldives
Sri Lanka
Thailand
Bhutan
Timor-Leste
Democratic People's Republic ofKorea
Nepal
Myanmar
Bangladesh
Indonesia
India
101 813
458 855
17 553
39 343
47 484
1 167
5 215
242
56
64
2
x 3
SEAR
Andorra
Belarus
Bosnia and Herzegovina
Cyprus
Denmark
Estonia
Iceland
Luxembourg
Monaco
Republic of Moldova
Russian Federation
San Marino
Serbia
Switzerland
Ukraine
Albania
Austria
Belgium
Croatia
Czechia
Finland
France
Greece
Hungary
Ireland
Italy
Latvia
Lithuania
Malta
Montenegro
Netherlands
Norway
Poland
Portugal
Romania
Slovakia
Slovenia
Spain
Sweden
The former Yugoslav Republic of ..
Turkmenistan
United Kingdom
Germany
Israel
Kazakhstan
Bulgaria
Turkey
Armenia
Kyrgyzstan
Tajikistan
Uzbekistan
Georgia
Azerbaijan
<0.1
<0.1
<0.1
<0.1
<0.1
<0.1
<0.1
<0.1
<0.1
<0.1
<0.1
<0.1
<0.1
<0.1
<0.1
<0.1
<0.1
<0.1
<0.1
<0.1
<0.1
<0.1
<0.1
<0.1
<0.1
<0.1
<0.1
412
406
126
114
39
1 719
1
0.3
0.2
0.2
0.1
0.0
0.0
0.0
0.0
0.0
0.0
0.0
0.0
0.0
0.0
0.0
0.0
0.0
0.0
0.0
EURIran (Islamic Republic of)
Oman
Saudi Arabia
Bahrain
Kuwait
Lebanon
Libya
Morocco
Qatar
United Arab Emirates
Jordan
Tunisia
Syrian Arab Republic
Djibouti
Egypt
Iraq
Somalia
Yemen
Afghanistan
Sudan
Pakistan
<0.1
<0.1
<0.1
<0.1
<0.1
<0.1
<0.1
111
47
31 683
25 572
13 275
6
5 986
5 164
2 170
1 674
0.1
0.0
0.0
0.0
EMR
Cook Islands
Mongolia
New Zealand
Japan
Niue
Palau
Republic of Korea
Nauru
Brunei Darussalam
Tuvalu
Singapore
Marshall Islands
Australia
Tonga
Samoa
Micronesia (Federated States of)
Kiribati
Malaysia
Vanuatu
Solomon Islands
Fiji
Lao People's Democratic Republic
Cambodia
Papua New Guinea
Viet Nam
China
Philippines
<0.1
<0.1
<0.1
905
518
271
120
117
71
61
49 110
37
26 376
21
20
13
11
9
6 954
6 529
4 771
3
2 206
0.3
0.0
0.0
0.0
WPR
The former Yugoslav Republic of Macedonia
30 WORLD HEALTH STATISTICS: 2018
NEED FOR NEGLECTED TROPICAL DISEASE INTERVENTIONSSDG Target 3.3By 2030, end the epidemics of AIDS, tuberculosis, malaria and neglected tropical diseases and combat hepatitis, water-borne diseases and other communicable diseases
Indicator 3.3.5: Number of people requiring interventions against neglected tropical diseases
Reported number of people (in thousands) requiring interventions against NTDs, 20161
Data type: Other data
Indicator 3.3.5 Need for neglected tropical disease interventions
1 Neglected tropical diseases [online database]. Global Health Observatory (GHO) data. Geneva: World Health Organization (http://www.who.int/gho/neglected_diseases/en/). Scales differ by region. The bar for India is rescaled to one third of its actual length.

Kenya
Algeria
Gabon
Malawi
Angola
Congo
Cabo Verde
Liberia
United Republic of Tanzania
Zambia
Mauritania
Senegal
Rwanda
Ethiopia
Mozambique
Sao Tome and Principe
Zimbabwe
Democratic Republic of the Congo
Benin
South Sudan
Guinea-Bissau
Niger
Botswana
Gambia
Ghana
Seychelles
Namibia
Cameroon
Burkina Faso
Uganda
Equatorial Guinea
Guinea
Nigeria
Mauritius
Burundi
Comoros
Madagascar
Central African Republic
Togo
Chad
Eritrea
Mali
South Africa
Lesotho
Swaziland
Côte d'Ivoire
Sierra Leone 30.5
29.1
26.7
26.6
26.2
24.6
23.9
23.9
23.6
23.1
22.9
22.9
22.9
22.6
22.5
22.4
22.0
21.9
21.7
21.6
21.3
21.2
20.8
20.4
20.3
20.0
20.0
19.8
19.6
19.4
19.3
18.5
18.4
18.3
18.2
18.1
18.1
17.9
17.9
17.6
17.2
16.7
16.5
16.4
14.4
14.2
13.4
AFRCanada
Costa Rica
Chile
Peru
Ecuador
Panama
El Salvador
Honduras
Nicaragua
United States of America
Jamaica
Guatemala
Bahamas
Mexico
Argentina
Colombia
Barbados
Cuba
Brazil
Uruguay
Bolivia (Plurinational State of)
Paraguay
Venezuela (Bolivarian Republic of)
Saint Lucia
Dominican Republic
Trinidad and Tobago
Grenada
Suriname
Belize
Antigua and Barbuda
Saint Vincent and the Grenadines
Haiti
Guyana
Dominica
Saint Kitts and Nevis
30.5
26.5
23.2
22.6
22.1
21.7
21.4
21.3
19.0
18.8
18.1
17.5
17.2
16.7
16.6
16.4
16.2
15.8
15.8
15.7
15.5
14.9
14.7
14.6
14.2
14.0
14.0
13.0
13.0
12.6
12.4
11.5
9.8
AMR
Maldives
Thailand
Sri Lanka
Timor-Leste
Bangladesh
Nepal
Bhutan
India
Myanmar
Democratic People's Republic ofKorea
Indonesia
13.4
14.5
17.4
19.9
21.6
21.8
23.3
23.3
24.2
25.6
26.4
SEAR
Switzerland
Iceland
Sweden
Norway
Italy
Israel
Spain
Luxembourg
Finland
Ireland
France
Malta
United Kingdom
Portugal
Netherlands
Cyprus
Denmark
Austria
Belgium
Germany
Greece
Slovenia
Czechia
Turkey
Croatia
Albania
Estonia
Slovakia
Bosnia and Herzegovina
Poland
Serbia
The former Yugoslav Republic of ..
Montenegro
Lithuania
Romania
Latvia
Azerbaijan
Armenia
Hungary
Bulgaria
Belarus
Uzbekistan
Ukraine
Georgia
Kyrgyzstan
Republic of Moldova
Tajikistan
Russian Federation
Kazakhstan
Turkmenistan
Andorra
Monaco
San Marino
29.5
26.8
25.4
25.3
24.9
24.9
24.9
24.7
24.5
23.7
23.6
23.0
22.3
22.2
21.9
21.4
20.7
20.6
20.3
19.1
18.7
17.8
17.2
17.0
17.0
16.7
16.1
15.0
12.7
12.4
12.1
11.4
11.4
11.3
11.3
11.2
11.1
10.9
10.8
10.6
10.3
10.2
10.0
9.9
9.6
9.5
9.2
9.1
9.1
8.6
EURBahrain
Morocco
Iran (Islamic Republic of)
Qatar
Tunisia
Saudi Arabia
United Arab Emirates
Kuwait
Oman
Lebanon
Jordan
Djibouti
Libya
Iraq
Somalia
Syrian Arab Republic
Pakistan
Sudan
Egypt
Afghanistan
Yemen 30.6
29.8
27.7
26.0
24.7
21.8
21.8
21.3
20.1
19.6
19.2
17.9
17.8
17.4
16.8
16.4
16.1
15.3
14.8
12.4
11.3
EMR
Republic of Korea
Japan
Australia
Singapore
New Zealand
Brunei Darussalam
China
Viet Nam
Malaysia
Samoa
Cambodia
Tonga
Vanuatu
Solomon Islands
Micronesia (Federated States of)
Philippines
Lao People's Democratic Republic
Kiribati
Papua New Guinea
Mongolia
Fiji
Cook Islands
Marshall Islands
Nauru
Niue
Palau
Tuvalu
30.6
30.2
30.0
28.4
27.0
26.8
26.1
23.8
23.3
23.3
21.1
20.6
17.2
17.1
17.0
16.6
10.1
9.3
9.1
8.4
7.8
WPR
The former Yugoslav Republic of Macedonia
31MONITORING HEALTH FOR THE SDGs
MORTALITY DUE TO NONCOMMUNICABLE DISEASESSDG Target 3.4By 2030, reduce by one third premature mortality from noncommunicable diseases through prevention and treatment and promote mental health and well-being
Indicator 3.4.1: Mortality rate attributed to cardiovascular disease, cancer, diabetes or chronic respiratory disease
Probability of dying from any of CVD, cancer, diabetes, CRD between age 30 and exact age 70 (%), 20161
Data type: Comparable estimates
Indicator 3.4.1 Mortality due to noncommunicable diseases
1 Global Health Estimates 2016: Deaths by cause, age, sex, by country and by region, 2000–2016. Geneva: World Health Organization; 2018. WHO Member States with a population of less than 90 000 in 2016 were not included in the analysis.

Sao Tome and Principe
Algeria
Kenya
Malawi
South Sudan
Madagascar
Guinea-Bissau
Mauritania
Niger
Angola
Mali
Mozambique
Gambia
Ghana
United Republic of Tanzania
Democratic Republic of the Congo
Congo
Senegal
Zambia
Guinea
Rwanda
Comoros
Liberia
Gabon
Ethiopia
Burkina Faso
Central African Republic
Mauritius
Eritrea
Namibia
Chad
Burundi
Botswana
Seychelles
Nigeria
Togo
Sierra Leone
Benin
Uganda
Zimbabwe
Cabo Verde
South Africa
Cameroon
Swaziland
Côte d'Ivoire
Equatorial Guinea
Lesotho 21.2
16.4
14.5
13.3
12.2
11.6
11.3
10.7
9.9
9.9
9.7
9.6
9.5
9.3
9.3
9.1
8.8
8.7
7.9
7.8
7.7
7.7
7.2
7.1
6.8
6.8
6.7
6.3
6.1
6.0
5.9
5.7
5.4
5.4
5.1
4.9
4.8
4.7
4.6
4.4
4.0
3.9
3.7
3.7
3.2
3.2
2.3
AFRAntigua and Barbuda
Barbados
Bahamas
Grenada
Jamaica
Saint Vincent and the Grenadines
Guatemala
Honduras
Venezuela (Bolivarian Republic of)
Panama
Belize
Peru
Mexico
Brazil
Ecuador
Colombia
Saint Lucia
Costa Rica
Argentina
Paraguay
Dominican Republic
Chile
Haiti
Bolivia (Plurinational State of)
Nicaragua
Canada
Trinidad and Tobago
El Salvador
Cuba
United States of America
Uruguay
Suriname
Guyana
Dominica
Saint Kitts and Nevis
29.2
22.8
18.4
15.3
13.9
13.7
13.6
12.5
12.2
12.2
11.7
10.6
9.9
9.5
9.2
7.9
7.8
7.2
7.1
6.5
5.1
4.9
4.7
4.3
3.7
2.9
2.7
2.4
2.2
1.7
1.7
0.8
0.5
AMR
Maldives
Indonesia
Timor-Leste
Bangladesh
Myanmar
Nepal
Democratic People's Republic ofKorea
Bhutan
Thailand
Sri Lanka
India
11.2
11.4
14.4
14.6
16.3
2.3
3.4
4.6
5.9
7.8
8.8
SEAR
Tajikistan
Azerbaijan
Greece
Cyprus
Israel
Albania
Armenia
Turkmenistan
Turkey
Uzbekistan
Malta
The former Yugoslav Republic of ..
Georgia
Italy
Kyrgyzstan
Spain
Bosnia and Herzegovina
United Kingdom
Montenegro
Romania
Bulgaria
Ireland
Norway
Netherlands
Denmark
Slovakia
Czechia
Luxembourg
Germany
Iceland
Portugal
Sweden
Austria
Serbia
Finland
Republic of Moldova
Poland
Croatia
Switzerland
France
Estonia
Slovenia
Hungary
Belgium
Latvia
Ukraine
Kazakhstan
Belarus
Russian Federation
Lithuania
Andorra
Monaco
San Marino
31.9
31.0
26.2
22.5
22.4
21.2
20.7
19.1
18.6
17.8
17.7
17.2
16.5
16.2
15.9
15.9
15.6
15.6
14.8
14.0
14.0
13.6
13.5
13.1
12.8
12.8
12.6
12.2
11.5
11.5
10.4
10.3
8.9
8.8
8.7
8.3
8.2
8.2
7.9
7.5
7.4
7.3
6.7
6.6
6.3
5.4
5.3
5.0
2.6
2.5
EURSyrian Arab Republic
Kuwait
United Arab Emirates
Jordan
Morocco
Pakistan
Iraq
Saudi Arabia
Lebanon
Tunisia
Oman
Egypt
Iran (Islamic Republic of)
Afghanistan
Somalia
Libya
Bahrain
Qatar
Djibouti
Sudan
Yemen 8.5
8.1
6.7
6.6
5.9
5.2
4.7
4.7
4.1
4.0
3.9
3.4
3.3
3.2
3.0
2.9
2.9
2.9
2.8
2.3
1.9
EMR
Philippines
Tonga
Samoa
Vanuatu
Brunei Darussalam
Solomon Islands
Fiji
Cambodia
Malaysia
Papua New Guinea
Viet Nam
Lao People's Democratic Republic
China
Singapore
Micronesia (Federated States of)
New Zealand
Mongolia
Australia
Kiribati
Japan
Republic of Korea
Cook Islands
Marshall Islands
Nauru
Niue
Palau
Tuvalu
26.9
18.5
14.4
13.2
13.0
12.1
11.1
9.9
9.7
8.6
7.3
6.0
5.5
5.3
5.0
4.7
4.6
4.5
4.4
3.5
3.2
WPR
The former Yugoslav Republic of Macedonia
32 WORLD HEALTH STATISTICS: 2018
SUICIDE MORTALITY RATESDG Target 3.4By 2030, reduce by one third premature mortality from noncommunicable diseases through prevention and treatment and promote mental health and well-being
Indicator 3.4.2: Suicide mortality rate
Suicide mortality rate (per 100 000 population), 20161
Data type: Comparable estimates
Indicator 3.4.2 Suicide mortality rate
1 Global Health Estimates 2016: Deaths by cause, age, sex, by country and by region, 2000–2016. Geneva: World Health Organization; 2018. WHO Member States with a population of less than 90 000 in 2016 were not included in the analysis.

Mauritania
Niger
Senegal
Algeria
Comoros
Eritrea
Guinea
Mali
Chad
Madagascar
Mozambique
Democratic Republic of the Congo
Ghana
Ethiopia
Benin
Togo
Central African Republic
Kenya
Mauritius
Malawi
Gambia
Guinea-Bissau
Zambia
Zimbabwe
Lesotho
Cabo Verde
Sierra Leone
Liberia
Angola
Sao Tome and Principe
Burundi
Congo
Burkina Faso
Botswana
Côte d'Ivoire
Cameroon
Rwanda
South Africa
United Republic of Tanzania
Uganda
Namibia
Swaziland
Equatorial Guinea
Gabon
Seychelles
Nigeria
South Sudan
13.4
12.0
11.5
11.3
9.9
9.8
9.5
9.4
9.3
9.0
8.9
8.4
8.4
8.2
7.8
7.5
6.8
6.4
5.8
5.7
5.7
5.0
4.8
4.8
4.8
3.8
3.7
3.6
3.4
3.3
3.1
3.0
2.8
2.7
2.6
2.4
1.9
1.5
1.3
1.3
1.3
0.9
0.9
0.7
0.5
0.0
AFRGuatemala
El Salvador
Honduras
Jamaica
Bahamas
Ecuador
Bolivia (Plurinational State of)
Costa Rica
Suriname
Nicaragua
Venezuela (Bolivarian Republic of)
Colombia
Haiti
Cuba
Guyana
Peru
Mexico
Belize
Dominican Republic
Antigua and Barbuda
Paraguay
Brazil
Panama
Dominica
Saint Vincent and the Grenadines
Trinidad and Tobago
Canada
Chile
Grenada
Saint Kitts and Nevis
Barbados
Argentina
United States of America
Saint Lucia
Uruguay 10.8
9.9
9.8
9.8
9.6
9.4
9.3
9.3
8.9
8.4
8.2
8.2
7.9
7.8
7.2
7.0
6.9
6.7
6.5
6.3
6.3
6.1
5.8
5.8
5.6
5.2
5.1
4.8
4.8
4.4
4.4
4.2
4.0
3.7
2.4
AMR
Bangladesh
Bhutan
Indonesia
Nepal
Timor-Leste
Maldives
Democratic People's Republic ofKorea
Sri Lanka
Myanmar
India
Thailand
0.0
0.6
0.8
2.0
2.1
2.7
3.9
4.3
4.8
5.7
8.3
SEAR
Azerbaijan
Turkey
Uzbekistan
Tajikistan
Israel
Turkmenistan
Armenia
Kyrgyzstan
Bosnia and Herzegovina
Albania
Italy
Norway
Kazakhstan
Montenegro
Malta
The former Yugoslav Republic of ..
Ukraine
Netherlands
Croatia
Iceland
Sweden
Georgia
Spain
Denmark
Greece
Finland
Cyprus
Serbia
Belarus
Andorra
Hungary
United Kingdom
Slovakia
Switzerland
Austria
Estonia
Poland
Russian Federation
Belgium
Portugal
France
Romania
Slovenia
Bulgaria
Latvia
Ireland
Luxembourg
Germany
Czechia
Lithuania
Republic of Moldova
Monaco
San Marino
15.2
15.0
14.4
13.4
13.0
13.0
12.9
12.7
12.6
12.6
12.6
12.3
12.1
11.7
11.6
11.6
11.6
11.5
11.5
11.4
11.4
11.3
11.2
11.1
10.8
10.7
10.4
10.4
10.0
9.8
9.2
9.1
8.9
8.7
8.6
8.1
8.1
8.0
7.7
7.5
7.5
7.5
6.4
6.2
5.5
5.4
3.8
3.3
2.7
2.0
0.8
EURKuwait
Libya
Somalia
Yemen
Afghanistan
Saudi Arabia
Pakistan
Syrian Arab Republic
Egypt
Iraq
Djibouti
Sudan
Morocco
Jordan
Oman
Iran (Islamic Republic of)
Lebanon
Bahrain
Tunisia
Qatar
United Arab Emirates 3.8
2.0
1.9
1.9
1.5
1.0
0.8
0.7
0.6
0.5
0.5
0.4
0.4
0.3
0.3
0.2
0.2
0.1
0.0
0.0
0.0
EMR
Brunei Darussalam
Kiribati
Malaysia
Vanuatu
Papua New Guinea
Solomon Islands
Tonga
Tuvalu
Singapore
Micronesia (Federated States of)
Samoa
Fiji
Nauru
Philippines
Cambodia
Niue
China
Mongolia
Japan
Viet Nam
Republic of Korea
Lao People's Democratic Republic
Australia
Cook Islands
New Zealand
Marshall Islands
Palau
10.7
10.6
10.6
10.4
10.2
8.3
8.0
7.4
7.2
7.0
6.7
6.6
6.0
3.0
2.5
2.5
2.0
1.7
1.5
1.4
1.2
1.0
0.9
0.4
0.4
WPR
The former Yugoslav Republic of Macedonia
33MONITORING HEALTH FOR THE SDGs
Total alcohol per capita (≥ 15 years of age) consumption in litres of pure alcohol, 20161
Data type: Comparable estimates
ALCOHOL USESDG Target 3.5Strengthen the prevention and treatment of substance abuse, including narcotic drug abuse and harmful use of alcohol
Indicator 3.5.2: Harmful use of alcohol, defined according to the national context as alcohol per capita consumption (aged 15 years and older) within a calendar year in litres of pure alcohol
Indicator 3.5.2 Alcohol use
1 WHO Global Information System on Alcohol and Health (GISAH) [online database]. Global Health Observatory (GHO) data. Geneva: World Health Organization (http://www.who.int/gho/alcohol/en/, accessed 30 March 2018).

Seychelles
Mauritius
Nigeria
Equatorial Guinea
Gabon
Botswana
Algeria
Namibia
Chad
Eritrea
Côte d'Ivoire
Swaziland
Mauritania
Zambia
South Africa
Ethiopia
Mali
Cabo Verde
Ghana
Congo
Niger
Angola
Senegal
Guinea
Sierra Leone
Uganda
Guinea-Bissau
Cameroon
Benin
South Sudan
Comoros
Lesotho
Zimbabwe
Madagascar
Kenya
Gambia
Burkina Faso
Sao Tome and Principe
Togo
Burundi
Mozambique
Rwanda
Central African Republic
United Republic of Tanzania
Democratic Republic of the Congo
Liberia
Malawi 35.0
33.7
33.2
32.9
32.4
32.1
31.6
31.3
31.1
31.1
30.0
29.4
29.1
28.4
28.2
28.2
28.0
27.9
27.7
27.6
27.5
27.4
27.3
27.3
27.2
26.9
26.4
26.4
26.2
26.1
25.6
25.3
25.1
24.7
24.5
24.2
24.2
24.1
24.1
23.9
23.8
23.6
22.9
22.9
20.5
12.2
8.6
AFRGrenada
Canada
Antigua and Barbuda
Barbados
Cuba
Saint Vincent and the Grenadines
Panama
United States of America
Jamaica
Mexico
Chile
Argentina
Bahamas
Costa Rica
Peru
Trinidad and Tobago
Haiti
Dominica
Nicaragua
Uruguay
Colombia
Guyana
Honduras
Saint Lucia
Guatemala
Suriname
Ecuador
Paraguay
El Salvador
Bolivia (Plurinational State of)
Brazil
Belize
Dominican Republic
Venezuela (Bolivarian Republic of)
Saint Kitts and Nevis
45.1
29.3
24.4
23.4
23.2
21.1
20.7
20.1
19.1
19.0
18.1
17.4
17.3
16.8
16.6
15.3
15.3
15.1
14.1
13.9
13.9
13.8
13.6
12.4
12.3
11.5
10.6
10.0
8.2
7.5
6.7
6.7
6.0
5.7
AMR
Maldives
Bangladesh
Bhutan
Indonesia
India
Timor-Leste
Nepal
Sri Lanka
Myanmar
Democratic People's Republic ofKorea
Thailand
13.6
15.1
15.3
16.6
16.6
17.0
17.4
20.3
20.8
36.2
3.5
SEAR
Monaco
Sweden
United Kingdom
San Marino
Switzerland
Netherlands
Denmark
Israel
Spain
Norway
Ireland
Germany
Iceland
Finland
France
Malta
Cyprus
Austria
Czechia
Italy
Slovenia
Slovakia
Belgium
Estonia
Andorra
Hungary
Serbia
Portugal
Bulgaria
Luxembourg
Romania
Turkey
Greece
Croatia
The former Yugoslav Republic of ..
Azerbaijan
Latvia
Poland
Lithuania
Ukraine
Uzbekistan
Georgia
Montenegro
Republic of Moldova
Belarus
Albania
Turkmenistan
Bosnia and Herzegovina
Armenia
Tajikistan
Russian Federation
Kyrgyzstan
Kazakhstan 24.2
22.0
18.9
18.8
18.3
17.7
17.4
15.1
13.7
12.5
11.9
11.8
11.2
10.6
10.6
10.3
10.0
10.0
9.4
9.2
9.1
8.9
8.7
8.7
8.3
7.8
7.7
7.7
7.6
7.0
6.7
6.6
6.4
6.1
6.1
5.4
5.2
5.1
5.1
4.8
4.6
4.3
4.1
3.8
3.7
3.6
3.5
3.4
3.3
3.2
2.9
2.8
0.0
EURBahrain
United Arab Emirates
Egypt
Pakistan
Qatar
Afghanistan
Kuwait
Syrian Arab Republic
Iraq
Morocco
Yemen
Lebanon
Libya²
Sudan
Tunisia
Djibouti
Oman
Somalia
Jordan
Saudi Arabia
Iran (Islamic Republic of) 32.1
27.4
26.3
25.4
25.4
24.7
24.4
24.3
23.8
22.6
21.5
20.8
20.2
20.0
18.7
15.5
15.2
14.2
12.8
10.9
8.0
EMR
Micronesia (Federated States of)
Kiribati
Singapore
Japan
Palau
Australia
Marshall Islands
Fiji
New Zealand
Tonga
Brunei Darussalam
Philippines
Republic of Korea
Lao People's Democratic Republic
Samoa
Vanuatu
Papua New Guinea
Cambodia
China
Solomon Islands
Mongolia
Malaysia
Cook Islands
Viet Nam
Nauru
Niue
Tuvalu
24.5
24.2
24.0
21.0
19.2
18.8
17.4
16.8
16.6
15.8
14.3
12.0
10.5
8.0
7.6
6.0
5.8
5.7
5.4
4.8
4.7
3.6
2.9
1.9
WPR
The former Yugoslav Republic of Macedonia
34 WORLD HEALTH STATISTICS: 2018
Road traffic mortality rate (per 100 000 population), 20131
Data type: Comparable estimates
DEATHS FROM ROAD TRAFFIC INJURIESSDG Target 3.6By 2020, halve the number of global deaths and injuries from road traffic accidents
Indicator 3.6.1: Death rate due to road traffic injuries
Indicator 3.6.1 Deaths from road traffic injuries
1 Global status report on road safety 2015. Geneva: World Health Organization; 2015 (http://www.who.int/violence_injury_prevention/road_safety_status/2015/en/, accessed 30 March 2018). WHO Member States with a population of less than 90 000 in 2015 who did not participate in the survey used to produce the report were not included in the analysis.
2 Updated estimate.

Zimbabwe
Swaziland
South Africa²
Kenya
Algeria³
Lesotho
Namibia
Malawi
Rwanda
Zambia
Ethiopia
United Republic of Tanzania
Mozambique²
Sao Tome and Principe
Uganda
Madagascar
Senegal
Ghana
Mali
Niger
Burkina Faso
Mauritius
Cameroon
Burundi²
Congo
Guinea-Bissau
Sierra Leone
Liberia
Gabon
Togo
Côte d'Ivoire
Mauritania
Central African Republic³
Comoros
Nigeria³
Benin
Angola
Gambia
Guinea
Equatorial Guinea
Eritrea
Chad
Democratic Republic of the Congo
South Sudan³
Botswana
Cabo Verde
Seychelles
49.6
28.7
20.5
19.6
5.6
85.2
80.6
77.9
77.6
77.2
76.1
75.1
74.6
65.9
63.8
59.4
52.9
50.4
50.3
49.9
47.4
46.2
46.0
45.4
45.0
41.9
40.1
39.3
38.5
37.6
37.5
37.2
33.7
32.1
31.1
30.4
27.8
26.3
24.5
24.2
23.9
21.5
17.5
15.6
AFRNicaragua
Brazil
Costa Rica³
Cuba
Colombia
Dominican Republic²
Jamaica
Paraguay
El Salvador
Mexico
Ecuador
Honduras
Panama
Suriname³
Saint Lucia
Barbados³
Peru
Belize
Guatemala
Trinidad and Tobago
Guyana²
Haiti
Bolivia (Plurinational State of)
Antigua and Barbuda
Argentina
Bahamas
Canada
Chile
Dominica
Grenada
Saint Kitts and Nevis
Saint Vincent and the Grenadines
United States of America
Uruguay
Venezuela (Bolivarian Republic of)
89.3
89.1
82.9
73.2
58.2
42.8
89.8
88.4
86.5
84.1
82.6
81.9
80.9
80.7
76.0
75.9
72.4
70.0
66.1
65.9
65.6
52.5
44.0
AMR
Thailand
Bhutan³
Indonesia
Myanmar
Sri Lanka
Bangladesh
India
Nepal
Timor-Leste²
Maldives
Democratic People's Republic ofKorea
46.1
56.1
72.0
72.5
74.1
75.0
77.9
89.2
42.7
84.6
SEAR
Kazakhstan³
Turkmenistan
Belarus³
Ukraine
Kyrgyzstan
Republic of Moldova
Turkey
Tajikistan
Armenia
Montenegro³
Serbia³
The former Yugoslav Republic of ..
Bosnia and Herzegovina³
Albania
Andorra
Austria
Azerbaijan
Belgium
Bulgaria
Croatia
Cyprus
Czechia
Denmark
Estonia
Finland
France
Georgia
Germany
Greece
Hungary
Iceland
Ireland
Israel
Italy
Latvia
Lithuania
Luxembourg
Malta
Monaco
Netherlands
Norway
Poland
Portugal
Romania
Russian Federation
San Marino
Slovakia
Slovenia
Spain
Sweden
Switzerland
United Kingdom
Uzbekistan
79.6
22.3
12.9
75.6
74.2
68.0
62.1
60.4
59.7
50.8
40.2
34.1
25.1
21.9
EUREgypt
Morocco
Tunisia³
Qatar³
Iran (Islamic Republic of)
Iraq³
Jordan
Syrian Arab Republic
Pakistan
Yemen
Afghanistan
Oman
Sudan
Libya
Bahrain
Djibouti
Kuwait
Lebanon
Saudi Arabia
Somalia
United Arab Emirates
74.8
68.6
59.3
53.3
29.6
80.0
73.2
68.9
58.0
47.0
46.9
42.1
39.6
30.2
EMR
Marshall Islands
Viet Nam³
Mongolia³
Lao People's Democratic Republic
Cambodia
Philippines
Vanuatu
Tonga
Nauru
Tuvalu
Papua New Guinea
Samoa
Solomon Islands
Kiribati
Australia
Brunei Darussalam
China
Cook Islands
Fiji
Japan
Malaysia
Micronesia (Federated States of)
New Zealand
Niue
Palau
Republic of Korea
Singapore
80.5
42.5
41.0
40.6
35.8
69.7
68.3
61.3
56.4
51.5
50.7
47.9
39.4
38.0
WPR
2012 or later Pre-2012
The former Yugoslav Republic of Macedonia3
35MONITORING HEALTH FOR THE SDGs
Proportion of married or in-union women of reproductive age who have their need for family planning satisfied with modern methods (%), latest available data, 2007–20171
Data type: Primary data
FAMILY PLANNINGSDG Target 3.7By 2030, ensure universal access to sexual and reproductive health-care services, including for family planning, information and education, and the integration of reproductive health into national strategies and programmes
Indicator 3.7.1: Proportion of women of reproductive age (aged 15–49 years) who have their need for family planning satisfied with modern methods
Indicator 3.7.1 Family planning
1 Data pertaining to women aged 15-49 years who were married or in union, extracted by WHO from World Contraceptive Use 2018 [online database]. New York (NY): United Nations, Department of Economic and Social Affairs, Population Division; 2018 (http://www.un.org/en/development/desa/population/publications/dataset/contraception/wcu2018.shtml, accessed 2 May 2018).
2 Preliminary data.3 Deviation from standard question or measurement method. Please refer to World Contraceptive Use 2018 for more information.

Algeria
Mauritius
Botswana
Rwanda
Burundi
Ghana
Seychelles
Comoros
South Africa
Eritrea
Mauritania
Cabo Verde
Ethiopia
Senegal
Namibia
Togo
Swaziland
Gambia
Gabon
Sao Tome and Principe
Benin
Lesotho
Kenya
Liberia
Guinea-Bissau
Zimbabwe
Cameroon
Burkina Faso
Sierra Leone
Côte d'Ivoire
United Republic of Tanzania
Malawi
Democratic Republic of the Congo
Uganda
Zambia
Nigeria
Guinea
Niger
Congo
Madagascar
South Sudan
Angola
Mozambique
Mali
Equatorial Guinea
Chad
Central African Republic 229.0
176.0
167.0
158.1
147.0
146.0
129.0
104.8
88.0
85.0
80.0
76.0
70.0
37.5
9.0
179.0
174.0
163.0
152.0
146.0
145.0
141.0
141.0
138.0
136.0
132.0
125.0
122.0
119.0
110.0
106.0
96.0
94.0
94.0
92.0
91.0
87.0
82.0
80.0
80.0
77.0
71.0
65.8
59.0
58.0
45.0
24.1
AFRCanada
United States of America
Bahamas
Trinidad and Tobago
Chile
Dominican Republic
Jamaica
Haiti
Peru
Barbados
Cuba
Uruguay
Ecuador
Suriname
Brazil
Paraguay
Saint Vincent and the Grenadines
Argentina
Mexico
El Salvador
Bolivia (Plurinational State of)
Colombia
Belize
Guyana
Panama
Guatemala
Nicaragua
Honduras
Antigua and Barbuda
Costa Rica
Dominica
Grenada
Saint Kitts and Nevis
Saint Lucia
Venezuela (Bolivarian Republic of)
101.0
92.0
62.8
49.7
49.0
45.7
38.0
92.0
84.3
74.0
74.0
71.6
71.0
69.2
66.2
65.5
63.7
60.8
57.7
56.5
55.6
50.0
49.4
45.3
44.7
32.0
22.3
11.1
AMR
Democratic People's Republic ofKorea
Maldives
Sri Lanka
India
Bhutan
Myanmar
Indonesia
Thailand
Bangladesh
Nepal
Timor-Leste
12.9
28.1
28.4
36.0
40.1
51.0
78.0
88.0
20.3
0.7
SEAR
Switzerland
Netherlands
Denmark
Sweden
Slovenia
Norway
Cyprus
Italy
Luxembourg
Finland
Belgium
Austria
Spain
Germany
Greece
Iceland
Portugal
Ireland
France
Croatia
Israel
Bosnia and Herzegovina
Montenegro
Malta
Czechia
Poland
Estonia
Lithuania
United Kingdom
Serbia
Latvia
Albania
The former Yugoslav Republic of ..
Belarus
Hungary
Russian Federation
Armenia
Slovakia
Ukraine
Republic of Moldova
Turkey
Turkmenistan
Uzbekistan
Romania
Kazakhstan
Bulgaria
Georgia
Azerbaijan
Tajikistan
Andorra
Kyrgyzstan
Monaco
San Marino
54.0
29.5
20.1
52.8
47.9
39.4
36.0
35.3
28.0
26.9
26.7
26.1
24.3
24.3
24.0
22.8
20.4
18.9
18.0
16.4
14.4
14.1
12.5
12.3
11.6
11.4
11.1
10.7
9.7
9.6
9.2
8.6
8.2
8.0
8.0
7.8
7.7
7.6
6.6
6.2
5.6
5.1
4.9
4.6
4.5
4.4
3.4
3.2
2.6
EURTunisia
Kuwait
Qatar
Libya
Oman
Bahrain
Djibouti
Iran (Islamic Republic of)
Jordan
Morocco
United Arab Emirates
Pakistan
Syrian Arab Republic
Egypt
Yemen
Iraq
Afghanistan
Sudan
Lebanon
Saudi Arabia
Somalia
82.0
54.0
44.0
34.2
32.0
26.0
23.0
20.6
3.0
87.0
87.0
67.0
56.0
14.3
13.5
10.9
10.5
6.1
EMR
Republic of Korea
Singapore
Japan
China
Brunei Darussalam
Malaysia
Australia
New Zealand
Mongolia
Tonga
Viet Nam
Samoa
Solomon Islands
Kiribati
Cambodia
Philippines
Lao People's Democratic Republic
Vanuatu
Cook Islands
Fiji
Marshall Islands
Micronesia (Federated States of)
Nauru
Niue
Palau
Papua New Guinea
Tuvalu
78.0
49.9
42.0
39.2
30.0
75.6
57.0
57.0
30.1
26.7
16.0
11.9
11.5
11.4
9.2
4.1
2.7
1.3
WPR
2012 or later Pre-2012
The former Yugoslav Republic of Macedonia
36 WORLD HEALTH STATISTICS: 2018
Adolescent birth rate (per 1000 women aged 15–19 years), 2007–20161
Data type: Primary data
ADOLESCENT BIRTH RATESDG Target 3.7By 2030, ensure universal access to sexual and reproductive health-care services, including for family planning, information and education, and the integration of reproductive health into national strategies and programmes
Indicator 3.7.2: Adolescent birth rate (aged 10–14 years; aged 15–19 years) per 1000 women in that age group
Indicator 3.7.2 Adolescent birth rate
1 Data extracted by WHO from World Fertility Data 2017 [online database]. New York (NY): United Nations, Department of Economic and Social Affairs, Population Division; November 2017 (http://www.un.org/en/development/desa/population/publications/dataset/fertility/wfd2017.shtml).

Algeria
Seychelles
South Africa
Mauritius
Cabo Verde
Botswana
Namibia
Swaziland
Kenya
Zambia
Zimbabwe
Sao Tome and Principe
Rwanda
Gabon
Comoros
Gambia
Equatorial Guinea
Ghana
Lesotho
Cameroon
Côte d'Ivoire
Malawi
Uganda
Burundi
Mozambique
Togo
Benin
Senegal
Democratic Republic of the Congo
Burkina Faso
Ethiopia
Guinea-Bissau
Nigeria
United Republic of Tanzania
Congo
Eritrea
Angola
Sierra Leone
Guinea
Liberia
Central African Republic
Mauritania
Niger
Mali
Madagascar
South Sudan
Chad
76
68
67
64
62
60
59
58
57
56
55
54
53
52
47
46
45
45
45
44
44
44
44
43
42
42
41
41
40
39
39
39
39
39
38
38
36
36
35
34
33
33
33
32
30
30
29
AFRCanada
United States of America
Barbados
Uruguay
Cuba
Peru
Brazil
El Salvador
Argentina
Colombia
Mexico
Antigua and Barbuda
Costa Rica
Ecuador
Panama
Trinidad and Tobago
Dominican Republic
Venezuela (Bolivarian Republic of)
Bahamas
Grenada
Chile
Nicaragua
Paraguay
Saint Lucia
Guyana
Suriname
Saint Vincent and the Grenadines
Honduras
Belize
Bolivia (Plurinational State of)
Jamaica
Guatemala
Haiti
Dominica
Saint Kitts and Nevis
≥80
≥80
79
79
78
78
77
77
76
76
76
75
75
75
75
75
74
73
72
72
70
70
69
69
68
68
65
64
61
60
60
57
47
AMR
Thailand
Democratic People's Republic ofKorea
Sri Lanka
Myanmar
Bhutan
India
Maldives
Indonesia
Timor-Leste
Bangladesh
Nepal
46
46
47
49
55
56
59
60
62
68
75
SEAR
Austria
Belgium
Denmark
France
Iceland
Israel
Italy
Luxembourg
Netherlands
Norway
Portugal
Sweden
Switzerland
United Kingdom
Finland
Germany
Malta
Ireland
Slovenia
Spain
Estonia
Slovakia
Poland
Belarus
Cyprus
Czechia
Romania
Uzbekistan
Kazakhstan
Turkey
Greece
Hungary
The former Yugoslav Republic of ..
Croatia
Armenia
Lithuania
Turkmenistan
Georgia
Kyrgyzstan
Republic of Moldova
Serbia
Tajikistan
Azerbaijan
Bulgaria
Latvia
Russian Federation
Ukraine
Albania
Bosnia and Herzegovina
Montenegro
Andorra
Monaco
San Marino
≥80
≥80
≥80
≥80
≥80
≥80
≥80
≥80
≥80
≥80
≥80
≥80
≥80
≥80
79
79
79
78
78
77
76
76
75
74
73
73
72
72
71
71
70
70
70
69
67
67
67
66
66
65
65
65
64
64
64
63
63
62
57
54
EURKuwait
Qatar
Bahrain
Oman
Jordan
Egypt
Lebanon
Saudi Arabia
Iran (Islamic Republic of)
Morocco
Tunisia
Iraq
Libya
United Arab Emirates
Syrian Arab Republic
Djibouti
Sudan
Pakistan
Yemen
Afghanistan
Somalia
77
77
72
72
70
68
68
68
65
65
65
63
63
63
60
47
43
40
39
34
22
EMR
Australia
Brunei Darussalam
Japan
New Zealand
Republic of Korea
Singapore
China
Viet Nam
Malaysia
Fiji
Mongolia
Tonga
Micronesia (Federated States of)
Philippines
Samoa
Vanuatu
Cambodia
Solomon Islands
Lao People's Democratic Republic
Papua New Guinea
Kiribati
Cook Islands
Marshall Islands
Nauru
Niue
Palau
Tuvalu
≥80
≥80
≥80
≥80
≥80
≥80
76
73
70
66
63
62
60
58
56
56
55
50
48
41
40
WPR
The former Yugoslav Republic of Macedonia
37MONITORING HEALTH FOR THE SDGs
UNIVERSAL HEALTH COVERAGE: SERVICE COVERAGESDG Target 3.8Achieve universal health coverage, including financial risk protection, access to quality essential health-care services and access to safe, effective, quality and affordable essential medicines and vaccines for all
Indicator 3.8.1: Coverage of essential health services (defined as the average coverage of essential services based on tracer interventions that include reproductive, maternal, newborn and child health, infectious diseases, noncommunicable diseases and service capacity and access, among the general and the most disadvantaged population)
Universal health coverage: service coverage index, 20151
Data type: Comparable estimates
Indicator 3.8.1 Universal health coverage: service coverage
1 Tracking universal health coverage: 2017 global monitoring report. Geneva and Washington (DC): World Health Organization and the International Bank for Reconstruction and Development / The World Bank; 2017 (http://apps.who.int/iris/bitstream/handle/10665/259817/9789241513555-eng.pdf?sequence=1, accessed 30 March 2018). WHO Member States with a population of less than 90 000 in 2015 were not included in the analysis.

38 WORLD HEALTH STATISTICS: 2018
UNIVERSAL HEALTH COVERAGE: FINANCIAL PROTECTIONSDG Target 3.8Achieve universal health coverage, including financial risk protection, access to quality essential health-care services and access to safe, effective, quality and affordable essential medicines and vaccines for all
Indicator 3.8.2: Proportion of population with large household expenditures on health as a share of total household expenditure or income
Proportion of population (%) with total household expenditures on health > 10% and > 25% of total household expenditure or income, latest available data, 2007–20151
Data type: Primary data
United Kingdom
Kazakhstan
Czechia
Croatia
Denmark
Slovenia
Turkey
Luxembourg
Kyrgyzstan
Slovakia
Belarus
Russian Federation
The former Yugoslav Republic of ..
Spain
Finland
Ireland
Israel
Ukraine
Hungary
Bosnia and Herzegovina
Estonia
Montenegro
Serbia
Italy
Lithuania
Tajikistan
Belgium
Romania
Bulgaria
Poland
Greece
Malta
Armenia
Cyprus
Republic of Moldova
Albania
Portugal
Georgia
Andorra
Austria
Azerbaijan
France
Germany
Iceland
Latvia
Monaco
Netherlands
Norway
San Marino
Sweden
Switzerland
Turkmenistan
Uzbekistan
18.4
16.7
29.2
12.0
13.9
16.1
16.1
11.3
11.4
12.8
14.6
15.9
16.1
7.2
8.9
2.2
2.8
2.9
1.6
3.5
3.8
5.4
5.7
6.3
6.4
7.4
8.6
8.8
9.0
9.3
9.8
1.8
2.9
3.1
4.4
4.9
6.7
3.4
EURPakistan
Afghanistan
Iran (Islamic Republic of)
Tunisia
Egypt
Bahrain
Djibouti
Iraq
Jordan
Kuwait
Lebanon
Libya
Morocco
Oman
Qatar
Saudi Arabia
Somalia
Sudan
Syrian Arab Republic
United Arab Emirates
Yemen
15.8
26.2
16.7
1.0
4.8
EMRGuatemala
Panama
Canada
United States of America
Mexico
Peru
Costa Rica
Colombia
Dominican Republic
Brazil
Nicaragua
Antigua and Barbuda
Argentina
Bahamas
Barbados
Belize
Bolivia (Plurinational State of)
Chile
Cuba
Dominica
Ecuador
El Salvador
Grenada
Guyana
Haiti
Honduras
Jamaica
Paraguay
Saint Kitts and Nevis
Saint Lucia
Saint Vincent and the Grenadines
Suriname
Trinidad and Tobago
Uruguay
Venezuela (Bolivarian Republic of)
10.1
27.7
16.9
17.0
25.6
1.4
4.8
7.1
8.3
1.4
2.6
AMR
Sri Lanka
Thailand
Indonesia
Bangladesh
India
Nepal
Bhutan
Democratic People's Republic ofKorea
Maldives
Myanmar
Timor-Leste
13.6
17.3
27.4
3.6
2.9
3.4
SEAR
Zambia
Mozambique
South Africa
Malawi
Cabo Verde
Congo
Senegal
Burkina Faso
Niger
Rwanda
Guinea
Liberia
United Republic of Tanzania
Cameroon
Angola
Swaziland
Côte d'Ivoire
Nigeria
Algeria
Benin
Botswana
Burundi
Central African Republic
Chad
Comoros
Democratic Republic of the Congo
Equatorial Guinea
Eritrea
Ethiopia
Gabon
Gambia
Ghana
Guinea-Bissau
Kenya
Lesotho
Madagascar
Mali
Mauritania
Mauritius
Namibia
Sao Tome and Principe
Seychelles
Sierra Leone
South Sudan
Togo
Uganda
Zimbabwe
10.8
12.4
13.4
15.2
24.8
7.0
9.9
0.3
1.2
1.4
1.6
2.0
2.0
3.3
3.5
4.1
4.6
7.9
AFR
Mongolia
Lao People's Democratic Republic
Australia
Japan
Philippines
Viet Nam
Republic of Korea
China
Brunei Darussalam
Cambodia
Cook Islands
Fiji
Kiribati
Malaysia
Marshall Islands
Micronesia (Federated States of)
Nauru
New Zealand
Niue
Palau
Papua New Guinea
Samoa
Singapore
Solomon Islands
Tonga
Tuvalu
Vanuatu
13.5
17.7
2.4
6.3
9.8
3.0
3.7
6.2
WPR
The former Yugoslav Republic of Macedonia
Spending >10% 2012 or later
Spending >10% Pre-2012
Spending >25%
Indicator 3.8.2 Universal health coverage: financial protection
1 Tracking universal health coverage: 2017 global monitoring report. Geneva and Washington (DC): World Health Organization and the International Bank for Reconstruction and Development / The World Bank; 2017 (http://apps.who.int/iris/bitstream/handle/10665/259817/9789241513555-eng.pdf?sequence=1, accessed 30 March 2018).

Mauritius
Seychelles
Algeria
Gabon
Kenya
South Africa
Cabo Verde
Botswana
Mozambique
Malawi
Angola
Rwanda
Zambia
Congo
Zimbabwe
Swaziland
United Republic of Tanzania
Ethiopia
Namibia
Uganda
Madagascar
Senegal
Sao Tome and Principe
Democratic Republic of the Congo
South Sudan
Mauritania
Liberia
Comoros
Eritrea
Lesotho
Equatorial Guinea
Burundi
Ghana
Benin
Burkina Faso
Cameroon
Mali
Central African Republic
Guinea-Bissau
Gambia
Guinea
Togo
Niger
Côte d'Ivoire
Chad
Nigeria
Sierra Leone 324.1
307.4
280.1
269.1
251.8
249.6
243.3
237.0
214.7
211.9
209.1
208.1
206.2
205.0
203.8
179.9
177.7
177.6
173.7
172.4
170.2
169.5
165.1
163.9
162.4
160.7
159.6
155.7
145.0
144.4
139.0
137.0
133.0
130.7
127.2
121.4
118.5
115.0
110.0
101.3
99.5
86.7
78.1
76.0
49.7
49.3
38.3
AFRCanada
United States of America
Uruguay
Bahamas
Costa Rica
Ecuador
Chile
Jamaica
Panama
Argentina
Antigua and Barbuda
Brazil
Saint Lucia
Barbados
Venezuela (Bolivarian Republic of)
Mexico
Colombia
Trinidad and Tobago
El Salvador
Dominican Republic
Grenada
Saint Vincent and the Grenadines
Cuba
Nicaragua
Suriname
Paraguay
Honduras
Bolivia (Plurinational State of)
Peru
Belize
Guatemala
Guyana
Haiti
Dominica
Saint Kitts and Nevis
184.3
107.8
73.8
68.6
63.9
63.7
60.7
57.5
56.7
55.7
49.5
47.6
45.3
43.0
41.9
38.6
37.0
36.7
34.6
31.1
30.0
29.9
29.9
26.6
25.8
25.4
25.3
24.5
23.3
19.9
17.5
13.3
7.0
AMR
Maldives
Thailand
Sri Lanka
Indonesia
Bhutan
Timor-Leste
Bangladesh
Myanmar
India²
Nepal
Democratic People's Republic ofKorea
112.4
124.5
139.8
149.0
156.4
184.3
193.8
207.2
25.6
61.5
79.8
SEAR
Finland
Sweden
Norway
Iceland
France
Portugal²
Spain
Switzerland
Luxembourg
Ireland
Denmark
Netherlands
United Kingdom
Italy
Austria
Israel²
Belgium
Germany
Cyprus
Malta
Slovenia
Estonia
Greece
Czechia
Slovakia
Lithuania²
Croatia
Poland
Hungary
Latvia
Turkey²
Russian Federation
Armenia
Romania
Belarus
Bulgaria
Serbia
Kazakhstan
Azerbaijan
Albania
Ukraine
Republic of Moldova
Montenegro
Turkmenistan
Bosnia and Herzegovina
Uzbekistan
The former Yugoslav Republic of ..
Georgia
Kyrgyzstan
Tajikistan
Andorra
Monaco
San Marino
129.3
110.7
101.8
82.2
81.1
79.8
79.3
78.6
78.3
70.7
68.0
63.9
62.7
62.5
61.8
60.7
59.3
54.8
49.4
46.6
41.3
38.8
37.9
35.5
34.0
33.5
29.6
27.6
25.0
22.6
20.2
20.1
16.0
15.7
15.4
15.3
15.0
13.8
13.7
13.2
11.9
11.6
10.1
9.9
9.8
9.7
8.7
8.6
7.2
7.2
EURBahrain
Qatar
Morocco
Iran (Islamic Republic of)
Jordan
Lebanon
Oman
United Arab Emirates
Tunisia
Libya
Iraq
Syrian Arab Republic
Saudi Arabia
Kuwait
Egypt
Djibouti
Pakistan
Sudan
Yemen
Afghanistan
Somalia 212.8
211.1
194.2
184.9
173.6
159.0
108.9
103.8
83.7
75.2
75.1
71.9
56.1
54.7
53.9
51.4
51.2
50.9
49.1
47.4
40.1
EMR
New Zealand
Australia
Japan
Brunei Darussalam
Republic of Korea
Singapore
Malaysia
Viet Nam
Tonga
Samoa
Fiji
China
Vanuatu
Solomon Islands
Kiribati
Cambodia
Micronesia (Federated States of)
Papua New Guinea
Mongolia
Philippines
Lao People's Democratic Republic
Cook Islands
Marshall Islands
Nauru
Niue
Palau
Tuvalu
188.5
185.2
155.9
152.0
151.8
149.8
140.2
137.0
135.6
112.7
99.0
85.0
73.3
64.5
47.4
25.9
20.5
13.3
11.9
8.4
7.2
WPR
The former Yugoslav Republic of Macedonia
39MONITORING HEALTH FOR THE SDGs
Age-standardized mortality rate attributed to household and ambient air pollution (per 100 000 population), 20161
Data type: Comparable estimates
MORTALITY DUE TO AIR POLLUTIONSDG Target 3.9By 2030, substantially reduce the number of deaths and illnesses from hazardous chemicals and air, water and soil pollution and contamination
Indicator 3.9.1: Mortality rate attributed to household and ambient air pollution
Indicator 3.9.1 Mortality due to air pollution
1 Public health and environment [online database]. Global Health Observatory (GHO) data. Geneva: World Health Organization (http://www.who.int/gho/phe/en/). WHO Member States with a population of less than 90 000 in 2016 were not included in the analysis.
2 Under country consultation as of May 2018.

Seychelles
Mauritius
Algeria
Cabo Verde
Sao Tome and Principe
Botswana
South Africa
Namibia
Ghana
Rwanda
Gabon
Equatorial Guinea
Senegal
Zimbabwe
Mozambique
Swaziland
Malawi
Gambia
Madagascar
Uganda
Zambia
Guinea-Bissau
United Republic of Tanzania
Mauritania
Congo
Liberia
Togo
Ethiopia
Lesotho
Guinea
Cameroon
Eritrea
Côte d'Ivoire
Angola
Burkina Faso
Comoros
Kenya
Benin
Democratic Republic of the Congo
South Sudan
Burundi
Nigeria
Mali
Niger
Sierra Leone
Central African Republic
Chad 101.0
82.1
81.3
70.8
70.7
68.6
65.4
63.3
59.8
59.7
51.2
50.7
49.6
48.8
47.2
45.6
45.2
44.6
44.4
43.7
41.6
41.5
38.7
38.6
38.4
35.3
34.9
31.6
30.2
29.7
28.3
27.9
27.6
24.6
23.9
22.3
20.6
19.3
18.8
18.3
13.7
11.8
11.4
4.1
1.9
0.6
0.2
AFRBahamas
Antigua and Barbuda
Trinidad and Tobago
Barbados
Chile
United States of America
Grenada
Argentina
Canada
Uruguay
Ecuador
Jamaica
Saint Lucia
Colombia
Costa Rica
Belize
Brazil
Cuba
Mexico
Peru
Saint Vincent and the Grenadines
Venezuela (Bolivarian Republic of)
Paraguay
Panama
El Salvador
Suriname
Dominican Republic
Nicaragua
Guyana
Honduras
Bolivia (Plurinational State of)
Guatemala
Haiti
Dominica
Saint Kitts and Nevis
<0.1
23.8
6.3
5.6
3.6
3.6
2.2
2.2
2.0
2.0
1.9
1.5
1.4
1.3
1.3
1.1
1.0
1.0
1.0
0.9
0.8
0.6
0.6
0.6
0.4
0.4
0.4
0.3
0.2
0.2
0.2
0.1
0.1
AMR
Maldives
Sri Lanka
Democratic People's Republic ofKorea
Thailand
Bhutan
Indonesia
Timor-Leste
Bangladesh
Myanmar
India
Nepal
11.9
12.6
18.6
19.8
0.3
1.2
1.4
3.5
4.0
7.1
9.9
SEAR
Belarus
Bosnia and Herzegovina
Estonia
Finland
Greece
Ireland
Latvia
Lithuania
Luxembourg
Malta
Montenegro
Poland
Republic of Moldova
Slovakia
Slovenia
The former Yugoslav Republic of ..
Austria
Bulgaria
Croatia
Iceland
Italy
Russian Federation
Switzerland
Albania
Armenia
Czechia
Georgia
Hungary
Israel
Netherlands
Norway
Portugal
Spain
Sweden
United Kingdom
Belgium
Cyprus
Denmark
France
Turkey
Ukraine
Kazakhstan
Romania
Uzbekistan
Germany
Serbia
Kyrgyzstan
Azerbaijan
Tajikistan
Turkmenistan
Andorra
Monaco
San Marino
<0.1
<0.1
<0.1
<0.1
<0.1
<0.1
<0.1
<0.1
<0.1
<0.1
<0.1
<0.1
<0.1
<0.1
<0.1
<0.1
4.0
2.7
1.1
0.8
0.7
0.6
0.4
0.4
0.4
0.3
0.3
0.3
0.3
0.3
0.3
0.2
0.2
0.2
0.2
0.2
0.2
0.2
0.2
0.2
0.2
0.2
0.2
0.1
0.1
0.1
0.1
0.1
0.1
0.1
EURBahrain
Kuwait
Oman
Qatar
Saudi Arabia
United Arab Emirates
Jordan
Libya
Lebanon
Iran (Islamic Republic of)
Tunisia
Morocco
Egypt
Iraq
Syrian Arab Republic
Yemen
Afghanistan
Sudan
Pakistan
Djibouti
Somalia
<0.1
<0.1
<0.1
<0.1
<0.1
<0.1
86.6
31.3
19.6
17.3
13.9
10.2
3.7
3.0
2.0
1.9
1.0
1.0
0.8
0.6
0.6
EMR
Australia
Brunei Darussalam
Singapore
New Zealand
Japan
Malaysia
China
Mongolia
Tonga
Samoa
Viet Nam
Republic of Korea
Fiji
Micronesia (Federated States of)
Philippines
Solomon Islands
Cambodia
Vanuatu
Lao People's Democratic Republic
Papua New Guinea
Kiribati
Cook Islands
Marshall Islands
Nauru
Niue
Palau
Tuvalu
<0.1
<0.1
<0.1
16.7
16.3
11.3
10.4
6.5
6.2
4.2
3.6
2.9
1.8
1.6
1.5
1.4
1.3
0.6
0.4
0.2
0.1
WPR
The former Yugoslav Republic of Macedonia
40 WORLD HEALTH STATISTICS: 2018
Mortality rate attributed to exposure to unsafe WASH services (per 100 000 population), 20161
Data type: Comparable estimates
MORTALITY DUE TO UNSAFE WASH SERVICESSDG Target 3.9By 2030, substantially reduce the number of deaths and illnesses from hazardous chemicals and air, water and soil pollution and contamination
Indicator 3.9.2: Mortality rate attributed to unsafe water, unsafe sanitation and lack of hygiene (exposure to unsafe Water, Sanitation and Hygiene for All (WASH) services)
Indicator 3.9.2 Mortality due to unsafe WASH services
1 Public health and environment [online database]. Global Health Observatory (GHO) data. Geneva: World Health Organization (http://www.who.int/gho/phe/en/). WHO Member States with a population of less than 90 000 in 2016 were not included in the analysis.

Mauritius
Cabo Verde
Seychelles
Algeria
Gabon
Sao Tome and Principe
Botswana
Congo
South Africa
Namibia
Ghana
Kenya
Liberia
Equatorial Guinea
Gambia
Mauritania
Malawi
Guinea-Bissau
Zimbabwe
Senegal
Comoros
Rwanda
Togo
Angola
United Republic of Tanzania
Ethiopia
Mozambique
Zambia
Burkina Faso
Guinea
Nigeria
Cameroon
Lesotho
Central African Republic
Democratic Republic of the Congo
Uganda
Madagascar
Mali
Swaziland
Benin
Chad
Côte d'Ivoire
South Sudan
Sierra Leone
Eritrea
Niger
Burundi 5.2
4.2
4.2
4.1
4.0
3.9
3.6
3.5
3.3
3.3
3.3
3.2
3.2
3.2
3.1
3.1
3.0
3.0
3.0
2.9
2.9
2.9
2.7
2.7
2.4
2.4
2.4
2.3
2.2
2.2
2.0
1.9
1.9
1.9
1.8
1.8
1.7
1.5
1.2
1.2
1.1
0.9
0.9
0.8
0.6
0.5
0.1
AFRBahamas
Barbados
Brazil
Chile
El Salvador
Jamaica
Saint Lucia
Saint Vincent and the Grenadines
Trinidad and Tobago
Canada
Costa Rica
Cuba
Paraguay
Venezuela (Bolivarian Republic of)
Antigua and Barbuda
Colombia
Dominican Republic
Grenada
Honduras
Mexico
Panama
Suriname
Uruguay
Belize
Argentina
Ecuador
Nicaragua
Guyana
Peru
United States of America
Guatemala
Bolivia (Plurinational State of)
Haiti
Dominica
Saint Kitts and Nevis
2.6
2.0
1.1
0.9
0.9
0.7
0.6
0.6
0.6
0.5
0.4
0.4
0.4
0.4
0.4
0.4
0.4
0.4
0.4
0.3
0.3
0.3
0.3
0.3
0.2
0.2
0.2
0.2
0.2
0.2
0.2
0.2
0.1
AMR
Maldives
Bangladesh
Indonesia
Nepal
Sri Lanka
Thailand
Timor-Leste
Bhutan
Myanmar
Democratic People's Republic ofKorea
India
0.0
0.3
0.4
0.4
0.4
0.4
0.4
0.6
1.4
1.9
2.4
SEAR
Cyprus
Denmark
Israel
Luxembourg
Malta
Netherlands
Switzerland
Austria
Belgium
Croatia
Finland
Germany
Greece
Iceland
Ireland
Norway
Poland
Spain
United Kingdom
Czechia
Hungary
Italy
Portugal
Serbia
Slovenia
Turkey
Albania
Romania
Slovakia
Sweden
The former Yugoslav Republic of ..
Bosnia and Herzegovina
Estonia
France
Montenegro
Armenia
Azerbaijan
Bulgaria
Kyrgyzstan
Lithuania
Turkmenistan
Georgia
Latvia
Uzbekistan
Republic of Moldova
Tajikistan
Russian Federation
Kazakhstan
Ukraine
Belarus
Andorra
Monaco
San Marino
2.6
2.5
2.3
1.7
1.2
1.2
1.0
0.8
0.8
0.7
0.7
0.6
0.6
0.6
0.6
0.5
0.5
0.5
0.5
0.4
0.4
0.4
0.4
0.4
0.3
0.3
0.3
0.3
0.3
0.3
0.3
0.2
0.2
0.2
0.2
0.2
0.2
0.2
0.2
0.2
0.2
0.2
0.2
0.1
0.1
0.1
0.1
0.1
0.1
0.1
EURBahrain
Egypt
Kuwait
Lebanon
United Arab Emirates
Oman
Qatar
Syrian Arab Republic
Iraq
Tunisia
Jordan
Libya
Morocco
Saudi Arabia
Afghanistan
Iran (Islamic Republic of)
Pakistan
Djibouti
Yemen
Sudan
Somalia 4.6
3.9
3.8
2.4
2.3
1.2
1.2
0.7
0.6
0.6
0.6
0.5
0.5
0.4
0.4
0.4
0.3
0.3
0.2
0.2
0.2
EMR
Singapore
Australia
New Zealand
Philippines
Brunei Darussalam
Fiji
Japan
Malaysia
Republic of Korea
Samoa
Cambodia
Lao People's Democratic Republic
Solomon Islands
Vanuatu
Viet Nam
Micronesia (Federated States of)
Tonga
China
Mongolia
Papua New Guinea
Kiribati
Cook Islands
Marshall Islands
Nauru
Niue
Palau
Tuvalu
2.6
1.7
1.6
1.4
1.3
1.0
0.9
0.9
0.9
0.9
0.6
0.5
0.5
0.5
0.4
0.4
0.3
0.2
0.2
0.2
0.1
WPR
The former Yugoslav Republic of Macedonia
41MONITORING HEALTH FOR THE SDGs
Mortality rate attributed to unintentional poisoning (per 100 000 population), 20161
Data type: Comparable estimates
MORTALITY DUE TO UNINTENTIONAL POISONINGSDG Target 3.9By 2030, substantially reduce the number of deaths and illnesses from hazardous chemicals and air, water and soil pollution and contamination
Indicator 3.9.3: Mortality rate attributed to unintentional poisoning
Indicator 3.9.3 Mortality due to unintentional poisoning
1 Global Health Estimates 2016: Deaths by cause, age, sex, by country and by region, 2000–2016. Geneva: World Health Organization; 2018. WHO Member States with a population of less than 90 000 in 2016 were not included in the analysis.

Female Male
South Sudan
Sao Tome and Principe
Mauritania
Madagascar
Guinea-Bissau
Guinea
Gabon
Equatorial Guinea
Côte d'Ivoire
Chad
Central African Republic
Cameroon
Burundi
Angola
Lesotho
Congo
Sierra Leone
Mauritius
Seychelles
Botswana
Namibia
South Africa
Gambia
Zimbabwe
Algeria
Mozambique
United Republic of Tanzania
Malawi
Zambia
Burkina Faso
Comoros
Mali
Rwanda
Kenya
Liberia
Uganda
Senegal
Cabo Verde
Swaziland
Niger
Togo
Benin
Eritrea
Nigeria
Ethiopia
Ghana
Democratic Republicof the Congo
53.9
52.3
41.3
40.7
35.7
34.4
34.2
33.2
31.2
30.7
30.4
29.1
AFR
Venezuela (Bolivarian Republic of)
Trinidad and Tobago
Saint Vincent and the Grenadines
Saint Lucia
Peru
Nicaragua
Honduras
Guyana
Guatemala
Grenada
Dominica
Belize
Antigua and Barbuda
Bolivia (Plurinational State of)
Cuba
Suriname
Chile
Jamaica
Argentina
United States of America
Haiti
Paraguay
Mexico
Bahamas
Uruguay
Dominican Republic
El Salvador
Brazil
Costa Rica
Canada
Saint Kitts and Nevis
Barbados
Colombia
Ecuador
Panama
67.3
53.3
42.9
41.5
28.6
27.7
34.2
AMR
Bhutan
Timor-Leste
Indonesia
Maldives
Bangladesh
Thailand
Nepal
Myanmar
Sri Lanka
India
Democratic People's Republicof Korea
78.1
76.1
55.0
44.7
38.8
37.8
35.2
SEAR
Turkmenistan
Tajikistan
San Marino
Monaco
Russian Federation
Georgia
Cyprus
Armenia
Greece
Albania
Latvia
Kyrgyzstan
Montenegro
Bosnia and Herzegovina
Ukraine
Belarus
Republic of Moldova
Bulgaria
Kazakhstan
Azerbaijan
Turkey
Serbia
Croatia
Estonia
Czechia
Lithuania
Andorra
Slovakia
Romania
France
Israel
Hungary
Germany
Poland
Spain
Belgium
Austria
Malta
Portugal
Switzerland
Italy
Netherlands
Luxembourg
Ireland
Slovenia
United Kingdom
Uzbekistan
Finland
Norway
Sweden
Denmark
Iceland
The former Yugoslav Republicof Macedonia
58.3
55.5
52.7
52.1
52.0
51.2
51.0
50.5
47.9
47.7
47.4
46.1
44.6
44.4
43.1
42.5
41.1
40.2
39.9
39.3
38.3
38.0
37.8
37.7
37.1
35.6
35.4
34.8
33.1
33.1
31.4
31.4
30.9
30.2
30.0
28.9
27.8
27.3
35.3
44.0
30.2
30.1
37.7
34.3
30.5
29.0
30.1
28.2
27.4
28.4
EUR
Tuvalu
Solomon Islands
Micronesia (Federated States of)
Marshall Islands
Kiribati
Lao People's Democratic Republic
Papua New Guinea
China
Mongolia
Viet Nam
Tonga
Malaysia
Republic of Korea
Philippines
Samoa
Nauru
Fiji
Vanuatu
Japan
Cambodia
Brunei Darussalam
Cook Islands
Singapore
Palau
Niue
New Zealand
Australia
58.9
51.2
48.8
48.4
46.5
45.9
44.4
42.4
40.9
40.8
38.1
36.9
34.8
34.5
33.7
33.7
30.9
29.8
28.3
35.9
43.0
WPRSyrian Arab Republic
Sudan
Somalia
Libya
Jordan
Afghanistan
Tunisia
Egypt
Morocco
Lebanon
Iraq
Bahrain
United Arab Emirates
Kuwait
Pakistan
Yemen
Qatar
Saudi Arabia
Djibouti
Iran (Islamic Republic of)
Oman
65.8
50.1
47.1
40.7
39.3
37.6
37.4
37.0
36.7
29.2
EMR
42 WORLD HEALTH STATISTICS: 2018
Age-standardized prevalence of tobacco smoking among persons 15 years and older, by sex, 20161
Data type: Comparable estimates
TOBACCO USESDG Target 3.aStrengthen the implementation of the WHO Framework Convention on Tobacco Control in all countries, as appropriate
Indicator 3.a.1: Age-standardized prevalence of current tobacco use among persons aged 15 years and older
Indicator 3.a.1 Tobacco use
1 WHO global report on trends in prevalence of tobacco smoking, 2nd edition. Geneva: World Health Organization; 2018 (upcoming). Within each WHO region, countries are sorted in order of ascending prevalence among males.

Seychelles
Algeria
Cabo Verde
Mauritius
Rwanda
Swaziland
Eritrea
Lesotho
Gambia
Sao Tome and Principe
Ghana
Senegal
Botswana
Burundi
United Republic of Tanzania
South Africa
Zimbabwe
Malawi
Zambia
Mozambique
Burkina Faso
Sierra Leone
Niger
Kenya
Angola
Benin
Cameroon
Central African Republic
Chad
Comoros
Congo
Côte d'Ivoire
Democratic Republic of the Congo
Equatorial Guinea
Ethiopia
Gabon
Guinea
Guinea-Bissau
Liberia
Madagascar
Mali
Mauritania
Namibia
Nigeria
South Sudan
Togo
Uganda
99
96
95
92
90
89
85
82
79
76
75
75
74
72
71
70
63
61
58
51
50
50
37
32
26
AFRCuba
Saint Vincent and the Grenadines
Mexico
Saint Kitts and Nevis
Belize
Guyana
Dominica
Panama
Paraguay
Uruguay
Argentina
Saint Lucia
Antigua and Barbuda
Barbados
Chile
Colombia
Costa Rica
El Salvador
Canada
Grenada
Jamaica
Ecuador
Bahamas
Brazil
Peru
Guatemala
Trinidad and Tobago
Venezuela (Bolivarian Republic of)
Suriname
Haiti
Bolivia (Plurinational State of)
Dominican Republic
Honduras
Nicaragua
United States of America
99
99
98
97
96
94
92
92
92
92
88
88
87
87
87
87
87
87
86
85
85
76
74
72
66
65
65
53
44
26
AMR
Maldives
Sri Lanka
Democratic People's Republic ofKorea
Thailand
Bangladesh
Bhutan
Myanmar
India
Indonesia
Nepal
Timor-Leste 22
25
56
76
86
90
93
95
98
99
99
SEAR
Hungary
Kazakhstan
Turkmenistan
Uzbekistan
Albania
Azerbaijan
Belarus
Kyrgyzstan
Armenia
Israel
Russian Federation
Slovakia
Tajikistan
Croatia
Iceland
Portugal
Republic of Moldova
Spain
Sweden
Poland
Czechia
Germany
Slovenia
The former Yugoslav Republic of ..
Estonia
Lithuania
Netherlands
Norway
Andorra
Serbia
Austria
Latvia
Switzerland
United Kingdom
Bulgaria
Cyprus
Luxembourg
Malta
Montenegro
Belgium
Denmark
Finland
Georgia
Turkey
Greece
Italy
France
Bosnia and Herzegovina
Romania
San Marino
Ukraine
Ireland
Monaco
99
99
99
99
98
98
98
98
97
97
97
97
97
96
95
95
95
95
95
94
93
93
93
93
92
92
91
91
90
90
89
89
89
89
88
88
86
86
86
85
85
85
85
85
83
83
79
78
76
36
31
EURBahrain
Jordan
Morocco
Oman
United Arab Emirates
Iran (Islamic Republic of)
Tunisia
Egypt
Kuwait
Libya
Saudi Arabia
Qatar
Djibouti
Lebanon
Sudan
Iraq
Pakistan
Syrian Arab Republic
Yemen
Afghanistan
Somalia
99
99
99
99
99
98
97
96
96
96
96
92
82
75
69
64
53
52
49
39
EMR
China
Malaysia
Niue
Brunei Darussalam
Republic of Korea
Nauru
Palau
Viet Nam
Australia
Fiji
Japan
Tuvalu
Cook Islands
Mongolia
New Zealand
Singapore
Tonga
Kiribati
Micronesia (Federated States of)
Philippines
Cambodia
Marshall Islands
Samoa
Lao People's Democratic Republic
Papua New Guinea
Solomon Islands
Vanuatu
99
99
99
97
97
96
95
95
94
94
93
92
90
90
89
88
85
79
74
66
58
49
44
WPRThe former Yugoslav Republic of Macedonia
43MONITORING HEALTH FOR THE SDGs
VACCINE COVERAGESDG Target 3.bSupport the research and development of vaccines and medicines for the communicable and noncommunicable diseases that primarily affect developing countries, provide access to affordable essential medicines and vaccines, in accordance with the Doha Declaration on the TRIPS Agreement and Public Health, which affirms the right of developing countries to use to the full the provisions in the Agreement on Trade-Related Aspects of Intellectual Property Rights regarding flexibilities to protect public health, and, in particular, provide access to medicines for all
Indicator 3.b.1: Proportion of the target population covered by all vaccines included in their national programme
Measles-containing vaccine second-dose (MCV2) immunization coverage by the nationally recommended age (%), 20161
Data type: Comparable estimates
Indicator 3.b.1 Vaccine coverage
1 The SDG indicator includes immunization coverage with diphtheria-tetanus-pertussis-containing vaccine third-dose (DTP3), MCV2, pneumococcal conjugate vaccine third-dose (PcV3) and human papillomavirus (HPV) vaccine. See Annex B for more data. Source: WHO/UNICEF estimates of national immunization coverage [online database]. July 2017 revision (http://www.who.int/immunization/monitoring_surveillance/routine/coverage/en/index4.html, accessed 30 March 2018).

Seychelles
Sao Tome and Principe
Liberia
Swaziland
Gambia
Malawi
Sierra Leone
Guinea-Bissau
Zambia
Central African Republic
Burundi
Burkina Faso
Guinea
Comoros
Mozambique
Mali
Rwanda
Lesotho
Uganda
Senegal
Democratic Republic of the Congo
South Sudan
Ghana
Zimbabwe
Togo
United Republic of Tanzania
Benin
Côte d'Ivoire
Chad
Madagascar
Namibia
Ethiopia
Niger
Kenya
Nigeria
Mauritania
Eritrea
Botswana
Gabon
Cameroon
Congo
Angola
South Africa
Equatorial Guinea
Cabo Verde
Mauritius
Algeria
34.17
24.88
14.27
13.21
12.72
12.64
11.30
11.23
10.75
10.62
9.57
9.15
8.26
8.21
8.10
7.55
6.65
6.61
6.31
5.36
5.27
5.02
4.94
4.94
4.82
4.66
4.39
4.23
4.16
4.08
3.97
3.53
3.48
3.36
2.87
2.53
2.44
2.36
2.25
2.22
1.65
1.57
1.55
1.29
0.92
0.28
0.02
AFRHaiti
Belize
Saint Lucia
Nicaragua
Honduras
Guyana
Bolivia (Plurinational State of)
Guatemala
Suriname
Paraguay
El Salvador
Ecuador
Peru
Panama
Saint Vincent and the Grenadines
Dominican Republic
Cuba
Colombia
Jamaica
Brazil
Argentina
Costa Rica
Mexico
Venezuela (Bolivarian Republic of)
Dominica
Grenada
8.73
8.41
6.33
3.58
2.92
2.85
1.69
1.28
1.09
0.89
0.77
0.50
0.48
0.46
0.36
0.24
0.11
0.07
0.04
0.03
0.01
0.01
0.01
0.00
AMR
Timor-Leste
Myanmar
Bhutan
Nepal
Maldives
Bangladesh
Sri Lanka
Democratic People's Republic ofKorea
Indonesia
Thailand
India
12.12
0.28
0.37
0.51
0.90
0.98
1.25
1.29
2.47
2.57
2.78
SEAR
Bosnia and Herzegovina
Armenia
Republic of Moldova
Tajikistan
Kyrgyzstan
Georgia
Montenegro
Uzbekistan
Turkmenistan
Ukraine
Albania
Belarus
The former Yugoslav Republic of ..
Azerbaijan
Kazakhstan
Turkey
Serbia
Andorra
Austria
Belgium
Bulgaria
Croatia
Cyprus
Czechia
Denmark
Estonia
Finland
France
Germany
Greece
Hungary
Iceland
Ireland
Israel
Italy
Latvia
Lithuania
Luxembourg
Malta
Monaco
Netherlands
Norway
Poland
Portugal
Romania
Russian Federation
San Marino
Slovakia
Slovenia
Spain
Sweden
Switzerland
United Kingdom
9.93
5.03
3.48
3.07
2.91
2.23
1.84
1.79
1.77
1.46
0.63
0.60
0.56
0.39
0.36
0.36
0.10
EURDjibouti
Lebanon
Afghanistan
Somalia
Sudan
Jordan
Yemen
Morocco
Pakistan
Syrian Arab Republic
Egypt
Tunisia
Iraq
Libya
Iran (Islamic Republic of)
Bahrain
Kuwait
Oman
Qatar
Saudi Arabia
United Arab Emirates
11.73
5.84
5.82
3.52
3.34
2.78
2.44
1.92
1.63
0.71
0.20
0.19
0.13
0.07
0.03
EMR
Tuvalu
Tonga
Nauru
Solomon Islands
Samoa
Kiribati
Vanuatu
Fiji
Mongolia
Niue
Cook Islands
Micronesia (Federated States of)
Lao People's Democratic Republic
Cambodia
Papua New Guinea
Palau
Marshall Islands
Viet Nam
Philippines
China
Malaysia
Australia
Brunei Darussalam
Japan
New Zealand
Republic of Korea
Singapore
60.03
45.41
43.29
26.32
22.31
9.95
7.20
7.00
6.47
6.01
5.02
3.65
3.33
3.01
2.92
2.72
2.67
0.84
0.73
0.11
0.05
WPR
Income High Upper middle Lower middle Low Not applicable
The former Yugoslav Republic of Macedonia
Country income classification
44 WORLD HEALTH STATISTICS: 2018
DEVELOPMENT ASSISTANCE FOR HEALTHSDG Target 3.bSupport the research and development of vaccines and medicines for the communicable and noncommunicable diseases that primarily affect developing countries, provide access to affordable essential medicines and vaccines, in accordance with the Doha Declaration on the TRIPS Agreement and Public Health, which affirms the right of developing countries to use to the full the provisions in the Agreement on Trade-Related Aspects of Intellectual Property Rights regarding flexibilities to protect public health, and, in particular, provide access to medicines for all
Indicator 3.b.2: Total net official development assistance to the medical research and basic health sectors
Total net official development assistance to medical research and basic health sectors per capita (US$), by recipient country, 20161
Data type: Primary data
Indicator 3.b.2 Development assistance for health
1 Organisation for Economic Co-operation and Development. OECD.Stat [online database]. Paris: Organisation for Economic Co-operation and Development (http://stats.oecd.org/, accessed 19 January 2018). Income classification is based on the July 2017 World Bank list of economies (https://datahelpdesk.worldbank.org/knowledgebase/articles/906519-world-bank-country-and-lending-groups, accessed 19 January 2018).

Nursing and midwifery personnel Physicians2012 or later Pre-2012 2012 or later Pre-2012
Burundi
Comoros
Equatorial Guinea
Eritrea
Lesotho
Sao Tome and Principe
South Sudan
Malawi
Niger
United Republic of Tanzania
Liberia
Sierra Leone
Ethiopia
Chad
Central African Republic
Burkina Faso
Mozambique
Togo
Rwanda
Senegal
Guinea
Zimbabwe
Guinea-Bissau
Cameroon
Mali
Zambia
Uganda
Ghana
Gambia
Congo
Mauritania
Madagascar
Côte d'Ivoire
Angola
Swaziland
Benin
Kenya
Namibia
Nigeria
Botswana
Gabon
Cabo Verde
South Africa
Seychelles
Algeria
Mauritius
Democratic Republicof the Congo
AFR
Antigua and Barbuda
Barbados
Dominica
Grenada
Haiti
Honduras
Saint Kitts and Nevis
Saint Vincent and the Grenadines
Suriname
Venezuela (Bolivarian Republic of)
Saint Lucia
Guyana
Jamaica
Bolivia (Plurinational State of)
Belize
Guatemala
Nicaragua
Chile
Peru
Costa Rica
Paraguay
Dominican Republic
Panama
Ecuador
Colombia
Trinidad and Tobago
Brazil
El Salvador
Mexico
Bahamas
Canada
United States of America
Argentina
Uruguay
Cuba 7.5
7.4
9.8
8.0
AMR
Timor-Leste
Indonesia
Bhutan
Thailand
Bangladesh
Myanmar
Nepal
India
Sri Lanka
MaldivesDemocratic People's Republic
of Korea
8.2
SEAR
Albania
Tajikistan
Turkey
Kyrgyzstan
Bosnia and Herzegovina
Poland
Turkmenistan
Montenegro
Uzbekistan
Serbia
Cyprus
Romania
Armenia
Slovenia
United Kingdom
Luxembourg
Ireland
Ukraine
Belgium
Hungary
Croatia
Finland
Republic of Moldova
Latvia
France
Kazakhstan
Azerbaijan
Estonia
Slovakia
Netherlands
Israel
Denmark
Czechia
Andorra
Iceland
Spain
Malta
Russian Federation
Bulgaria
Italy
Belarus
Sweden
Germany
Switzerland
Lithuania
Norway
Portugal
Georgia
Austria
Greece
San Marino
Monaco
The former Yugoslav Republicof Macedonia
12.5
8.8
8.4
12.3
12.4
11.1
15.0
10.6
8.5
10.5
17.0
8.4
15.2
9.1
8.7
11.4
11.9
13.8
18.2
8.1
17.8
8.3
9.1
20.5
EUR
Philippines
Papua New Guinea
Cambodia
Vanuatu
Solomon Islands
Micronesia (Federated States of)
Kiribati
Samoa
Marshall Islands
Lao People's Democratic Republic
Tonga
Viet Nam
Fiji
Palau
Cook Islands
Tuvalu
Nauru
Malaysia
Brunei Darussalam
China
Niue
Singapore
Republic of Korea
Japan
New Zealand
Mongolia
Australia
9.8
11.2
11.1
12.6
WPRSomalia
Djibouti
Afghanistan
Yemen
Sudan
Morocco
Egypt
Iraq
Bahrain
Pakistan
Tunisia
Iran (Islamic Republic of)
Syrian Arab Republic
United Arab Emirates
Oman
Qatar
Libya
Lebanon
Saudi Arabia
Kuwait
Jordan
EMR
45MONITORING HEALTH FOR THE SDGs
Density of physicians and of nursing and midwifery personnel (per 1000 population), latest available data, 2007–20161
Data type: Primary data
HEALTH WORKERSSDG Target 3.cSubstantially increase health financing and the recruitment, development, training and retention of the health workforce in developing countries, especially in least-developed countries and small-island developing States
Indicator 3.c.1: Health worker density and distribution
Indicator 3.c.1 Health workers
1 Latest available data for more cadres are presented in Annex B. Source: WHO Global Health Workforce Statistics [online database]. Global Health Observatory (GHO) data. Geneva: World Health Organization (http://who.int/hrh/statistics/hwfstats/en/). Country comparisons are affected by differences in the occupations included in the cadre. Please refer to the source for country-specific definitions and other descriptive metadata. Within each WHO region, countries are sorted in order of descending physician density.

46 WORLD HEALTH STATISTICS: 2018
International Health Regulations implementation: average of 13 core capacity scores, latest available data, 2010–20171
Data type : Other data
IHR CAPACITY AND HEALTH EMERGENCY PREPAREDNESSSDG Target 3.dStrengthen the capacity of all countries, in particular developing countries, for early warning, risk reduction and management of national and global health risks
Indicator 3.d.1: International Health Regulations (IHR) capacity and health emergency preparedness
Indicator 3.d.1 IHR capacity and health emergency preparedness
South Africa
Côte d'Ivoire
Seychelles
Ethiopia
Namibia
Liberia
Algeria
Angola
Swaziland
Ghana
Niger
Zimbabwe
Mauritius
Sierra Leone
Mozambique
United Republic of Tanzania
Rwanda
Cabo Verde
Democratic Republic of the Congo
Togo
Zambia
Lesotho
Guinea
Kenya
Uganda
Cameroon
Malawi
Guinea-Bissau
Gabon
Nigeria
Eritrea
Burkina Faso
Chad
Senegal
Madagascar
Botswana
Mali
Comoros
South Sudan
Mauritania
Congo
Benin
Central African Republic
Equatorial Guinea
Gambia
Burundi
Sao Tome and Principe
91
87
87
79
79
76
75
75
75
74
74
72
71
70
69
69
66
65
65
64
64
62
59
58
58
57
56
53
52
51
49
45
44
44
43
42
40
37
34
32
31
30
27
27
27
25
16
AFRCanada
United States of America
Cuba
Brazil
Mexico
Venezuela (Bolivarian Republic of)
El Salvador
Barbados
Nicaragua
Guyana
Colombia
Costa Rica
Uruguay
Chile
Jamaica²
Ecuador
Bahamas
Paraguay
Saint Lucia
Bolivia (Plurinational State of)
Panama
Suriname
Trinidad and Tobago
Antigua and Barbuda
Argentina
Honduras
Grenada
Peru
Saint Vincent and the Grenadines
Dominica
Haiti
Belize
Dominican Republic
Guatemala
Saint Kitts and Nevis
100
100
99
96
94
94
93
92
91
89
88
87
87
84
83
81
78
77
77
76
76
72
72
71
70
70
66
66
65
62
61
55
55
55
52
AMR
Indonesia
Thailand
India
Bangladesh
Sri Lanka
Bhutan
Timor-Leste
Democratic People's Republic ofKorea
Maldives
Myanmar
Nepal 22
62
63
67
72
73
76
78
95
97
99
SEAR
Norway
Russian Federation
Germany
Cyprus
Finland
Armenia
Netherlands
Slovakia
Spain
Czechia
Sweden
Portugal
Switzerland
Belarus
Denmark
Italy
Latvia
The former Yugoslav Republic of ..
France
Tajikistan
United Kingdom
Luxembourg
Turkey
Azerbaijan
Turkmenistan
Belgium
Uzbekistan
Hungary
Monaco
Republic of Moldova
Malta
Ireland
Kazakhstan
Lithuania
Slovenia
Greece
Romania
Georgia
Poland
Iceland
Croatia
Israel
Estonia
Bulgaria
Austria
San Marino
Bosnia and Herzegovina
Montenegro
Kyrgyzstan
Ukraine
Albania
Serbia
Andorra
76
50
99
99
97
96
96
95
95
95
95
94
93
91
91
90
90
90
90
90
89
89
89
88
88
84
84
83
83
82
81
81
79
78
78
77
77
76
74
74
72
71
71
70
69
68
61
58
56
49
46
44
29
EURSaudi Arabia
United Arab Emirates
Egypt
Morocco
Bahrain
Oman
Iraq
Kuwait
Lebanon
Iran (Islamic Republic of)
Qatar
Jordan
Sudan
Libya
Syrian Arab Republic
Tunisia
Pakistan
Yemen
Afghanistan
Djibouti
Somalia
99
97
96
95
93
90
89
85
80
76
76
72
67
64
64
57
51
48
42
33
29
EMR
Australia
China
Japan
Malaysia
Singapore
Fiji
New Zealand
Republic of Korea
Viet Nam
Palau
Mongolia
Micronesia (Federated States of)
Cambodia
Philippines
Lao People's Democratic Republic²
Samoa
Tonga
Brunei Darussalam
Papua New Guinea
Niue
Kiribati
Marshall Islands
Solomon Islands
Tuvalu
Cook Islands
Nauru
Vanuatu
100
100
100
100
99
98
98
98
95
91
87
86
81
81
75
75
74
67
64
61
60
57
57
54
43
42
35
WPR
2012 or later Pre-2012
The former Yugoslav Republic of Macedonia
1 International Health Regulations (2005) Monitoring Framework [online database]. Global Health Observatory (GHO) data. Geneva: World Health Organization (http://www.who.int/gho/ihr/en/).2 Data refer to year 2016. Data for 2017 were submitted in a format that could not be included in the analysis.

Madagascar
Swaziland
South Africa
Namibia
Burundi
Cabo Verde
Malawi
Algeria
Sao Tome and Principe
Gambia
Seychelles
Mauritius
Guinea-Bissau
Lesotho
Botswana
Zimbabwe
Sierra Leone
United Republic of Tanzania
Burkina Faso
Ghana
Gabon
Zambia
Chad
Kenya
Rwanda
Ethiopia
Togo
Uganda
Mauritania
Nigeria
Côte d'Ivoire
Democratic Republic of the Congo
Niger
Mali
Senegal
Central African Republic
Comoros
Angola
Benin
Cameroon
Congo
Guinea
Liberia
Eritrea
South Sudan
Equatorial Guinea
Mozambique
15.6
14.9
14.1
12.9
11.8
10.8
10.8
10.7
10.7
10.6
10.0
9.9
9.5
9.3
8.8
8.1
7.9
7.4
7.2
7.1
7.0
6.8
6.3
6.3
6.2
6.0
5.7
5.6
5.5
5.3
5.0
5.0
4.6
4.5
4.2
4.1
3.8
3.7
3.4
3.1
3.1
2.7
2.7
1.8
1.6
1.3
1.2
AFRUnited States of America
Uruguay
Chile
Canada
El Salvador
Costa Rica
Nicaragua
Antigua and Barbuda
Guatemala
Peru
Bahamas
Jamaica
Argentina
Colombia
Honduras
Mexico
Panama
Belize
Ecuador
Paraguay
Dominica
Suriname
Saint Vincent and the Grenadines
Bolivia (Plurinational State of)
Dominican Republic
Saint Lucia
Trinidad and Tobago
Guyana
Brazil
Barbados
Grenada
Saint Kitts and Nevis
Haiti
Venezuela (Bolivarian Republic of)
Cuba
22.6
20.0
19.6
19.1
19.1
18.8
17.4
14.9
14.9
14.4
14.2
12.6
12.3
12.2
11.3
11.3
11.3
11.1
11.0
10.8
10.6
10.5
10.0
9.8
9.5
8.5
8.5
7.8
7.7
7.4
7.4
6.5
3.3
3.1
AMR
Maldives
Thailand
Bhutan
Sri Lanka
Indonesia
Nepal
Myanmar
Timor-Leste
India
Bangladesh
Democratic People's Republic ofKorea
16.6
22.8
2.8
3.4
4.2
4.9
5.5
7.4
7.9
9.1
SEAR
Switzerland
Germany
Netherlands
Andorra
United Kingdom
Ireland
Sweden
Norway
Iceland
Belgium
Denmark
France
Austria
Bosnia and Herzegovina
Spain
Czechia
San Marino
Malta
Italy
Finland
Slovenia
Portugal
Serbia
Estonia
Lithuania
Republic of Moldova
Luxembourg
The former Yugoslav Republic of ..
Slovakia
Croatia
Kazakhstan
Romania
Poland
Georgia
Bulgaria
Turkey
Kyrgyzstan
Hungary
Russian Federation
Albania
Uzbekistan
Greece
Latvia
Montenegro
Turkmenistan
Belarus
Ukraine
Monaco
Cyprus
Armenia
Tajikistan
Azerbaijan
Israel
25.2
21.4
19.0
18.5
18.5
18.4
18.4
17.5
16.4
16.0
15.8
15.3
15.1
14.9
14.9
14.3
14.3
14.2
13.4
12.8
12.7
12.3
12.3
12.2
12.2
12.2
12.1
12.1
12.0
11.7
10.9
10.8
10.7
10.5
10.3
10.1
9.9
9.7
9.6
9.5
9.3
9.1
8.9
8.8
8.7
8.5
8.3
8.1
7.1
6.1
6.1
4.1
EURIran (Islamic Republic of)
Sudan
Lebanon
Tunisia
Jordan
Saudi Arabia
Bahrain
United Arab Emirates
Morocco
Oman
Qatar
Kuwait
Egypt
Djibouti
Pakistan
Yemen
Afghanistan
Iraq
Libya
Somalia
Syrian Arab Republic
22.6
18.1
14.3
13.6
12.4
10.1
9.5
8.0
7.7
6.7
6.3
6.2
4.2
4.1
3.7
2.2
2.0
1.7
EMR
Marshall Islands
Palau
Republic of Korea
Tuvalu
Singapore
Vanuatu
Samoa
Solomon Islands
China
Papua New Guinea
Tonga
Malaysia
Viet Nam
Philippines
Fiji
Brunei Darussalam
Kiribati
Cambodia
Micronesia (Federated States of)
Mongolia
Nauru
Cook Islands
Lao People's Democratic Republic
Niue
Australia
Japan
New Zealand
21.2
13.1
12.9
12.1
12.0
11.8
11.5
10.6
10.1
8.7
8.4
8.3
7.9
7.4
7.2
6.4
6.3
6.1
6.1
6.0
5.2
5.1
3.8
2.2
WPR
The former Yugoslav Republic of Macedonia
47MONITORING HEALTH FOR THE SDGs
Domestic general government health expenditure (GGHE-D) as a percentage of general government expenditure (GGE) (%), 20151
Data type: Comparable estimate
GOVERNMENT SPENDING ON ESSENTIAL SERVICES, INCLUDING HEALTHSDG Target 1.aEnsure significant mobilization of resources from a variety of sources, including through enhanced development cooperation, in order to provide adequate and predictable means for developing countries, in particular least-developed countries, to implement programmes and policies to end poverty in all its dimensions
Indicator 1.a.2: Proportion of total government spending on essential services (education, health and social protection)
Indicator 1.a.2 Government spending on essential services, including health
1 This indicator is presented here as it could constitute the health-related portion of the SDG indicator. Source: Global Health Expenditure Database [online database]. Geneva: World Health Organization (http://apps.who.int/nha/database/Select/Indicators/en, accessed 7 April 2018).

Seychelles²
Algeria
Senegal
Sao Tome and Principe
Gabon
Ghana
Congo
Côte d'Ivoire
Namibia
Gambia
Swaziland
Kenya
Equatorial Guinea
Zimbabwe
Burkina Faso
South Africa
Togo
Guinea-Bissau
Mauritania
Uganda
Mali
South Sudan
Botswana
Cameroon
Comoros
Liberia
Guinea
Lesotho
Benin
United Republic of Tanzania
Rwanda
Malawi
Angola
Sierra Leone
Ethiopia
Chad
Zambia
Central African Republic
Niger
Democratic Republic of the Congo
Mozambique
Nigeria
Madagascar
Eritrea
Burundi
Cabo Verde
Mauritius
50.3
49.2
43.1
40.7
31.4
31.1
26.2
55.9
43.6
42.6
42.2
40.0
39.9
38.4
37.9
37.6
37.1
36.7
34.4
34.0
33.2
32.4
32.1
32.1
31.7
30.4
28.9
27.9
27.6
27.5
27.4
27.3
26.8
26.0
25.5
25.0
23.1
21.6
21.2
18.8
17.5
17.2
17.0
11.7
7.9
AFRChile
United States of America
Saint Lucia
Costa Rica
Paraguay
Jamaica
Brazil
Dominican Republic
Barbados
Suriname
Uruguay²
Trinidad and Tobago
Guyana
Mexico
Colombia
Peru
Venezuela (Bolivarian Republic of)²
El Salvador
Belize
Bolivia (Plurinational State of)
Nicaragua
Panama
Haiti
Honduras
Ecuador
Guatemala
Antigua and Barbuda
Argentina
Bahamas
Canada
Cuba
Dominica
Grenada
Saint Kitts and Nevis
Saint Vincent and the Grenadines
19.1
13.4
12.7
11.0
10.7
8.8
7.1
5.6
46.5
23.9
22.7
21.9
17.3
16.1
15.0
13.6
13.1
12.4
12.0
7.7
7.1
6.2
5.6
2.5
2.1
1.8
AMR
Thailand
Sri Lanka
Maldives
Democratic People's Republic ofKorea
Myanmar
Bhutan
Nepal
Bangladesh
Indonesia
India
Timor-Leste
10.5
17.3
27.9
29.2
35.8
36.1
36.4
38.4
50.2
20.3
33.6
SEAR
The former Yugoslav Republic of ..
Serbia
Republic of Moldova
Kazakhstan
Bosnia and Herzegovina
Armenia
Montenegro
Turkey
Georgia
Turkmenistan
Kyrgyzstan
Azerbaijan
Albania
Tajikistan
Andorra
Austria
Belarus
Belgium
Bulgaria
Croatia
Cyprus
Czechia
Denmark
Estonia
Finland
France
Germany
Greece
Hungary
Iceland
Ireland
Israel
Italy
Latvia
Lithuania
Luxembourg
Malta
Monaco
Netherlands
Norway
Poland
Portugal
Romania
Russian Federation
San Marino
Slovakia
Slovenia
Spain
Sweden
Switzerland
Ukraine
United Kingdom
Uzbekistan
23.1
11.3
4.9
26.8
18.0
12.9
11.5
9.5
9.4
9.4
8.9
8.0
6.4
6.0
EURKuwait
Iran (Islamic Republic of)
Jordan
Tunisia
Oman
Morocco
Libya
Egypt
Iraq
Somalia
Syrian Arab Republic
Djibouti
Sudan
Afghanistan
Pakistan
Yemen
Bahrain
Lebanon
Qatar
Saudi Arabia
United Arab Emirates
27.5
25.3
22.6
21.0
14.9
6.8
46.5
45.0
40.9
38.2
33.5
22.3
14.1
10.1
7.8
4.9
EMR
Australia²
Republic of Korea²
Samoa
Japan
China²
Tonga
Tuvalu
Mongolia
Brunei Darussalam
Malaysia
Nauru
Viet Nam
Vanuatu
Solomon Islands
Cambodia
Philippines
Lao People's Democratic Republic
Papua New Guinea
Cook Islands
Fiji
Kiribati
Marshall Islands
Micronesia (Federated States of)
New Zealand
Niue
Palau
Singapore
49.5
24.0
19.7
10.0
7.1
2.5
2.0
43.8
33.4
32.4
31.6
28.5
24.6
20.7
10.8
8.1
8.1
4.7
WPR
2012 or later Pre-2012
The former Yugoslav Republic of Macedonia
48 WORLD HEALTH STATISTICS: 2018
Prevalence of stunting among children under 5 years of age (%), latest available data, 2007–20161
Data type: Primary data
STUNTING AMONG CHILDRENSDG Target 2.2By 2030, end all forms of malnutrition, including achieving, by 2025, the internationally agreed targets on stunting and wasting in children under 5 years of age, and address the nutritional needs of adolescent girls, pregnant and lactating women and older persons
Indicator 2.2.1: Prevalence of stunting (height for age <-2 standard deviation from the median of the World Health Organization (WHO) Child Growth Standards) among children under 5 years of age
Indicator 2.2.1 Stunting among children
1 Levels and trends in child malnutrition. UNICEF/WHO/World Bank Group Joint Child Malnutrition Estimates. New York (NY), Geneva and Washington (DC): United Nations Children’s Fund, World Health Organization and the World Bank Group; 2018.
2 See Annex B for additional information on this value.

Wasting Overweight2012 or later Pre-2012 2012 or later Pre-2012
Mauritius
Madagascar
Cabo Verde
South Africa
Algeria
Botswana
Comoros
Seychelles²
Equatorial Guinea
Swaziland
Sierra Leone
Mozambique
Gabon
Rwanda
Lesotho
Cameroon
Zambia
South Sudan
Congo
Zimbabwe
Malawi
Namibia
Kenya
Guinea
Uganda
United Republic of Tanzania
Angola
Gambia
Liberia
Niger
Ethiopia
Ghana
Chad
Sao Tome and Principe
Guinea-Bissau
Togo
Eritrea
Mali
Central African Republic
Benin
Nigeria
Côte d'Ivoire
Burundi
Mauritania
Burkina Faso
Senegal
Democratic Republicof the Congo
13.3
12.4
11.2
10.9
10.2
9.7
9.0
8.9
11.2
9.7
11.1
9.4
22.7
8.2
8.1
8.1
11.1
10.3
9.9
13.0
15.3
13.5
10.8
14.8
AFR
Saint Vincent and the Grenadines
Saint Kitts and Nevis
Grenada
Dominica
Cuba
Canada
Bahamas
Argentina
Antigua and Barbuda
Panama
Paraguay
Barbados
Trinidad and Tobago
Bolivia (Plurinational State of)
Chile
Jamaica
Nicaragua
Costa Rica
Ecuador
Dominican Republic
Belize
Brazil
Uruguay²
Peru
Venezuela (Bolivarian Republic of)²
El Salvador
Saint Lucia
United States of America
Guyana
Honduras
Mexico
Colombia
Guatemala
Suriname
Haiti
12.4
12.2
11.5
10.1
9.3
8.5
8.3
8.1
11.5
8.1
AMR
Indonesia
Thailand
Bhutan
Maldives
India
Sri Lanka
Timor-Leste
Bangladesh
Myanmar
Nepal
Democratic People's Republicof Korea
11.5
8.2
13.5
10.2
21.0
15.1
11.0
14.3
9.7
SEAR
Uzbekistan
United Kingdom
Ukraine
Switzerland
Sweden
Spain
Slovenia
Slovakia
San Marino
Russian Federation
Romania
Portugal
Poland
Norway
Netherlands
Monaco
Malta
Luxembourg
Lithuania
Latvia
Italy
Israel
Ireland
Iceland
Hungary
Greece
Germany
France
Finland
Estonia
Denmark
Czechia
Cyprus
Croatia
Bulgaria
Belgium
Belarus
Austria
Andorra
Albania
Montenegro
Georgia
Bosnia and Herzegovina
Serbia
Armenia
Azerbaijan
Turkey
Kazakhstan
Kyrgyzstan
Tajikistan
Turkmenistan
Republic of Moldova
The former Yugoslav Republicof Macedonia
23.4
22.3
19.9
17.4
13.9
13.6
13.0
12.4
10.9
9.3
23.4
19.9
12.4
9.4
9.9
EUR
Singapore
Palau
Niue
New Zealand
Micronesia (Federated States of)
Marshall Islands
Kiribati
Fiji
Cook Islands
Tonga
Papua New Guinea
Mongolia
Brunei Darussalam
Australia²
Republic of Korea²
China²
Tuvalu
Malaysia
Samoa
Viet Nam
Vanuatu
Solomon Islands
Philippines
Nauru
Cambodia
Lao People's Democratic Republic
Japan
17.3
13.8
10.5
8.3
13.8
8.3
14.3
11.5
9.6
WPRUnited Arab Emirates
Saudi Arabia
Qatar
Lebanon
Bahrain
Iran (Islamic Republic of)
Libya
Syrian Arab Republic
Egypt
Tunisia
Iraq
Morocco
Djibouti
Kuwait²
Afghanistan
Pakistan
Jordan
Oman
Sudan
Somalia
Yemen
22.4
17.9
15.7
14.3
11.8
10.7
8.1
22.4
17.9
11.8
10.7
11.5
9.5
21.5
9.5
10.5
16.3
15.0
16.3
EMR
49MONITORING HEALTH FOR THE SDGs
Prevalence of wasting and of overweight in children under 5 years of age (%), latest available data, 2007–20161
Data type: Primary data
WASTING AND OVERWEIGHT AMONG CHILDRENSDG Target 2.2By 2030, end all forms of malnutrition, including achieving, by 2025, the internationally agreed targets on stunting and wasting in children under 5 years of age, and address the nutritional needs of adolescent girls, pregnant and lactating women and older persons
Indicator 2.2.2: Prevalence of malnutrition (weight for height >+2 or <-2 standard deviation from the median of the WHO Child Growth Standards) among children under 5 years of age, by type (wasting and overweight)
Indicator 2.2.2 Wasting and overweight among children
1 Levels and trends in child malnutrition. UNICEF/WHO/World Bank Group Joint Child Malnutrition Estimates. New York (NY), Geneva and Washington (DC): United Nations Children’s Fund, World Health Organization and the World Bank Group; 2018. Within each WHO region, countries are sorted in order of ascending overweight prevalence.
2 See Annex B for additional information on this value.

Côte d'Ivoire
Congo
Ghana
Nigeria
Ethiopia
Uganda
Algeria
Angola
Benin
Botswana
Burkina Faso
Burundi
Cabo Verde
Cameroon
Central African Republic
Chad
Comoros
Democratic Republic of the Congo
Equatorial Guinea
Eritrea
Gabon
Gambia
Guinea
Guinea-Bissau
Kenya
Lesotho
Liberia
Madagascar
Malawi
Mali
Mauritania
Mauritius
Mozambique
Namibia
Niger
Rwanda
Sao Tome and Principe
Senegal
Seychelles
Sierra Leone
South Africa
South Sudan
Swaziland
Togo
United Republic of Tanzania
Zambia
Zimbabwe
46
37
27
19
11
6
AFRUnited States of America
Chile
Costa Rica
Ecuador
Colombia
Guatemala
Nicaragua
Peru
Mexico
Antigua and Barbuda
Argentina
Bahamas
Barbados
Belize
Bolivia (Plurinational State of)
Brazil
Canada
Cuba
Dominica
Dominican Republic
El Salvador
Grenada
Guyana
Haiti
Honduras
Jamaica
Panama
Paraguay
Saint Kitts and Nevis
Saint Lucia
Saint Vincent and the Grenadines
Suriname
Trinidad and Tobago
Uruguay
Venezuela (Bolivarian Republic of)
99
98
90
74
71
61
59
50
43
AMR
Bangladesh
Bhutan
Nepal
Democratic People's Republic ofKorea
India
Indonesia
Maldives
Myanmar
Sri Lanka
Thailand
Timor-Leste
27
34
56
SEAR
Cyprus
Malta
Monaco
Netherlands
San Marino
Austria
Germany
Greece
Ireland
Israel
Belgium
Czechia
Iceland
Luxembourg
Slovenia
Spain
Sweden
Bulgaria
Denmark
Finland
United Kingdom
Norway
Portugal
Switzerland
Belarus
Italy
Poland
France
Slovakia
Lithuania
Ukraine
Croatia
Montenegro
Bosnia and Herzegovina
Serbia
Turkmenistan
The former Yugoslav Republic of ..
Estonia
Hungary
Latvia
Romania
Russian Federation
Georgia
Azerbaijan
Republic of Moldova
Albania
Kyrgyzstan
Armenia
Tajikistan
Andorra
Kazakhstan
Turkey
Uzbekistan
100
100
100
100
100
99
99
99
99
99
98
98
98
98
98
98
98
97
97
97
96
95
95
95
94
94
94
93
93
92
92
90
90
89
88
86
83
82
82
82
82
76
73
72
70
69
66
61
47
EURKuwait
Bahrain
Jordan
Tunisia
Iran (Islamic Republic of)
Oman
Morocco
Lebanon
Pakistan
Afghanistan
Djibouti
Egypt
Iraq
Libya
Qatar
Saudi Arabia
Somalia
Sudan
Syrian Arab Republic
United Arab Emirates
Yemen
100
99
93
93
91
88
69
48
36
EMR
New Zealand
Singapore
Republic of Korea
Japan
Niue
Malaysia
Cambodia
Australia
Brunei Darussalam
China
Cook Islands
Fiji
Kiribati
Lao People's Democratic Republic
Marshall Islands
Micronesia (Federated States of)
Mongolia
Nauru
Palau
Papua New Guinea
Philippines
Samoa
Solomon Islands
Tonga
Tuvalu
Vanuatu
Viet Nam
100
100
98
97
97
92
24
WPR
The former Yugoslav Republic of Macedonia
50 WORLD HEALTH STATISTICS: 2018
Proportion of population using safely managed drinking-water services (%), 20151
Data type: Comparable estimates
SAFELY MANAGED DRINKING-WATER SERVICESSDG Target 6.1By 2030, achieve universal and equitable access to safe and affordable drinking water for all
Indicator 6.1.1: Proportion of population using safely managed drinking-water services
Indicator 6.1.1 Safely managed drinking-water services
1 Progress on drinking water, sanitation and hygiene – 2017 update and SDG baselines. Geneva and New York (NY): World Health Organization and United Nations Children’s Fund; 2017 (https://washdata.org/sites/default/files/documents/reports/2018-01/JMP-2017-report-final.pdf, accessed 31 March 2018) and Water and sanitation [online database]. Global Health Observatory (GHO) data. Geneva: World Health Organization (http://www.who.int/gho/mdg/environmental_sustainability/en/). Comparable estimates are only shown for countries with recent primary data.

Senegal
Algeria
Niger
Angola
Benin
Botswana
Burkina Faso
Burundi
Cabo Verde
Cameroon
Central African Republic
Chad
Comoros
Congo
Côte d'Ivoire
Democratic Republic of the Congo
Equatorial Guinea
Eritrea
Ethiopia
Gabon
Gambia
Ghana
Guinea
Guinea-Bissau
Kenya
Lesotho
Liberia
Madagascar
Malawi
Mali
Mauritania
Mauritius
Mozambique
Namibia
Nigeria
Rwanda
Sao Tome and Principe
Seychelles
Sierra Leone
South Africa
South Sudan
Swaziland
Togo
Uganda
United Republic of Tanzania
Zambia
Zimbabwe
24
19
9
AFRUnited States of America
Chile
Canada
Uruguay
Mexico
Ecuador
Brazil
Cuba
Peru
Argentina
Colombia
Bolivia (Plurinational State of)
Venezuela (Bolivarian Republic of)
Antigua and Barbuda
Bahamas
Barbados
Belize
Costa Rica
Dominica
Dominican Republic
El Salvador
Grenada
Guatemala
Guyana
Haiti
Honduras
Jamaica
Nicaragua
Panama
Paraguay
Saint Kitts and Nevis
Saint Lucia
Saint Vincent and the Grenadines
Suriname
Trinidad and Tobago
89
85
77
64
45
42
39
31
30
26
20
19
19
AMR
Bangladesh
Bhutan
Democratic People's Republic ofKorea
India
Indonesia
Maldives
Myanmar
Nepal
Sri Lanka
Thailand
Timor-Leste
SEAR
Andorra
Monaco
Switzerland
United Kingdom
Austria
Belgium
Netherlands
Spain
Germany
Italy
Luxembourg
Denmark
Estonia
Israel
Malta
Finland
France
Sweden
Czechia
Slovakia
Latvia
Norway
San Marino
Poland
Belarus
Cyprus
Hungary
Slovenia
Greece
Bulgaria
Ireland
Iceland
Albania
Portugal
Lithuania
Croatia
Romania
Turkey
Serbia
Bosnia and Herzegovina
Armenia
Azerbaijan
Georgia
Kazakhstan
Kyrgyzstan
Montenegro
Republic of Moldova
Russian Federation
Tajikistan
The former Yugoslav Republic of ..
Turkmenistan
Ukraine
Uzbekistan
100
100
99
98
97
97
97
97
95
95
94
93
93
93
93
92
92
92
91
82
78
78
78
77
76
76
76
76
75
74
70
69
65
62
61
60
57
44
24
23
EURKuwait
Bahrain
United Arab Emirates
Qatar
Saudi Arabia
Jordan
Tunisia
Egypt
Morocco
Iraq
Libya
Lebanon
Somalia
Afghanistan
Djibouti
Iran (Islamic Republic of)
Oman
Pakistan
Sudan
Syrian Arab Republic
Yemen
100
93
93
88
84
77
73
61
38
32
26
20
14
EMR
Japan
Singapore
Republic of Korea
Malaysia
New Zealand
Australia
China
Palau
Tuvalu
Brunei Darussalam
Cambodia
Cook Islands
Fiji
Kiribati
Lao People's Democratic Republic
Marshall Islands
Micronesia (Federated States of)
Mongolia
Nauru
Niue
Papua New Guinea
Philippines
Samoa
Solomon Islands
Tonga
Vanuatu
Viet Nam
100
100
98
82
76
74
60
20
9
WPR
The former Yugoslav Republic of Macedonia
51MONITORING HEALTH FOR THE SDGs
Proportion of population using safely managed sanitation services (%), 20151
Data type: Comparable estimates
SAFELY MANAGED SANITATION SERVICESSDG Target 6.2By 2030, achieve access to adequate and equitable sanitation and hygiene for all and end open defecation, paying special attention to the needs of women and girls and those in vulnerable situations
Indicator 6.2.1: Proportion of population using safely managed sanitation services, including a hand-washing facility with soap and water
Indicator 6.2.1 Safely managed sanitation services
1 Progress on drinking water, sanitation and hygiene – 2017 update and SDG baselines. Geneva and New York (NY): World Health Organization and United Nations Children’s Fund; 2017 (https://washdata.org/sites/default/files/documents/reports/2018-01/JMP-2017-report-final.pdf, accessed 31 March 2018) and Water and sanitation [online database]. Global Health Observatory (GHO) data. Geneva: World Health Organization (http://www.who.int/gho/mdg/environmental_sustainability/en/). Comparable estimates are only shown for countries with recent primary data.

Algeria
Mauritius
Seychelles
South Africa
Gabon
Cabo Verde
Botswana
Swaziland
Angola
Mauritania
Namibia
Lesotho
Equatorial Guinea
Senegal
Zimbabwe
Congo
Cameroon
Ghana
Côte d'Ivoire
Sao Tome and Principe
Eritrea
Zambia
Kenya
Burkina Faso
Comoros
Togo
Benin
Burundi
Central African Republic
Chad
Democratic Republic of the Congo
Ethiopia
Gambia
Guinea
Guinea-Bissau
Liberia
Madagascar
Malawi
Mali
Mozambique
Niger
Nigeria
Rwanda
Sierra Leone
South Sudan
Uganda
United Republic of Tanzania <5
<5
<5
<5
<5
<5
<5
<5
<5
<5
<5
<5
<5
<5
<5
<5
<5
<5
<5
<5
93
93
90
85
79
71
64
50
48
47
42
36
34
32
29
24
23
22
18
17
16
16
13
9
9
7
6
AFRAntigua and Barbuda
Argentina
Bahamas²
Barbados
Brazil
Canada²
Ecuador
Grenada
Saint Kitts and Nevis²
Saint Lucia
Saint Vincent and the Grenadines
Trinidad and Tobago
United States of America²
Uruguay
Venezuela (Bolivarian Republic of)
Costa Rica
Chile
Colombia
Dominica
Dominican Republic
Jamaica
Suriname
Panama
El Salvador
Belize
Mexico
Bolivia (Plurinational State of)
Cuba
Peru
Guyana
Paraguay
Honduras
Nicaragua
Guatemala
Haiti
>95
>95
>95
>95
>95
>95
>95
>95
>95
>95
>95
>95
>95
>95
>95
<5
93
92
92
91
90
90
90
89
86
85
85
80
79
75
74
66
53
52
45
AMR
Maldives
Thailand
Indonesia
Bhutan
India³
Nepal
Sri Lanka
Bangladesh
Myanmar
Democratic People's Republic ofKorea
Timor-Leste
11
18
18
26
28
41
52
58
74
94
7
SEAR
Andorra²
Armenia
Austria²
Azerbaijan
Belarus
Belgium²
Cyprus²
Czechia
Denmark²
Finland²
France²
Germany²
Hungary²
Iceland²
Ireland²
Israel² ³
Italy²
Kazakhstan
Latvia
Lithuania² ³
Luxembourg²
Malta²
Monaco²
Netherlands²
Norway²
Poland²
Portugal² ³
Russian Federation
San Marino²
Slovakia
Slovenia
Spain²
Sweden²
Switzerland²
Turkmenistan
Ukraine
United Kingdom²
Greece
Croatia
Estonia
Republic of Moldova
Uzbekistan
Bulgaria
Romania
Kyrgyzstan
Tajikistan
Georgia
Albania
Serbia
Montenegro
The former Yugoslav Republic of ..
Bosnia and Herzegovina
Turkey
>95
>95
>95
>95
>95
>95
>95
>95
>95
>95
>95
>95
>95
>95
>95
>95
>95
>95
>95
>95
>95
>95
>95
>95
>95
>95
>95
>95
>95
>95
>95
>95
>95
>95
>95
>95
>95
94
93
93
92
92
89
86
81
80
78
77
76
69
66
63
EURBahrain²
Egypt
Iran (Islamic Republic of)
Iraq
Jordan
Kuwait²
Morocco
Oman
Qatar
Saudi Arabia
Syrian Arab Republic
Tunisia
United Arab Emirates
Yemen
Pakistan
Sudan
Afghanistan
Djibouti
Somalia
Lebanon
Libya
>95
>95
>95
>95
>95
>95
>95
>95
>95
>95
>95
>95
>95
<5
65
43
41
32
12
EMR
Australia²
Brunei Darussalam²
Japan²
Malaysia
New Zealand²
Republic of Korea
Singapore²
Niue
Nauru
Palau
Cook Islands
Viet Nam
Marshall Islands
China
Tonga
Tuvalu
Mongolia
Philippines
Fiji
Samoa
Cambodia
Papua New Guinea
Vanuatu
Micronesia (Federated States of)
Solomon Islands
Kiribati
Lao People's Democratic Republic
>95
>95
>95
>95
>95
>95
>95
93
91
87
84
67
65
59
59
50
43
43
40
32
18
13
13
12
8
6
6
WPR
The former Yugoslav Republic of Macedonia
Israel 2,3
Portugal 2,3
Lithuania 2,3
52 WORLD HEALTH STATISTICS: 2018
Proportion of population with primary reliance on clean fuels (%), 20161
Data type: Comparable estimates
CLEAN HOUSEHOLD ENERGYSDG Target 7.1By 2030, ensure universal access to affordable, reliable and modern energy services
Indicator 7.1.2: Proportion of population with primary reliance on clean fuels and technology
Indicator 7.1.2 Clean household energy
1 Public health and environment [online database]. Global Health Observatory (GHO) data. Geneva: World Health Organization (http://www.who.int/gho/phe/en/).2 For high-income countries with no information on clean fuel use, usage is assumed to be > 95%.3 Under country consultation as of May 2018.

Mauritius
Swaziland
Liberia
Mozambique
Comoros
Seychelles
Zimbabwe
Sierra Leone
Botswana
Namibia
Malawi
Guinea
Madagascar
Zambia
Côte d'Ivoire
South Africa
United Republic of Tanzania
Sao Tome and Principe
Kenya
Guinea-Bissau
Lesotho
Angola
Mali
Benin
Ghana
Togo
Cabo Verde
Gambia
Ethiopia
Algeria
Burundi
Burkina Faso
Congo
Democratic Republic of the Congo
Gabon
Senegal
Rwanda
South Sudan
Eritrea
Mauritania
Nigeria
Uganda
Equatorial Guinea
Chad
Central African Republic
Cameroon
Niger 73.0
65.4
51.2
50.8
49.1
48.7
46.3
41.7
41.1
40.9
40.7
39.7
37.8
37.4
36.4
36.3
35.6
34.5
34.0
32.3
31.6
31.2
31.1
30.4
29.0
28.4
28.1
26.5
25.8
25.2
25.1
24.3
23.9
23.8
22.5
22.2
21.9
21.0
20.9
20.6
19.1
18.6
18.6
18.4
17.0
16.2
13.5
AFRCanada
United States of America
Uruguay
Argentina
Paraguay
Brazil
Panama
Saint Kitts and Nevis
Dominican Republic
Jamaica
Haiti
Ecuador
Costa Rica
Venezuela (Bolivarian Republic of)
Colombia
Antigua and Barbuda
Dominica
Bahamas
Nicaragua
Belize
Mexico
Saint Lucia
Saint Vincent and the Grenadines
Honduras
Cuba
Guyana
Grenada
Barbados
Trinidad and Tobago
Chile
Bolivia (Plurinational State of)
El Salvador
Guatemala
Suriname
Peru 29.0
25.8
24.2
23.8
23.3
23.1
22.4
22.4
21.8
21.6
21.6
21.5
21.4
21.2
20.9
20.9
19.0
19.0
18.8
18.0
17.2
16.8
16.7
15.5
14.7
13.6
13.3
12.3
12.0
11.8
11.7
11.7
8.7
7.6
6.7
AMR
Maldives
Sri Lanka
Indonesia
Timor-Leste
Thailand
Democratic People's Republic ofKorea
Myanmar
Bhutan
Bangladesh
India²
Nepal
15.1
16.4
18.2
26.6
31.0
34.6
35.4
58.6
68.0
99.5
7.7
SEAR
Iceland
Sweden
Finland
Estonia
Norway
Portugal²
Ireland
Spain
Denmark
Luxembourg
Switzerland
United Kingdom
Andorra
Germany
Netherlands
Monaco
Lithuania²
France
Belgium
Austria
San Marino
Malta
Latvia
Kazakhstan
Russian Federation
Romania
Czechia
Italy
Hungary
Greece
Slovenia
Republic of Moldova
Cyprus
Kyrgyzstan
Croatia
Slovakia
Albania
Azerbaijan
Belarus
Montenegro
Israel²
Ukraine
Bulgaria
Poland
Georgia
Turkmenistan
Serbia
Uzbekistan
Bosnia and Herzegovina
Armenia
The former Yugoslav Republic of ..
Turkey
Tajikistan 42.8
41.2
33.0
32.9
29.7
28.9
24.7
24.2
24.0
21.5
20.8
19.4
19.4
19.3
19.3
18.5
18.2
18.0
17.6
17.4
17.1
16.5
16.4
16.4
16.3
15.7
15.6
15.4
14.7
14.5
14.4
14.0
13.4
13.1
13.0
12.4
12.3
12.2
12.1
11.9
11.5
10.6
10.4
10.4
10.3
9.8
8.7
8.1
7.8
7.0
6.5
6.1
5.9
EURSomalia
Lebanon
Morocco
Jordan
Iran (Islamic Republic of)
Tunisia
Oman
United Arab Emirates
Syrian Arab Republic
Djibouti
Libya
Yemen
Sudan
Pakistan
Kuwait
Afghanistan
Iraq
Bahrain
Egypt
Saudi Arabia
Qatar 91.7
86.7
79.6
69.0
60.1
59.9
58.9
56.2
46.8
44.3
41.7
41.0
37.4
37.2
36.2
35.7
34.4
31.7
31.1
30.7
28.0
EMR
Brunei Darussalam
New Zealand
Australia
Tonga
Fiji
Micronesia (Federated States of)
Kiribati
Samoa
Vanuatu
Papua New Guinea
Solomon Islands
Japan
Palau
Nauru
Malaysia
Singapore
Philippines
Republic of Korea
Cambodia
Lao People's Democratic Republic
Viet Nam
Mongolia
China
Cook Islands
Marshall Islands
Niue
Tuvalu
51.0
49.5
30.1
25.5
24.9
24.7
18.7
18.3
17.3
12.5
12.4
11.8
11.5
11.5
11.0
10.9
10.9
10.5
10.5
10.2
7.3
5.8
5.8
WPR
The former Yugoslav Republic of Macedonia
53MONITORING HEALTH FOR THE SDGs
Annual mean levels of fine particulate matter (PM2.5) in urban areas (μg/m3), 20161
Data type: Comparable estimates
AIR POLLUTIONSDG Target 11.6By 2030, reduce the adverse per capita environmental impact of cities, including by paying special attention to air quality and municipal and other waste management
Indicator 11.6.2: Annual mean levels of fine particulate matter (e.g. PM2.5 and PM10) in cities (population weighted)
Indicator 11.6.2 Air pollution
1 Public health and environment [online database]. Global Health Observatory (GHO) data. Geneva: World Health Organization (http://www.who.int/gho/phe/en/).2 Under country consultation as of May 2018.

Cabo Verde
Central African Republic
Equatorial Guinea
Eritrea
Ethiopia
Gabon
Guinea
Guinea-Bissau
Lesotho
Liberia
Namibia
Sao Tome and Principe
Seychelles
Sierra Leone
Togo
Zambia
Algeria
Angola
Benin
Burkina Faso
Cameroon
Chad
Congo
Côte d'Ivoire
Democratic Republic of the Congo
Gambia
Kenya
Mali
Mauritania
Nigeria
Rwanda
Senegal
South Africa
Uganda
United Republic of Tanzania
Botswana
Comoros
Burundi
Ghana
Madagascar
Malawi
Mauritius
Mozambique
Niger
Swaziland
Zimbabwe
South Sudan
<0.1
<0.1
<0.1
<0.1
<0.1
<0.1
<0.1
<0.1
<0.1
<0.1
<0.1
<0.1
<0.1
<0.1
<0.1
<0.1
<0.1
<0.1
<0.1
0.3
0.2
0.2
0.2
0.2
0.2
0.2
0.2
0.2
0.2
0.1
0.1
0.0
0.0
0.0
0.0
0.0
0.0
0.0
0.0
0.0
0.0
0.0
0.0
0.0
0.0
0.0
0.0
AFRAntigua and Barbuda
Bahamas
Barbados
Belize
El Salvador
Jamaica
Suriname
Trinidad and Tobago
Argentina
Brazil
Canada
Costa Rica
Dominican Republic
Guyana
Honduras
Paraguay
Peru
United States of America
Uruguay
Venezuela (Bolivarian Republic of)
Chile
Mexico
Nicaragua
Grenada
Guatemala
Colombia
Cuba
Panama
Bolivia (Plurinational State of)
Ecuador
Saint Lucia
Haiti
Saint Vincent and the Grenadines
Dominica
Saint Kitts and Nevis
<0.1
<0.1
<0.1
<0.1
<0.1
<0.1
<0.1
<0.1
<0.1
<0.1
<0.1
<0.1
2.2
1.3
0.7
0.6
0.4
0.3
0.3
0.3
0.2
0.2
0.1
0.1
0.1
0.0
0.0
0.0
0.0
0.0
0.0
0.0
0.0
AMR
Bhutan
Maldives
Timor-Leste
Bangladesh
Indonesia
Myanmar
Thailand
India
Democratic People's Republic ofKorea
Sri Lanka
Nepal
<0.1
<0.1
<0.1
<0.1
0.0
0.0
0.0
0.2
0.3
0.3
7.0
SEAR
Albania
Armenia
Azerbaijan
Belarus
Cyprus
Iceland
Luxembourg
Montenegro
Turkmenistan
Belgium
Bulgaria
Croatia
Czechia
Denmark
Estonia
Finland
France
Germany
Hungary
Ireland
Israel
Kazakhstan
Latvia
Malta
Netherlands
Norway
Poland
Portugal
Republic of Moldova
Russian Federation
Slovakia
Slovenia
Spain
Sweden
Tajikistan
The former Yugoslav Republic of ..
Turkey
Ukraine
United Kingdom
Uzbekistan
Bosnia and Herzegovina
Georgia
Romania
Serbia
Austria
Greece
Italy
Switzerland
Kyrgyzstan
Lithuania
Andorra
Monaco
San Marino
<0.1
<0.1
<0.1
<0.1
<0.1
<0.1
<0.1
<0.1
<0.1
<0.1
<0.1
<0.1
<0.1
<0.1
<0.1
<0.1
<0.1
<0.1
<0.1
<0.1
<0.1
<0.1
<0.1
<0.1
<0.1
<0.1
<0.1
<0.1
<0.1
<0.1
<0.1
0.4
0.3
0.2
0.2
0.2
0.2
0.1
0.1
0.1
0.1
0.0
0.0
0.0
0.0
0.0
0.0
0.0
0.0
0.0
EURBahrain
Djibouti
Egypt
Jordan
Lebanon
Oman
Qatar
Syrian Arab Republic
Tunisia
United Arab Emirates
Iraq
Kuwait
Libya
Morocco
Saudi Arabia
Sudan
Yemen
Iran (Islamic Republic of)
Pakistan
Somalia
Afghanistan
<0.1
<0.1
<0.1
<0.1
<0.1
<0.1
<0.1
0.7
0.3
0.3
0.1
0.0
0.0
0.0
0.0
0.0
0.0
0.0
0.0
0.0
0.0
EMR
Brunei Darussalam
Kiribati
Mongolia
Singapore
Tonga
Australia
China
Japan
Lao People's Democratic Republic
Malaysia
New Zealand
Republic of Korea
Viet Nam
Papua New Guinea
Cambodia
Fiji
Vanuatu
Samoa
Micronesia (Federated States of)
Solomon Islands
Philippines
Cook Islands
Marshall Islands
Nauru
Niue
Palau
Tuvalu
<0.1
<0.1
<0.1
<0.1
<0.1
<0.1
<0.1
<0.1
2.1
2.0
1.3
1.2
0.9
0.4
0.3
0.2
0.0
0.0
0.0
0.0
0.0
WPR
The former Yugoslav Republic of Macedonia
54 WORLD HEALTH STATISTICS: 2018
Average death rate due to natural disasters (per 100 000 population), 2012–20161
Data type: Comparable estimates
MORTALITY DUE TO DISASTERSSDG Target 13.1Strengthen resilience and adaptive capacity to climate-related hazards and natural disasters in all countries
Indicator 13.1.1: Number of deaths, missing persons and directly affected persons attributed to disasters per 100 000 population
Indicator 13.1.1 Mortality due to disasters
1 Global Health Estimates 2016: Deaths by cause, age, sex, by country and by region, 2000–2016. Geneva: World Health Organization; 2018. WHO Member States with a population of less than 90 000 in 2016 were not included in the analysis. The death rate is an average over the five-year period.

Malawi
Mauritius
Mozambique
Equatorial Guinea
Algeria
South Sudan
Kenya
Rwanda
Benin
Burundi
Madagascar
Sao Tome and Principe
United Republic of Tanzania
Eritrea
Ethiopia
Senegal
Comoros
Cabo Verde
Gabon
Guinea
Guinea-Bissau
Gambia
Togo
Chad
Ghana
Angola
Burkina Faso
Nigeria
Seychelles
Liberia
Zambia
Congo
Niger
Mauritania
Mali
Botswana
Cameroon
Côte d'Ivoire
Uganda
Sierra Leone
Democratic Republic of the Congo
Central African Republic
Zimbabwe
Namibia
Swaziland
South Africa
Lesotho 35.0
33.1
20.0
18.3
15.1
13.8
13.3
13.1
12.6
12.1
11.6
11.4
11.3
11.0
10.4
10.2
10.1
10.0
9.9
9.8
9.8
9.8
9.7
9.6
9.3
9.3
9.2
8.9
8.8
8.2
7.9
7.8
7.8
7.8
7.7
7.0
6.9
6.6
6.4
5.5
5.3
5.1
4.2
3.4
2.5
1.6
1.5
AFRCanada
Antigua and Barbuda
Chile
Cuba
Argentina
Grenada
United States of America
Uruguay
Paraguay
Ecuador
Barbados
Suriname
Costa Rica
Peru
Saint Vincent and the Grenadines
Nicaragua
Bolivia (Plurinational State of)
Saint Lucia
Dominican Republic
Mexico
Guyana
Panama
Guatemala
Haiti
Belize
Bahamas
Brazil
Jamaica
Trinidad and Tobago
Colombia
El Salvador
Venezuela (Bolivarian Republic of)
Honduras
Dominica
Saint Kitts and Nevis
55.5
49.2
46.0
43.1
42.2
39.1
31.3
29.7
29.4
28.0
25.8
20.5
18.8
16.9
16.8
15.6
14.1
13.9
13.8
11.6
10.2
10.0
10.0
9.3
8.6
7.4
6.5
6.3
6.2
5.5
4.4
1.8
1.5
AMR
Bhutan
Bangladesh
Sri Lanka
Nepal
Maldives
India
Myanmar
Democratic People's Republic ofKorea
Indonesia
Thailand
Timor-Leste
1.7
2.9
3.0
3.3
3.4
4.1
4.1
4.4
4.5
5.0
5.1
SEAR
Luxembourg
Austria
Switzerland
Norway
Germany
Netherlands
Slovenia
Spain
Czechia
Denmark
Ireland
Italy
France
Malta
Poland
Belgium
Croatia
Sweden
Greece
Iceland
Portugal
Finland
Hungary
Slovakia
Tajikistan
United Kingdom
Cyprus
The former Yugoslav Republic of ..
Romania
Serbia
Bulgaria
Israel
Uzbekistan
Armenia
Azerbaijan
Montenegro
Turkey
Bosnia and Herzegovina
Estonia
Albania
Turkmenistan
Georgia
Ukraine
Belarus
Republic of Moldova
Kyrgyzstan
Lithuania
Latvia
Kazakhstan
Russian Federation
Andorra
Monaco
San Marino
11.3
8.1
6.0
5.9
5.8
5.3
5.2
4.6
4.6
4.2
4.2
3.7
3.3
2.7
2.6
2.4
2.4
1.9
1.8
1.7
1.6
1.6
1.5
1.4
1.3
1.3
1.3
1.3
1.3
1.2
1.2
1.1
1.0
1.0
1.0
0.9
0.9
0.9
0.8
0.8
0.8
0.8
0.7
0.7
0.7
0.7
0.6
0.5
0.5
0.2
EURBahrain
Morocco
Tunisia
Libya
Syrian Arab Republic
Kuwait
Jordan
United Arab Emirates
Iran (Islamic Republic of)
Lebanon
Egypt
Oman
Somalia
Yemen
Saudi Arabia
Sudan
Djibouti
Afghanistan
Qatar
Pakistan
Iraq 15.5
9.6
7.4
7.4
6.8
6.2
6.2
6.1
5.6
5.2
4.8
4.5
4.5
3.8
2.9
2.7
2.5
2.5
1.7
1.4
0.8
EMR
Singapore
Japan
China
Australia
New Zealand
Republic of Korea
Brunei Darussalam
Cambodia
Fiji
Vanuatu
Samoa
Viet Nam
Malaysia
Solomon Islands
Tonga
Micronesia (Federated States of)
Lao People's Democratic Republic
Mongolia
Kiribati
Papua New Guinea
Philippines
Cook Islands
Marshall Islands
Nauru
Niue
Palau
Tuvalu
14.8
10.2
9.1
8.9
7.0
4.8
4.6
4.3
4.1
3.8
3.2
2.5
2.5
2.2
2.0
1.3
1.1
1.1
0.9
0.3
0.2
WPR
The former Yugoslav Republic of Macedonia
55MONITORING HEALTH FOR THE SDGs
Mortality rate due to homicides (per 100 000 population), 20161
Data type: Comparable estimates
HOMICIDESDG Target 16.1Significantly reduce all forms of violence and related death rates everywhere
Indicator 16.1.1: Number of victims of intentional homicide per 100 000 population, by sex and age
Indicator 16.1.1 Homicide
1 Global Health Estimates 2016: Deaths by cause, age, sex, by country and by region, 2000–2016. Geneva: World Health Organization; 2018. WHO Member States with a population of less than 90 000 in 2016 were not included in the analysis.

56 WORLD HEALTH STATISTICS: 2018
Estimated deaths from major conflicts (per 100 000 population), 2002–20161
Data type: Comparable estimates
MORTALITY DUE TO CONFLICTSSDG Target 16.1Significantly reduce all forms of violence and related death rates everywhere
Indicator 16.1.2: Conflict-related deaths per 100 000 population, by sex, age and cause
Indicator 16.1.2 Mortality due to conflicts
Crude death rate (per 100 000 population)0 100 200 300 400 500 600
2002-20062007-20112012-2016
2002-20062007-20112012-2016
2002-20062007-20112012-2016
2002-20062007-20112012-2016
2002-20062007-20112012-2016
2002-20062007-20112012-2016
2002-20062007-20112012-2016
2002-20062007-20112012-2016
2002-20062007-20112012-2016
2002-20062007-20112012-2016
2002-20062007-20112012-2016
2002-20062007-20112012-2016
2002-20062007-20112012-2016
2002-20062007-20112012-2016
2002-20062007-20112012-2016
2002-20062007-20112012-2016
Liberia
Sri Lanka
Nepal
Burundi
Chad
Ukraine
Pakistan
Sudan
South Sudan
Yemen
Somalia
Libya
Central African Republic
Afghanistan
Iraq
Syrian Arab Republic
1 Global Health Estimates 2016: Deaths by cause, age, sex, by country and by region, 2000–2016. Geneva: World Health Organization; 2018. Conflict deaths include deaths due to collective violence and exclude deaths due to legal intervention. WHO Member States with estimated conflict deaths exceeding 5 per 100 000 population in 2012–2016 or 10 per 100 000 population in earlier five-year periods. The death rate is an average over each five-year period. Horizontal lines represent 95% confidence intervals.

57MONITORING HEALTH FOR THE SDGs
DEATH REGISTRATIONSDG Target 17.19By 2030, build on existing initiatives to develop measurements of progress on sustainable development that complement gross domestic product, and support statistical capacity-building in developing countries
Indicator 17.19.2: Proportion of countries that (a) have conducted at least one population and housing census in the last 10 years; and (b) have achieved 100 per cent birth registration and 80 per cent death registration
Completeness1 (%) and quality2 of cause-of-death data, 2007–2016Data type: Comparable estimates
Indicator 17.19.2 Death registration
Mauritius
Cabo Verde
South Africa
Seychelles
Algeria
Angola
Benin
Botswana
Burkina Faso
Burundi
Cameroon
Central African Republic
Chad
Comoros
Congo
Côte d'Ivoire
Democratic Republic of the Congo
Equatorial Guinea
Eritrea
Ethiopia
Gabon
Gambia
Ghana
Guinea
Guinea-Bissau
Kenya
Lesotho
Liberia
Madagascar
Malawi
Mali
Mauritania
Mozambique
Namibia
Niger
Nigeria
Rwanda
Sao Tome and Principe
Senegal
Sierra Leone
South Sudan
Swaziland
Togo
Uganda
United Republic of Tanzania
Zambia
Zimbabwe
98
92
92
91
AFRArgentina
Canada
Cuba
Dominica
Grenada
Guatemala
Mexico
Saint Vincent and the Grenadines
United States of America
Uruguay
Brazil
Chile
Saint Lucia
El Salvador
Panama
Guyana
Venezuela (Bolivarian Republic of)
Jamaica³
Saint Kitts and Nevis
Antigua and Barbuda
Costa Rica
Bahamas
Belize
Trinidad and Tobago³
Ecuador
Paraguay
Suriname
Colombia
Barbados
Nicaragua
Dominican Republic
Peru
Honduras
Bolivia (Plurinational State of)
Haiti
100
100
100
100
100
100
100
100
100
100
97
97
94
92
92
90
89
88
88
87
87
86
86
84
81
80
80
79
78
78
59
57
14
AMR
Maldives³
Thailand
India³
Bangladesh
Bhutan
Democratic People's Republic ofKorea
Indonesia
Myanmar
Nepal
Sri Lanka
Timor-Leste
10
85
94
SEAR
Andorra
Armenia
Austria
Belarus
Belgium
Bulgaria
Croatia
Czechia
Denmark
Estonia
Finland
France
Germany
Greece
Hungary
Iceland
Ireland
Israel
Italy
Latvia
Lithuania
Luxembourg
Malta
Monaco
Netherlands
Norway
Poland
Portugal
Romania
Russian Federation
San Marino
Slovakia
Slovenia
Spain
Sweden
Switzerland
The former Yugoslav Republic of ..
United Kingdom
Kyrgyzstan
Azerbaijan³
Serbia
Montenegro³
Bosnia and Herzegovina
Ukraine
Uzbekistan
Georgia
Turkey
Kazakhstan
Tajikistan
Turkmenistan
Republic of Moldova
Cyprus
Albania³
100
100
100
100
100
100
100
100
100
100
100
100
100
100
100
100
100
100
100
100
100
100
100
100
100
100
100
100
100
100
100
100
100
100
100
100
100
100
96
95
95
94
93
93
93
90
89
87
87
85
83
74
55
EURBahrain
Egypt
Iran (Islamic Republic of)
Syrian Arab Republic³
Iraq³
Oman
Jordan
Kuwait
United Arab Emirates³
Qatar
Saudi Arabia
Morocco
Tunisia
Afghanistan
Djibouti
Lebanon
Libya
Pakistan
Somalia
Sudan
Yemen
96
94
88
83
78
73
59
59
59
55
42
29
29
EMR
Australia
Cook Islands
Fiji
Japan
New Zealand
Republic of Korea
Brunei Darussalam
Palau
Philippines³
Mongolia
Singapore
China
Kiribati
Malaysia
Cambodia
Lao People's Democratic Republic
Marshall Islands
Micronesia (Federated States of)
Nauru
Niue
Papua New Guinea
Samoa
Solomon Islands
Tonga
Tuvalu
Vanuatu
Viet Nam
100
100
100
100
100
100
97
95
89
84
68
62
56
52
WPR
High Medium Low Very low
The former Yugoslav Republic of Macedonia
Quality
1 Figures shown for completeness refer to the latest available value for the period 2007–2016. Completeness was assessed relative to the de facto resident populations. Source: Global Health Estimates 2016: Deaths by cause, age, sex, by country and by region, 2000–2016. Geneva: World Health Organization; 2018.
2 Colours represent assessed data quality for the period 2007–2016.3 Completeness refers to a year prior to 2012.