annex vi - case study - kenya - ... · pdf file• mombasa’s moi international ......
TRANSCRIPT

1 Research to assess impacts on developing countries of measures to address emissions in the international aviation and shipping sectors
Annex VI - Case Study - Kenya
Contents VI.1. General description and basic economy 1 VI.2. Nature of Aviation and Shipping Industries 2
VI.2.1 Civil Aviation 2 VI.2.2 Shipping 4
VI.3. Exported goods & Tourism 8 VI.4. Imported goods 11 VI.5. Key Demographics 14 VI.6. Impacts Of Future Changes In Imports, Exports And Tourism 15 VI.7. Plans For Port Expansions 16 VI.8. Modelling results 16 VI.9. List of ‘similar’ countries 17
General description and basic economy
The Republic of Kenya is a country in East Africa that lies on the equator. With the Indian Ocean to its south-east, it is bordered by Tanzania to the south, Uganda to the west, South Sudan to the north-west, Ethiopia to the north and Somalia to the north-east. It has a land area of 580,000 km2. The population is currently around 43 million and growing at an estimated rate of 2.4% p/a in 2012. It is a young country, with over 40% of people under the age of 14 years. It is ethnically, linguistically and religiously diverse (with the majority of the population Christian, both Protestant and Catholic). It is also a poor country with nearly half the population living below the international poverty line. 1 In 2011, Kenya’s Human Development Index score was 0.509, ranked 143rd in the world.2
Kenya’s GDP grew by 4.5% in 2011 to reach $33,621m ($71,498m once adjusted for purchasing power - PPP), following growth of 5.6% in 2010 and 2.6% in 2009.3 A recent IMF assessment is for growth to remain above 5% in the near future providing drought recedes, security conditions improve and the country’s new Constitution is implemented smoothly.4
In 2011, the biggest sector by far in terms of contribution to GDP is the Service sector at 58% GDP (value added), up from 51% in 2000. This includes tourism, which has grown to become Kenya’s largest foreign currency earner, and financial services. 32% of all employment in Kenya comes from the Service sector.
Agriculture contributed 23% of GDP in 2011 (value added), down from 32% in 2000, but provided well over half (61%) of all employment. The sector is dominated by the production of tea, coffee and horticultural products.
1 CIA World Factbook, Kenya - https://www.cia.gov/library/publications/the-world-factbook/geos/ke.html 2 Human Development Report 2011 - Human development statistical annex. UNDP. pp. 127–130. 3 World Bank Global Development Indicators - http://databank.worldbank.org/Data/Home.aspx 4 IMF Statement at Conclusion of the IMF mission, March 2012 - http://www.imf.org/external/np/sec/pr/2012/pr1274.htm

2 Research to assess impacts on developing countries of measures to address emissions in the international aviation and shipping sectors
Industry contributed 19% of GDP and 7% of employment in 2011. The main activities in this sector include food-processing industries such as grain milling and beer production, the fabrication of consumer goods, and petroleum products.5
Kenya imports more goods and services than it exports. In 2010 imports were valued at $13,531m, around 38% of GDP, most of which were goods (including oil). The main countries of origin were China, India and the UAE. Exports were valued at $8,983, or 28% of GDP, of which almost two-thirds were goods. The main destination countries were Uganda, Tanzania, the Netherlands and the UK.
Nature of Aviation and Shipping Industries
VI.2.1 Civil Aviation
Airports
• Kenya now has 4 airports which handle international flights:6 • Nairobi’s Jomo Kenyatta International Airport (JKIA) - the biggest airport in East
and Central Africa, served by 49 scheduled airlines with direct flights to/from Europe, the Middle East, the Far East and other Africa countries.
• Mombasa’s Moi International Airport (MIA) - 18 airlines flying direct to/from Europe and other African cities.
• Both JKIA and MIA are being upgraded as part of the World Bank supported Northern Corridor Transport Improvement Project to handle more international flights. JKIA is due to gain “category one” status from the US FAA to allow for direct flights with the USA, boosting the airport’s status as a regional hub.7
• Kisumu International Airport (KIS) - Recently upgraded to increase capacity and enable international flights, becoming Kenya’s third largest airport. Further upgrades to finish in 2013.
• Eldoret International Airport (EDL) - There are currently three scheduled international cargo flights and several ad hoc freighters per week. Eldoret was built to open up the Western region to local and international markets and promote tourism in unexploited areas8.
Air Freight
Air transport of freight (as measured by metric tonne kilometers) increased from 1997 until the mid 2000’s, reaching 301m t/km in 2006, and has been in declined since then to 258m t/km in 2010. 9
Air Passengers
5 World Bank Global Development Indicators - http://databank.worldbank.org/Data/Home.aspx 6 Kenya Airports Authority (KAA), Overview - Airports - http://www.kenyaairports.co.ke/kaa/airports/ 7 US Library of Congress, Country Profile: Kenya, 2007 - http://lcweb2.loc.gov/frd/cs/profiles.html 8 http://www.constructionkenya.com/2489/phase-ii-of-kisumu-airport-upgrade-begins/ 9 ICAO data via World Bank Global Development Indicators - http://databank.worldbank.org/Data/Home.aspx

3 Research to assess impacts on developing countries of measures to address emissions in the international aviation and shipping sectors
In 2010, for air carriers registered in Kenya, the total number of air passengers travelling within, to, or from Kenya was over 3 million, compared to under 1 million passengers in 1997.10 However once all flights are taken into account, the number of air passengers travelling within, to, or from Kenya, is far larger: 11
• Nairobi’s JKIA airport recorded 5,485,771 passengers in 2010 (including 1,101,169 in transit)
• Mombasa’s MIA airport recorded 1,271,078 passengers in 2010 (107,991 in transit) • All other Kenyan airports combined recorded 760,033 passengers in 2010 (62,900 in
transit) • Total in 2010 = 7,516,882 passengers (including 1,272,060 in transit)
Domestic Carriers & Fleets
Table 1 below gives a summary of all currently operating international, domestic, passenger and cargo, air carriers & fleets registered in Kenya 12 (note: more carriers than this operate flights to and from Kenya, e.g. British Airways):
Table 1 Kenyan airlines and fleets
Registered Carrier Current Fleet Average aircraft age Future additions
748 Air Services
2 x DHC-8-100
? 3 x HS 748F
1 x Cessna 208 Caravan
African Express Airways 2 x McDonnell Douglas DC-9-80 27 years
AirKenya Express
1 x deHavilland DHC-7-100 (+2 parked)
26 years
1 x Bombardier Dash 8 Q100
Astral Aviation
1 × McDonnell Douglas DC-9-30
? 1 x Antonov An-72
2 x Cessna 208 Caravan
10 ICAO data via World Bank Global Development Indicators - http://databank.worldbank.org/Data/Home.aspx 11 Kenya Airports Authority, Airport Statistics - http://www.kenyaairports.co.ke/kaa/about/airport_statistics.html 12 http://www.airlineupdate.com/content_public/airlines/africa/kenya.htm

4 Research to assess impacts on developing countries of measures to address emissions in the international aviation and shipping sectors
Blue Bird Aviation
4 x Bombardier Dash 8 Q100 (+1 parked)
19 years 3 x Bombardier Dash 8 Q400 (+2 parked)
3 x Fokker 50
Fly540
2 x Bombardier CRJ100
21 years 1 x ATR 72-500 (leased out)
1 x ATR 42-300
3 x Bombardier Dash 8 Q100
Jetlink Express
3 x Bombardier CRJ100 (1 leased; 1 parked);
21 years
4 x Bombardier CRJ200;
1 x Fokker F28-4000
Kenya Airways
1 x Boeing 747-400(BCF)
8.6 years
4 x Boeing 777-300ER;
4 x Boeing 777-200ER; 9 x Boeing 787-8
6 x Boeing 767-300ER; 9 x Embraer ERJ 190
6 x Boeing 737-300;
4 x Boeing 373-700;
5 x Boeing 737-800;
6 x Embraer 190;
5 x Embraer 170LR;
VI.2.2 Shipping
5 Research to assess impacts on developing countries of measures to address emissions in the international aviation and shipping sectors
Merchant Fleet
According to UNCTAD statistics, the number of ships in Kenya’s merchant fleet (those registered in the country and authorised to navigate at sea) reduced from 19 in 1997 to 8 in 2012 including 2 oil tankers and 6 ‘other’ (i.e. not oil tankers, bulk carriers, cargo, or container ships). This number is very low compared to the large fleets of many developed countries, e.g. Denmark’s fleet numbered 14,187 in 2012, and the UK’s 43,770 13.
Container Traffic
However the total amount of container traffic that moves through Kenya’s ports from ships of any country’s merchant fleet (for both international journeys and domestic coastal shipping) has increased over time from 585,367 TEUs in 2007 (a TEU is a measure of standard-size ‘twenty foot equivalent’ container unit) to 696,000 TEU’s in 2010. 14
Ports
Mombasa
The port of Mombasa on Kenya’s Indian Ocean coast is the largest seaport in East Africa and handles much of the cargo arriving by sea into the region. According to the 2011 UNCTAD Review of Maritime Transport, Mombasa handled 695,000 TEUs in 2010 - i.e. virtually the total amount recorded for the whole country in the World Bank data set. It is a multi-purpose port originally designed to handle 250,000 TEUs p/a and thus currently experiences severe congestion. It is capable of handling all type of cargo including containers, general cargo, liquid and dry cargo and passengers.
It currently has 16 Deep water berths (including 5 container berths), 2 oil terminals, 1 cased oil jetty, 2 bulk cement berths, 2 lighterage and dhow wharves and 1 explosives jetty. Vessels up to 13.71m draught and 300m LOA can be accommodated15.
Recently completed improvement works at Mombasa port include dredging to allow tankers of up to 80,000 dead weight tonnage. There are also plans to construct a new container terminal capable of handling 1.2m TEUs (the completion date for this is not certain). The port is publicly owned and the Kenya Port Authority (KPA) employs around 7000 people16.
A 2012 shipping industry report17 suggests that the recent dredging has succeeded in encouraging major shipping lines to reroute ‘mega-vessels’ to Mombasa port. As a result of this and the relatively strong performance of East African economies for which Mombasa port is the regional hub, container throughput at Mombasa is
13 http://unctadstat.unctad.org/TableViewer/tableView.aspx?ReportId=93 14 Data from the Containerisation International Yearbook via World Bank Global Development Indicators - http://databank.worldbank.org/Data/Home.aspx 15 Kenya Ports Authority - General Info on the ports of Mombasa and Lamu. http://www.kpa.co.ke/InfoCenter/Maritime%20Information/Pages/GeneralInfoonThePortsofMombasaLamu.aspx 16 UNCTAD 2011 Review of Maritime Transport 17 Business Monitor International - Kenya Shipping Report Q3 2012. http://www.marketresearch.com/Business-Monitor-International-v304/Kenya-Shipping-Q3-7093461/
6 Research to assess impacts on developing countries of measures to address emissions in the international aviation and shipping sectors
estimated to exceed 800,000 TEUs in 2012, with tonnage throughput growing 4.8% on 2011 to exceed 20m tonnes.
Kisumu
The other main port in Kenya is Kisumu on Lake Victoria. It appears trade data for this port may not be captured in the World Bank data set above. However Kisumu is an important port for trade between Kenya and other East African countries, particularly North West Tanzania and Uganda. It is also important for re-exports (transit of goods through Kenya), and providing trading routes to and from central African land-locked countries. One recent study has estimated that $11.6m (US) exports and $11.3m (US) imports passed through Kisumu in 200718
Lamu Corridor Project 19 20
The US$25bn Lamu Port-Southern Sudan-Ethiopia Transport Corridor (Lapsset) infrastructure project is a key part of the Kenyan Government’s Vision for 2030. It will create Kenya’s second transport corridor (the first already existing between Mombasa via Nairobi to Uganda) linking a major new port at Lamu to Juba in South Sudan and Addis Ababa in Ethopia via a 1,720km railway line and new highways. It also involves the construction of three new airports, an oil pipeline and an oil refinery in Kenya. The project is supported by the African Development Bank, and port construction began in 2012.
The new deep water port is expected to consist of 30 berths when complete and be up to three times the size of Mombasa port. The first phase will include 3 deep water berths with a capability of handling ships with a dead-weight capacity of up to 100,000 tonnes. It is expected to be operational from 2012/13.
18 East African Community; Lake Victoria Basin Commission (2007) - Analysis of Trade in Lake Victoria ports 19 Business Monitor International - Kenya Shipping Report Q3 2012. http://www.marketresearch.com/Business-Monitor-International-v304/Kenya-Shipping-Q3-7093461/ 20 Kenya Government - http://www.information.go.ke/index.php?option=com_content&task=view&id=591

7 Research to assess impacts on developing countries of measures to address emissions in the international aviation and shipping sectors
Figure 1 Map of Lamu Corridor Project (source: BBC 2012)
8 Research to assess impacts on developing countries of measures to address emissions in the international aviation and shipping sectors
VI.3 Exported goods & Tourism
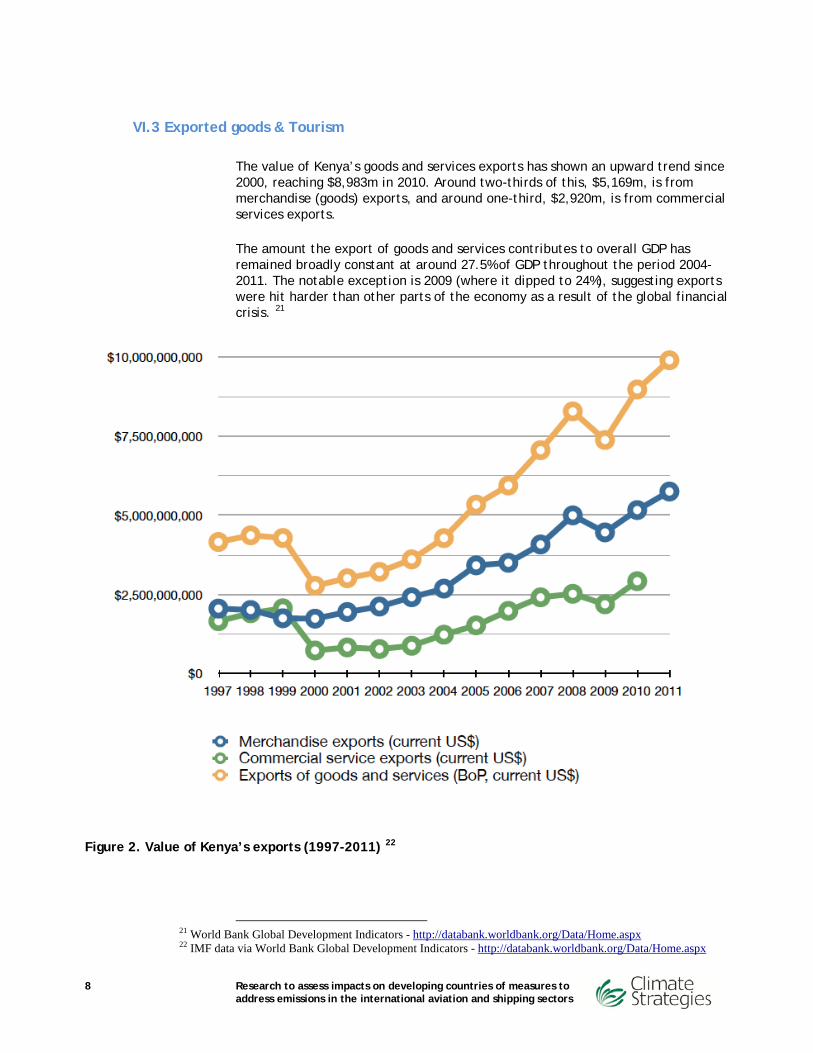
The value of Kenya’s goods and services exports has shown an upward trend since 2000, reaching $8,983m in 2010. Around two-thirds of this, $5,169m, is from merchandise (goods) exports, and around one-third, $2,920m, is from commercial services exports.
The amount the export of goods and services contributes to overall GDP has remained broadly constant at around 27.5% of GDP throughout the period 2004-2011. The notable exception is 2009 (where it dipped to 24%), suggesting exports were hit harder than other parts of the economy as a result of the global financial crisis. 21
Figure 2. Value of Kenya’s exports (1997-2011) 22
21 World Bank Global Development Indicators - http://databank.worldbank.org/Data/Home.aspx 22 IMF data via World Bank Global Development Indicators - http://databank.worldbank.org/Data/Home.aspx
9 Research to assess impacts on developing countries of measures to address emissions in the international aviation and shipping sectors
Merchandise exports
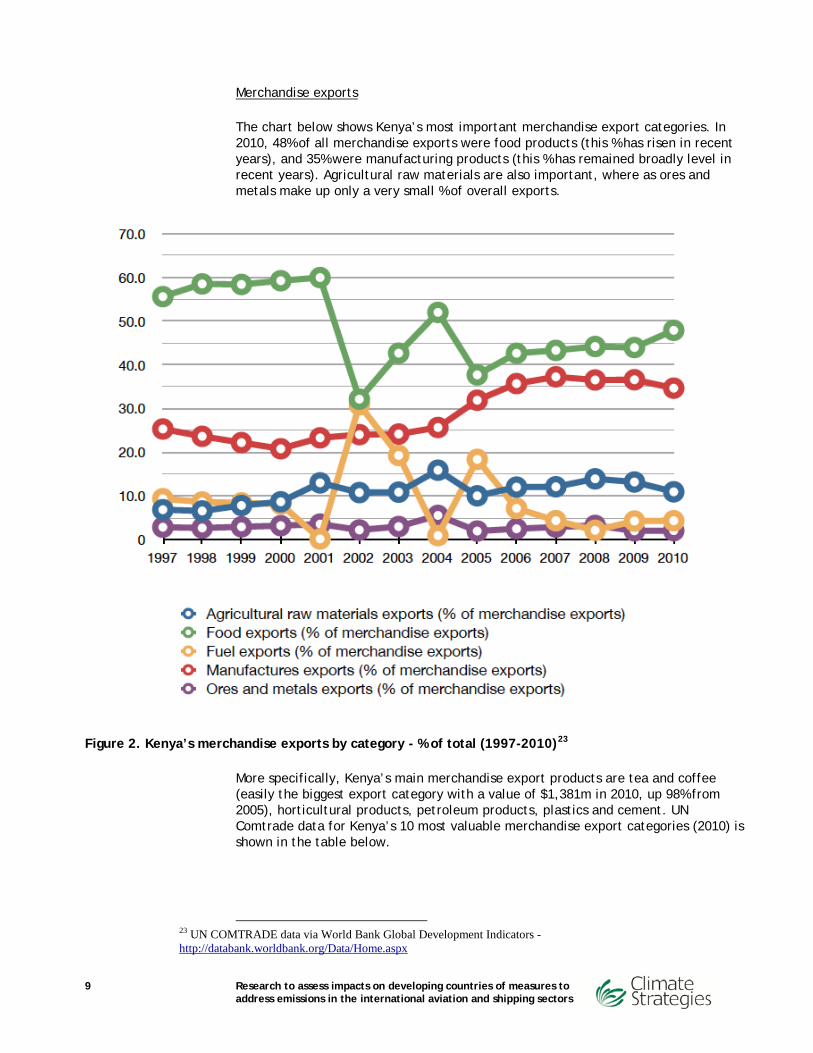
The chart below shows Kenya’s most important merchandise export categories. In 2010, 48% of all merchandise exports were food products (this % has risen in recent years), and 35% were manufacturing products (this % has remained broadly level in recent years). Agricultural raw materials are also important, where as ores and metals make up only a very small % of overall exports.
Figure 2. Kenya’s merchandise exports by category - % of total (1997-2010)23
More specifically, Kenya’s main merchandise export products are tea and coffee (easily the biggest export category with a value of $1,381m in 2010, up 98% from 2005), horticultural products, petroleum products, plastics and cement. UN Comtrade data for Kenya’s 10 most valuable merchandise export categories (2010) is shown in the table below.
23 UN COMTRADE data via World Bank Global Development Indicators - http://databank.worldbank.org/Data/Home.aspx

10 Research to assess impacts on developing countries of measures to address emissions in the international aviation and shipping sectors
Table 2. Kenya’s top 10 merchandise export categories (1997-2010)24
Commodity 1997 2005 2010 % change 1997-2010
% change 2005-2010
1 Coffee, tea, spices (code: 09) $702,276,544 $698,026,308 $1,380,588,854 97% 98% 2 Live trees and other plants (06) $83,402,840 $283,898,271 $454,540,277 445% 60% 3 Edible vegetables and roots (07) $46,394,264 $189,831,198 $270,487,391 483% 42% 4 Mineral fuels, oils and products of
their distillation (27) $182,355,360 $629,000,213 $218,038,306 20% -65%
5 Animal or vegetable fats& oils (15) $54,434,552 $51,574,198 $150,232,047 176% 191% 6 Plastics and articles thereof (39) $38,096,536 $78,455,489 $138,875,401 265% 77% 7 Salt; sulphur; earths & stone;
plastering materials, cement (25) $81,306,448 $70,259,049 $137,740,672 69% 96%
8 Tobacco and manufactured tobacco substitutes (24)
$29,526,074 $69,717,564 $135,828,339 360% 95%
9 Iron and steel (72) $83,700,680 $112,443,472 $130,601,632 56% 16% 10 Inorganic chemicals; compounds of
precious metals (28) $3,861,163 $91,285,198 $124,167,314 3,116% 36%
Export Destinations
The main destinations for Kenya’s merchandise exports are: 25 • Other developing countries in Sub Saharan Africa - around 37% in 2010, down from
around 40% in 1997, but with considerable annual variation. • High-income economies (a World Bank category that covers North America, much of
Europe, Japan, Australia, New Zealand and Saudi Arabia) - around 38% in 2010, down from around 44% in 1997 but with considerable annual variation.
• The proportion of merchandise exports to developing countries outside Sub-Saharan Africa has remained at around 15% throughout the period 1997-2010.
More specifically, Kenya’s main export partners in 2011 were Uganda (destination for 10% exports), Tanzania (9.7%), Netherlands (8.5%), UK (8.2%), US (6.2%) and DRC (4.2%).26
Tourism & Foreign Visitors
1.47m international tourists came to Kenya in 2010, up from the previous 2 years, but less than 2007 where an all time high of 1.69m was reached. 27 According to the Kenya Government, the UK is the leading country for tourist arrivals, followed by the USA, Italy, Germany and France (around 0.5m from these 5 countries combined). Uganda is the leading African country of arrival. Only a tiny minority of visitors arrived on cruises due to insecurity along the Indian Ocean coast. A significant number are ‘cross-border’ arrivals. 28
Receipts from international tourism reached $1,620m in 2010, the highest ever, earning more foreign currency than other major sectors of the economy such as tea
24 UN COMTRADE 25 IMF data via World Bank Global Development Indicators - http://databank.worldbank.org/Data/Home.aspx 26 CIA Factbook, Kenya Profile - https://www.cia.gov/library/publications/the-world-factbook/geos/ke.html 27 World Bank Global Development Indicators- http://databank.worldbank.org/Data/Home.aspx 28 Kenya Government, Ministry of Tourism - http://www.tourism.go.ke/ministry.nsf/pages/facts_figures

11 Research to assess impacts on developing countries of measures to address emissions in the international aviation and shipping sectors
and coffee. However although tourism receipts more than tripled between 2000 and 2010, their percentage contribution towards overall exports has remained broadly level at 18%, suggesting tourism has grown in proportion to other export sectors over this time. 29
VI.4 Imported goods
The value of Kenya’s goods and services imports has shown an upward trend since 2000, reaching $13,531m in 2010. The vast majority of this was due to merchandise imports ($12,093m), with only a small proportion being commercial services imports ($1,816m).
The ratio of goods and services imports to overall GDP has increased significantly over time, to 46% of GDP in 2011, suggesting an increasing reliance on imports. 30
Chart: $ value of Kenya’s imports (1997-2011) 31
29 World Bank Global Development Indicators- http://databank.worldbank.org/Data/Home.aspx 30 World Bank Global Development Indicators - http://databank.worldbank.org/Data/Home.aspx 31 IMF data via World Bank Global Development Indicators - http://databank.worldbank.org/Data/Home.aspx
12 Research to assess impacts on developing countries of measures to address emissions in the international aviation and shipping sectors
Merchandise Imports
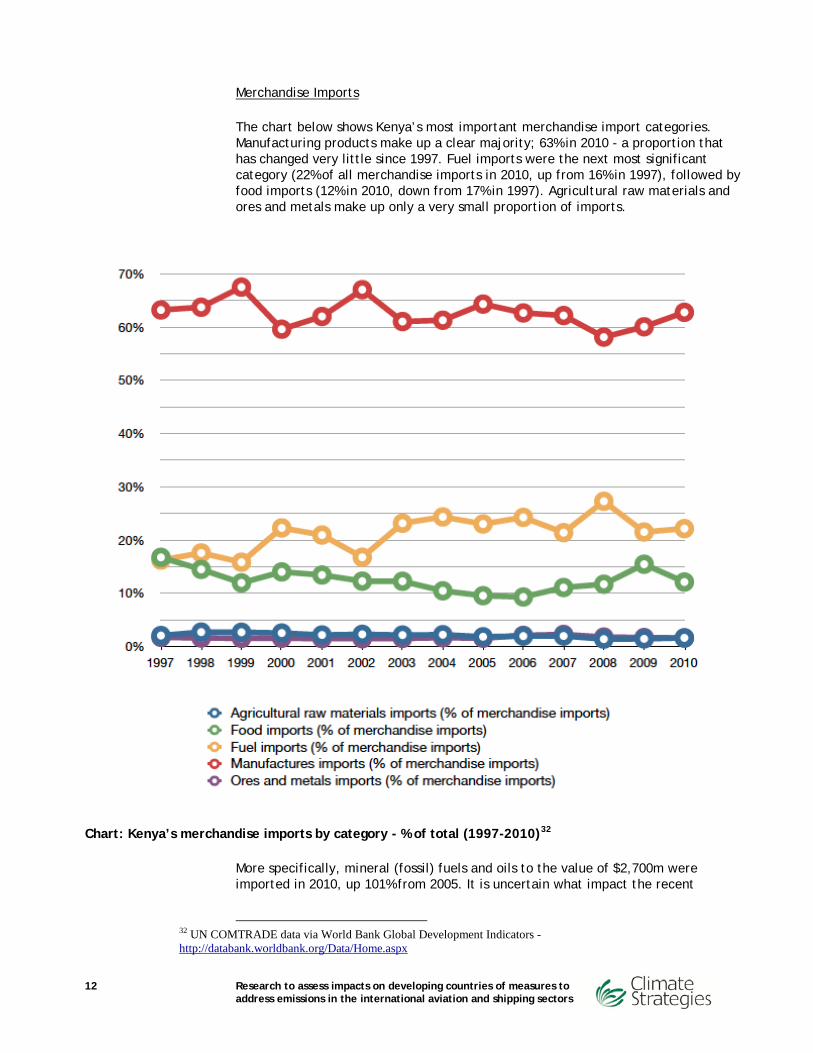
The chart below shows Kenya’s most important merchandise import categories. Manufacturing products make up a clear majority; 63% in 2010 - a proportion that has changed very little since 1997. Fuel imports were the next most significant category (22% of all merchandise imports in 2010, up from 16% in 1997), followed by food imports (12% in 2010, down from 17% in 1997). Agricultural raw materials and ores and metals make up only a very small proportion of imports.
Chart: Kenya’s merchandise imports by category - % of total (1997-2010)32
More specifically, mineral (fossil) fuels and oils to the value of $2,700m were imported in 2010, up 101% from 2005. It is uncertain what impact the recent
32 UN COMTRADE data via World Bank Global Development Indicators - http://databank.worldbank.org/Data/Home.aspx

13 Research to assess impacts on developing countries of measures to address emissions in the international aviation and shipping sectors
discovery of oil in Kenya will make to this trend in the medium to long term.33 The import of electrical machinery and equipment is growing at a very high rate, having increased 336% from $478m in 2005 to $1,192m in 2010. UN Comtrade data for Kenya’s 10 most valuable merchandise import product categories (2010) is shown below.
Table 3. Kenya’s top 10 merchandise import categories (1997-2010)34
Commodity 1997 2005 2010 % change 1997-2010
% change 2005-2010
1 Mineral fuels, oils and products of their distillation (27) $530,124,032
$1,342,621,488 $2,699,808,318 409% 101%
2 Nuclear reactors, boilers, machinery, mech. appliances (84) $387,511,328 $478,392,627 $1,215,778,660 214% 154%
3 Electrical machinery, equipment, parts; sound & television recorders and reproducers (85) $153,101,824 $273,464,095 $1,192,300,168 679% 336%
4 Vehicles other than railway or tramway rolling-stock, and parts (87) $309,654,656 $426,942,711 $898,703,962 190% 110%
5 Aircraft, spacecraft, and parts (88) $126,050,136 $603,375,731 $517,652,125 311% -14%
6 Plastics and articles thereof (39) $140,529,024 $267,234,111 $492,322,481 250% 84% 7 Iron and steel (72) $179,453,712 $266,355,900 $489,107,158 173% 84% 8 Animal or vegetable fats& oils (15) $132,766,760 $183,876,051 $484,682,777 265% 164% 9 Cereals (10) $306,821,632 $173,680,131 $396,749,169 29% 128% 10 Pharmaceutical products (30) $85,770,160 $158,018,537 $332,479,647 288% 110%
Import Origin
The main origins for Kenya’s merchandise imports are: 35 • High-income economies - however this proportion is reducing significantly over time (from providing 70% of all merchandise imports in 1997 to 48% in 2010). • Conversely, the proportion originating from developing countries outside Sub-Saharan Africa (particularly East Asia and South Asia) is rising over time, from 14% in 1997 to 38% in 2010. • The proportion coming from other Sub-Saharan African countries was 12% in 2010, almost the same as in 1997.
More specifically, Kenya’s main import partners in 2011 were China (14.8%), India (14%), UAE (10.1%), South Africa (7.8%) and Saudi Arabia (7.1%).36 According to Comtrade data, most of Kenya’s fossil fuel imports come from UAE ($1,289m in 2010) and Saudi Arabia ($210m in 2010).
33 http://www.aljazeera.com/news/africa/2012/03/2012326174456726672.html 34 UN COMTRADE 35 IMF data from World Bank Global Development Indicators - http://databank.worldbank.org/Data/Home.aspx 36 CIA Factbook, Kenya Profile - https://www.cia.gov/library/publications/the-world-factbook/geos/ke.html

14 Research to assess impacts on developing countries of measures to address emissions in the international aviation and shipping sectors
VI.5 Key Demographics
The population of Kenya is 43million (ranked 31st in the world) and growing at 2.4% (ranked 29th in the world). It is young, with a median age of 18.8 years, and predominantly rural, with 22% of people living in cities as of 2010 (urbanising at a rate of 4.2% a year)37.
Poverty & Inequality38
Kenya is one of the poorest countries in the world with a GDP per capita of $1,507 in 2011, up from $1,271 in 2002 (adjusted for purchasing power; calculated at 2005 $ values). In 2005, 43.4% of people lived below the international poverty line ($1.25 per day PPP) - an increase from 19.6% in 1995, although levels of poverty as measured by the Kenyan Government’s poverty line fell somewhat over the same period. Poverty levels are highest in rural areas.
1997
Poverty headcount ratio at $1.25 a day (PPP) (% of population) 19.6% 43.4% Poverty headcount ratio at $2 a day (PPP) (% of population) 42.7% 67.2% Poverty headcount ratio at national poverty line (% of population) 52.3% 45.9% Poverty headcount ratio at rural poverty line (% of rural population) 52.9% 49.1% Poverty headcount ratio at urban poverty line (% of urban population) 49.2% 33.7%
Kenya has also become more unequal over time. In 1997, 6% of all income went to the poorest 20% of the population and 49.1% to the richest 20%. By 2005 only 4.8% went to the poorest 20% and 53.2% to the richest 20%. The Gini co-efficient went up from 42.5 to 47.7 in the same period.
Employment 39
Employment levels in Kenya fell from 63.4% in 1997 to 58.7% in 2005 before rising to 60.1% in 2010. However for young people between the ages of 15-24 employment levels are much lower and have remained at around 32.5% from 2005 to 2010. Employment is higher among men than women across the population as a whole and for young people.
In 2005 over half (61%) of all employment was in the agricultural sector, which generated only 23% of GDP in 2011 (value added). 32% of employment was in the service sector, which generated 58% of GDP in 2011. Only 7% of employment is in industry.
Tourism employment A study for the Kenya Government in 2006 estimated tourism directly provides 175,000 jobs (between 9-10% of all employment), and further supports 360,000 more jobs.40
37 CIA Factbook, Kenya Profile - https://www.cia.gov/library/publications/the-world-factbook/geos/ke.html 38 World Bank Global Development Indicators - http://databank.worldbank.org/Data/Home.aspx 39 ILO data via World Bank Global Development Indicators - http://databank.worldbank.org/Data/Home.aspx
15 Research to assess impacts on developing countries of measures to address emissions in the international aviation and shipping sectors
Child Labour There is limited data available on child labour in Kenya. The World Bank data sets suggest that in 2000, 38% of children aged 7-14 years were ‘economically active’ (refers to at least 1 hour of economic activity per week). Of these, 81% were employed in the agriculture sector and 17% in the service sector, and 2% in manufacturing.
VI.6 Impacts Of Future Changes In Imports, Exports And Tourism
If the cost of aviation and shipping were to increase as a result of market based measures (MBMs) to reduce emissions, a number of possible implications can be drawn for the Kenyan economy and people based on the case-study data presented above. These implications assume no mitigation measures are put in place, and do not consider how Kenya would be impacted within a context where all other countries are also impacted, perhaps some more so than Kenya.
Exports
• Exports contribute over one quarter of Kenya’s GDP. Most of these are physical merchandise such as agricultural and horticultural products, the majority of which would likely be transported by international shipping (the UN estimates around 90% of world cargo is transported by sea41), although given the perishable nature of some products aviation is also likely to be important.
• Most of these exports are to destinations outside sub-Saharan Africa, where fuel costs are likely to be a higher proportion of overall costs and impacted more by MBMs.
• Thus, an important part of Kenya’s economy which generates a lot of foreign currency could be adversely affected if higher costs are passed to end-consumers, decreasing overall demand.
• In addition, most Kenyans are reliant on agriculture for employment and thus there is a risk of a disproportionately negative impact on jobs if foreign demand for these products reduces.
• On the assumption that much agricultural employment is low-paid, a reduction in employment in this sector could impact those already living below, at, or just above the poverty line, risking an upward pressure on overall poverty levels.
Tourism
• Tourism is an important part of the Kenyan economy which the Government is working to expand. It is the largest foreign currency earner (over $1,600m in 2010) and employs 175,000 people directly (9-10% of all employment). Most tourists come from high-income countries thousands of miles away (Europe and the USA) and most of these will arrive by plane. The number of international arrivals into Kenya by plane exceeded 3m for the first time in 2010.
• An increase in the cost of flying due to MBMs could act as a downward pressure on tourism, thus risking negative impacts on both foreign currency income and employment.
40 Kenya Ministry of Tourism; Statistical Analysis of Tourism Trends (2006) - http://www.tourism.go.ke/ministry.nsf/doc/Tourism_Trends_OCT2006_Revised.pdf/$file/Tourism_Trends_OCT2006_Revised.pdf 41 UNCTAD 2011 Review of Maritime Transport

16 Research to assess impacts on developing countries of measures to address emissions in the international aviation and shipping sectors
Imports • Kenya is growing increasingly reliant on imports over time, with 46% of GDP spent on
imports in 2011. Almost all of these imports are physical merchandise, mostly manufacturing goods (machinery & appliances), electrical goods (increasing at a rapid rate), and fossil fuel imports. Given the non-perishable nature of these goods, they are almost certainly transported by international shipping.
• Around half of all merchandise imports still come from high-income countries (48% in 2010) but this is decreasing. Instead manufacturing goods are increasingly coming from India and China. In each case however, goods are being transported long distances with the possibility of increased costs due to MBMs being passed on to Kenyan consumers.
• On the assumption that those Kenyans in poverty cannot currently afford to buy many of these imported manufactured products, it may be that an increase in the cost of these imports affects poor Kenyans less than it affects wealthier Kenyans.
• Fossil fuel imports largely come from the middle-east, which is relatively close to Kenya by international standards. Thus, the increase in costs due to MBMs may be minimal. Furthermore, the recent discovery of oil in Kenya, and the potential for greater supplies from South Sudan may reduce transport costs further.
VI.7 Plans For Port Expansions
As described above:
• Kenya’s two main airports - in Nairobi and Mombasa - are being upgraded to handle more international flights. In addition, Eldoret airport in the west of Kenya has recently been upgraded with the intention of opening up this part of the country to tourists. Thus, Kenya’s airport infrastructure will clearly be able to facilitate the continued growth in international visitors.
• The country’s main port in Mombasa is being upgraded with a new container terminal
designed to handle an additional 1.2m TEU’s - this is more than four times the current designed capacity of the port. A major new port is also being built at Lama as part of the wider ‘Lapsset’ national infrastructure project to better connect Kenya’s Indian Ocean coast to South Sudan and Ethiopia. These improvements will facilitate continued growth in the shipping of imports and exports.
VI.8 Modelling results Results from the Global Emissions Trading for international aviation and shipping (MBM1a) scenario predict a very small impact of -0.043% on GDP in 2025, with aviation making up -0.048% and offset slightly by a small positive impact from maritime sectors (0.005%). Whilst initially surprising given the significance of tourism for the Kenyan economy, as in the case of Togo this is a reflection of the current trade deficit in Kenya. A predicted increase in costs of imports leading to an import decline will go some way towards reducing the national deficit, thus explaining the very limited negative impacts of MBMs and the positive anticipated impacts on maritime. The high dependence upon national agriculture production and a strong overland trade basis could also explain the limited impacts, along with a
17 Research to assess impacts on developing countries of measures to address emissions in the international aviation and shipping sectors
significant overland aspect of tourism. However, as with Togo, projected increases in import costs are likely to heavily impact the poorest of the country, and given the high poverty levels in Kenya, this would leave a high number of people potentially at risk. When the MBMs auctioning or tax revenues are used to reduce employers’ social security contributions then in case of the Global Emissions Trading for international aviation and shipping (MBM1a) 2025 the expected impacts on GDP are positive (0.036%), with impacts on aviation predicted to be turned from negative to positive (0.005%) and increasingly positive impacts on shipping (0.031%).
VI.9 List of ‘similar’ countries
The conclusions drawn from this case-study report may be useful for understanding the impact of market-based measures on other developing world economies which share some similar characteristics to Kenya42:
Tanzania
Tanzania, directly south of Kenya along the Indian Ocean coast, is also one of the world’s poorest countries. Its population is 47m (compared to 43m for Kenya). In 2011 its GDP was $64,700m PPP (compared to $71,498 PPP for Kenya), the economy grew at over 6.7% (compared to 4.5% for Kenya), and GDP per capita (at 2005 $ PPP values) was $1,334 (compared to $1,507 for Kenya).
Agriculture employs three quarters of the working population (76% in 2005), but contributes only around a quarter of GDP (27% in 2011). Main exports are merchandise goods such as coffee, nuts, cotton and gold. Main destinations for exports are China, India, Japan and Germany. Imports, which exceed exports in value, include consumer goods, machinery and oil - a similar list to Kenya. These come from India, China, South Africa, and the UAE. Tourism is important, but less so than Kenya in 2010 with about half the number of visitors (783,000 compared to 1,469,000).
Mozambique Mozambique is south of Tanzania on the Indian Ocean coast, and has a population of 24m - half that of Kenya. It is also a poorer country than Kenya with a GDP per capita in 2011 of $861 (2005 $ value, PPP), with an economy growing at 7.1% in 2011. However it is similarly reliant on the agricultural sector for jobs (81% of all employment in 2003) which only makes up 32% of GDP in 2011. It imports machinery, fuel, metal products, textiles and foodstuffs, from South Africa, China, India, the US and Australia. Like Kenya and Tanzania, it exports less than it imports. Exports include agricultural and horticultural products as well as timber and aluminium, to EU countries, South Africa and China. Mozambique is also reliant on tourism, with 2.2m visitors in 2009 generating $217m, compared to Kenya’s 1.4m visitors generating $1,124m in the same year.
42 Sources: World Bank Global Development Indicators - http://databank.worldbank.org/Data/Home.aspx & CIA Factbook - https://www.cia.gov/library/publications/the-world-factbook/
18 Research to assess impacts on developing countries of measures to address emissions in the international aviation and shipping sectors
Madagascar
This large island nation off the East coast of Africa in the Indian Ocean is also comparable to Kenya in important ways. Although its population is less, at 22m, and it is poorer, with a GDP per capita of $853 in 2011 (2005 $ values, PPP), it is also heavily reliant on agriculture for 80% of employment, and tourism for 196,000 visitors and $633m income in 2010. It exports agricultural and horticultural products along with chromite and petroleum products, but it imports goods to a higher value including consumer goods, petrol, and food.