annual 20 idp report 16 education limited education limited annual report 2016 ... streamline...
TRANSCRIPT

Personal journeys. Global growth.
IDP
Ed
ucation Lim
ited A
nnual Rep
ort 2016
Annual Report
20 16
IDP Education Limited

A proud history
With 93 offices in 30 countries, IDP Education is a world leader in providing international student placement services.
Over the past 47 years IDP Education has played a major role in the international education sector and now places students into top-quality institutions across Australia, Canada, New Zealand, the United Kingdom and the United States.
IDP Education is also a proud co-owner of the International English Language Testing System (IELTS), the world’s most popular high-stakes English language test for study, work and migration.
An ASX-listed company that is 50% owned by Australian universities, IDP Education also owns and operates 10 English language campuses across Vietnam, Thailand and Cambodia.
IDP Education Limited ABN 59 117 676 463
CONTENTS04 Chairman’s letter06 CEO’s review09 Student Placement Services11 English Language Testing13 English Language Teaching14 Board of Directors16 Directors’ Report

$237.1m $20.3m$104.2m
English Language Testing
English Language Teaching
Student Placement Services
% O
F F
Y16
RE
vE
Nu
EF
Y16
RE
vE
Nu
EF
Y16
HIG
HL
IGH
TS
• Morethan857,000testswere taken at IDP IELTStest locations.
• IELTSisnowrecognisedand trusted by more than9000 organisationsaround the world.
• IDPEducationisaproudowner of IELTS inpartnership with BritishCouncil and CambridgeEnglish LanguageAssessment.
• Studentswereplacedinto more than 31,000courses across Australia,Canada, New Zealand,the United Kingdomand the United States.
• Ournetworkexpandedto 93 student placementoffices across 30countries.
• Studentsenrolledinmorethan68,000Englishlanguage courses acrossCambodia, Thailandand Vietnam.
• Wecontinuedtohelpbuild the capacity ofeducators in South-EastAsia by deliveringCamTESOL, a leadingEnglish languageconference.
Personal journeys. Global growth. 01
An exciting future
29% 65% 6%
Note: Student Placement revenue on this page includes revenue from events associated with Student Placement, contracted activities for developmental programs initiated by government or semi-government bodies, and other revenue.

02 IDP Education Limited Annual Report 2016
Diverse business modelA leading global provider with a diverse source of income in a growing industry
A respected heritage 47 years of experienceinthe international education sector give IDP Education a unique perspective and an unparalleled network
Trusted and knowledgeable teamsOur 650 student counsellors around the world are supported by our comprehensive knowledge base system to ensure accurate and up-to-date advice for students
University ownershipA unique connection to the university sector as IDP Education was founded by and is 50% owned by Australian universities
A scalable business As one of the few global players in a fragmented industry we can efficiently streamline processes and systems to achieve economies of scale
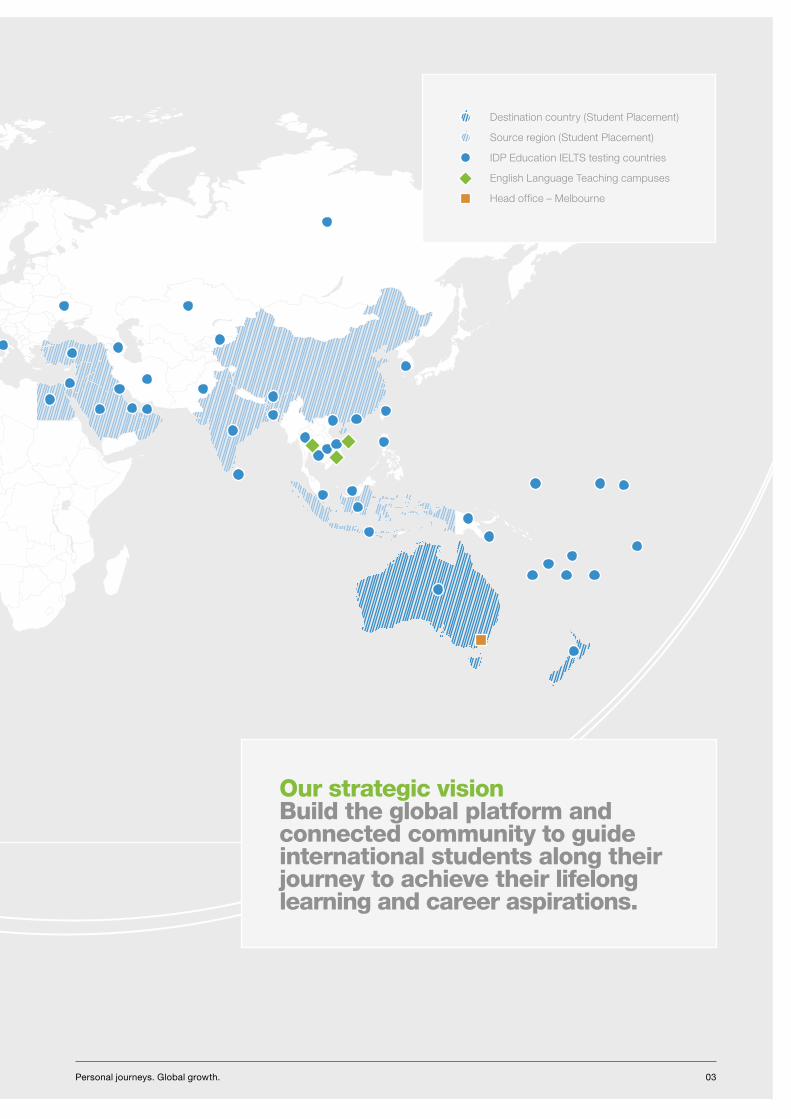
A global presence
We have a unique physical footprint and a strong reputation as an industry leader
03Personal journeys. Global growth.
Destination country (Student Placement)
Source region (Student Placement)
IDP Education IELTS testing countries
English Language Teaching campuses
Headoffice–Melbourne
Our strategic vision Build the global platform and connected community to guide international students along their journey to achieve their lifelong learning and career aspirations.

Students enrolled in more than 68,000 English language courses across Cambodia, Thailand and Vietnam
Our four newest destination markets delivered a 100% increase in revenue on FY15
Morethan2.7 million IELTS tests were delivered around the world
04 IDP Education Limited Annual Report 2016
The financial year of 2016 was a milestone year for IDP Education. Not only did we help place students into more than 31,000 courses, we also delivered a record number of English language tests.
Significantly, this was also the year we became a publicly listedcompanyontheAustralianSecuritiesExchange.
Thefoundationsforthepubliclistingwerelaidsixyearsagowhen we made a strategic decision to diversify our student placement business stream.
In 2010, we shifted from focusing solely on placing students into Australian education institutions to providing our customers with access to other key English-speaking study destinations: Canada, New Zealand, the United Kingdom and the United States.
Onanindividuallevel,thisexpandedserviceofferenablesus to help students find the course and country that best suits their education and career needs.
At a corporate level, IDP Education’s foresight has made us stronger and more resilient in an industry that is subject to movements in the political, economic and social spheres of individual countries and geographical regions.
Over the past three years we have seen both traditional and emerging education markets announce ambitious targets to increase their international student intake. This is largely a result of the increasing value placed on the social and economic benefits international students bring their host countries.
Here in Australia, FY16 saw our Federal Government release the National Strategy for International Education 2025, a strategy we both contributed to and welcomed.
Importantly, in acknowledging the $19 billion contribution the sector adds to the Australian economy, this strategy includesrecommendationstoimprovetheexperienceandwelfare of our students with an emphasis on employability and creating a stronger sense of community and connection through alumni networks.
Abroad, we have seen the United States Government expandincentivesforhigh-valuegraduatesintheform of post-study work options for those studying science, technology, engineering and medicine.
New Zealand and Canada also continue to present a welcoming face to international students through strong industry, government and employer cooperation alongside student-friendly policy settings.
Chairman’s letter

05Personal journeys. Global growth.
The impact of the United Kingdom’s decision to leave the European Union remains to be determined; however, it has been pleasing to see the higher education sector in the UK working cohesively to ensure its position as a destination of great quality, heritage and opportunity is maintained.
Staying abreast of these changes is a key priority as it informs how we advise our students.
Our client relations teams based in our study destinations offer us a competitive advantage by working closely with peak bodies, governments and our education clients to make sure our 650 education counsellors have access to information on the latest social, educational and migration policies and trends.
Encouragingly, this year we saw record volume growth across all five of our student placement destinations. Our four newest destination markets delivered a 100% increase in revenue on FY15.
Looking ahead we are confident we can continue this trend as we implement our organic growth strategy, which focuses on developing our teams, enhancing our customer experienceandbroadeningourphysicalnetwork.
Thisyearourglobalnetworkexpandedintothenewmarkets of Bahrain, Italy, Japan, Lebanon and Spain.
Wealsoincreasedourpresenceinexistingmarkets, most notably in China through the acquisition of Promising Education – a Chinese agency with a strong reputation andexpertiseintheUKmarket.
This positions us well to increase our share in China, a market that last year alone saw more than half a million students travel abroad for study.
In line with the increasing role of English as a global language, FY16 was a successful year for our English language testing business stream, the International English Language Testing System (IELTS).
Together with our partners the British Council and Cambridge English Language Assessment, more than 2.7 million IELTS tests were delivered around the world.
These tests results are recognised and trusted by more than 9000 governments, industry bodies and education providers.
Our English language teaching schools also had a promising yearwithstudentsenrolledinmorethan68,000Englishcourses with IDP Education across our 10 campuses in Thailand, Cambodia and Vietnam. This business stream posted a revenue growth of 25% on FY15. Our Cambodian schools were stand-out performers and continue to be market leaders in that country.
Together these three business streams delivered record revenue growth from $309.9m (FY15) to $361.6m (FY16).
Such growth is possible only when our business is underpinnedbyoperationalexcellence.Thisisacredit to the management team and highlights the strong foundations on which the company is built.
IDP Education’s achievements are, however, more than just financial results.
At its core, the purpose of IDP Education is to help international students as they pursue their lifelong learning and career goals.
Our staff are committed to making a difference to our students’ lives and our quality reputation is a reflection of the efforts of many dedicated employees around the globe.
Leading these teams is Andrew Barkla, IDP Education’s newChiefExecutiveOfficerandManagingDirector,whojoined the company during FY16.
AndrewjoinedIDPEducationwithexperienceacross many markets and has a particular passion for customer-led service design and technology.
At the Board level we welcomed three new Directors: ArianeBarker,BelindaRobinsonandChrisLeptosAM.TheyareexcellentadditionstotheBoardandIlook forward to working with them over the coming years.
Finally, I would like to thank you, our shareholders, for your investment in the company and your support of IDP Education.
Iamexcitedbywhatliesaheadasweenterournextphase of growth as an Australian company that is a truly global success story.
Peter Polson Chairman

06 IDP Education Limited Annual Report 2016
In presenting this publication, our first annual report as a listed company on the Australian Securities Exchange (ASX), I am immensely proud of our teams from around the world and the work we do to help people achieve their international education and career goals.
The ASX listing marked a new chapter in IDP Education’s already rich story. Over the past 47 years our organisation has anticipated – and in many instances led – the international education sector’s evolution.
Thisyearwasnoexception.Asthisreportoutlines, FY16 saw strong volume growth across our three service streams; international student placement, English language testing and English language teaching.
This volume growth combined with increases in our average prices delivered strong revenue growth for the year. Our total group revenue was up 17% to $361.6m, marking a record year for our company.
Importantly for shareholders, we were able to flow this top-line growth through to the bottom-line with net profit aftertax(NPAT)increasing27%to$39.9m.
Our key services
Student placement
Over the year we placed students into more than 31,000 courses across Australia, Canada, New Zealand, the United Kingdom and the United States. This represents atotalvolumegrowthof18%onFY15.
OurAustralianvolumesincreasedby8%toover24,000placements, marking our fourth consecutive year of growth. This is in line with the Australian market’s recovery from the 2010 ‘perfect storm’ when tighter visa conditions, a stronger dollar and concerns about student safety saw a sharp drop in Australia’s attractiveness as a study destination.
Our multi-destination strategy delivered strong results for the year with volumes to the UK, the US, Canada and New Zealand up 72% relative to FY15.
The UK was the strongest performing new destination and now represents 13% of our total student volumes followed by the US (5% of total volumes), Canada (3%) and NZ (2%).
Our strong UK growth was supported by the integration of Promising Education, a UK focused Chinese student placement agency we acquired in 2015.
CEO’s review
We deliver services that make a real difference to the lives of young people, their families and their wider communities

07Personal journeys. Global growth.
Our physical network in our key market of India increased its footprint by three offices with our team taking advantage of strong demand for study abroad services in the region.
English language testing
Through our work with our partners, British Council and Cambridge English Language Assessment, IELTS maintained its position as the world’s leading high-stakes English language test for study, work and migration.
IDPEducationadministeredmorethan857,000testsacross 50 countries, including the new markets of Bahrain, Italy, Japan, Lebanon and Spain.
IDPEducation’sIELTSoperationsinAsiaexperiencedstrong growth during the year with India in particular benefiting from surging demand for study and migration into key English-speaking countries.
English language teaching
Reflecting our roots as a not-for-profit originally established to build capacity of educators and students in South East Asia, our English language teaching schools in Cambodia, Thailand and Vietnam remain an integral part of our business.
Thanks to a combination of course innovation and strong performance by our new campus in Cambodia, we delivered 14% more courses during the financial year compared with FY15. This, along with a shift in course prices, resulted in 25% revenue growth.
Our people
These results are a reflection of the commitment and professionalism of our teams from around the world.
Manyofourcustomersaretravellingoverseasforthe first time and rely on our advice and support to make key decisions that will often inform where they study, work and live.
This level of responsibility warrants the best in the business – and we have them.
Ourglobalengagementratingof81%highlightssatisfactionwithin our teams, which in turn helps foster a culture of courage, confidence and continual development.
This culture is validated by our customers, with 90% of our internationally placed students saying they would recommend IDP Education to their family and friends.
Our strategy
With our solid financial foundations, trusted brand and knowledgeable staff, our focus is now on further improving ourcustomerexperience.
Our vision is to build a global platform and connected community to guide international students along their journey to achieve their lifelong learning and career aspirations.
Wehavejustcompletedanextensivereviewtounderstandour current customer journeys, internal capabilities and opportunities for industry disruption.
Resulting from this review is our digital roadmap which will guide the development of new services, and will improve the integration of our face-to-face services with our online channels so that we are even more connected and responsive to the individual needs of our students.
While this roadmap will drive service innovation, this is not new territory for our organisation. We have a strong history of transforming our services in line with global trends and technological advancements. FY16 saw us pilot new systems that deliver improvements in efficiencies and quality control in IELTS.
Similarly, through our work with our IELTS partners, this year we successfully piloted a computer-delivered version of the IELTS test for UK Visa and Immigration purposes.
Our thanks
I would like to thank our Board of Directors for their leadership during this year. I would also like to acknowledge our 50% shareholder, Education Australia, and in turn the Australian university sector, for its ongoing support of IDP Education.
As mentioned, none of these achievements would be possible without our staff and I would like to thank them for their commitment.
Finally, I would like to thank you, our shareholders.
IDPEducationisanexceptionalcompanydeliveringservices that make a real difference to the lives of young people, their families and their wider communities - both in their home countries and study destinations.
We are proud to be a company with such strong purpose and I thank you for backing us and, in turn, our customers.
Andrew Barkla ChiefExecutiveOfficer andManagingDirector

IDP Education Limited Annual Report 201608

Student Placement Services
Student placement Revenue (A$m)
Student placement Gross Profit (A$m)
China 28%
India 16%
Australasia 10%
Vietnam 9%
Hong Kong 5%
Singapore 5%
Malaysia 4%
Rest of Asia 19%
Rest of World 4%
FY15
69.533%
FY16
92.4
FY15
59.032%
FY16
78.2
“Whatever your dreams are you should speak to IDP, they will lay it out on the table
for you and you can move forward.”
Harleen, from India, studying in New Zealand
Personal journeys. Global growth. 09
Our student placement services help international students to find the right course, institution and destination that best suits their study and career goals.
Where can students study?
Students can choose from leading universities and education providers across Australia, Canada, New Zealand, the United Kingdom and the United States.
What is IDP Education’s referral rating?
Nine in 10 students would recommend IDP Education to their family and friends.
What are the top three reasons why students choose IDP Education?
1. They were recommended by family or friends.
2. Our professionalism.
3. We offer a complete range of services.*
FY16 student volumes by source ‘region’
* Source: IDP Education’s 2016 student satisfaction survey

IDP Education Limited Annual Report 201610

English Language Testing
English Language Testing Revenue (A$m)
English Language Testing Gross Profit (A$m)
FY15
213.5 11%
FY16
237.1
FY15
80.518%
FY16
95.1
“IDP Education helped me take a significant step in my career path and made my
IELTS an amazing experience and a wonderful journey. Thank you.”
Mohamed, from Egypt
Personal journeys. Global growth. 11
What is IELTS?
IELTS is the world’s most popular high-stakes English language proficiency test for work, study and migration.
What does it test?
The test covers the four language skills – listening, reading, writing and speaking.
How was it created?
Launchedin1989,thetestwascreated by a consortium of leading language expertsfromtheUKandAustralia.
Who owns the test?
IELTS is jointly owned by IDP Education, the British Council and Cambridge English Language Assessment.
IDP Education 30%
British Council (exChina) 43%
China and joint ventures 27%
* British Council volumes exclude tests conducted in China under licence. Joint ventures include IELTS tests conducted in the United States by IELTS Inc. a joint venture owned equally by the IELTS parties.
The International English Language Testing System (IELTS) is designed to assess the language ability of people who need to study or work where English is the language of communication.
IELTS test volumes by party (FY16)

12 IDP Education Limited Annual Report 2016
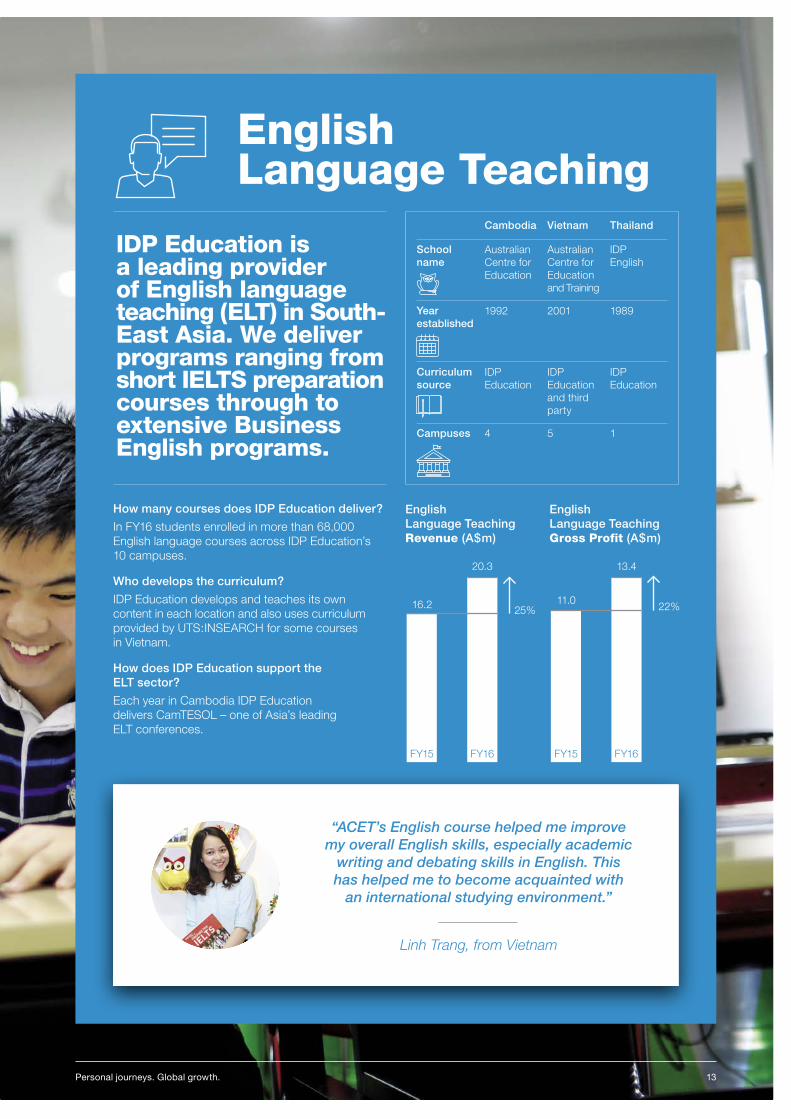
“ACET’s English course helped me improve my overall English skills, especially academic
writing and debating skills in English. This has helped me to become acquainted with
an international studying environment.”
Linh Trang, from Vietnam
English Language Teaching
English Language Teaching Revenue (A$m)
English Language Teaching Gross Profit (A$m)
FY15
16.2 25%
FY16
20.3
FY15
11.022%
FY16
13.4
Personal journeys. Global growth. 13
How many courses does IDP Education deliver?
InFY16studentsenrolledinmorethan68,000English language courses across IDP Education’s 10 campuses.
Who develops the curriculum?
IDP Education develops and teaches its own content in each location and also uses curriculum provided by UTS:INSEARCH for some courses in Vietnam.
How does IDP Education support the ELT sector?
Each year in Cambodia IDP Education delivers CamTESOL – one of Asia’s leading ELT conferences.
Cambodia Vietnam Thailand
School name
Australian Centre for Education
Australian Centre for Education and Training
IDP English
Year established
1992 2001 1989
Curriculum source
IDP Education
IDP Education and third party
IDP Education
Campuses 4 5 1
IDP Education is a leading provider of English language teaching (ELT) in South-East Asia. We deliver programs ranging from short IELTS preparation courses through to extensive Business English programs.

14 IDP Education Limited Annual Report 2016
Peter Polson
Non-ExecutiveDirector and Chairman
Peter was appointed as aNon-ExecutiveDirector at IDP Education in March2007.
Peterhasbroadexperiencein the financial services industry. He has held positionsasManagingDirector of the international funds management business with the Colonial Group, and then as anexecutivewiththeCommonwealth Banking Group. In this role he had responsibility for all investment and insurance services, including the group’s funds management, master funds, superannuation and insurance businesses and third party support services for brokers, agents and financial advisers.
He is Chairman of Challenger Limited, Challenger Life Company Limited, Avant Group Insurance Limited and Very Special Kids.
He is also a Director ofAvantMutualGroupLimited and Avant Group Holdings Limited.
Andrew Barkla
ChiefExecutiveOfficer andManagingDirector
Andrew was appointed ChiefExecutiveOfficerandManagingDirectoratIDPEducation in August 2015.
Andrewhasextensiveexperienceinthetechnology,services and software industry, with more than 20 years of senior management experienceinrolesacrossAustralia, New Zealand, Asia and North America.
Prior to joining IDP Education, Andrew worked for SAP as President of Australia and New Zealand.
Prior to his role at SAP, Andrew held leadership roles at Unisys, including as Vice-President of Unisys’ Asia Pacific Japan operations covering 13 countries, as MemberofUnisys’GlobalExecutiveCommitteeand as Chairman of Unisys West, a technology services joint venture between BankWest and Unisys.
Earlier in his career, Andrew was Vice-President andGeneralManager of PeopleSoft’s Asia Pacific region prior to the company’s acquisition by Oracle.
Ariane Barker
Ariane was appointed as aNon-ExecutiveDirector at IDP Education at the completion of its IPO in November 2015 and is Chair of the Audit and Risk Committee.
Ariane heads the Products &Marketsdivisionatwealthmanagement firm JB Were. She is a member of the MurdochChildrensResearchInstitute(MCRI)Investment Committee and Development Board as well asaformerBoardMemberof Emergency Services and State Super (ESSSuper).
Arianehasextensiveexperienceininternationalfinance, risk management, and debt and equity capital markets, having worked in executiveroleswithMerrillLynch, Goldman Sachs and HSBC in the United States, Europe, Japan and Hong Kong.
Ariane is a graduate and member of the Australian Institute of Company Directors (AICD).
Board of Directors
15Personal journeys. Global growth.
David Battersby AM
David was appointed as aNon-ExecutiveDirector at IDP Education in February 2011.
He was appointed Vice-Chancellor of Federation University Australia in early 2014 and was previously Vice-Chancellor of the University of Ballarat, a position to which he was appointed in 2006.
David’s previous senior appointments have been at universities in Australia and New Zealand. He has undertaken consultancies for UNESCO, the OECD and various government agencies.
He was foundation Chair of the Australian Regional Universities Network and theboardoftheMuseum of Australian Democracy at Eureka and is currently on the board of directors fortheMelbourneInstituteof Technology.
David is also Chair of the Board of Education Australia.
Belinda Robinson
Belinda was appointed asaNon-ExecutiveDirector at IDP Education in November 2015.
BelindaisChiefExecutiveandExecutiveDirectorofUniversities Australia, the peak body representing Australia’s 39 comprehensive universities. She is also a Director of The Conversation MediaGroupandEducationAustralia. Belinda is a highly qualified company director with more than two decades’ experiencesittingonASX-listed, government and NGO boards and committees.
Belindahasextensiveknowledgeandexperiencein higher education policy, government processes, political advocacy, corporate governance, and remuneration. Belinda has beentheChiefExecutive of peak industry bodies for more than 15 years and has held a number of senior andseniorexecutivepositions within the Federal Australian Government, including eight years with the Department of the PrimeMinisterandCabinet.
BelindahasaMaster of Environmental Law (Australian National University); a Bachelor of Arts (University of New England); is a long-standing graduate member of the Australian Institute of Company Directors and has completed the AICD Chair’sMentoringProgram.
Chris Leptos AM
Chris was appointed as aNon-ExecutiveDirector at IDP Education in November 2015.
His other Board roles include Deputy Chairman of Flagstaff Partners,andNon-ExecutiveDirector of PPB Advisory and Arete Capital Partners. Chris retired as Deputy Chairman ofLinkingMelbourneAuthority in December 2015. He is also a member of the Australian Research Industry Advisory Board, the Advisory Board of The University ofMelbourneFacultyofBusiness & Economics, the Advisory Council of Asialink, a Professorial Fellow at MonashUniversity,aGovernor of The Smith Family and a Fellow of the AICD.
Chris was previously a Senior PartnerwithKPMGandManagingPartnerGovernment at Ernst & Young where he had national responsibility for leading the public sector and higher education practice.
Earlier in his career, Chris wasGeneralManagerofCorporate Development for WesternMiningCorporationand Chief of Staff to Senator John Button. He was a member of the Infrastructure Planning Council of Victoria and the Australian Information Economy Advisory Council.
Chris has lived and worked in Jakarta, Shanghai, London and Toronto, and in 2000 he wasdesignatedaMember of the Order of Australia for services to business and the community.
Greg West
Greg was appointed asaNon-Executive Director of IDP Education in December 2006.
Greg is a Chartered Accountantwithexperiencein investment banking and financial services. Greg isChiefExecutiveOfficer of the ASX listed biotech, Benitec Biopharma Limited.
He is a Director and Chair of the Audit Committee of UOWD Limited (a business arm of Wollongong University).
Previously, he has worked at Price Waterhouse and has held senior financeexecutiveroles in investment banking with Bankers Trust, Deutsche Bank, NZI and other financial institutions.
Greg is also a Director of Education Australia.

16 IDP Education Limited Annual Report 2016
CONTENTS
Directors’ Report 17
Remuneration Report 29
Auditor’s independence declaration 47
Consolidated statement of profit or loss 48
Consolidated statement of comprehensive income 49
Consolidated statement of financial position 50
Consolidated statement of changes in equity 51
Consolidated statement of cash flow 52
Notes to the consolidated financial statements 53
1. Basis of preparation 53
Financial Performance 56
2. Segment information 56
3. Revenue 57
4. Expenses 58
5. Income taxes 59
6. Dividends 63
7. Earnings per share 63
Assets and liabilities 64
8. Trade and other receivables 64
9. Capitalised development costs 65
10. Property, plant and equipment 66
11. Intangible assets 67
12. Other current assets 69
13. Trade and other payables 70
14. Deferred revenue 70
15. Provisions 70
Capital structure and financing 72
16. Cash flow information 72
17. Lease commitments 73
18. Contributed equity 73
19. Financial instruments 74
Other notes 80
20. Share-based payments 80
21. Related party transactions 84
22. Remuneration of auditors 85
23. Subsidiaries 86
24. Parent entity information 87
25. Contingent liabilities 87
26. Events after the reporting period 87
Directors’ declaration 88
Independent auditor’s report 89
Shareholder Information 91
Corporate Directory 93
Directors’ Report

17Personal journeys, global growth
The Directors of IDP Education Limited, present the financial report of IDP Education Limited (the Company) and its controlled entities (the Group or IDP Education) for the financial year ended 30 June 2016.
OPERATING AND FINANCIAL REVIEWReview of Operations
A summary of IDP Education’s consolidated financial results for the year ending 30 June 2016 (“FY16”) is set out below. The financial performance of the Group during the year was strong with record annual revenue and earnings being recorded by IDP Education for the full year.
The results were produced in a year in which the Company successfully completed its Initial Public Offering (“IPO”) and listing on the Australian Securities Exchange (“ASX”). IDP Education Limited commenced trading on the ASX on 3 December 2015.
Summary Financials (A$m)
Growth
Unit FY16 FY15 $m %
Total Revenue A$m 361.6 309.9 51.7 16.7%
Gross Profit A$m 188.4 152.8 35.6 23.3%
EBIT A$m 53.7 45.2 8.5 18.8%
NPAT A$m 39.9 31.5 8.4 26.7%
EPS cents 16.0 12.6 3.4 27.0%
Net Debt A$m 0.0 0.0 – –
The performance of the Group in FY16 represents a continuation of the strong organic growth that the Group has been experiencing over the past five years. This growth has been underpinned by the ongoing global growth in the international education industry and the central role of English as a key global language. The Group has a global footprint and diversified business model that benefits from both of these global trends.
From an international education perspective the key macro drivers remained supportive during FY16. IDP Education’s key destination market for student placement – Australia – has recovered strongly from the downturn that commenced in FY10 with government policies now supporting the attractiveness of Australia as a destination for international students. The favourable regulatory settings combined with Australia’s continued reputation for high quality education and a safe and friendly living environment underpins its appeal as a destination for international students.
Similarly, the Canadian and New Zealand markets are benefitting from open and inviting regulatory settings with government policies designed to attract international students to these countries. IDP Education has benefited from this dynamic with student placement volumes to these destinations rising strongly during FY16.
The UK remains challenging from a regulatory perspective with relatively restrictive immigration policies impacting the flow of international students. As a result, the UK market in aggregate has seen a slight decline in total international student volumes but the higher quality globally recognised universities continue to record increases in international student volumes. Despite the generally restrictive regulatory settings, IDP Education has recorded strong growth in UK student volumes during the year reflecting an increased market share across its source countries and a focus on the quality end of the higher education spectrum.
Despite attracting the largest number of international students globally, the US market remains the most underpenetrated with international students representing less than five per cent of total tertiary students in the US. The US market remains relatively immature in its approach to the recruitment of international students and as a result usage of agents remains low compared to the markets such as the UK and Australia. IDP Education’s penetration of the US market therefore remains low but signs of increased agent engagement bodes well for longer term growth.
IDP Education’s English language testing business continues to benefit from the increased global mobility of students, workers and migrants to the main English speaking countries. The number of IELTS tests conducted by the Group in each period is however influenced by a diverse and complex range of microeconomic factors across the 50 countries in which it

Directors’ Report
continued
18 IDP Education Limited Annual Report 2016
administers IELTS tests. As a result the performance of the Group’s IELTS operations is influenced by factors such as: economic conditions in the local economy; demand for overseas study and work; immigration policies and visa settings by the key English speaking countries, and currency fluctuations. Competition is also a key factor and the recognition by governments and other organisations of alternative English tests also influences IELTS test volumes.
The following sections provide commentary on the financial results for the year and describe the key operational drivers that generated the outcome for each geographic segment and product. At a group wide level the operational highlights included:
> 857,170 IELTS tests were administered by the Group during the year representing growth of 3.8% on FY15
> IDP Education placed students into 31,367 courses across its five destination countries (Australia, UK, USA, Canada and New Zealand)
> Student placement volumes into Australian courses rose 7.6% relative to FY15 representing a continuation of the rebound in student flows experienced by Australia over the last three years
> IDP Education’s multi-destination student placement volumes rose 71.4% with students placed into 7,223 courses across the UK, USA, Canada and New Zealand
> IDP Education continued to expand its client portfolio with an additional 30 institutions becoming clients of the company during the year
> IDP Education’s English Language Teaching business conducted 68,846 courses across Cambodia, Thailand and Vietnam. This represented a strong 14.1% increase on FY15
IDP Education views and manages its business on a geographic basis. Country and regional management are responsible for all activities in their geographic region across each of the Group’s key products (Student Placement, English Language Testing and English Language Teaching). As a result the Group’s key reporting segments comprise geographic regions. The sections below discuss IDP Education’s results across its three geographic regions.
Asia
The table below shows IDP Education’s results across its Asian region which includes the following countries: Bangladesh, Cambodia, China, Hong Kong, India, Indonesia, Laos, Malaysia, Mauritius, Philippines, Singapore, South Korea, Sri Lanka, Taiwan, Thailand and Vietnam.
Asia Segment – Financial Summary
Growth
Unit FY16 FY15 $m %
Total Revenue A$m 220.3 163.3 57.0 34.9%
EBIT A$m 64.1 46.8 17.3 37.0%
EBIT Margin % 29% 29%
% of Total Group Revenue % 61% 53%
% of Total Group EBIT (Excl Corporate Overhead) % 66% 56%
Asia recorded strong growth across each product line with the region now representing more than 66% of total group EBIT (excluding corporate overhead). India and China were the stand-out performers during FY16 with combined revenue growth of 50%.
In India, IDP Education’s student placement business saw very strong growth to the Australian, US and Canadian markets. Whilst only a small contributor to the overall result the increasing attractiveness of New Zealand for Indian students also supported the result. To take advantage of the growth in India, IDP Education opened 3 new student placement offices during the year in Visakhapatnam, Surat and Thane. IDP Education now has 21 student placement offices in India and is one of the leading international student placement companies in that country.
India also recorded strong IELTS volume growth with FY16 representing the 4th straight year of double digit growth for the country. Test volumes in India have been driven by ongoing demand for overseas study as well as high levels of outbound migration. Canada has become a key destination for Indian migration and IDP Education’s IELTS test volumes in India have

19Personal journeys, global growth
benefited from this dynamic given IELTS is recognised by the Canadian government as one of only two tests accepted for visa purposes.
In China, IDP Education continues to benefit from the ongoing demand for overseas study by Chinese students and their parents. Growth in IDP Education’s student placement volumes from China was strongest to Australia and the UK. UK volumes in turn benefited from a full year contribution from Promising Education – a small UK focussed China placement agency that was acquired in April 2015. This business was successfully integrated during FY16 resulting in strong volumes to the UK in the main October/November intake.
In China, IDP Education has granted the British Council a licence to distribute IELTS. As consideration, the Group receives a fee from the British Council which is calculated as a percentage of each candidate’s IELTS test fee for IELTS tests taken in China. The British Council recorded solid volume growth in IELTS testing in China during FY16 which therefore contributed to IDP Education’s earnings in its Asia segment.
IDP Education reached an important milestone in Sri Lanka during the year when it completed the conversion of its third-party licensed operations in that country into a 100% owned IDP Education entity. Sri Lanka is a promising market for both student placement and IELTS and full control of that operation is expected to give IDP Education additional flexibility to take advantage of growth opportunities in the future.
In English Language Teaching, IDP Education’s Cambodian business performed very strongly. Operating as the “Australian Centre for Education”, this business opened its fourth campus in December 2014 in response to growing demand. The full year contribution of this new facility along with continued organic growth across the other campuses drove record revenue and earnings for Cambodia in FY16.
Australasia
The table below shows IDP Education’s results across its Australasian region which includes the following countries: Australia, Fiji, New Caledonia and New Zealand.
Australasia Segment – Financial Summary
Growth
Unit FY16 FY15 $m %
Total Revenue A$m 70.4 83.4 –13.0 –15.6%
EBIT A$m 19.8 24.9 –5.1 –20.5%
EBIT Margin % 28% 30%
% of Total Group Revenue % 19% 27%
% of Total Group EBIT (Excl Corporate Overhead) % 20% 30%
The performance of the Australasian segment during FY16 was impacted by the introduction of competition in the English Language Testing market in Australia. Since April 2015 the Department of Immigration and Border Protection (DIBP) has accepted test results from a number of competing test providers for all Australian visa categories. The introduction of competition in Australia removed what was previously an exclusive market for IELTS and has resulted in reduced testing volumes and revenue for IDP Education during FY16.
Whilst IELTS testing in Australia represents the majority of the revenue and earnings in this segment, IDP Education also operates an on-shore student placement business which counsels and advises international students that are already in Australia on further or alternative study options. This business had a small decline in earnings during FY16 with the overall pool of on-shore students in Australia below the levels recorded in FY15. This added to the decline in earnings from lower IELTS tests and contributed to the relatively weak result for Australasia.
Rest of World
The table below shows IDP Education’s results across the Rest of World region which includes: Argentina, Azerbaijan, Bahrain, Brazil, Canada, Colombia, Egypt, Germany, Austria, Iran, Italy, Jordan, Kazakhstan, Kuwait, Mexico, Oman, Pakistan, Qatar, Russia, Saudi Arabia, South Africa, Spain, Ukraine, the United Arab Emirates and Turkey.

Directors’ Report
continued
20 IDP Education Limited Annual Report 2016
Rest of World Segment – Financial Summary
Growth
Unit FY16 FY15 $m %
Total Revenue A$m 71.0 63.2 7.8 12.3%
EBIT A$m 13.9 12.1 1.8 14.9%
EBIT Margin % 20% 19%
% of Total Group Revenue % 20% 20%
% of Total Group EBIT (Excl Corporate Overhead) % 14% 14%
The majority of revenue and earnings in this segment relates to IELTS testing. Student placement is a relatively small contributor to this segment with the activities currently limited to the Middle East countries, Germany and Austria.
Growth in IELTS volumes in Rest of World benefited from a strong performance by Canada where both international student and migration flows underpinned on-shore testing volumes in that country. IDP Education has historically conducted testing in Canada via a network of third party testing centres. To take advantage of the continued growth in Canada, IDP Education opened its own testing unit in Toronto during the year. This new facility enhances the Group’s capabilities and leadership position in the Canadian market and will enable it to take advantage of further volume growth in this market in the future.
IDP Education’s volumes across the Middle East declined in FY16. The weak oil price and political instability in parts of the region impacted economic activity and reduced the flow of both privately funded and government scholarship students which are key drivers of IELTS testing volumes.
Political instability and currency weakness in parts of Eastern Europe also impacted IELTS volumes in Ukraine, Russia, Azerbaijan and Kazakhstan, recording lower volumes relative to FY15.
Results by Product
To aid the reader’s understanding of the Group’s results, IDP Education has also prepared financial results by a secondary segment which shows revenue and gross profit by service. The analysis below discusses the operational and financial highlights for each of IDP Education’s products.
Student Placement – Operational and Financial Summary
Growth
Unit FY16 FY15 Unit %
Volumes
— Australia 000’s 24.2 22.5 1.7 7.6%
— Multi-Destination 000’s 7.2 4.2 3.0 71.4%
— Total Volumes 000’s 31.4 26.7 4.7 17.6%
Revenue
— Australia A$m 65.4 56.1 9.3 16.6%
— Multi-Destination A$m 27.0 13.4 13.6 101.5%
— Total Revenue A$m 92.4 69.5 22.9 32.9%
Gross Profit A$m 78.2 59.0 19.2 32.5%
Gross Profit Margin % 85% 85%
Average Fee (A$)
— Australia A$ 2,711 2,492 219 8.8%
— Multi-destination A$ 3,735 3,189 546 17.1%
— Total A$ 2,947 2,602 345 13.3%
Note: The Average Fee for Student Placement shown in this table is calculated as total Student Placement revenue divided by the number of courses IDP Education enrolled students into at its client education institutions during the period. Total Student Placement revenue includes all revenue associated with all placements including any revenue received from the student. Volume data to calculate the Average Fee only includes IDP Education client education institution course enrolments and excludes course enrolment volumes at education institutions that are not clients of IDP Education.

21Personal journeys, global growth
Student placement volumes rose by 17.6% in FY16 with volumes to each of IDP Education’s destinations significantly higher than in FY15. Volumes to Australia rose 7.6% recording the fourth straight year of growth after the declines of FY10 – FY12 when tighter visa conditions, a stronger Australian dollar and concerns about international student safety saw a sharp drop in the attractiveness of Australia as an international study destination.
IDP Education’s multi-destination strategy delivered strong results for the year with volumes to the UK, USA, Canada and New Zealand up 71.4% relative to FY15. The UK was the strongest performer and now represents 13% of IDP’s total student volumes followed by the US (5%), Canada (3%) and NZ (2%). A number of source countries contributed to this strong growth with China and India being stand-out performers, mirroring the global significance of these countries in the international student market.
The average student placement fee across student placement rose 13.3% relative to that recorded in FY15. A range of factors contributed to this increase, including:
> Higher underlying tuition fees, of which IDP Education takes a percentage for each successful placement;
> A change in course mix between high fee and low fee paying courses;
> An increased contribution from multi-destination placements where the A$ equivalent fee is generally higher than for Australian placements;
> A generally weaker Australian dollar which boosted the A$ equivalent fee from the multi-destination countries, and
> Strong growth in China where students are charged a fee for the counselling process. Growth in this increases the average fee given the student’s successful placement is not recorded as volume until a future period.
English Language Testing – Operational and Financial Summary
Growth
Unit FY16 FY15 Unit %
Volumes 000’s 857.2 825.9 31.3 3.8%
Revenue A$m 237.1 213.5 23.6 11.1%
Gross Profit A$m 95.1 80.5 14.6 18.1%
Gross Profit Margin % 40% 38%
Average Fee A$ 276.6 258.5 18.1 7.0%
The Average Fee for English Language Testing is the average of all English Language Testing revenue divided by the total number of IELTS tests conducted during the period.
In English Language Testing, IDP Education’s IELTS volumes rose 3.8% in FY16 reflecting the benefits of a broadly diversified global portfolio of testing locations and recognising organisations. As noted earlier in this section IDP Education’s IELTS operations in Asia experienced strong growth during the year with India in particular benefiting from surging demand for migration into key English speaking countries.
Volume and revenue growth was lower than previous years with the impact of competition in Australia offsetting solid growth recorded elsewhere in IDP Education’s network of approximately 400 testing locations in over 50 countries. The increase in the average fee reflected a combination of price increases and foreign exchange movements.
English Language Teaching – Operational and Financial Summary
Growth
Unit FY16 FY15 Unit %
Courses 000’s 68.8 60.3 8.5 14.1%
Revenue A$m 20.3 16.2 4.1 25.3%
Gross Profit A$m 13.4 11.0 2.4 21.8%
Gross Profit Margin % 66% 68%
Average Course Fee A$ 294.9 268.3 26.6 9.9%
Directors’ Report
continued
22 IDP Education Limited Annual Report 2016
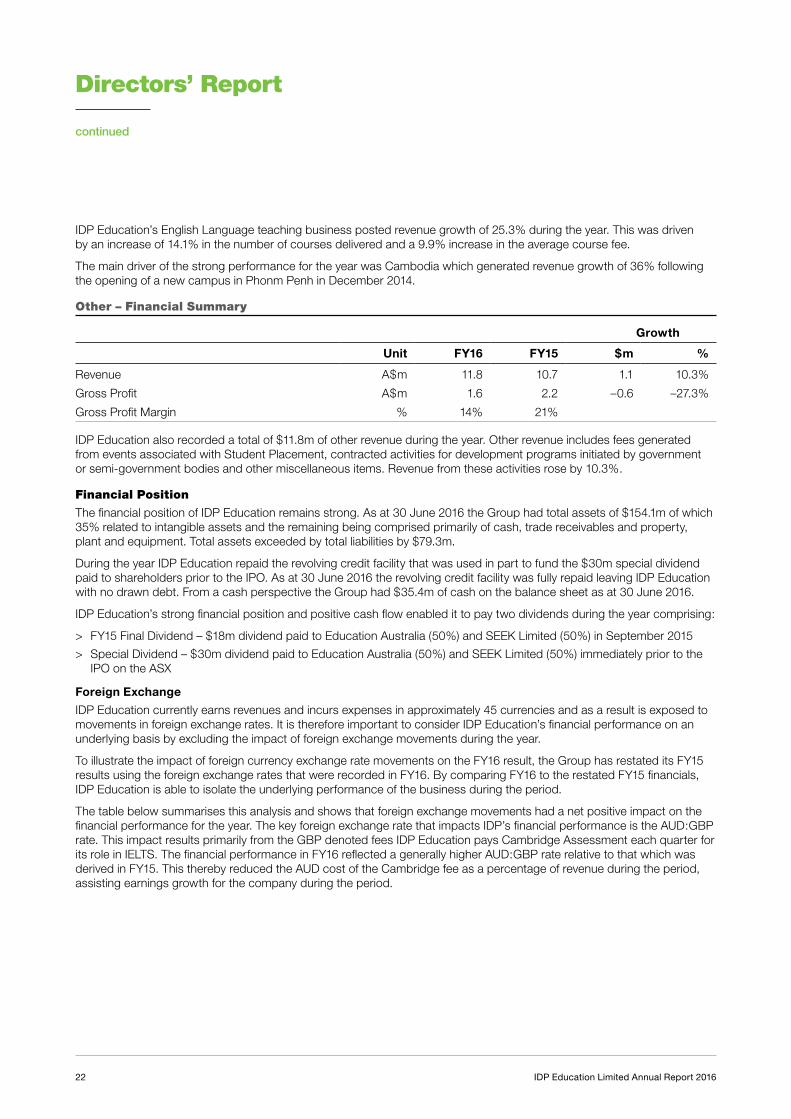
IDP Education’s English Language teaching business posted revenue growth of 25.3% during the year. This was driven by an increase of 14.1% in the number of courses delivered and a 9.9% increase in the average course fee.
The main driver of the strong performance for the year was Cambodia which generated revenue growth of 36% following the opening of a new campus in Phonm Penh in December 2014.
Other – Financial Summary
Growth
Unit FY16 FY15 $m %
Revenue A$m 11.8 10.7 1.1 10.3%
Gross Profit A$m 1.6 2.2 –0.6 –27.3%
Gross Profit Margin % 14% 21%
IDP Education also recorded a total of $11.8m of other revenue during the year. Other revenue includes fees generated from events associated with Student Placement, contracted activities for development programs initiated by government or semi-government bodies and other miscellaneous items. Revenue from these activities rose by 10.3%.
Financial Position
The financial position of IDP Education remains strong. As at 30 June 2016 the Group had total assets of $154.1m of which 35% related to intangible assets and the remaining being comprised primarily of cash, trade receivables and property, plant and equipment. Total assets exceeded by total liabilities by $79.3m.
During the year IDP Education repaid the revolving credit facility that was used in part to fund the $30m special dividend paid to shareholders prior to the IPO. As at 30 June 2016 the revolving credit facility was fully repaid leaving IDP Education with no drawn debt. From a cash perspective the Group had $35.4m of cash on the balance sheet as at 30 June 2016.
IDP Education’s strong financial position and positive cash flow enabled it to pay two dividends during the year comprising:
> FY15 Final Dividend – $18m dividend paid to Education Australia (50%) and SEEK Limited (50%) in September 2015
> Special Dividend – $30m dividend paid to Education Australia (50%) and SEEK Limited (50%) immediately prior to the IPO on the ASX
Foreign Exchange
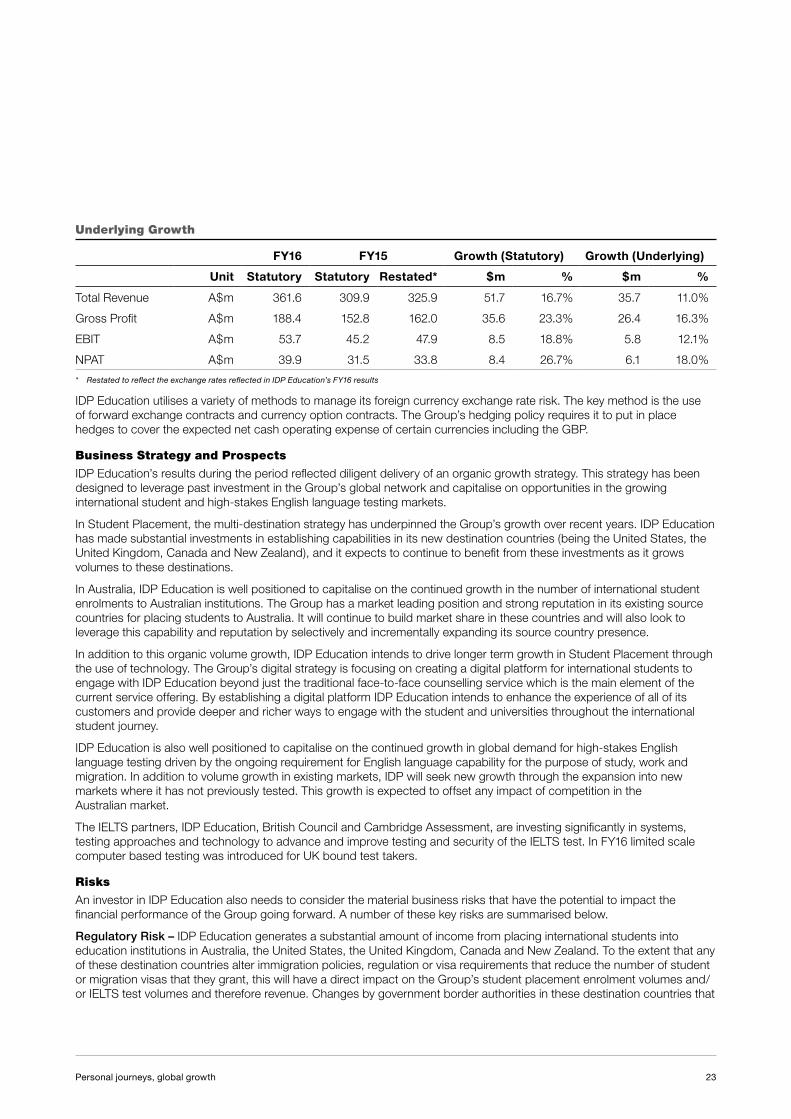
IDP Education currently earns revenues and incurs expenses in approximately 45 currencies and as a result is exposed to movements in foreign exchange rates. It is therefore important to consider IDP Education’s financial performance on an underlying basis by excluding the impact of foreign exchange movements during the year.
To illustrate the impact of foreign currency exchange rate movements on the FY16 result, the Group has restated its FY15 results using the foreign exchange rates that were recorded in FY16. By comparing FY16 to the restated FY15 financials, IDP Education is able to isolate the underlying performance of the business during the period.
The table below summarises this analysis and shows that foreign exchange movements had a net positive impact on the financial performance for the year. The key foreign exchange rate that impacts IDP’s financial performance is the AUD:GBP rate. This impact results primarily from the GBP denoted fees IDP Education pays Cambridge Assessment each quarter for its role in IELTS. The financial performance in FY16 reflected a generally higher AUD:GBP rate relative to that which was derived in FY15. This thereby reduced the AUD cost of the Cambridge fee as a percentage of revenue during the period, assisting earnings growth for the company during the period.
23Personal journeys, global growth
Underlying Growth
FY16 FY15 Growth (Statutory) Growth (Underlying)
Unit Statutory Statutory Restated* $m % $m %
Total Revenue A$m 361.6 309.9 325.9 51.7 16.7% 35.7 11.0%
Gross Profit A$m 188.4 152.8 162.0 35.6 23.3% 26.4 16.3%
EBIT A$m 53.7 45.2 47.9 8.5 18.8% 5.8 12.1%
NPAT A$m 39.9 31.5 33.8 8.4 26.7% 6.1 18.0%
* Restated to reflect the exchange rates reflected in IDP Education’s FY16 results
IDP Education utilises a variety of methods to manage its foreign currency exchange rate risk. The key method is the use of forward exchange contracts and currency option contracts. The Group’s hedging policy requires it to put in place hedges to cover the expected net cash operating expense of certain currencies including the GBP.
Business Strategy and Prospects
IDP Education’s results during the period reflected diligent delivery of an organic growth strategy. This strategy has been designed to leverage past investment in the Group’s global network and capitalise on opportunities in the growing international student and high-stakes English language testing markets.
In Student Placement, the multi-destination strategy has underpinned the Group’s growth over recent years. IDP Education has made substantial investments in establishing capabilities in its new destination countries (being the United States, the United Kingdom, Canada and New Zealand), and it expects to continue to benefit from these investments as it grows volumes to these destinations.
In Australia, IDP Education is well positioned to capitalise on the continued growth in the number of international student enrolments to Australian institutions. The Group has a market leading position and strong reputation in its existing source countries for placing students to Australia. It will continue to build market share in these countries and will also look to leverage this capability and reputation by selectively and incrementally expanding its source country presence.
In addition to this organic volume growth, IDP Education intends to drive longer term growth in Student Placement through the use of technology. The Group’s digital strategy is focusing on creating a digital platform for international students to engage with IDP Education beyond just the traditional face-to-face counselling service which is the main element of the current service offering. By establishing a digital platform IDP Education intends to enhance the experience of all of its customers and provide deeper and richer ways to engage with the student and universities throughout the international student journey.
IDP Education is also well positioned to capitalise on the continued growth in global demand for high-stakes English language testing driven by the ongoing requirement for English language capability for the purpose of study, work and migration. In addition to volume growth in existing markets, IDP will seek new growth through the expansion into new markets where it has not previously tested. This growth is expected to offset any impact of competition in the Australian market.
The IELTS partners, IDP Education, British Council and Cambridge Assessment, are investing significantly in systems, testing approaches and technology to advance and improve testing and security of the IELTS test. In FY16 limited scale computer based testing was introduced for UK bound test takers.
Risks
An investor in IDP Education also needs to consider the material business risks that have the potential to impact the financial performance of the Group going forward. A number of these key risks are summarised below.
Regulatory Risk – IDP Education generates a substantial amount of income from placing international students into education institutions in Australia, the United States, the United Kingdom, Canada and New Zealand. To the extent that any of these destination countries alter immigration policies, regulation or visa requirements that reduce the number of student or migration visas that they grant, this will have a direct impact on the Group’s student placement enrolment volumes and/or IELTS test volumes and therefore revenue. Changes by government border authorities in these destination countries that

Directors’ Report
continued
24 IDP Education Limited Annual Report 2016
decrease or remove the acceptance of IELTS, increase competition from other providers or change the way that tests are administered, could also have a material and adverse impact on IDP Education’s financial position and performance.
Geopolitical – Political events and tension, unfavourable press, negative international relations and other international events may reduce the attractiveness of particular destination countries for students and other migrants originating from particular source countries. Any future circumstances which reduce the attractiveness of a particular destination country to foreign students or other migrants may have a material and adverse impact on IDP Education’s financial position and performance.
Risks of Operating a Global company – The global footprint which IDP Education operates across is exposed to regulatory, operating and management complexities and risks. There are certain risks inherent in doing business in foreign jurisdictions such as unexpected changes in legal and regulatory requirements, difficulties in managing foreign operations, longer payment cycles, problems in collecting accounts receivable, political instability, expropriation, nationalisation, the application of sanctions, embargoes or export and trade restrictions and war. There may also be foreign exchange controls which restrict or prohibit repatriation of funds and prohibitions and delays from customers or government agencies. These issues may arise from time to time, in the foreign jurisdictions in which IDP Education operates, which could have a material and adverse impact on the Group’s financial position and performance.
Competition – IDP Education operates in highly competitive markets across all of its geographies and products. IELTS in particular competes with a number of alternative high-stakes English language tests and, in some jurisdictions, IDP Education competes with the British Council as a distributor of IELTS. The following factors have the potential to reduce the number or profitability of IELTS tests that are conducted by the Group and therefore could have a material and adverse impact on IDP Education’s financial position and performance: (i) the cost of sitting alternative high-stakes English language tests being lower than that for IELTS; (ii) increased acceptance by destination education institutions and immigration departments of alternative high-stakes English language tests; (iii) an increase in the number of testing centres, and times, at which alternative high-stakes English language tests can be taken; (iv) alternative high-stakes English language tests being marked in quicker timeframes when compared to those for IELTS; or (v) alternative high-stakes English language tests being perceived to be fairer and/or more suited to people whose first language is not English.
Relationship with Education Australia
Education Australia, which represents 38 Australian universities, owns approximately 50% of the Shares of IDP Education Limited. The Constitution of IDP Education Limited requires that:
> For such time as Education Australia is registered as the holder of at least 10% of the voting securities in the Company (Securities), a majority of the Board is to comprise, collectively, Independent Directors (as defined in the Constitution) and representatives of Education Australia; or
> If at any time Education Australia ceases to hold at least 10% of the Securities, a majority of the Board is to comprise Independent Directors only
Accordingly, there exists the potential for Education Australia to exert a significant degree of influence over IDP Education’s management and affairs and over matters requiring Shareholder approval, including (among other things) the election of Directors and the approval of significant corporate transactions.

25Personal journeys, global growth
DIRECTORSThe following persons were Directors of IDP Education Limited during the financial year and up to the date of this report unless otherwise stated:
Name Particulars
Peter Polson Non-Executive Director and Chairman
Andrew Barkla Managing Director and Chief Executive Officer (appointed on 17 August 2015)
Ariane Barker Non-Executive Director (appointed on 12 November 2015)
Professor David Battersby AM
Non-Executive Director
Chris Leptos AM Non-Executive Director (appointed on 12 November 2015)
Belinda Robinson Non-Executive Director (appointed on 12 November 2015)
Greg West Non-Executive Director
Eddie Collis Non-Executive Director (resigned on 12 November 2015)
Professor Greg Hill Non-Executive Director (resigned on 12 November 2015)
Michael Ilczynski Non-Executive Director (resigned on 12 November 2015)
Joe Powell Non-Executive Director (resigned on 12 November 2015)
Andrew J Thompson Managing Director and Chief Executive Officer (resigned on 14 August 2015)
Details of each director’s qualifications, experience and special responsibilities are set out on page 14 to 15.
COMPANY SECRETARYThe Company Secretary is Murray Walton, who is also the Chief Financial Officer of the Group. Murray Walton is a member of Chartered Accountants Australia and New Zealand.

Directors’ Report
continued
26 IDP Education Limited Annual Report 2016
MEETINGS OF DIRECTORSThe following table sets out the number of meetings (including meetings of committees of directors), held for the year and the number of meetings attended by each Director.
BoardAudit and Risk
Committee
Nomination and Remuneration
Committee
Attended Held Attended Held Attended Held
Peter Polson 7 7 4 4 1 1
Andrew Barkla 7 7 – – – –
Ariane Barker 4 5 3 4 1 1
Professor David Battersby AM 7 7 2 2 – –
Chris Leptos AM 5 5 – – 1 1
Belinda Robinson 5 5 – – – –
Greg West 7 7 6 6 – –
Eddie Collis 2 2 2 2 – –
Michael Ilczynski 1 2 – – – –
Joe Powell 2 2 – – – –
PRINCIPAL ACTIVITIESThe Group’s principal activities during the year were:
> Placement of international students into education institutions in Australia, UK, USA, Canada and New Zealand. Services include counselling, application processing and pre-departure guidance;
> Distribution and administration of International English Language Testing System (“IELTS”) tests, a globally recognised high-stakes English language test for study, work and migration purposes. IDP Education is a co-owner of IELTS with the British Council and Cambridge Assessment; and
> Operation of English language schools in Vietnam, Cambodia and Thailand
There was no significant change in the nature of these activities during the year.
LISTINGIDP Education Limited listed on the Australian Securities Exchange (ASX) on 26 November 2015. A diversified group of institutional and retail shareholders, both domestic and international, acquired stock in the Company at the listing.
A share split took place prior to the Initial Public Offering in the financial year period ended 30 June 2016, whereby an additional 82 shares were issued for every one existing share. In addition to the share split, two additional shares were issued during the Initial Public Offering, which increased the number of shares on issue to 250,294,968.
SIGNIFICANT CHANGES IN STATE OF AFFAIRSAppointment of Chief Executive Officer and Directors
Andrew Barkla was appointed as Chief Executive Officer and Managing Director at IDP Education in August 2015. Andrew has extensive experience in the technology, services and software industry, with over 20 years of senior management experience in roles across Australia, New Zealand, Asia and North America.
Ariane Barker, Belinda Robinson and Chris Leptos AM were appointed as Non-Executive Director at IDP Education in November 2015. Please refer to page 14 to 15 for Directors’ experience, qualifications and expertise.

27Personal journeys, global growth
FUTURE DEVELOPMENTSLikely developments in, and expected results of the operations of the Group in subsequent years are referred to elsewhere in this report particularly on page 23 except to the extent disclosure of the information would be likely to result in unreasonable prejudice to the Group. The type of information not disclosed includes commercial in confidence information such as detailed operational plans and strategies that would provide third parties with a commercial advantage.
DIVIDENDSOn 16 November 2015, a special dividend of $9.95 per share amounting to $30m was paid to Education Australia Limited and Seek Investment Pty Ltd. In line with our disclosure in the prospectus lodged with the Australian Securities and Investments Commission in November 2015, no interim dividend was declared before 30 June 2016.
A dividend of 5.5 cents per share franked at 35% was declared on 24 August 2016, payable on 30 September 2016 to shareholders registered on 8 September 2016.
EVENTS SUBSEQUENT TO BALANCE DATENo significant events have occurred since the balance date.
DIRECTORS’ INTERESTS IN SECURITIESThe relevant interests of Directors in the Company’s securities at the date of this report were:
Ordinary Shares Options
Performance Rights
Peter Polson 37,735 – 106,655
Andrew Barkla – 4,150,000 324,447
Ariane Barker 18,867 – –
Professor David Battersby AM – – –
Chris Leptos AM 18,867 – –
Belinda Robinson 6,000 – –
Greg West – – 74,617
ENVIRONMENTAL REGULATION AND PERFORMANCEThe Group’s operations are not subject to any significant environmental regulations under the government legislation of the countries it operates in. The Group’s environmental footprint is small and arises primarily from the energy used and materials consumed in its offices. The Board believes that the consolidated entity has adequate systems in place for the monitoring of environmental regulations.
INDEMNIFICATION AND INSURANCE OF OFFICERSDuring the year, the Company paid a premium in respect of a contract insuring the Directors of IDP Education (as named above), the Company secretary, Murray Walton, and all executive officers of IDP Education against a liability incurred as such a Director, secretary or executive officer to the extent permitted by the Corporations Act 2001. The contract of insurance prohibits disclosure of the nature of the liability and the amount of the premium. The Company has not otherwise, during or since the end of the financial year, except to the extent permitted by law, indemnified or agreed to indemnify an officer against a liability incurred as such an officer.
NON-AUDIT SERVICESThe Group may decide to employ the auditor on assignments additional to their statutory audit duties where the auditor’s expertise and experience with the Group are essential and will not compromise their independence.
Details of amounts paid or payable to the auditor Deloitte Touche Tohmatsu for audit and for non-audit services provided during the year are outlined in Note 22 to the financial statements.
Directors’ Report
continued
28 IDP Education Limited Annual Report 2016
The Directors have considered the non-audit services provided during the year and are satisfied these services are compatible with the general standard of independence for auditors imposed by the Corporations Act 2001 for the following reasons:
> All non-audit services have been reviewed and approved to ensure that they do not impact the integrity and objectivity of the auditor; and
> None of the services undermine the general principles relating to auditor independence as set out in APES 110 ‘Code of Ethics for Professional Accountants’ issued by the Accounting Professional & Ethical Standards Board, including reviewing or auditing the auditor’s own work, acting in a management or decision-making capacity for the Group, acting as advocate for the Group or jointly sharing economic risks and rewards
AUDITOR’S INDEPENDENCE DECLARATIONA copy of the auditor’s independence declaration as required under section 307C of the Corporations Act 2001 is set out on page 47.
AUDITOR ROTATIONIn accordance with section 324DAA of the Corporations Act 2001 and the recommendation of the Audit and Risk Committee, the lead auditor’s rotation period as auditor has been extended for 1 year to 30 June 2017, subject to an annual performance assessment by the Chair of the Audit and Risk Committee.
It was noted that given the recent changes to IDP Education’s Board, Committee and management team, the Audit and Risk Committee were satisfied the approval;
> Is consistent with maintaining the quality of the audit provided to IDP Education; and
> Would not give rise to a conflict of interest situation (as defined in section 324CD of the Corporations Act)
ROUNDING OF AMOUNTS TO THE NEAREST THOUSAND DOLLARS
The Group is of a kind referred to in ASIC Corporations (Rounding in Financial/Directors’ Reports) Instrument 2016/191 issued by the Australian Securities and Investments Commission, relating to the “rounding off” of amounts in the Directors’ report and financial report. Amounts in the Directors’ report and financial report have been rounded off, in accordance with that Instrument, to the nearest thousand dollars, or in certain cases, to the nearest dollar.
CORPORATE GOVERNANCE POLICIESIDP Education is committed to strong and effective governance frameworks. IDP Education’s Corporate Governance Statement, in addition to corporate governance policies are available in the Investor Centre – Corporate Governance section of the company Website, at https://investors.idp.com/Investor-Centre/?page=Corporate-Governance
29Personal journeys, global growth
Remuneration Report
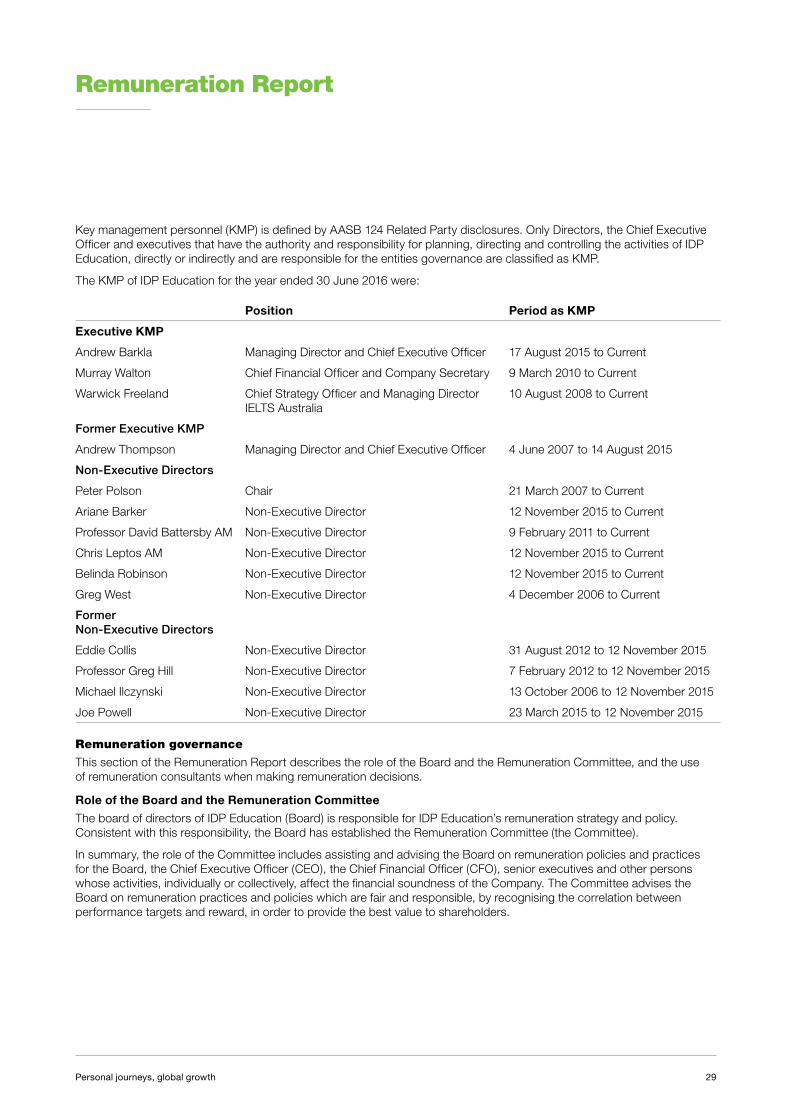
Key management personnel (KMP) is defined by AASB 124 Related Party disclosures. Only Directors, the Chief Executive Officer and executives that have the authority and responsibility for planning, directing and controlling the activities of IDP Education, directly or indirectly and are responsible for the entities governance are classified as KMP.
The KMP of IDP Education for the year ended 30 June 2016 were:
Position Period as KMP
Executive KMP
Andrew Barkla Managing Director and Chief Executive Officer 17 August 2015 to Current
Murray Walton Chief Financial Officer and Company Secretary 9 March 2010 to Current
Warwick Freeland Chief Strategy Officer and Managing Director IELTS Australia
10 August 2008 to Current
Former Executive KMP
Andrew Thompson Managing Director and Chief Executive Officer 4 June 2007 to 14 August 2015
Non-Executive Directors
Peter Polson Chair 21 March 2007 to Current
Ariane Barker Non-Executive Director 12 November 2015 to Current
Professor David Battersby AM Non-Executive Director 9 February 2011 to Current
Chris Leptos AM Non-Executive Director 12 November 2015 to Current
Belinda Robinson Non-Executive Director 12 November 2015 to Current
Greg West Non-Executive Director 4 December 2006 to Current
Former Non-Executive Directors
Eddie Collis Non-Executive Director 31 August 2012 to 12 November 2015
Professor Greg Hill Non-Executive Director 7 February 2012 to 12 November 2015
Michael Ilczynski Non-Executive Director 13 October 2006 to 12 November 2015
Joe Powell Non-Executive Director 23 March 2015 to 12 November 2015
Remuneration governance
This section of the Remuneration Report describes the role of the Board and the Remuneration Committee, and the use of remuneration consultants when making remuneration decisions.
Role of the Board and the Remuneration Committee
The board of directors of IDP Education (Board) is responsible for IDP Education’s remuneration strategy and policy. Consistent with this responsibility, the Board has established the Remuneration Committee (the Committee).
In summary, the role of the Committee includes assisting and advising the Board on remuneration policies and practices for the Board, the Chief Executive Officer (CEO), the Chief Financial Officer (CFO), senior executives and other persons whose activities, individually or collectively, affect the financial soundness of the Company. The Committee advises the Board on remuneration practices and policies which are fair and responsible, by recognising the correlation between performance targets and reward, in order to provide the best value to shareholders.

Remuneration Report
continued
30 IDP Education Limited Annual Report 2016
The Committee’s role and interaction with the Board, internal and external advisors, are further illustrated below:
The Board
Reviews, applies judgement and, as appropriate, approves Remuneration Committee’s recommendations
Remuneration Committee
The Remuneration Committee operates under the delegated authority of the Board.
The Remuneration Committee is empowered to obtain independent professional and other advice in the fulfilment of its duties at the cost of the Company (subject to prior consultation with the chairman of the Board); and
Obtain such resources and information from the Company, in the fulfilment of its duties, as it may reasonably require and assist and advise the Board in relation to the following:
Remuneration framework for Chair, non executive-directors, and remuneration packages for CEO and senior executives
Legislative, regulatory or market developments in relation to remuneration and superannuation
Legislative, regulatory or market developments in relation to remuneration and superannuation
Design features of incentive schemes and equity based remuneration
Trends in base pay for senior executives relative to all Company employees, diversity measures
External Consultants
Internal resources
Further information on the Committee’s role, responsibilities and membership is contained in the Corporate Governance Statement. The Charter can also be viewed in the Investor Centre, Corporate Governance section of the IDP Education website.
As at 30 June 2016, the Committee comprised the following non-executive directors:
> Mr Peter Polson (Chair)
> Ms Ariane Barker
> Mr Chris Leptos
For information in relation to the following, refer to the Directors’ Report:
> Skills, experience and expertise of the Committee members; and
> Number of meetings and attendance of members at the Committee meetings.
31Personal journeys, global growth
Use of remuneration consultants
The Board directly engages external advisors to provide input to the process of reviewing Executive KMP and non-executive director remuneration. During FY16, Crichton and Associates Pty Limited (Crichton and Associates) were engaged by the Board to provide recommendations in relation to long-term incentive programmes. Crichton and Associates were paid $4,566 for these services.
The following arrangements were made to ensure that the remuneration recommendations have been made free from undue influence:
> Crichton and Associates takes instructions from an independent non-executive director and the Committee and is accountable to the Board for all work completed;
> During the course of any assignment, Crichton and Associates may seek input from management, however deliverables are provided directly to the Remuneration Committee and considered by the Board; and
> Professional fee arrangements are agreed directly with the Remuneration Committee Chairman.
As a consequence, the Board is satisfied that the remuneration recommendations were made free from undue influence from any member of the KMP.
In addition to providing remuneration recommendations, Crichton and Associates also provided services relating to other aspects of remuneration of the Group’s employees, including the provision of benchmarking information. For these services Crichton and Associates was paid $34,074 during FY16.
Remuneration strategy
IDP Education’s Board Remuneration Policy aims to set employee and executive remuneration that is fair, competitive and appropriate for the markets in which it operates and is mindful of internal relativities. IDP Education aims to ensure that the mix and balance of remuneration is appropriate to reward fairly, attract, motivate and retain senior executives and other key employees.
Specific objectives of the IDP Education’s remuneration strategy include:
> Provide a fair and competitive (internal and external) fixed annual remuneration for all positions under transparent policies and review procedures;
> Link executive rewards to shareholder value accretion by providing appropriate equity (or equivalent) incentives linked to selected senior executives and employees linked to long-term company performance and core values;
> Provide competitive total rewards to attract and retain appropriately skilled employees and executives;
> Have a meaningful portion of remuneration ‘at risk’, dependent upon meeting pre-determined benchmarks, both short (annual) and long term (3+ years); and
> Establishing appropriate, demanding performance hurdles for any executive equity incentive remuneration.
Remuneration Report
continued
32 IDP Education Limited Annual Report 2016
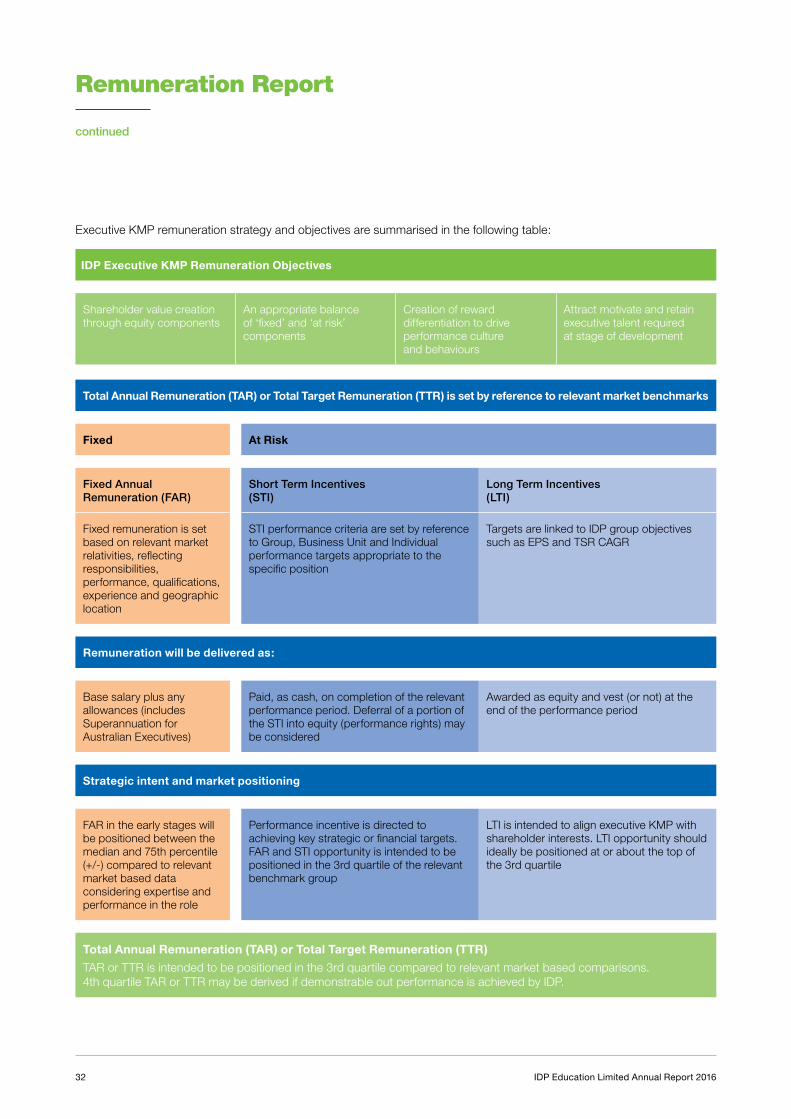
Executive KMP remuneration strategy and objectives are summarised in the following table:
IDP Executive KMP Remuneration Objectives
Shareholder value creation through equity components
An appropriate balance of ‘fixed’ and ‘at risk’ components
Creation of reward differentiation to drive performance culture and behaviours
Attract motivate and retain executive talent required at stage of development
Total Annual Remuneration (TAR) or Total Target Remuneration (TTR) is set by reference to relevant market benchmarks
Fixed At Risk
Fixed Annual Remuneration (FAR)
Short Term Incentives (STI)
Long Term Incentives (LTI)
Fixed remuneration is set based on relevant market relativities, reflecting responsibilities, performance, qualifications, experience and geographic location
STI performance criteria are set by reference to Group, Business Unit and Individual performance targets appropriate to the specific position
Targets are linked to IDP group objectives such as EPS and TSR CAGR
Remuneration will be delivered as:
Base salary plus any allowances (includes Superannuation for Australian Executives)
Paid, as cash, on completion of the relevant performance period. Deferral of a portion of the STI into equity (performance rights) may be considered
Awarded as equity and vest (or not) at the end of the performance period
Strategic intent and market positioning
FAR in the early stages will be positioned between the median and 75th percentile (+/-) compared to relevant market based data considering expertise and performance in the role
Performance incentive is directed to achieving key strategic or financial targets. FAR and STI opportunity is intended to be positioned in the 3rd quartile of the relevant benchmark group
LTI is intended to align executive KMP with shareholder interests. LTI opportunity should ideally be positioned at or about the top of the 3rd quartile
Total Annual Remuneration (TAR) or Total Target Remuneration (TTR)
TAR or TTR is intended to be positioned in the 3rd quartile compared to relevant market based comparisons. 4th quartile TAR or TTR may be derived if demonstrable out performance is achieved by IDP.
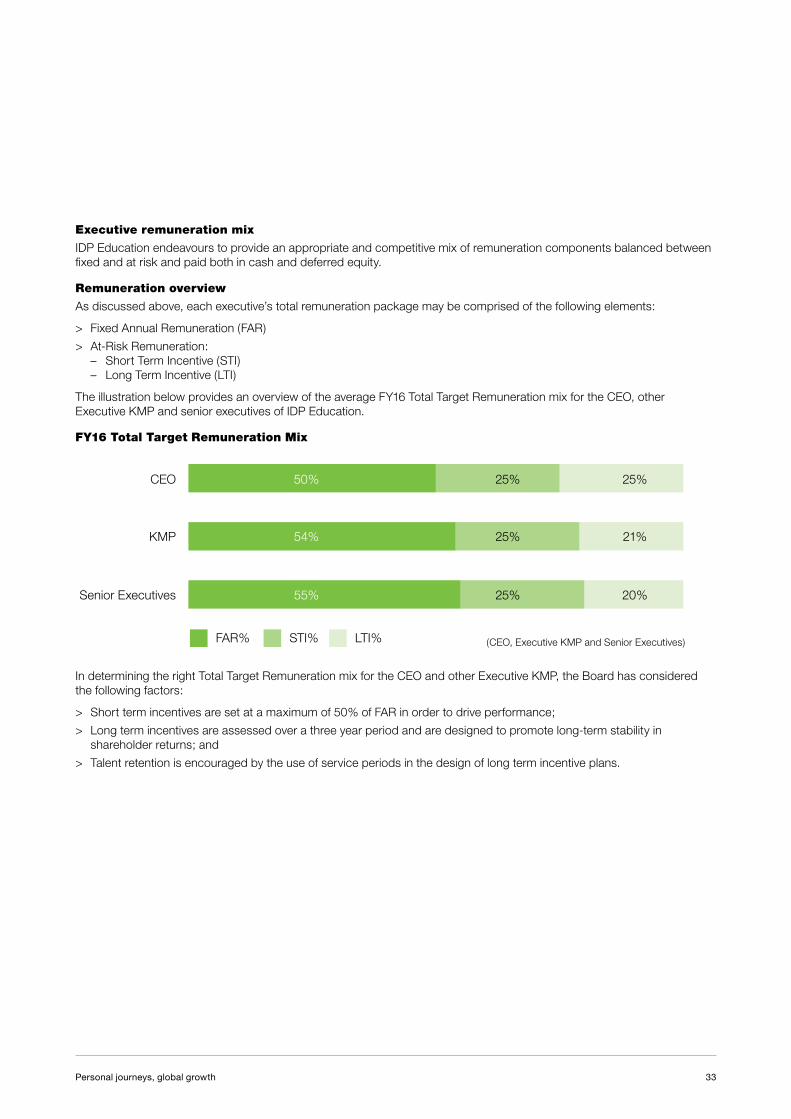
33Personal journeys, global growth
Executive remuneration mix
IDP Education endeavours to provide an appropriate and competitive mix of remuneration components balanced between fixed and at risk and paid both in cash and deferred equity.
Remuneration overview
As discussed above, each executive’s total remuneration package may be comprised of the following elements:
> Fixed Annual Remuneration (FAR)
> At-Risk Remuneration:– Short Term Incentive (STI)– Long Term Incentive (LTI)
The illustration below provides an overview of the average FY16 Total Target Remuneration mix for the CEO, other Executive KMP and senior executives of IDP Education.
FY16 Total Target Remuneration Mix
50%
54%
55%
25%
25%
25%
25%
21%
20%
CEO
KMP
Senior Executives
(CEO, Executive KMP and Senior Executives)
FY16 Total Target Remuneration Mix
FAR% STI% LTI%
In determining the right Total Target Remuneration mix for the CEO and other Executive KMP, the Board has considered the following factors:
> Short term incentives are set at a maximum of 50% of FAR in order to drive performance;
> Long term incentives are assessed over a three year period and are designed to promote long-term stability in shareholder returns; and
> Talent retention is encouraged by the use of service periods in the design of long term incentive plans.

Remuneration Report
continued
34 IDP Education Limited Annual Report 2016
Executive KMP Remuneration Mix
The mix of remuneration for the Executive KMP in FY16 is shown in the following table and a detailed description of each is discussed in more detail below:
Fixed Annual Remuneration
Short Term Incentive
(At-Target)1
Short Term Incentive
(Stretch)2
Long Term Incentive
(At-Target)3
Executive KMP
Andrew Barkla $800,000 $400,000 n/a $400,000
Murray Walton $340,627 50% 75% 35%
Warwick Freeland $404,353 50% 75% 45%
Former Executive KMP
Andrew Thompson4 $725,897 50% n/a n/a
1. For Executive KMP, other than the CEO, the short term incentive is the total payment at-target as a % of the FAR
2. For Executive KMP, other than the CEO, STIs have a stretch component that is designed to encourage above at-target performance and is a % of FAR
3. For Executive KMP, other than the CEO, the long term incentive refers to the value, at-target, of any grant as a % of FAR
4. Andrew Thompson ceased employment on 14 August 2015
The remuneration mix described above does not include the CEO’s sign-on arrangements under which the CEO was granted 4,150,000 Option Awards under the IDP Education Employee Incentive Plan (IDIP) with an exercise price of $1.44 for each Option (Refer below for further information).
Fixed Annual Remuneration
Fixed Annual Remuneration represents the fixed portion of executive remuneration and includes base salary, salary packaged benefits, allowances and employer superannuation contributions.
IDP Education’s approach to FAR settings is to aim to position all executives between the median and 75th percentile.
The table below applied logically, can be used as a guide to IDP Education’s remuneration setting process.
Relative Positioning Comments
1st Quartile Inexperienced in the position but coping, or an experienced employee exhibiting performance gaps.
2nd Quartile Experienced in the position, usually with a minimum of two years’ service. In the competent range, but capable of further development or improvement in the role.
Mid-point (Median)
Fully competent executive or employee making a consistent and sound contribution, coping with and sometimes exceeding all the demands of the position.
3rd Quartile Very experienced executive, exhibiting demonstrably superior performance. External appointees would often be recruited at this level. That is between the median and 75th percentile. The majority of senior executives would be likely to be paid at the 62.5th percentile, that is the middle of the 3rd quartile.
4th Quartile Only outstanding and strategically critical executives would be remunerated in the 4th quartile. Care should be taken not to duplicate or inflate TAR through STI or LTI at this level. Less than 10% of executives likely to be paid at this level.
Executive KMP FAR is tested regularly for market competitiveness by reference to appropriate independent and externally sourced comparable benchmark information, including comparable Australian Stock Exchange (ASX) listed companies, and based on a range of size criteria including market capitalisation taking into account an executive’s responsibilities, performance, qualifications, experience and geographic location.
FAR adjustments, if any, are made with reference to individual performance, an increase in job role or responsibility, changing market circumstances as reflected through independent benchmark assessments or through promotion.
35Personal journeys, global growth
Any adjustments made to Executive KMP remuneration are approved by the Board, based on Committee recommendations referring to benchmarking data and the guidance of the independent remuneration consultant where appropriate.
Short term incentive
IDP Education has target based short term incentive plans in place for all Executive KMP.
Performance criteria set for STI plans will reflect fundamental strategic or performance objectives to ensure a focussed and successful performance incentive program.
The target and maximum annual STI that may be awarded to Executive KMP is expressed as a percentage of FAR.
The key features of the STI plan are as follows:
Purpose The STI arrangements at IDP Education are designed to reward executives for achievement against annual performance targets set by the Board at the beginning of the performance period. The STI program is reviewed annually by the Remuneration Committee and approved by the Board.
Performance criteria
During FY16, the key performance criteria of IDP Education were directed to achieving the following Board approved targets:
> Earnings before Interest and Taxation;
> The successful initial public offering (IPO) of the Company;
> Growth in source countries achieving target volumes of finalised multi destination students;
> IELTS testing systems and operational capability improvements;
> IELTS testing volumes and response to competition; and
> Leadership capability targets.
The Board believes that the specific STI performance criteria will encourage an increase in financial performance, market share and shareholder returns.
Rewarding performance
The STI performance weightings are determined under a predetermined matrix with the Board determination final.
Executive KMP’s STI have a stretch component that is designed to encourage above at-target performance.
Performance period
The STI performance period is for the financial year 1 July to 30 June.
STI payment The current year, CEO’s STI is paid as follows:
> 50% of the STI target paid in cash upon completion of the IPO;
> In relation to the remaining STI awarded;– 50% will be paid in cash subsequent to 30 June 2016 following completion of the performance
period and audit of the associated financial statements; and– 50% will be satisfied through a grant of service rights issued under the IDIP. The service rights
are subject to a vesting condition that the CEO remains employed for a further 12 months from the end of the financial year
The STI of remaining Executive KMPs was will be paid in cash subsequent to 30 June 2016 following completion of the performance period and audit of the associated financial statements.
Long-term incentives
The IDIP is the Company’s employee equity scheme. It was launched in February 2014 when offers were made to Executive KMP and selected executives and directors.
The IDIP has been structured to meet contemporary equity design standards and enables the Company to offer selected employees a range of different remuneration, incentive awards or employee share scheme interests.
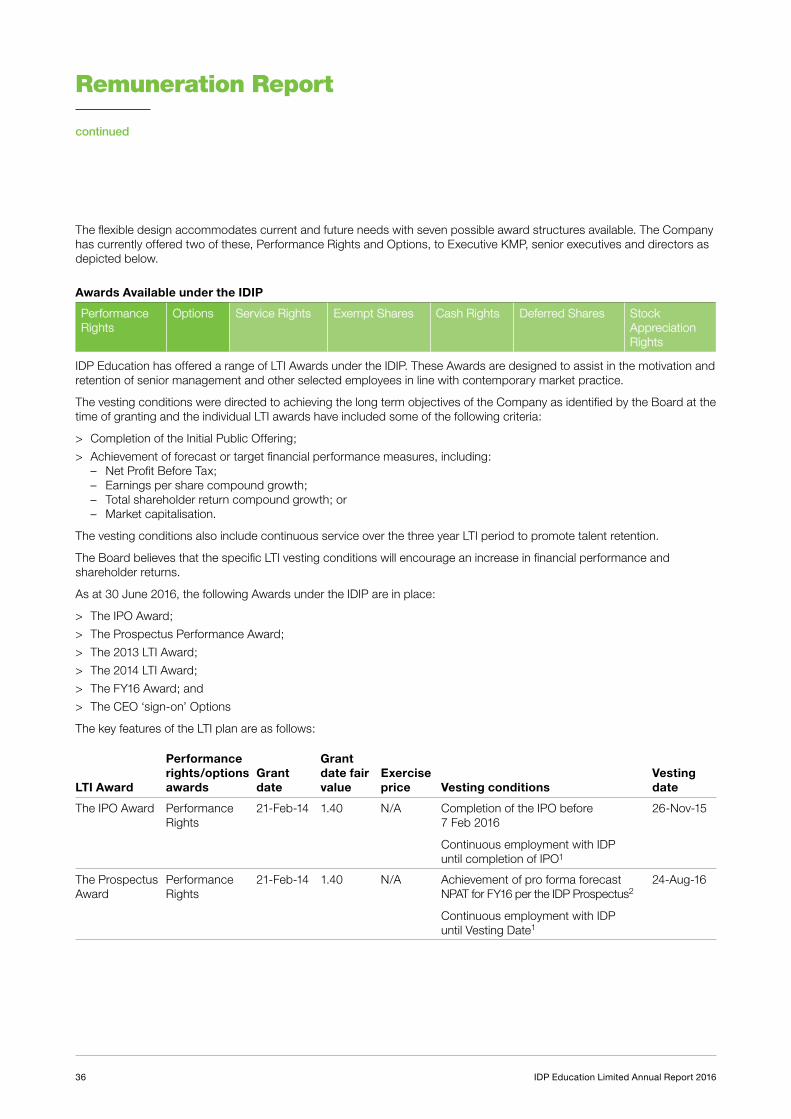
Remuneration Report
continued
36 IDP Education Limited Annual Report 2016
The flexible design accommodates current and future needs with seven possible award structures available. The Company has currently offered two of these, Performance Rights and Options, to Executive KMP, senior executives and directors as depicted below.
Awards Available under the IDIP
Performance Rights
Options Service Rights Exempt Shares Cash Rights Deferred Shares Stock Appreciation Rights
IDP Education has offered a range of LTI Awards under the IDIP. These Awards are designed to assist in the motivation and retention of senior management and other selected employees in line with contemporary market practice.
The vesting conditions were directed to achieving the long term objectives of the Company as identified by the Board at the time of granting and the individual LTI awards have included some of the following criteria:
> Completion of the Initial Public Offering;
> Achievement of forecast or target financial performance measures, including:– Net Profit Before Tax;– Earnings per share compound growth;– Total shareholder return compound growth; or– Market capitalisation.
The vesting conditions also include continuous service over the three year LTI period to promote talent retention.
The Board believes that the specific LTI vesting conditions will encourage an increase in financial performance and shareholder returns.
As at 30 June 2016, the following Awards under the IDIP are in place:
> The IPO Award;
> The Prospectus Performance Award;
> The 2013 LTI Award;
> The 2014 LTI Award;
> The FY16 Award; and
> The CEO ‘sign-on’ Options
The key features of the LTI plan are as follows:
LTI Award
Performance rights/options awards
Grant date
Grant date fair value
Exercise price Vesting conditions
Vesting date
The IPO Award Performance Rights
21-Feb-14 1.40 N/A Completion of the IPO before 7 Feb 2016
Continuous employment with IDP until completion of IPO1
26-Nov-15
The Prospectus Award
Performance Rights
21-Feb-14 1.40 N/A Achievement of pro forma forecast NPAT for FY16 per the IDP Prospectus2
Continuous employment with IDP until Vesting Date1
24-Aug-16
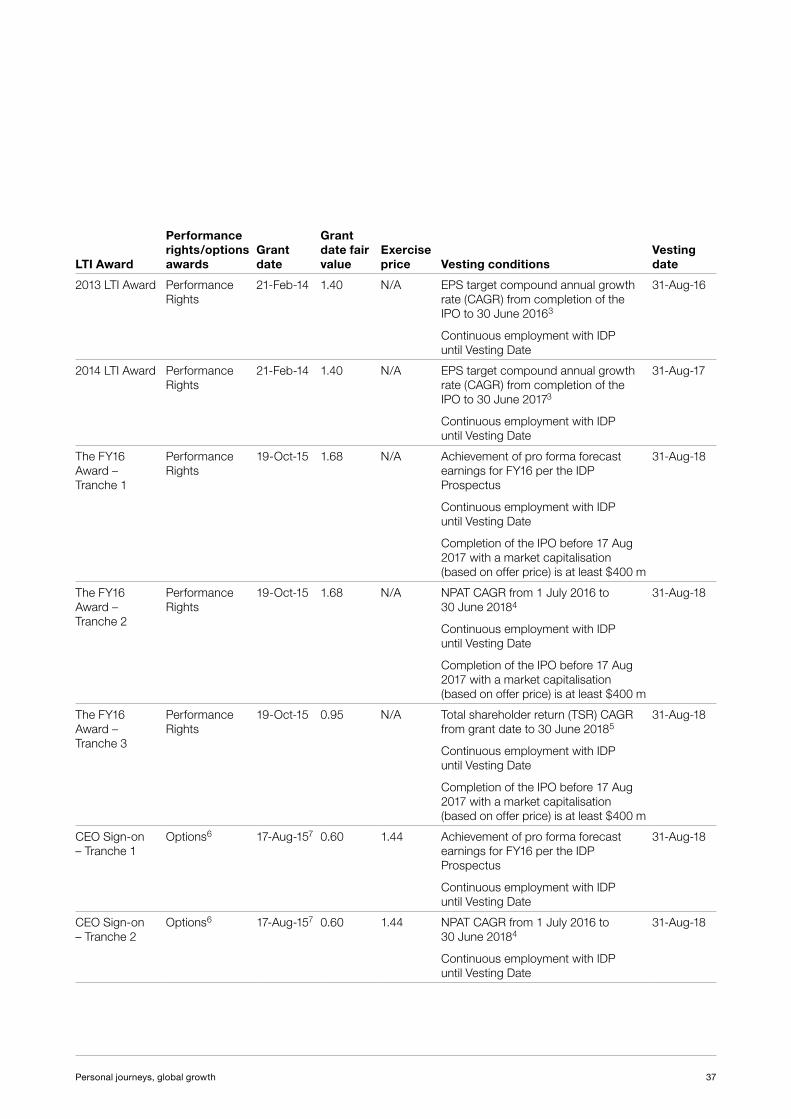
37Personal journeys, global growth
LTI Award
Performance rights/options awards
Grant date
Grant date fair value
Exercise price Vesting conditions
Vesting date
2013 LTI Award Performance Rights
21-Feb-14 1.40 N/A EPS target compound annual growth rate (CAGR) from completion of the IPO to 30 June 20163
Continuous employment with IDP until Vesting Date
31-Aug-16
2014 LTI Award Performance Rights
21-Feb-14 1.40 N/A EPS target compound annual growth rate (CAGR) from completion of the IPO to 30 June 20173
Continuous employment with IDP until Vesting Date
31-Aug-17
The FY16 Award – Tranche 1
Performance Rights
19-Oct-15 1.68 N/A Achievement of pro forma forecast earnings for FY16 per the IDP Prospectus
Continuous employment with IDP until Vesting Date
Completion of the IPO before 17 Aug 2017 with a market capitalisation (based on offer price) is at least $400 m
31-Aug-18
The FY16 Award – Tranche 2
Performance Rights
19-Oct-15 1.68 N/A NPAT CAGR from 1 July 2016 to 30 June 20184
Continuous employment with IDP until Vesting Date
Completion of the IPO before 17 Aug 2017 with a market capitalisation (based on offer price) is at least $400 m
31-Aug-18
The FY16 Award – Tranche 3
Performance Rights
19-Oct-15 0.95 N/A Total shareholder return (TSR) CAGR from grant date to 30 June 20185
Continuous employment with IDP until Vesting Date
Completion of the IPO before 17 Aug 2017 with a market capitalisation (based on offer price) is at least $400 m
31-Aug-18
CEO Sign-on – Tranche 1
Options6 17-Aug-157 0.60 1.44 Achievement of pro forma forecast earnings for FY16 per the IDP Prospectus
Continuous employment with IDP until Vesting Date
31-Aug-18
CEO Sign-on – Tranche 2
Options6 17-Aug-157 0.60 1.44 NPAT CAGR from 1 July 2016 to 30 June 20184
Continuous employment with IDP until Vesting Date
31-Aug-18

Remuneration Report
continued
38 IDP Education Limited Annual Report 2016
LTI Award
Performance rights/options awards
Grant date
Grant date fair value
Exercise price Vesting conditions
Vesting date
CEO Sign-on – Tranche 3
Options6 17-Aug-157 0.51 1.44 Total shareholder return (TSR) CAGR from grant date to 30 June 20185
Continuous employment with IDP until Vesting Date
31-Aug-18
1. An additional service vesting condition requires that the participant maintains continuous employment with IDP Education for 12 months from the Vesting Date
2. 50% of performance rights available will vest if actual NPAT equals 90% of the pro forma forecast. 100% of performance rights available will vest if the pro forma forecast is achieved. Vesting will be on a pro rata basis between 90% and 100% achievement
3. The base EPS will be calculated using the FY14 NPAT and the number of shares on issue at completion of the IPO. 50% of performance rights available will vest if an EPS target CAGR of 5% is achieved. 100% of performance rights available will vest if an EPS target CAGR of 10% or greater is achieved. Vesting will be on a pro rata basis between 5% and 10% achievement
4. The FY15 NPAT will be used to as a basis for vesting calculations. 50% of performance rights available will vest if a NPAT CAGR of 5% is achieved. 100% of performance rights available will vest if a NPAT CAGR of 6% or greater is achieved. Vesting will be on a pro rata basis between 5% and 6% achievement
5. A market capitalisation of $360 m at grant date will be used to as a basis for vesting calculations. 50% of performance rights available will vest if a TSR CAGR of 6% is achieved. 100% of performance rights available will vest if a TSR CAGR of 8% or greater is achieved. Vesting will be on a pro rata basis between 6% and 8% achievement
6. Upon exercise and payment of the exercise price, each option entitles the holder to receive one share. However, at its discretion, the Board may elect to pay the holder a cash amount equal to the value of the share
7. Options expire if not exercised five years after Grant Date
Termination benefits
The remuneration and other terms of employment are covered in a formal employment contract. The employment contracts include provisions requiring a minimum notice period by both the executive and by IDP Education. If either party provides notice, the Company may make a payment in lieu of notice.
For all Executive KMP, in the event of serious misconduct or other circumstances warranting summary dismissal, notice is not required.
The minimum notice period for each Executive KMP are set out in the below table.
Contract typeNotice period by Executive
Notice period by IDP Education Redundancy Payment
Executive KMP
Andrew Barkla Ongoing 3 months 9 months If terminated by reason of redundancy, 5 weeks notice and 34 weeks severance payment are required
Murray Walton Ongoing 1 month 1 month General redundancy terms apply as mandated by the Fair Work Act 2009
Warwick Freeland Ongoing 13 weeks 26 weeks General redundancy terms apply as mandated by the Fair Work Act 2009
Former Executive KMP
Andrew Thompson Ceased 3 months 12 months If terminated by reason of redundancy, 5 weeks notice and 47 weeks severance payment are required
Clawback provisions
The Board does not have an executive remuneration clawback policy in relation to performance based remuneration.
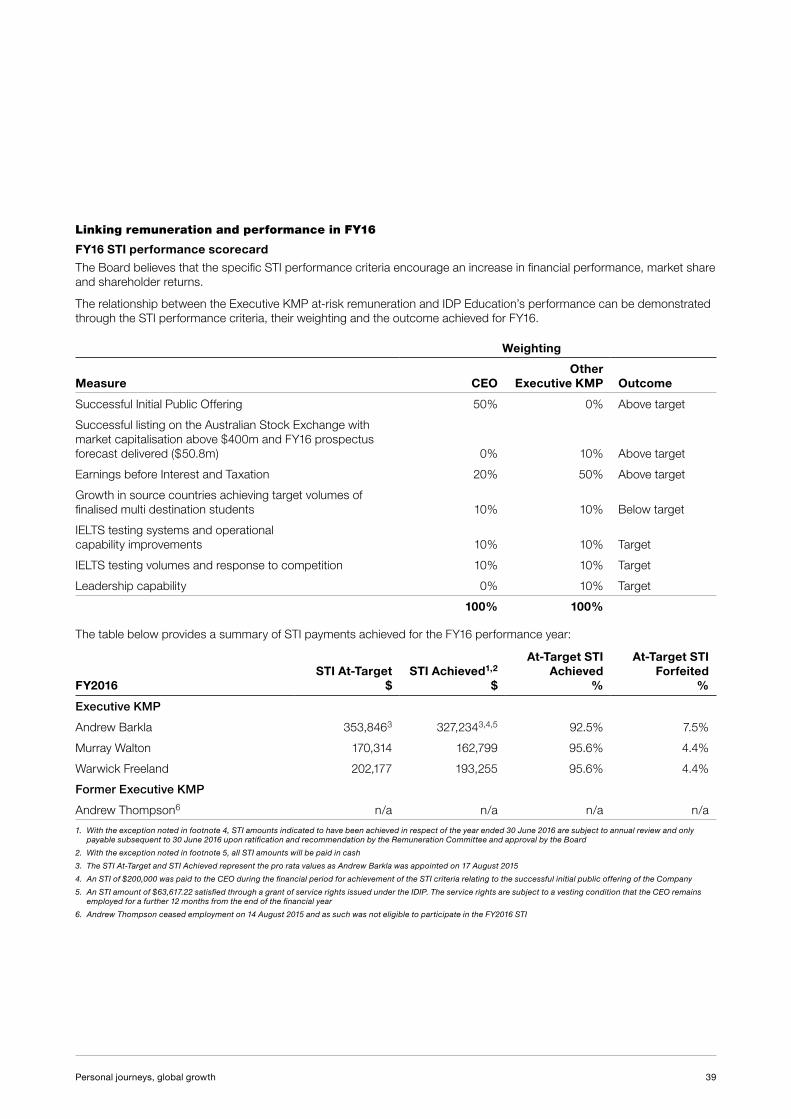
39Personal journeys, global growth
Linking remuneration and performance in FY16
FY16 STI performance scorecard
The Board believes that the specific STI performance criteria encourage an increase in financial performance, market share and shareholder returns.
The relationship between the Executive KMP at-risk remuneration and IDP Education’s performance can be demonstrated through the STI performance criteria, their weighting and the outcome achieved for FY16.
Weighting
Measure CEOOther
Executive KMP Outcome
Successful Initial Public Offering 50% 0% Above target
Successful listing on the Australian Stock Exchange with market capitalisation above $400m and FY16 prospectus forecast delivered ($50.8m) 0% 10% Above target
Earnings before Interest and Taxation 20% 50% Above target
Growth in source countries achieving target volumes of finalised multi destination students 10% 10% Below target
IELTS testing systems and operational capability improvements 10% 10% Target
IELTS testing volumes and response to competition 10% 10% Target
Leadership capability 0% 10% Target
100% 100%
The table below provides a summary of STI payments achieved for the FY16 performance year:
FY2016STI At-Target
$STI Achieved1,2
$
At-Target STI Achieved
%
At-Target STI Forfeited
%
Executive KMP
Andrew Barkla 353,8463 327,2343,4,5 92.5% 7.5%
Murray Walton 170,314 162,799 95.6% 4.4%
Warwick Freeland 202,177 193,255 95.6% 4.4%
Former Executive KMP
Andrew Thompson6 n/a n/a n/a n/a
1. With the exception noted in footnote 4, STI amounts indicated to have been achieved in respect of the year ended 30 June 2016 are subject to annual review and only payable subsequent to 30 June 2016 upon ratification and recommendation by the Remuneration Committee and approval by the Board
2. With the exception noted in footnote 5, all STI amounts will be paid in cash
3. The STI At-Target and STI Achieved represent the pro rata values as Andrew Barkla was appointed on 17 August 2015
4. An STI of $200,000 was paid to the CEO during the financial period for achievement of the STI criteria relating to the successful initial public offering of the Company
5. An STI amount of $63,617.22 satisfied through a grant of service rights issued under the IDIP. The service rights are subject to a vesting condition that the CEO remains employed for a further 12 months from the end of the financial year
6. Andrew Thompson ceased employment on 14 August 2015 and as such was not eligible to participate in the FY2016 STI

Remuneration Report
continued
40 IDP Education Limited Annual Report 2016
IDP Education’s FY16 financial performance
The following table provides a summary of critical performance indices for IDP Education’s financial performance for FY16 and how the performance against these indices is reflected in Executive KMP at-risk remuneration.
Measure FY16 FY15 FY14 FY13 FY12
Revenue ($000) 361,636 309,865 256,627 216,883 204,104
Earnings before Interest and Taxation ($000) 53,664 45,150 38,621 31,018 19,853
Net Profit after Taxation ($000) 39,914 31,476 27,987 21,195 16,321
Basic Earnings per Share (cents per share)1 15.95 12.58 11.18 8.47 6.52
Diluted Earnings per Share (cents per share)1 15.60 12.48 11.15 8.47 6.52
Dividend (cents per share)1 19.18 15.58 13.18 8.79 4.80
Share price as at 26 November 2015 (listing date) 3.40 n/a n/a n/a n/a
Share price as at 30 June 2016 4.12 n/a n/a n/a n/a
Average STI payout as a % at-target for eligible KMPs2,3 94.3% n/a n/a n/a n/a
1. Basic and Diluted Earnings per Share and Dividends per share for FY12 – FY15 have been restated using the number of shares on issue as at 30 June 2016
2. With the exception noted in footnote 2, STI amounts indicated to have been achieved in respect of the year ended 30 June 2016 are subject to annual review and only payable subsequent to 30 June 2016 upon ratification and recommendation by the Remuneration Committee and approval by the Board
3. An STI of $200,000 was paid to the CEO during the financial period for achievement of the STI criteria relating to the successful initial public offering of the Company
Executive KMP FY16 remuneration
The table below represents the FY16 actual remuneration for Executive KMP.
Statutory remuneration disclosures prepared in accordance with the Corporations Act 2001 and Australian Accounting Standards differ in the numbers presented below. The statutory remuneration disclosures include (among other benefits) expensing for LTI equity grants that are yet to realise and may never be realised. The statutory remuneration table in respect of the Executive KMP members is presented in the following section.
FY2016Base salary and superannuation
Cash STI awards for
performance in FY16
Other cash payments
Total payments in
relation to FY16
Deferred STI awards for
performance to FY163
Total FY16 actual
remuneration
Executive KMP
Andrew Barkla1 699,395 200,0002 – 899,395 127,234 1,026,629
Murray Walton 340,627 – – 340,627 162,799 503,426
Warwick Freeland 404,353 – – 404,353 193,255 597,608
Former Executive KMP
Andrew Thompson4 116,902 – – 116,902 – 116,902
1. Andrew Barkla commenced employment on 17 August 2015 and, therefore, the salary and superannuation and STI detailed reflect the part year period that he was employed
2. An STI of $200,000 was paid to the CEO during the financial period for achievement of the STI criteria relating to the successful initial public offering of the Company
3. Deferred STI awards for performance in FY16 includes both cash and service rights expected to be paid/vest in future period as a result of the FY16 STI outcomes
4. Andrew Thompson ceased employment on 14 August 2015 and, therefore, the base salary and superannuation detailed reflect his part-year service

41Personal journeys, global growth
Executive KMP Statutory remuneration table
The following table has been prepared in accordance with Section 300A of the Corporations Act 2001 and details statutory accounting expense of all remuneration-related items for the Executive KMP. Note that, in contrast to the previous table details FY16 actual remuneration, the table below accrues amounts for equity awards being expensed throughout FY16 that are yet to, and may never, be realised by the Executive KMP member.
Short term Benefits
Post-employ-
ment Benefits
Long-term Benefits
Equity-based
Benefits
Financial Year
Salary $
STI1 $
Other3 $
Non-monetary
Benefits $
Super-annuation
$Leave2
$
Perfor-mance rights/
Options4 $
Total remun-eration
$
Executive KMP
Andrew Barkla5 2016 668,703 327,234 – – 30,692 1,415 789,329 1,817,373
2015 – – – – – – – –
Murray Walton 2016 311,074 162,799 – – 29,553 8,873 144,611 656,910
2015 300,700 190,851 – – 28,567 13,658 110,307 644,083
Warwick Freeland 2016 369,353 193,255 – – 35,000 10,533 183,171 791,312
2015 355,868 226,556 – – 35,000 12,645 130,893 760,962
Former Executive KMP
Andrew Thompson6 2016 111,035 – – – 5,867 – – 116,902
2015 690,897 399,343 432,606 – 35,000 24,498 – 1,582,344
Total 2016 1,460,165 683,288 – – 101,112 20,821 1,117,111 3,382,497
2015 1,347,465 816,750 432,606 – 98,567 50,801 241,200 2,987,389
1. Short term STI includes both cash and service rights expected to be paid/vest in future period as a result of the FY16 STI outcomes
2. Long term leave represents long service leave accrued but untaken during the year
3. Other cash payments include payments made to Andrew Thompson upon the completion of his employment with IDP Education in recognition of his years of service
4. Equity based benefits represent benefits issued under the LTI (service right portion of the STI). The values are based on the grant date fair value, amortised on a straight line basis over the vesting period, refer to share based payments accounting policy (note 20) for further details
5. Andrew Barkla commenced employment on 17 August 2015 and, therefore, the remuneration detailed reflects the part year period that he was employed
6. Andrew Thompson ceased employment on 14 August 2015 and, therefore, the base salary and superannuation detailed reflect his part-year service
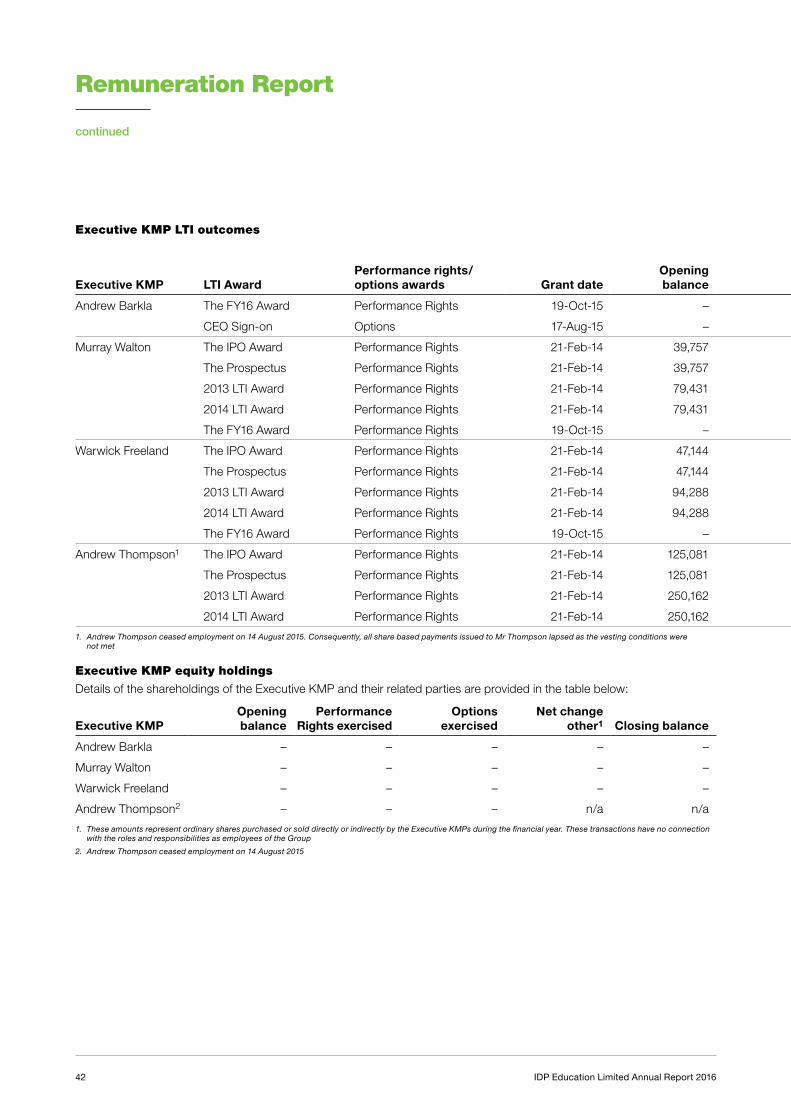
Remuneration Report
continued
42 IDP Education Limited Annual Report 2016
Executive KMP LTI outcomes
Executive KMP LTI AwardPerformance rights/options awards Grant date
Opening balance
Granted during year
Exercised during year
Forfeited during year
Closing balance – vested and exercisable
Closing balance – vested but
not exercisableClosing balance
– unvested
Andrew Barkla The FY16 Award Performance Rights 19-Oct-15 – 324,447 – – – – 324,447
CEO Sign-on Options 17-Aug-15 – 4,150,000 – – – – 4,150,000
Murray Walton The IPO Award Performance Rights 21-Feb-14 39,757 – – – – 39,757 –
The Prospectus Performance Rights 21-Feb-14 39,757 – – – – – 39,757
2013 LTI Award Performance Rights 21-Feb-14 79,431 – – – – – 79,431
2014 LTI Award Performance Rights 21-Feb-14 79,431 – – – – – 79,431
The FY16 Award Performance Rights 19-Oct-15 – 96,695 – – – – 96,695
Warwick Freeland The IPO Award Performance Rights 21-Feb-14 47,144 – – – – 47,144 –
The Prospectus Performance Rights 21-Feb-14 47,144 – – – – – 47,144
2013 LTI Award Performance Rights 21-Feb-14 94,288 – – – – – 94,288
2014 LTI Award Performance Rights 21-Feb-14 94,288 – – – – – 94,288
The FY16 Award Performance Rights 19-Oct-15 – 147,574 – – – – 147,574
Andrew Thompson1 The IPO Award Performance Rights 21-Feb-14 125,081 – – 125,081 – – –
The Prospectus Performance Rights 21-Feb-14 125,081 – – 125,081 – – –
2013 LTI Award Performance Rights 21-Feb-14 250,162 – – 250,162 – – –
2014 LTI Award Performance Rights 21-Feb-14 250,162 – – 250,162 – – –
1. Andrew Thompson ceased employment on 14 August 2015. Consequently, all share based payments issued to Mr Thompson lapsed as the vesting conditions were not met
Executive KMP equity holdings
Details of the shareholdings of the Executive KMP and their related parties are provided in the table below:
Executive KMPOpening balance
Performance Rights exercised
Options exercised
Net change other1 Closing balance
Andrew Barkla – – – – –
Murray Walton – – – – –
Warwick Freeland – – – – –
Andrew Thompson2 – – – n/a n/a
1. These amounts represent ordinary shares purchased or sold directly or indirectly by the Executive KMPs during the financial year. These transactions have no connection with the roles and responsibilities as employees of the Group
2. Andrew Thompson ceased employment on 14 August 2015

43Personal journeys, global growth
Executive KMP LTI outcomes
Executive KMP LTI AwardPerformance rights/options awards Grant date
Opening balance
Granted during year
Exercised during year
Forfeited during year
Closing balance – vested and exercisable
Closing balance – vested but
not exercisableClosing balance
– unvested
Andrew Barkla The FY16 Award Performance Rights 19-Oct-15 – 324,447 – – – – 324,447
CEO Sign-on Options 17-Aug-15 – 4,150,000 – – – – 4,150,000
Murray Walton The IPO Award Performance Rights 21-Feb-14 39,757 – – – – 39,757 –
The Prospectus Performance Rights 21-Feb-14 39,757 – – – – – 39,757
2013 LTI Award Performance Rights 21-Feb-14 79,431 – – – – – 79,431
2014 LTI Award Performance Rights 21-Feb-14 79,431 – – – – – 79,431
The FY16 Award Performance Rights 19-Oct-15 – 96,695 – – – – 96,695
Warwick Freeland The IPO Award Performance Rights 21-Feb-14 47,144 – – – – 47,144 –
The Prospectus Performance Rights 21-Feb-14 47,144 – – – – – 47,144
2013 LTI Award Performance Rights 21-Feb-14 94,288 – – – – – 94,288
2014 LTI Award Performance Rights 21-Feb-14 94,288 – – – – – 94,288
The FY16 Award Performance Rights 19-Oct-15 – 147,574 – – – – 147,574
Andrew Thompson1 The IPO Award Performance Rights 21-Feb-14 125,081 – – 125,081 – – –
The Prospectus Performance Rights 21-Feb-14 125,081 – – 125,081 – – –
2013 LTI Award Performance Rights 21-Feb-14 250,162 – – 250,162 – – –
2014 LTI Award Performance Rights 21-Feb-14 250,162 – – 250,162 – – –
1. Andrew Thompson ceased employment on 14 August 2015. Consequently, all share based payments issued to Mr Thompson lapsed as the vesting conditions were not met
Executive KMP equity holdings
Details of the shareholdings of the Executive KMP and their related parties are provided in the table below:
Executive KMPOpening balance
Performance Rights exercised
Options exercised
Net change other1 Closing balance
Andrew Barkla – – – – –
Murray Walton – – – – –
Warwick Freeland – – – – –
Andrew Thompson2 – – – n/a n/a
1. These amounts represent ordinary shares purchased or sold directly or indirectly by the Executive KMPs during the financial year. These transactions have no connection with the roles and responsibilities as employees of the Group
2. Andrew Thompson ceased employment on 14 August 2015

Remuneration Report
continued
44 IDP Education Limited Annual Report 2016
Non-executive Director remuneration strategy and framework
Non-executive Director fees are determined by reference to external survey data, taking account of the Group’s relative size and business complexity.
Under the Constitution, the Directors decide the total amount paid to all Directors as remuneration for their services as a Director. However, under the ASX Listing Rules, the total amount paid to all Directors for their services must not exceed in aggregate in any financial year the amount fixed by the Company in a general meeting. This amount, being the fee pool limit, has been fixed at $1,500,000 per financial year.
Each Non-executive Director’s total remuneration package may be comprised of the following elements:
> Base fee
> Committee fee
During the year ended 30 June 2016, the IPO award LTI was offered to specific Non-executive Directors in recognition of the additional workload arising from the initial public offering. Refer to above for details related to the IPO Award LTI.
With the exception of the IPO Award, Non-executive Directors have no entitlement to STI or no LTI are offered. No retirement benefits are payable to Non-executive Directors.
The below table provides further details relating to the components of the Non-executive Director remuneration.
Component Delivered Description
Base Fee Cash The base fee represents remuneration for service on the IDP Education Board. The base fee for the Chair represents the entire remuneration for that role.
Committee Chair fees Cash Committee fees represent remuneration for chairing Board committees. No additional remuneration is provided for membership of a Committee.
IPO Award Performance Right Participation in the LTI is recognition of the additional workloads arising from the IPO.
The current Non-executive Director remuneration fee structure is shown in the following table:
$ per annum
Base Fee
Chair 175,000
Non-Executive Director 115,000
Committee Chair Fees
Audit and Risk Committee 15,000
Nomination Committee 10,000
Remuneration Committee 10,000
The above fee structure was reviewed upon the Company’s listing on 26 November 2016. The fees were increased to reflect the role and relevant market benchmarks related to a Directorship in an ASX listed entity.
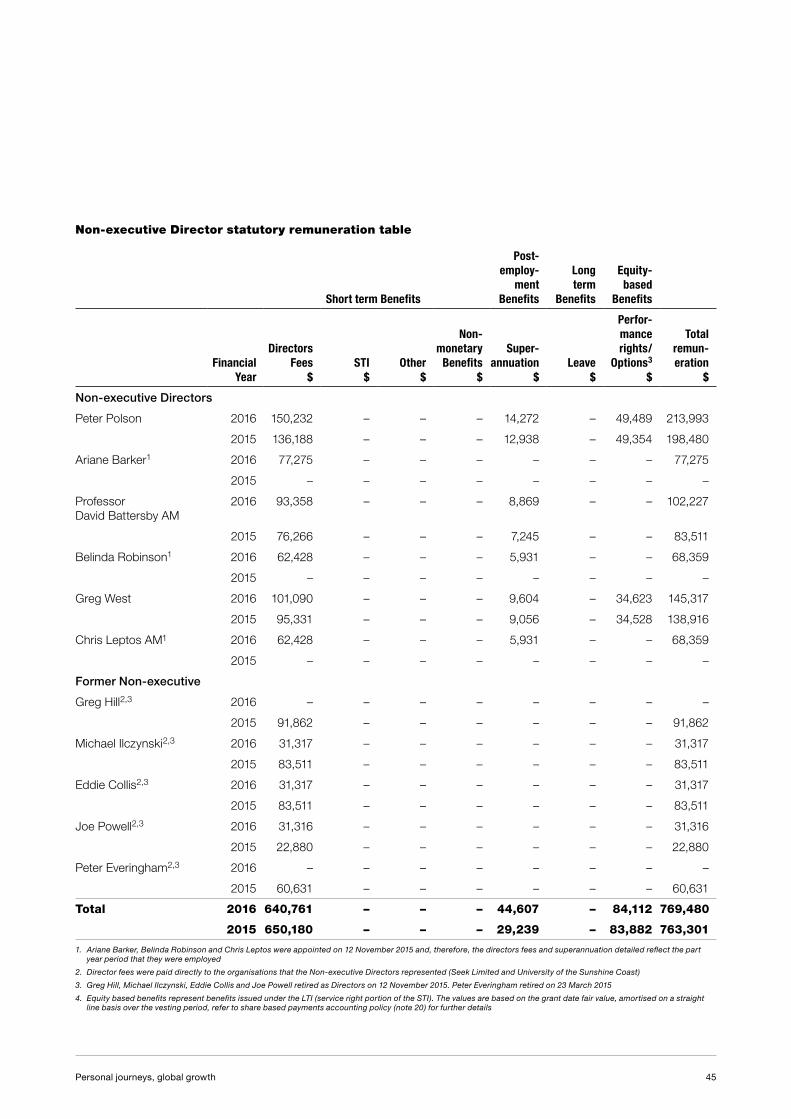
45Personal journeys, global growth
Non-executive Director statutory remuneration table
Short term Benefits
Post-employ-
ment Benefits
Long term
Benefits
Equity-based
Benefits
Financial Year
Directors Fees
$STI
$Other
$
Non-monetary
Benefits $
Super-annuation
$Leave
$
Perfor-mance rights/
Options3 $
Total remun-eration
$
Non-executive Directors
Peter Polson 2016 150,232 – – – 14,272 – 49,489 213,993
2015 136,188 – – – 12,938 – 49,354 198,480
Ariane Barker1 2016 77,275 – – – – – – 77,275
2015 – – – – – – – –
Professor David Battersby AM
2016 93,358 – – – 8,869 – – 102,227
2015 76,266 – – – 7,245 – – 83,511
Belinda Robinson1 2016 62,428 – – – 5,931 – – 68,359
2015 – – – – – – – –
Greg West 2016 101,090 – – – 9,604 – 34,623 145,317
2015 95,331 – – – 9,056 – 34,528 138,916
Chris Leptos AM1 2016 62,428 – – – 5,931 – – 68,359
2015 – – – – – – – –
Former Non-executive
Greg Hill2,3 2016 – – – – – – – –
2015 91,862 – – – – – – 91,862
Michael Ilczynski2,3 2016 31,317 – – – – – – 31,317
2015 83,511 – – – – – – 83,511
Eddie Collis2,3 2016 31,317 – – – – – – 31,317
2015 83,511 – – – – – – 83,511
Joe Powell2,3 2016 31,316 – – – – – – 31,316
2015 22,880 – – – – – – 22,880
Peter Everingham2,3 2016 – – – – – – – –
2015 60,631 – – – – – – 60,631
Total 2016 640,761 – – – 44,607 – 84,112 769,480
2015 650,180 – – – 29,239 – 83,882 763,301
1. Ariane Barker, Belinda Robinson and Chris Leptos were appointed on 12 November 2015 and, therefore, the directors fees and superannuation detailed reflect the part year period that they were employed
2. Director fees were paid directly to the organisations that the Non-executive Directors represented (Seek Limited and University of the Sunshine Coast)
3. Greg Hill, Michael Ilczynski, Eddie Collis and Joe Powell retired as Directors on 12 November 2015. Peter Everingham retired on 23 March 2015
4. Equity based benefits represent benefits issued under the LTI (service right portion of the STI). The values are based on the grant date fair value, amortised on a straight line basis over the vesting period, refer to share based payments accounting policy (note 20) for further details

Remuneration Report
continued
46 IDP Education Limited Annual Report 2016
Non-executive Director LTI outcomes
Non-executive Director LTI Award
Perfor mance rights/options
awards Grant dateOpening balance
Granted during
year
Exercised during
year
Forfeited during
year
Closing balance – vested
and exer-
cisable
Closing balance – vested
but not exer-
cisable
Closing balance – unvested
Peter Polson
The IPO Award
Performance Rights
21 Feb 14 106,655 – – – – 106,655 –
Greg West The IPO Award
Performance Rights
21 Feb 14 74,617 – – – – 74,617 –
Non-executive Director Equity Holdings
Details of the shareholdings of the Non-executive Directors and their related parties are provided in the table below:
Opening balance
Performance Rights exercised
Options exercised
Net change other1
Closing balance
Non-executive Directors
Peter Polson – – – 37,735 37,735
Ariane Barker – – – 18,867 18,867
Professor David Battersby AM
– – – – –
Belinda Robinson – – – 6,000 6,000
Greg West – – – – –
Chris Leptos AM – – – 18,867 18,867
Former Non-executive
Greg Hill2 – – – n/a n/a
Michael Ilczynski2 – – – n/a n/a
Eddie Collis2 – – – n/a n/a
Joe Powell2 – – – n/a n/a
Peter Everingham2 – – – n/a n/a
1. These amounts represent ordinary shares purchased or sold directly or indirectly by the Non-executive Directors during the financial year. These transactions have no connection with the roles and responsibilities as employees of the Group
2. Greg Hill, Michael Ilczynski, Eddie Collis and Joe Powell retired as Directors on 12 November 2015. Peter Everingham retired on 23 March 2015
This report is made in accordance with a resolution of the Directors.
Peter Polson Andrew BarklaChairman Managing Director
Melbourne24 August 2016

47Personal journeys, global growth
Liability limited by a scheme approved under Professional Standards Legislation. 35
Member of Deloitte Touche Tohmatsu Limited
Deloitte Touche Tohmatsu ABN 74 490 121 060 550 Bourke Street Melbourne VIC 3000 GPO Box 78 Melbourne VIC 3001 Australia Tel: +61 3 9671 7000 Fax: +61 3 9671 7001 www.deloitte.com.au
The Board of Directors IDP Education Limited Level 8, 535 Bourke Street Melbourne VIC 3000
24 August 2016
Dear Board Members
IDP Education Limited
In accordance with section 307C of the Corporations Act 2001, I am pleased to provide the following declaration of independence to the directors of IDP Education Limited.
As lead audit partner for the audit of the financial statements of IDP Education Limited for the financial year ended 30 June 2016, I declare that to the best of my knowledge and belief, there have been no contraventions of:
(i) the auditor independence requirements of the Corporations Act 2001 in relation to the audit; and
(ii) any applicable code of professional conduct in relation to the audit.
Yours sincerely
DELOITTE TOUCHE TOHMATSU
Chris Biermann Partner Chartered Accountants
Auditor’s independence declaration
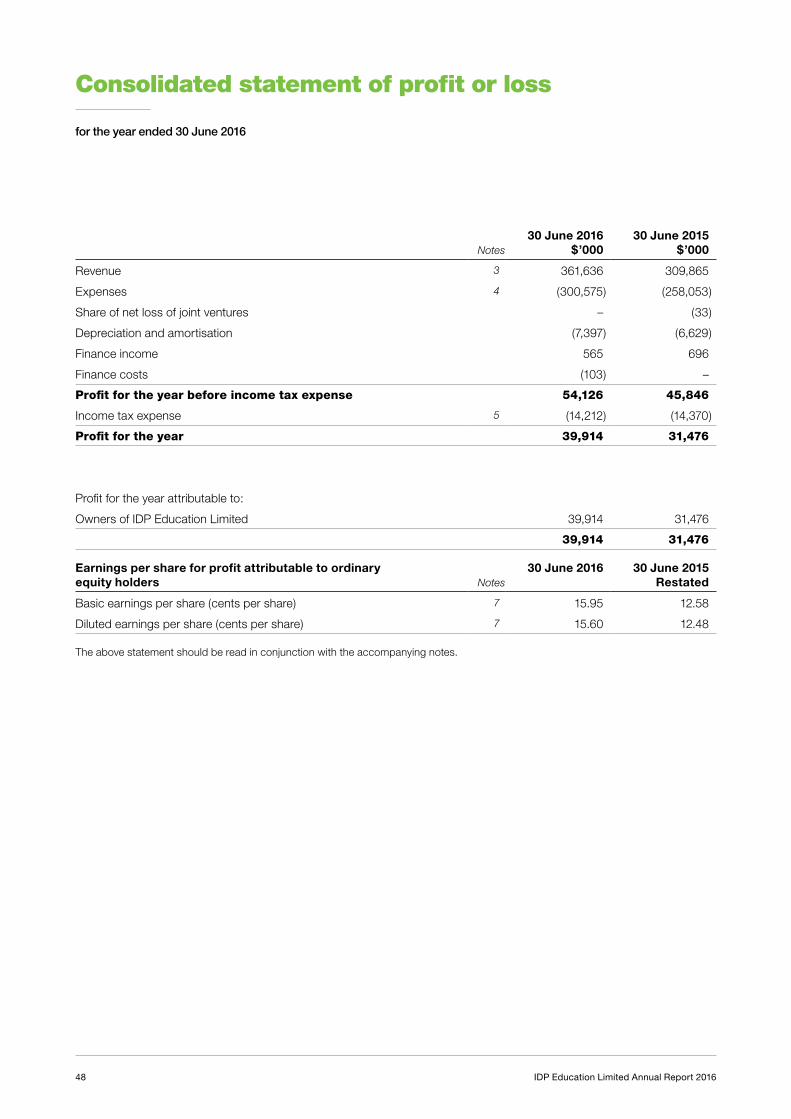
48 IDP Education Limited Annual Report 2016
Consolidated statement of profit or loss
for the year ended 30 June 2016
Notes30 June 2016
$’00030 June 2015
$’000
Revenue 3 361,636 309,865
Expenses 4 (300,575) (258,053)
Share of net loss of joint ventures – (33)
Depreciation and amortisation (7,397) (6,629)
Finance income 565 696
Finance costs (103) –
Profit for the year before income tax expense 54,126 45,846
Income tax expense 5 (14,212) (14,370)
Profit for the year 39,914 31,476
Profit for the year attributable to:
Owners of IDP Education Limited 39,914 31,476
39,914 31,476
Earnings per share for profit attributable to ordinary equity holders Notes
30 June 2016 30 June 2015 Restated
Basic earnings per share (cents per share) 7 15.95 12.58
Diluted earnings per share (cents per share) 7 15.60 12.48
The above statement should be read in conjunction with the accompanying notes.
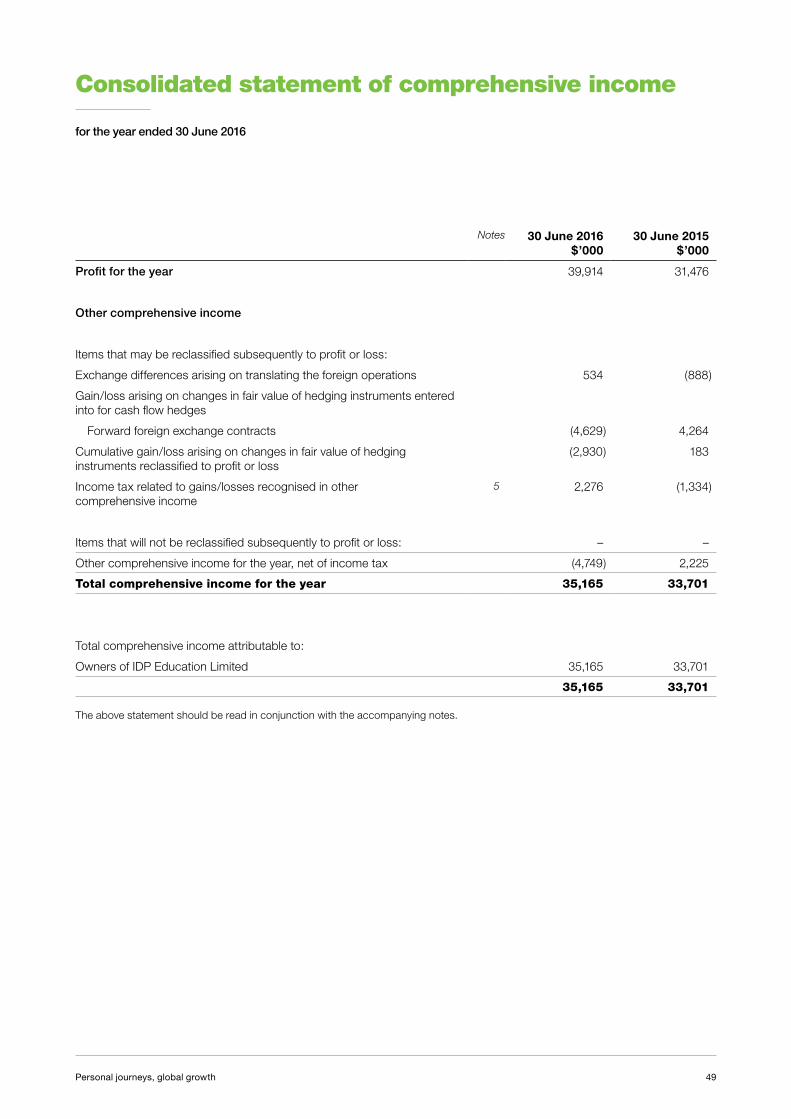
49Personal journeys, global growth
Consolidated statement of comprehensive income
for the year ended 30 June 2016
Notes 30 June 2016 $’000
30 June 2015 $’000
Profit for the year 39,914 31,476
Other comprehensive income
Items that may be reclassified subsequently to profit or loss:
Exchange differences arising on translating the foreign operations 534 (888)
Gain/loss arising on changes in fair value of hedging instruments entered into for cash flow hedges
Forward foreign exchange contracts (4,629) 4,264
Cumulative gain/loss arising on changes in fair value of hedging instruments reclassified to profit or loss
(2,930) 183
Income tax related to gains/losses recognised in other comprehensive income
5 2,276 (1,334)
Items that will not be reclassified subsequently to profit or loss: – –
Other comprehensive income for the year, net of income tax (4,749) 2,225
Total comprehensive income for the year 35,165 33,701
Total comprehensive income attributable to:
Owners of IDP Education Limited 35,165 33,701
35,165 33,701
The above statement should be read in conjunction with the accompanying notes.

50 IDP Education Limited Annual Report 2016
Consolidated statement of financial position
as at 30 June 2016
Notes30 June 2016
$’00030 June 2015
$’000
CURRENT ASSETS
Cash and cash equivalents 16 35,353 51,184
Trade and other receivables 8 31,114 27,995
Derivative financial instruments 19 838 5,992
Current tax assets 698 1,102
Other current assets 12 9,270 9,852
Total current assets 77,273 96,125
NON-CURRENT ASSETS
Property, plant and equipment 10 11,299 8,495
Intangible assets 11 53,360 56,816
Capitalised development costs 9 6,096 2,625
Deferred tax assets 5 5,619 1,291
Derivative financial instruments 19 176 –
Other non-current assets 253 –
Total non-current assets 76,803 69,227
TOTAL ASSETS 154,076 165,352
CURRENT LIABILITIES
Trade and other payables 13 41,300 41,176
Deferred revenue 14 14,111 15,329
Provisions 15 7,087 5,884
Current tax liabilities 2,837 5,019
Financial liabilities at fair value through profit or loss 19 2,356 –
Derivative financial instruments 19 3,996 163
Total current liabilities 71,687 67,571
NON-CURRENT LIABILITIES
Trade and other payables 13 102 1,143
Financial liabilities at fair value through profit or loss 19 – 2,836
Derivative financial instruments 19 268 –
Provisions 15 2,701 2,367
Total non-current liabilities 3,071 6,346
TOTAL LIABILITIES 74,758 73,917
NET ASSETS 79,318 91,435
EQUITY
Issued capital 18 25,050 27,450
Reserves (639) 992
Retained earnings 54,907 62,993
TOTAL EQUITY 79,318 91,435
The above statement should be read in conjunction with the accompanying notes.
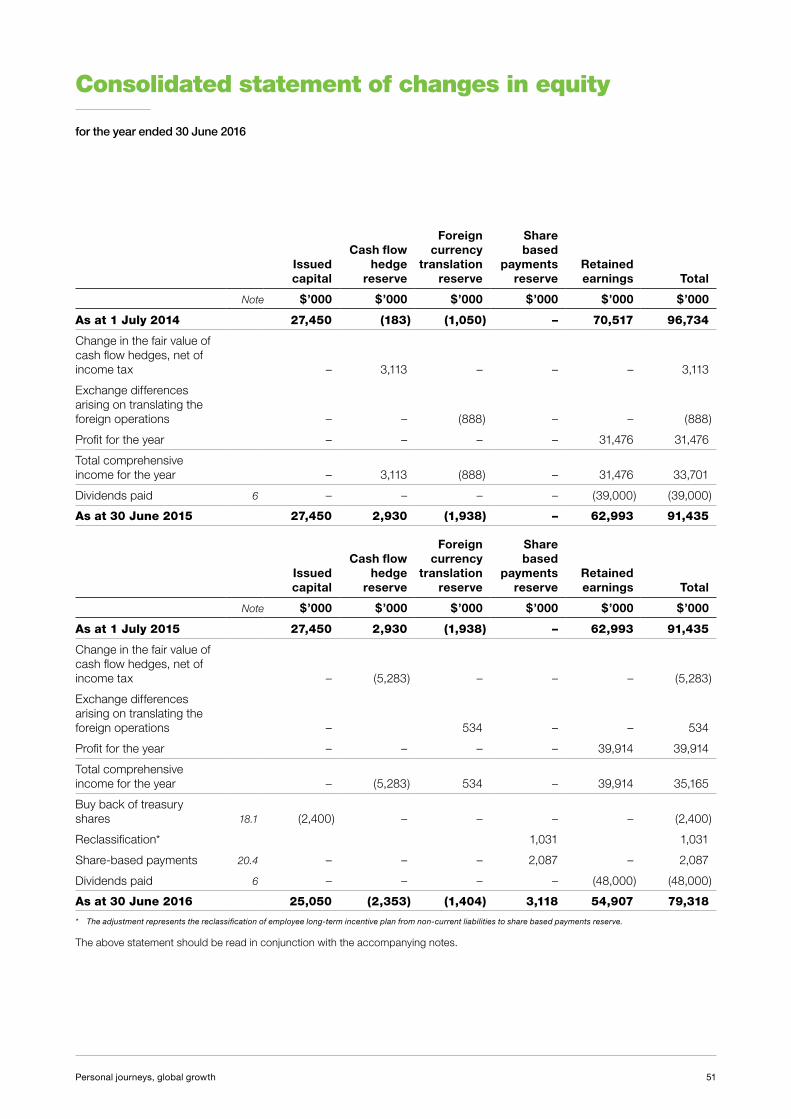
51Personal journeys, global growth
Consolidated statement of changes in equity
for the year ended 30 June 2016
Issued capital
Cash flow hedge
reserve
Foreign currency
translation reserve
Share based
payments reserve
Retained earnings Total
Note $’000 $’000 $’000 $’000 $’000 $’000
As at 1 July 2014 27,450 (183) (1,050) – 70,517 96,734
Change in the fair value of cash flow hedges, net of income tax – 3,113 – – – 3,113
Exchange differences arising on translating the foreign operations – – (888) – – (888)
Profit for the year – – – – 31,476 31,476
Total comprehensive income for the year – 3,113 (888) – 31,476 33,701
Dividends paid 6 – – – – (39,000) (39,000)
As at 30 June 2015 27,450 2,930 (1,938) – 62,993 91,435
Issued capital
Cash flow hedge
reserve
Foreign currency
translation reserve
Share based
payments reserve
Retained earnings Total
Note $’000 $’000 $’000 $’000 $’000 $’000
As at 1 July 2015 27,450 2,930 (1,938) – 62,993 91,435
Change in the fair value of cash flow hedges, net of income tax – (5,283) – – – (5,283)
Exchange differences arising on translating the foreign operations – 534 – – 534
Profit for the year – – – – 39,914 39,914
Total comprehensive income for the year – (5,283) 534 – 39,914 35,165
Buy back of treasury shares 18.1 (2,400) – – – – (2,400)
Reclassification* 1,031 1,031
Share-based payments 20.4 – – – 2,087 – 2,087
Dividends paid 6 – – – – (48,000) (48,000)
As at 30 June 2016 25,050 (2,353) (1,404) 3,118 54,907 79,318
* The adjustment represents the reclassification of employee long-term incentive plan from non-current liabilities to share based payments reserve.
The above statement should be read in conjunction with the accompanying notes.

52 IDP Education Limited Annual Report 2016
Consolidated statement of cash flow
for the year ended 30 June 2016
Notes30 June 2016
$’00030 June 2015
$’000
CASH FLOWS FROM OPERATING ACTIVITIES
Receipts from customers 301,391 258,667
Payments to suppliers and employees (240,919) (198,844)
Interest received 567 696
Interest paid (103) –
Income tax paid (17,094) (16,026)
Net cash inflow from operating activities 16 43,842 44,493
CASH FLOWS FROM INVESTING ACTIVITIES
Acquisition of a subsidiary, net of cash acquired – (1,589)
Payments for plant and equipment, intangible assets and capitalised development costs
(9,166) (8,100)
Proceeds from sale of plant and equipment – 30
Net cash outflow from investing activities (9,166) (9,659)
CASH FLOWS FROM FINANCING ACTIVITIES
Proceeds from borrowings 15,000 –
Repayments of borrowings (15,000) –
Payments for treasury shares (2,400) –
Dividends paid (48,000) (39,000)
Net cash outflow from financing activities (50,400) (39,000)
Net decrease in cash and cash equivalents (15,724) (4,166)
Cash and cash equivalents at the beginning of the year 51,184 52,961
Effect of exchange rates on cash holdings in foreign currencies (107) 2,389
Cash and cash equivalents at the end of the year 16 35,353 51,184
The above statement should be read in conjunction with the accompanying notes.

53Personal journeys, global growth
Notes to the consolidated financial statements
for the year ended 30 June 2016
1. BASIS OF PREPARATIONThis general purpose financial report for the year ended 30 June 2016 has been prepared in accordance with Australian Accounting Standards, other authoritative pronouncements of the Australian Accounting Standards Board (AASB) and the Corporations Act 2001.
The financial statements are for the consolidated entity, consisting of IDP Education Limited (the Company) and its controlled subsidiaries (the Group). IDP Education Limited is a company limited by shares whose shares are publicly traded on the Australian Securities Exchange (ASX). The Company was admitted to the official list of the ASX on 26 November 2015.
The consolidated financial statements for the year ended 30 June 2016 were authorised for issue in accordance with a resolution of the Directors on 24 August 2016.
1.1. Compliance with IFRS
This general purpose financial report complies with Australian Accounting Standards. Compliance with Australian Accounting Standards ensures that the financial report, comprising the financial statements and the notes thereto, complies with International Financial Reporting Standards (IFRS) as issued by the International Accounting Standards Board (IASB).
1.2. Historical cost convention
The consolidated financial statements have been prepared on the basis of historical cost, except for certain financial assets and financial liabilities (including derivative instruments) that have been recognised at fair value through profit and loss.
1.3. Significant accounting policies
The principal accounting policies adopted in the preparation of the financial report are set out in the relevant notes except for those disclosed in notes 1.8 to 1.9.
The accounting policies adopted are consistent with those of the previous financial year except as noted. When the presentation or classification of items in the financial report is amended, comparative amounts are also reclassified.
The consolidated financial statements have been prepared on a going concern basis.
1.4. Critical accounting estimates and judgements
The preparation of financial statements requires the use of certain critical accounting estimates. It also requires management to exercise its judgement in the process of applying the Group’s accounting policies. The areas involving a higher degree of judgement or complexity, or areas where assumptions and estimates are significant to the financial statements, are disclosed in the following notes:
• Note 11 – Intangible assets – Impairment test of goodwill and intangible assets with indefinite useful lives
• Note 19.3 – Fair value of financial instruments
• Note 20 – Fair value of share-based payments
1.5. Rounding of amounts
The Company is of a kind referred to in ASIC Corporations (Rounding in Financial/Directors’ Reports) Instrument 2016/191 and in accordance with that Instrument, amounts in the consolidated financial statements and the Directors’ report have been rounded to the nearest thousand dollars unless otherwise stated.

Notes to the consolidated financial statements
continued
54 IDP Education Limited Annual Report 2016
1. BASIS OF PREPARATION (continued)
1.6. Adoption of new and revised Accounting Standards
The Group applied, for the first time, certain standards and amendments which are effective for annual periods beginning on or after 1 July 2015. The nature and the impact of each new standard and/or amendment are described below:
AASB 2015-3 ‘Amendments to Australian Accounting Standards arising from the Withdrawal of AASB 1031 Materiality’
This amendment completes the withdrawal of references to AASB 1031 in all Australian Accounting Standards and Interpretations, allowing that Standard to effectively be withdrawn.
The application of this amendment does not have any material impact on the disclosures or the amounts recognised in the Group’s consolidated financial statements.
1.7. Standards and Interpretations in issue not yet effective
At the date of authorisation of the consolidated financial statements, the Standards and Interpretations listed below were in issue but not yet effective.
Standard and Interpretation
Effective for annual reporting periods beginning on or after
Expected to be initially applied in the financial year ending
AASB 9 ‘Financial Instruments’, and the relevant amending standards 1 January 2018 30 June 2019
AASB 15 ‘Revenue from Contracts with Customers’ and AASB 2014-5 ‘Amendments to Australian Accounting Standards arising from AASB 15’
1 January 2018 30 June 2019
AASB 16 ‘Leases’ 1 January 2019 30 June 2020
AASB 2016-3 ‘Amendments to Australian Accounting Standards – Clarifications to AASB 15’
1 January 2018 30 June 2019
The Directors have yet to assess the impact of the adoption of these Standards and Interpretations in future periods on the financial statements of the Group.
AASB 2014-3 ‘Amendments to Australian Accounting Standards – Accounting for Acquisitions of Interests in Joint Operations’
1 January 2016 30 June 2017
AASB 2014-4 ‘Amendments to Australian Accounting Standards – Clarification of Acceptable Methods of Depreciation and Amortisation’
1 January 2016 30 June 2017
AASB 2014-9 ‘Amendments to Australian Accounting Standards – Equity Method in Separate Financial Statements’
1 January 2016 30 June 2017
AASB 2014-10 ‘Amendments to Australian Accounting Standards – Sale or Contribution of Assets between an Investor and its Associate or Joint Venture’, AASB 2015-10 ‘Amendments to Australian Accounting Standards – Effective Date of Amendments to AASB 10 and AASB 128’
1 January 2018 30 June 2019
AASB 2015-1 ‘Amendments to Australian Accounting Standards – Annual Improvements to Australian Accounting Standards 2012-2014 Cycle’
1 January 2016 30 June 2017
AASB 2015-2 ‘Amendments to Australian Accounting Standards – Disclosure Initiative: Amendments to AASB 101’
1 January 2016 30 June 2017
AASB 2016-1 ‘Amendments to Australian Accounting Standards – Recognition of Deferred Tax Assets for Unrealised Losses’
1 January 2017 30 June 2018
AASB 2016-5 Amendments to Australian Accounting Standards – Classification and Measurement of Share-based Payment Transactions
1 January 2018 30 June 2019
The adoption of above amendments will not have material impact in future periods on the financial statements of the Group.
55Personal journeys, global growth
1. BASIS OF PREPARATION (continued)
1.8. Basis of consolidation
The consolidated financial statements comprise the financial statements of the Company and its subsidiaries as at 30 June 2016. Control is achieved when the Group is exposed, or has rights, to variable returns from its involvement with the investee and has the ability to affect those returns through its power over the investee. Specifically, the Group controls an investee if and only if the Group has:
> Power over the investee (i.e. existing rights that give it the current ability to direct the relevant activities of the investee);
> Exposure, or rights, to variable returns from its involvement with the investee; and
> The ability to use its power over the investee to affect its returns
The Group re-assesses whether or not it controls an investee if facts and circumstances indicate that there are changes to one or more of the three elements of control. Consolidation of a subsidiary begins when the Group obtains control over the subsidiary and ceases when the Group loses control of the subsidiary. Assets, liabilities, income and expenses of a subsidiary acquired or disposed of during the year are included in the consolidated financial statements from the date the Group gains control until the date the Group ceases to control the subsidiary.
Profit or loss and each component of Other Comprehensive Income (OCI) are attributed to the equity holders of the parent of the Group and to the non-controlling interests, even if this results in the non-controlling interests having a deficit balance. When necessary, adjustments are made to the financial statements of subsidiaries to bring their accounting policies into line with the Group’s accounting policies. All intra-group assets and liabilities, equity, income, expenses and cash flows relating to transactions between members of the Group are eliminated in full on consolidation.
1.9. Foreign currency translation
The Group’s consolidated financial statements are presented in Australian dollars, which is also the parent’s functional currency. For each Group controlled entity, the Group determines the functional currency and items included in the financial statements of each Group controlled entity are measured using that functional currency.
Transactions and balances
Transactions in foreign currencies are initially recorded at the rates of exchange prevailing on the dates of the transactions. At each subsequent balance sheet date:
(i) Foreign currency monetary items are retranslated at the rates prevailing at the balance sheet date. Exchange differences arising on the settlement or retranslation of monetary items are recognised in the profit or loss with exception of monetary items that are designated as part of the hedge of the Group’s net investment of a foreign operation; and
(ii) Non-monetary items which are measured at historical cost are not retranslated.
Group consolidation
On consolidation, the assets and liabilities of foreign operations are translated into Australian dollars at the rate of exchange prevailing at the reporting date and their statements of profit or loss are translated at exchange rates prevailing at the dates of the transactions. The exchange differences arising on translation for consolidation purposes are recognised in other comprehensive income. On disposal of a foreign operation, the component of other comprehensive income relating to that particular foreign operation is recognised in profit or loss.
Any goodwill arising on the acquisition of a foreign operation and any fair value adjustments to the carrying amounts of assets and liabilities arising on the acquisition are treated as assets and liabilities of the foreign operation and translated at the spot rate of exchange at the reporting date.

Notes to the consolidated financial statements
continued
56 IDP Education Limited Annual Report 2016
FINANCIAL PERFORMANCE
2. SEGMENT INFORMATIONBasis of segmentation
The Group has identified its operating segments based on the internal reports that are reviewed and used by the Chief Operating Decision Maker in assessing performance and in determining the allocation of resources. The Chief Operation Decision Maker, who is responsible for allocating resources and assessing performance of the operating segments, has been identified as the Chief Executive Officer.
The Chief Operating Decision Maker determined that its operating segments comprise the geographic regions of:
> Asia – which includes India, Malaysia, Indonesia, Mauritius, Bangladesh, Nepal, Sri Lanka, Singapore, Cambodia, Philippines, Vietnam, Thailand, Laos, China, Taiwan, Hong Kong and South Korea;
> Australasia – which includes Australia, New Zealand, Fiji and New Caledonia; and
> Rest of World – which includes Saudi Arabia, UAE, Turkey, Pakistan, Oman, Kuwait, Bahrain, Qatar, Egypt, Jordan, Libya, Azerbaijan, Iran, Canada, Russia, Germany, Mexico, Argentina, Columbia, Kazakhstan, Ukraine and South Africa
These geographic segments are based on the Group’s management reporting system and the way management views the business. No operating segments have been aggregated in arriving at the reportable segments of the Group.
The principal activities of each segment are provision of student placement services, International English Language Testing (IELTS) and English language teaching services.
Segment revenue and results
Segment revenue Segment EBIT
30 June 2016 $’000
30 June 2015 $’000
30 June 2016 $’000
30 June 2015 $’000
Asia 220,258 163,322 64,146 46,750
Australasia 70,403 83,351 19,777 24,932
Rest of World 70,975 63,159 13,892 12,090
Consolidated total 361,636 309,832 97,815 83,772
Share of loss of joint ventures – 33 – –
Revenue 361,636 309,865 – –
Corporate cost (44,151) (38,622)
Segment EBIT 53,664 45,150
Net finance income 462 696
Profit before tax 54,126 45,846
Information about major customers
No single customer contributed 10% or more to the Group’s revenue for either 2016 or 2015.

57Personal journeys, global growth
2. SEGMENT INFORMATION (continued)
Service segment
The Group also uses a secondary segment which shows revenue and gross profit by service. Revenue by service segment is disclosed in Note 3. Gross profit by service segment is shown below:
30 June 2016 $’000
30 June 2015 $’000
Student placement 78,228 59,033
IELTS examination 95,065 80,509
English language teaching 13,435 11,041
Event and other 1,635 2,208
188,363 152,791
3. REVENUEAccounting policy
Revenue is measured at the fair value of the consideration received or receivable.
The Group recognises revenue when the amount of revenue can be reliably measured, it is probable that future economic benefits will flow to the entity and specific criteria have been met for each of the Group’s activities as described below.
(i) Student placement revenue
Student placement revenue is recognised when student enrolments are confirmed, subject to the Group assessing that, based on the terms of the relevant contract and relevant past experience on student withdrawal rates, it is probable that the Group will be entitled to those fees.
As a result, the recognition date can and does vary between markets depending on the maturity of the market and relevant factors such as availability of supporting data and other evidence used to assess probability of entitlement in the context of the relevant customer contract. These factors are reviewed regularly and where appropriate the recognition date is updated.
The Company is not entitled to fees for confirmed student enrolments that are subsequently withdrawn prior to a date specified in the contract, typically the student census date. Accordingly, allowance provisions, where applicable, are established based on historical information for student withdrawals.
(ii) IELTS revenue
Revenue for English language testing is generally recognised when testing has been completed.
(iii) English language teaching revenue
Revenue for English language teaching is generally recognised on a percentage of course completion basis.
(iv) Event revenue
Event revenue is recognised once an exhibition has been held.
(v) Other revenue
Other revenue is the recognised when the service is provided and the fee is received.

Notes to the consolidated financial statements
continued
58 IDP Education Limited Annual Report 2016
3. REVENUE (continued)
30 June 2016 $’000
30 June 2015 $’000
Student placement revenue 92,428 69,450
IELTS examination revenue 237,147 213,492
English language teaching revenue 20,305 16,182
Event revenue 8,045 7,623
Other revenue 3,711 3,118
361,636 309,865
4. EXPENSES
30 June 2016 $’000
30 June 2015 $’000
Student placement direct costs 14,200 10,417
IELTS examination direct costs 142,082 132,983
English language teaching direct costs 6,870 5,141
Event direct costs 8,729 7,392
Other direct costs 1,392 1,108
Employee benefits expense 79,366 61,782
Occupancy expenses 14,263 11,378
Marketing expenses 11,784 9,126
Administrative expenses 6,323 5,192
IT and communication expenses 4,870 4,160
Consultancy and professional expenses 5,621 5,544
Foreign exchange (gain)/loss 154 (656)
Other expenses 4,921 4,486
300,575 258,053

59Personal journeys, global growth
5. INCOME TAXESAccounting policy
IDP Education Limited is the head entity in a tax-consolidated group under Australian taxation law. As a result the Company and Australian entities controlled by the Company are all subject to income tax through membership of the tax-consolidated group. The consolidated current and deferred tax amounts for the tax-consolidated group are allocated to the members of the tax-consolidated group using the ‘separate taxpayer within group’ approach, with deferred taxes being allocated by reference to the carrying amounts in the financial statements of each member entity and the tax values applying under tax consolidation. Current tax liabilities and assets and deferred tax assets arising from unused tax losses and relevant tax credits arising from this allocation process are then accounted for as immediately assumed by the head entity, as under Australian taxation law the head entity has the legal obligation (or right) to these amounts.
Entities within the tax-consolidated group have entered into a tax funding arrangement and a tax sharing agreement with the head entity. Under the terms of the tax funding arrangement, the entities controlled by the Group have agreed to pay an amount to or from the head entity equal to the tax liability or asset assumed by the head entity for that period as noted above. Such amounts are reflected in amounts receivable from or payable to the head entity. Accordingly, the amount arising under the tax funding arrangement for each period is equal to the tax liability or asset assumed by the head entity for that period and no contribution from (or distribution to) equity participants arises in relation to income taxes.
Income tax expense comprises current and deferred tax. Income tax expense is recognised in the profit or loss except to the extent it relates to items recognised directly in equity in which case it is recognised in equity.
Current tax is the expected tax payable on the taxable income for the year, using tax rates enacted or substantively enacted at the reporting date, and any adjustment to tax payable in respect of previous years.
Deferred tax is recognised using the balance sheet method providing for temporary differences between the carrying amounts of assets and liabilities for financial reporting purposes and the amounts used for taxation purposes. Deferred tax is not recognised for the following temporary differences:
(i) The initial recognition of assets or liabilities in a transaction that is not a business combination;
(ii) The initial recognition of goodwill; and
(iii) The initial recognition of assets and liabilities in a transaction which at the time of the transaction affects neither accounting profit nor taxable profit (tax loss).
Deferred tax assets and liabilities are measured at the tax rates that are expected to apply in the period in which the liability is settled or the asset realised, based on tax rates (and tax laws) that have been enacted or substantially enacted by the end of the reporting period. The measurement of deferred tax liabilities and assets reflects the tax consequences that would follow from the manner in which the Group expects, at the end of the reporting period, to recover or settle the carrying amount of its assets and liabilities.
A deferred tax asset is recognised to the extent that it is probable that future tax profits will be available against which the temporary difference can be utilised. Deferred tax assets are reviewed each reporting date and are reduced to the extent that it is no longer probable that the related tax benefit will be realised.
Research and development incentive
Research and development (R&D) incentives are accounted for in accordance with AASB 120 ‘Accounting for Government Grants and Disclosure of Government Assistance’. R&D incentives are assistance to the Group by the Australian Government in the form of a reduction in income tax liability in return for expenditure on eligible R&D as registered with AusIndustry. R&D incentives receivable as compensation for expenses or losses already incurred by the Group with no future related costs are recognised in profit or loss in the period in which they are quantified and become receivable. The amount of R&D incentives received or receivable in respect of eligible R&D as registered with AusIndustry that is in excess of the amount that would have otherwise been deductible in calculating income tax expense are included in other revenue.
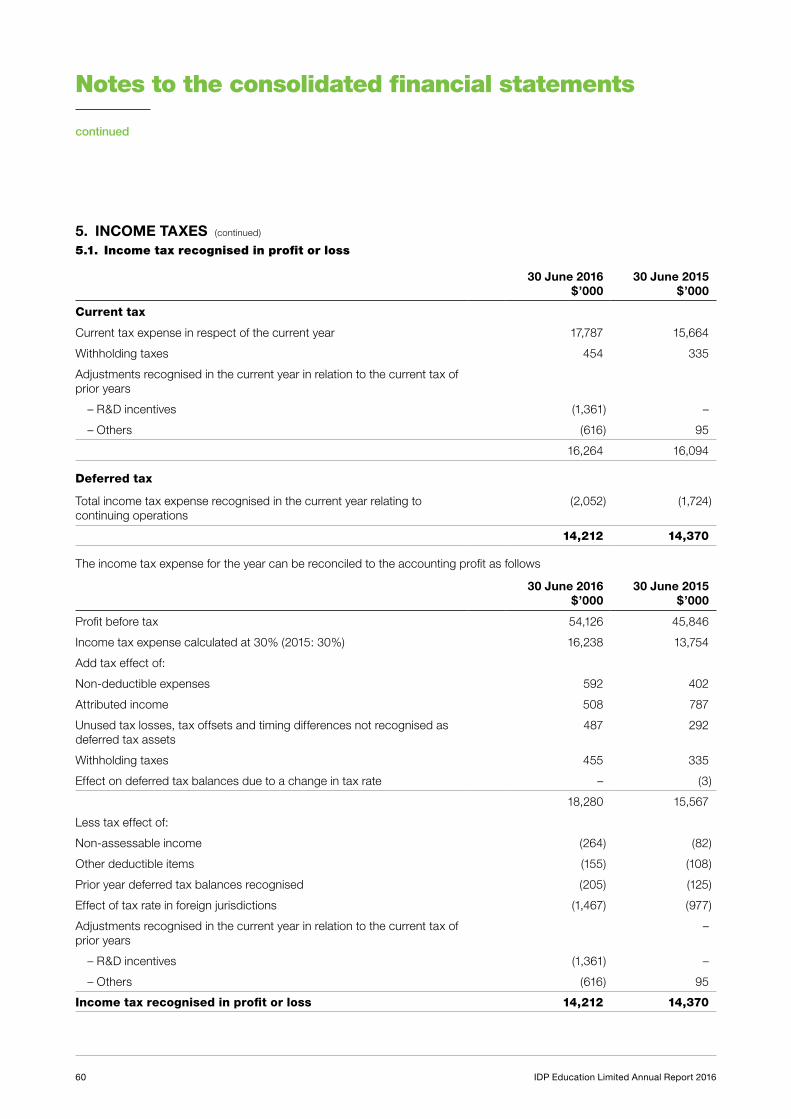
Notes to the consolidated financial statements
continued
60 IDP Education Limited Annual Report 2016
5. INCOME TAXES (continued)
5.1. Income tax recognised in profit or loss
30 June 2016 $’000
30 June 2015 $’000
Current tax
Current tax expense in respect of the current year 17,787 15,664
Withholding taxes 454 335
Adjustments recognised in the current year in relation to the current tax of prior years
– R&D incentives (1,361) –
– Others (616) 95
16,264 16,094
Deferred tax
Total income tax expense recognised in the current year relating to continuing operations
(2,052) (1,724)
14,212 14,370
The income tax expense for the year can be reconciled to the accounting profit as follows
30 June 2016 $’000
30 June 2015 $’000
Profit before tax 54,126 45,846
Income tax expense calculated at 30% (2015: 30%) 16,238 13,754
Add tax effect of:
Non-deductible expenses 592 402
Attributed income 508 787
Unused tax losses, tax offsets and timing differences not recognised as deferred tax assets
487 292
Withholding taxes 455 335
Effect on deferred tax balances due to a change in tax rate – (3)
18,280 15,567
Less tax effect of:
Non-assessable income (264) (82)
Other deductible items (155) (108)
Prior year deferred tax balances recognised (205) (125)
Effect of tax rate in foreign jurisdictions (1,467) (977)
Adjustments recognised in the current year in relation to the current tax of prior years
–
– R&D incentives (1,361) –
– Others (616) 95
Income tax recognised in profit or loss 14,212 14,370

61Personal journeys, global growth
5. INCOME TAXES (continued)
5.2. Deferred tax balances
2016
Temporary differences and tax losses
Opening balance
Recognised in profit or
loss
Recognised in other
compre-hensive income Acquisitions
Closing balance
Accrued expenses 1,600 (575) – – 1,025
Deferred capital expenditure 86 10 – – 96
Employee benefits 1,611 678 – – 2,289
Plant, property and equipment 440 (70) – – 370
Derivative financial instruments – 447 1,011 – 1,458
Other 1,594 (138) – – 1,456
Trade receivable 11 2 – – 13
Unrealised foreign exchange losses
– 191 – – 191
Deferred tax assets 5,342 545 1,011 – 6,898
Derivative financial instruments (1,065) (200) 1,265 – –
Unrealised foreign exchange gains (545) 545 – – –
Plant, property and equipment (872) 814 – – (58)
Deferred revenue (402) 124 – – (278)
Intangible assets (945) 63 – – (882)
Other (222) 161 – – (61)
Deferred tax liabilities (4,051) 1,507 1,265 – (1,279)
Net deferred tax assets 1,291 2,052 2,276 – 5,619

Notes to the consolidated financial statements
continued
62 IDP Education Limited Annual Report 2016
5. INCOME TAXES (continued)
5.2. Deferred tax balances (continued)
2015
Temporary differences and tax losses
Opening balance
Recognised in profit or
loss
Recognised in other
compre-hensive income Acquisitions
Closing balance
Accrued expenses 1,253 347 – – 1,600
Deferred capital expenditure 272 (186) – – 86
Employee benefits 1,174 437 – – 1,611
Plant, property and equipment 728 (288) – – 440
Derivative financial instruments 227 – (227) – –
Other 216 1,378 – – 1,594
Tax losses 231 (231) – – –
Trade receivables 141 (130) – – 11
Unrealised foreign exchange losses
4 (4) – – –
Deferred tax assets 4,246 1,323 (227) – 5,342
Derivative financial instruments (158) 200 (1,107) – (1,065)
Unrealised foreign exchange gains (401) (144) – – (545)
Plant, property and equipment (1,519) 647 – – (872)
Deferred revenue (7) (395) – – (402)
Intangible assets – 5 – (950) (945)
Other (310) 88 – – (222)
Deferred tax liabilities (2,395) 401 (1,107) (950) (4,051)
Net deferred tax assets 1,851 1,724 (1,334) (950) 1,291
5.3. Unrecognised deferred tax assets
30 June 2016 $’000
30 June 2015 $’000
Deductible temporary differences, unused tax losses and unused tax credits for which no deferred tax assets have been recognised are attributable to the following:
— tax losses 2,108 1,620
The unrecognised tax losses will expire between 5 years and 10 years.
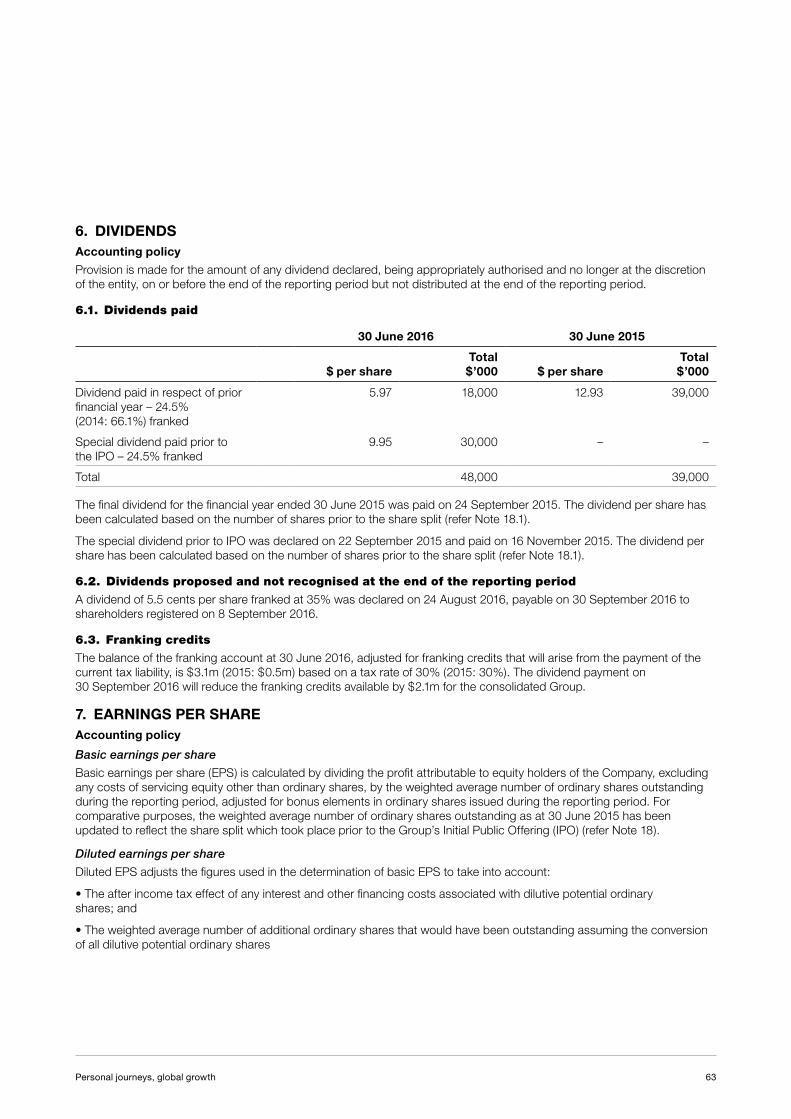
63Personal journeys, global growth
6. DIVIDENDSAccounting policy
Provision is made for the amount of any dividend declared, being appropriately authorised and no longer at the discretion of the entity, on or before the end of the reporting period but not distributed at the end of the reporting period.
6.1. Dividends paid
30 June 2016 30 June 2015
$ per shareTotal $’000 $ per share
Total $’000
Dividend paid in respect of prior financial year – 24.5% (2014: 66.1%) franked
5.97 18,000 12.93 39,000
Special dividend paid prior to the IPO – 24.5% franked
9.95 30,000 – –
Total 48,000 39,000
The final dividend for the financial year ended 30 June 2015 was paid on 24 September 2015. The dividend per share has been calculated based on the number of shares prior to the share split (refer Note 18.1).
The special dividend prior to IPO was declared on 22 September 2015 and paid on 16 November 2015. The dividend per share has been calculated based on the number of shares prior to the share split (refer Note 18.1).
6.2. Dividends proposed and not recognised at the end of the reporting period
A dividend of 5.5 cents per share franked at 35% was declared on 24 August 2016, payable on 30 September 2016 to shareholders registered on 8 September 2016.
6.3. Franking credits
The balance of the franking account at 30 June 2016, adjusted for franking credits that will arise from the payment of the current tax liability, is $3.1m (2015: $0.5m) based on a tax rate of 30% (2015: 30%). The dividend payment on 30 September 2016 will reduce the franking credits available by $2.1m for the consolidated Group.
7. EARNINGS PER SHAREAccounting policy
Basic earnings per share
Basic earnings per share (EPS) is calculated by dividing the profit attributable to equity holders of the Company, excluding any costs of servicing equity other than ordinary shares, by the weighted average number of ordinary shares outstanding during the reporting period, adjusted for bonus elements in ordinary shares issued during the reporting period. For comparative purposes, the weighted average number of ordinary shares outstanding as at 30 June 2015 has been updated to reflect the share split which took place prior to the Group’s Initial Public Offering (IPO) (refer Note 18).
Diluted earnings per share
Diluted EPS adjusts the figures used in the determination of basic EPS to take into account:
• The after income tax effect of any interest and other financing costs associated with dilutive potential ordinary shares; and
• The weighted average number of additional ordinary shares that would have been outstanding assuming the conversion of all dilutive potential ordinary shares

Notes to the consolidated financial statements
continued
64 IDP Education Limited Annual Report 2016
7. EARNINGS PER SHARE (continued)
30 June 2016 Cents
30 June 2015 Restated
Cents
Basic Diluted Basic Diluted
Earnings per share 15.95 15.60 12.58 12.48
Earnings used in calculating earnings per share30 June 2016
$00030 June 2015
$000
Earnings used in the calculation of basic and diluted earnings per share 39,914 31,476
Weighted average number of shares used as the denominator 30 June 2016 30 June 2015
Weighted average number of shares used as denominator in calculating basic EPS
250,294,966 250,294,966
Weighted average of potential dilutive ordinary shares:
— options 3,615,616 –
— performance rights 1,888,317 1,837,552
Weighted average number of shares used as denominator in calculating diluted EPS
255,798,899 252,132,518
A share split took place prior to the Group’s IPO in the year ended 30 June 2016 (refer Note 18). The basic and diluted earnings per share presented for both the current and comparative year are calculated using the number of shares on issue following the share split.
ASSETS AND LIABILITIES
8. TRADE AND OTHER RECEIVABLESAccounting policy
Trade receivables, which generally have 30 to 60 day terms, are initially recognised at fair value and are subsequently measured at amortised cost using the effective interest rate method less an allowance for any uncollectible amounts.
Collectability of trade receivables is reviewed on an ongoing basis. Debts that are known to be uncollectible are written off when identified.
An allowance for doubtful debts is made when there is objective evidence that a trade receivable is impaired. The amount of the allowance is measured as the difference between the carrying amount of the trade receivables and the present value of the estimated future cash flows expected to be recovered from the relevant debtors.
30 June 2016 $’000
30 June 2015 $’000
Trade receivables 25,993 22,993
Allowance for doubtful debts (78) (151)
25,915 22,842
Other receivables 5,199 5,153
31,114 27,995
Included in the Group’s trade receivable balance are debtors with a carrying amount of $8.9m (2015: $4.9m) which are past due at the reporting date for which the Group has not provided as there has not been a significant change in credit quality and the amounts are still considered recoverable.
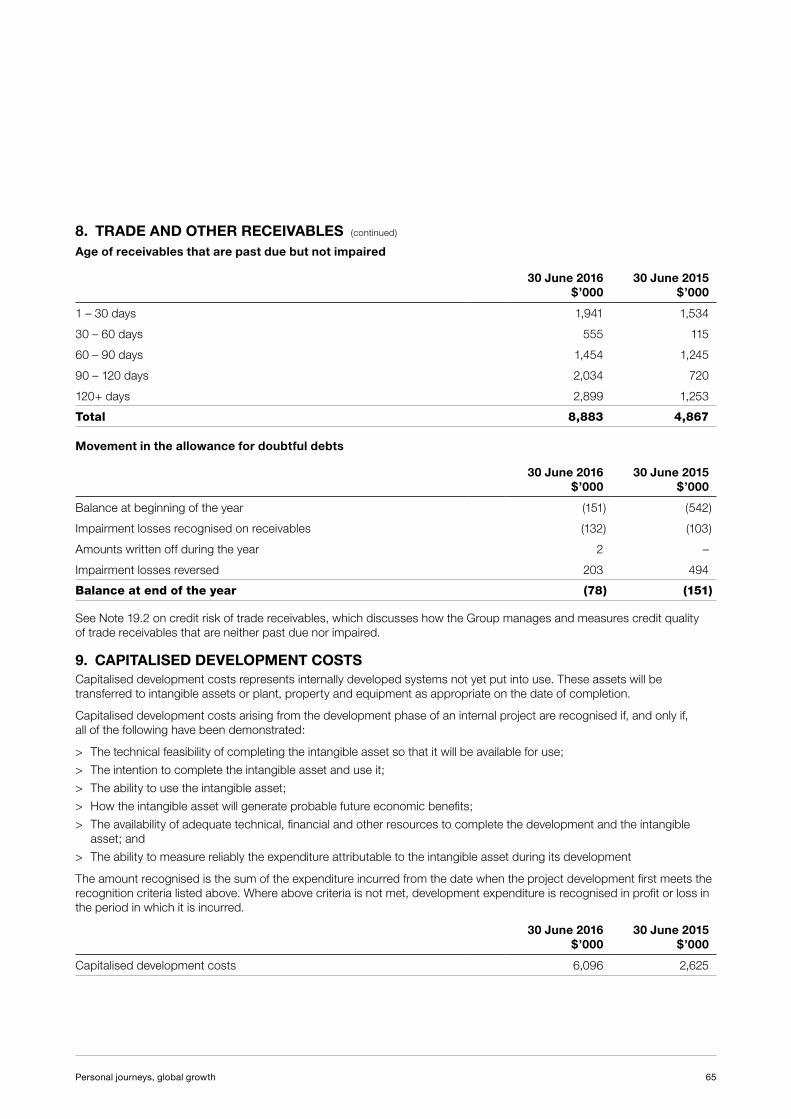
65Personal journeys, global growth
8. TRADE AND OTHER RECEIVABLES (continued)
Age of receivables that are past due but not impaired
30 June 2016 $’000
30 June 2015 $’000
1 – 30 days 1,941 1,534
30 – 60 days 555 115
60 – 90 days 1,454 1,245
90 – 120 days 2,034 720
120+ days 2,899 1,253
Total 8,883 4,867
Movement in the allowance for doubtful debts
30 June 2016 $’000
30 June 2015 $’000
Balance at beginning of the year (151) (542)
Impairment losses recognised on receivables (132) (103)
Amounts written off during the year 2 –
Impairment losses reversed 203 494
Balance at end of the year (78) (151)
See Note 19.2 on credit risk of trade receivables, which discusses how the Group manages and measures credit quality of trade receivables that are neither past due nor impaired.
9. CAPITALISED DEVELOPMENT COSTSCapitalised development costs represents internally developed systems not yet put into use. These assets will be transferred to intangible assets or plant, property and equipment as appropriate on the date of completion.
Capitalised development costs arising from the development phase of an internal project are recognised if, and only if, all of the following have been demonstrated:
> The technical feasibility of completing the intangible asset so that it will be available for use;
> The intention to complete the intangible asset and use it;
> The ability to use the intangible asset;
> How the intangible asset will generate probable future economic benefits;
> The availability of adequate technical, financial and other resources to complete the development and the intangible asset; and
> The ability to measure reliably the expenditure attributable to the intangible asset during its development
The amount recognised is the sum of the expenditure incurred from the date when the project development first meets the recognition criteria listed above. Where above criteria is not met, development expenditure is recognised in profit or loss in the period in which it is incurred.
30 June 2016 $’000
30 June 2015 $’000
Capitalised development costs 6,096 2,625

Notes to the consolidated financial statements
continued
66 IDP Education Limited Annual Report 2016
10. PROPERTY, PLANT AND EQUIPMENTAccounting policy
Property, plant and equipment is carried at cost, net of accumulated depreciation and impairment losses, if any. Property, plant and equipment are depreciated using the straight line basis over their estimated useful economic lives. The expected useful lives for each class of depreciable assets are:
Class of Fixed asset Depreciation rate
Leasehold Improvements Lease term
Plant and equipment 20-33%
Impairment
The carrying values of property, plant and equipment are reviewed annually for indications of impairment to ensure they are not in excess of the recoverable amount for these assets. An impairment loss is recognised to the extent that the carrying amount of an asset or cash-generating unit exceeds its recoverable amount.
The estimated useful lives, residual values and depreciation method are reviewed at the end of each reporting period, with the effect of any changes in estimate accounted for on a prospective basis.
Cost
Leasehold improvements
$’000
Plant and equipment
$’000Total $’000
Balance at 1 July 2014 7,746 9,135 16,881
Additions 3,064 2,891 5,955
Acquisitions through business combinations – 13 13
Disposals (773) (914) (1,687)
Balance at 30 June 2015 10,037 11,125 21,162
Additions 3,218 2,770 5,988
Disposals (728) (633) (1,361)
Balance at 30 June 2016 12,527 13,262 25,789
Accumulated depreciation
Balance at 1 July 2014 (4,730) (6,823) (11,553)
Depreciation for the year (1,206) (1,385) (2,591)
Disposals 639 838 1,477
Balance at 30 June 2015 (5,297) (7,370) (12,667)
Depreciation for the year (1,517) (2,278) (3,795)
Adjustments(1) – 797 797
Disposals 542 633 1,175
Balance at 30 June 2016 (6,272) (8,218) (14,490)
Net Book Value
At 30 June 2015 4,740 3,755 8,495
At 30 June 2016 6,255 5,044 11,299
(1) Represents the foreign currency translation adjustments relating to previous financial years
67Personal journeys, global growth
11. INTANGIBLE ASSETSCritical accounting estimates and assumptions
Impairment of goodwill and other intangible assets with indefinite useful lives
Goodwill and intangible assets with indefinite useful lives are allocated to a cash-generating unit (CGU) or group of CGUs and tested for impairment annually to determine whether they have suffered any impairment in accordance with the accounting policy stated below.
The recoverable amounts of the CGU or group of CGUs to which the assets have been allocated have been determined based on the value in use calculations. These calculations are performed based on cash flow projections and other supplementary information which, given their forward looking nature, require the adoption of assumptions and estimates.
The key assumptions and estimates utilised in management’s assessments relate primarily to:
> Three years cash flow forecasts sourced from internal budgets and management forecasts;
> Terminal value growth rates applied to the period beyond the three year cash flow forecasts; and
> Pre-tax discount rates, used to discount the cash flows to present value
Each of these assumptions and estimates is based on a “best estimate” at the time of performing the valuation. However, increase in discount rates or changes in other key assumptions, such as operating conditions or financial performance, may cause the carrying value of CGU or group of CGUs to exceed their recoverable amount.
Accounting policy
Intangible assets acquired separately are measured on initial recognition at cost. The cost of intangible assets acquired in a business combination is their fair value at the date of acquisition. Following initial recognition, intangible assets are carried at cost less any accumulated amortisation and accumulated impairment losses. Internally generated intangibles, excluding capitalised development costs, are not capitalised and the related expenditure is reflected in profit or loss in the period in which the expenditure is incurred.
The useful lives of intangible assets are assessed as either finite or indefinite.
Intangible assets with finite lives are amortised over the useful economic life and assessed for impairment whenever there is an indication that the intangible asset may be impaired. The amortisation period and the amortisation method for an intangible asset with a finite useful life are reviewed at least at the end of each reporting period. Changes in the expected useful life or the expected pattern of consumption of future economic benefits embodied in the asset are considered to modify the amortisation period or method, as appropriate, and are treated as changes in accounting estimates and adjusted on a prospective basis. The amortisation expense on intangible assets with finite lives is recognised in the statement of profit or loss as the expense category that is consistent with the function of the intangible assets.
Software
Software is amortised over the useful life of 3 to 5 years.
Student placement licence
Student placement licence is a separately identifiable intangible asset arising from a business combination and is recognised at fair value at the acquisition date. Student placement licence is amortised over 15 years.
Trade name
Trade name is a separately identifiable intangible asset arising from a business combination and is recognised at fair value at the acquisition date. Trade name is amortised over 15 years.
University relationship
University relationship is a separately identifiable intangible asset arising from a business combination and is recognised at fair value at the acquisition date. University relationship is amortised over 15 years.

Notes to the consolidated financial statements
continued
68 IDP Education Limited Annual Report 2016
11. INTANGIBLE ASSETS (continued)
Contracts for English language testing and Goodwill
Contracts for English language testing acquired on 1 September 2006 are recognised at their fair value at date of acquisition. There is no termination date in accordance with its term and management has re-assessed the events and circumstances, which supports an indefinite useful life assessment for Contracts for English language testing. These contracts are considered to have an indefinite useful life and as such are not amortised.
Contracts of English language testing and Goodwill are not amortised but are tested for impairment annually, or more frequently if events or changes in circumstances indicate that it might be impaired, and is carried at cost less accumulated impairment losses. Contracts of English language testing and Goodwill are allocated to CGUs for the purpose of impairment testing. The allocation is made to those CGUs or group of CGUs that are expected to benefit from the Contracts for English language testing and business combination in which the Goodwill arose.
CostSoftware
$’000
Student placement
licence $’000
Trade name $’000
University relation-
ship $’000
Goodwill $’000
Contracts for
English language
testing $’000
Total $’000
Balance at 1 July 2014 20,926 – – – 10,774 35,200 66,900
Additions 177 – – – – – 177
Transfer from capitalised development costs
1,550 – – – – – 1,550
Acquisitions through business combinations
– 2,493 1,059 249 2,451 – 6,252
Disposals (14) – – – – – (14)
Balance at 30 June 2015 22,639 2,493 1,059 249 13,225 35,200 74,865
Additions 146 – – – – – 146
Disposals – – – – – – –
Balance at 30 June 2016 22,785 2,493 1,059 249 13,225 35,200 75,011
Amortisation
Balance at 1 July 2014 (14,025) – – – – – (14,025)
Amortisation for the year (4,016) (14) (6) (2) – – (4,038)
Disposals 14 – – – – – 14
Balance at 30 June 2015 (18,027) (14) (6) (2) – – (18,049)
Amortisation for the year (3,349) (166) (71) (16) – – (3,602)
Disposals – – – – – – –
Balance at 30 June 2016 (21,376) (180) (77) (18) – – (21,651)
Net Book Value
At 30 June 2015 4,612 2,479 1,053 247 13,225 35,200 56,816
At 30 June 2016 1,409 2,313 982 231 13,225 35,200 53,360

69Personal journeys, global growth
11. INTANGIBLE ASSETS (continued)
Impairment testing and key assumptions
A summary by CGU of the carrying amount of goodwill and intangible assets with indefinite useful lives is detailed below:
2016 2015
CGU/Group of CGUsGoodwill
$’000
Contracts for English
language testing $’000
Goodwill $’000
Contracts for English
language testing $’000
Asia – IELTS testing 4,476 14,625 4,476 14,625
Australasia – IELTS testing 3,451 11,275 3,451 11,275
Rest of World – IELTS testing 2,847 9,300 2,847 9,300
China – Student placement 2,451 – 2,451 –
13,225 35,200 13,225 35,200
The Group tests whether Goodwill and Contracts for English language testing have suffered any impairment annually. The recoverable amount is based on a value in use calculation which uses discounted cash flow projections based on three years internal budgets and management forecasts. Cash flow projections during the budget/forecasts period are based on management’s estimation of volume growth, expenses, inflation and foreign exchange rate throughout the period.
Key assumptions
CGU/ Group of CGUs
Valuation method
Years of cash flow projection
Terminal growth rate Pre-tax discount rate %
2016 2015
Asia – IELTS testing Value in use 3 3% 10.3% 9.5%
Australasia – IELTS testing
Value in use 3 0% 10.3% 9.5%
Rest of World – IELTS testing
Value in use 3 3% 10.3% 9.5%
China – Student placement
Value in use 3 2.5% 18% n/a
As at 30 June 2016 and 2015, the fair value supports the carrying amount and no impairment has been recognised, and no reasonably possible changes in significant assumptions would give rise to an impairment of Contracts for English language testing and Goodwill.
12. OTHER CURRENT ASSETS
30 June 2016 $’000
30 June 2015 $’000
Prepayments 4,907 4,540
Refundable deposits 4,155 3,128
Other assets 208 2,184
9,270 9,852
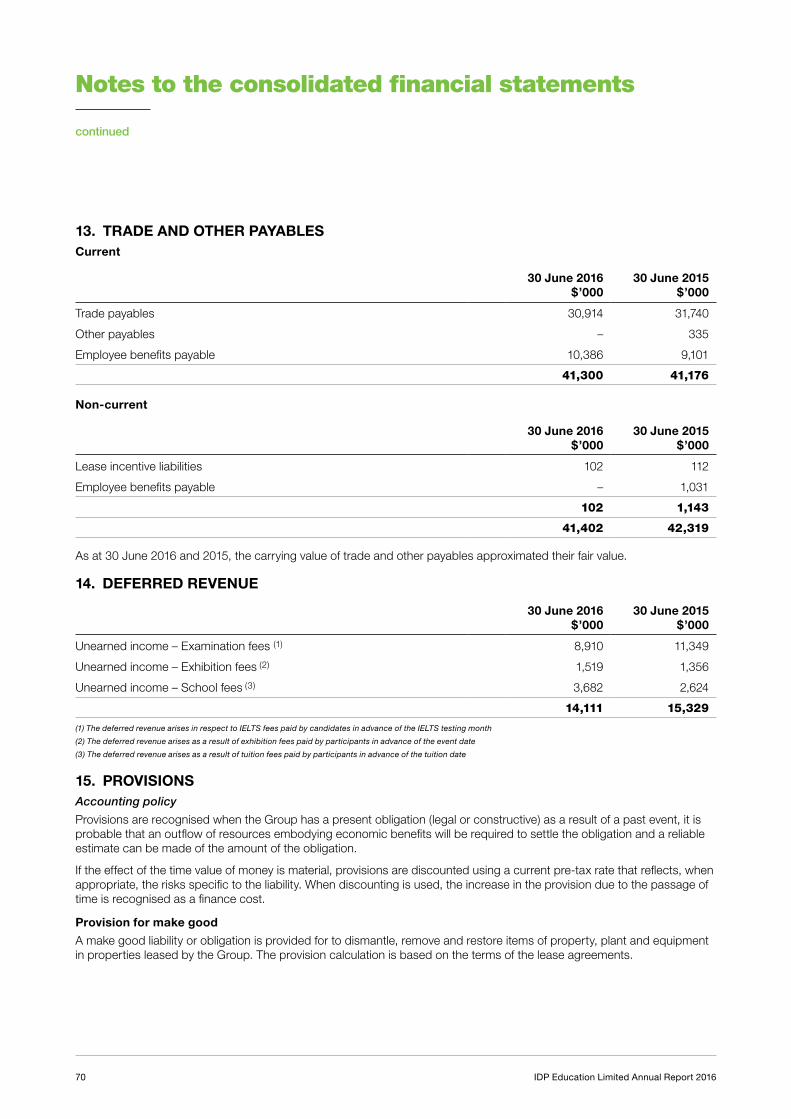
Notes to the consolidated financial statements
continued
70 IDP Education Limited Annual Report 2016
13. TRADE AND OTHER PAYABLESCurrent
30 June 2016 $’000
30 June 2015 $’000
Trade payables 30,914 31,740
Other payables – 335
Employee benefits payable 10,386 9,101
41,300 41,176
Non-current
30 June 2016 $’000
30 June 2015 $’000
Lease incentive liabilities 102 112
Employee benefits payable – 1,031
102 1,143
41,402 42,319
As at 30 June 2016 and 2015, the carrying value of trade and other payables approximated their fair value.
14. DEFERRED REVENUE
30 June 2016 $’000
30 June 2015 $’000
Unearned income – Examination fees (1) 8,910 11,349
Unearned income – Exhibition fees (2) 1,519 1,356
Unearned income – School fees (3) 3,682 2,624
14,111 15,329
(1) The deferred revenue arises in respect to IELTS fees paid by candidates in advance of the IELTS testing month
(2) The deferred revenue arises as a result of exhibition fees paid by participants in advance of the event date
(3) The deferred revenue arises as a result of tuition fees paid by participants in advance of the tuition date
15. PROVISIONSAccounting policy
Provisions are recognised when the Group has a present obligation (legal or constructive) as a result of a past event, it is probable that an outflow of resources embodying economic benefits will be required to settle the obligation and a reliable estimate can be made of the amount of the obligation.
If the effect of the time value of money is material, provisions are discounted using a current pre-tax rate that reflects, when appropriate, the risks specific to the liability. When discounting is used, the increase in the provision due to the passage of time is recognised as a finance cost.
Provision for make good
A make good liability or obligation is provided for to dismantle, remove and restore items of property, plant and equipment in properties leased by the Group. The provision calculation is based on the terms of the lease agreements.

71Personal journeys, global growth
15. PROVISIONS (continued)
Employee benefits
A liability is recognised for benefits accruing to employees in respect of wages and salaries and long service leave when it is probable that settlement will be required and they are capable of being measured reliably.
Provision is made for the Group’s liability for employee benefits arising from services rendered by employees to balance date. Employee benefits that are expected to be settled within one year have been measured at the amounts expected to be paid when the liability is settled, plus related on-costs. Employee benefits payable later than one year have been measured at the present value of the estimated future cash outflows to be made for those benefits.
30 June 2016 $’000
30 June 2015 $’000
Employee benefit 7,128 6,178
Make good provision 2,660 2,073
9,788 8,251
Current 7,087 5,884
Non-current 2,701 2,367
9,788 8,251
Movement in make good provisions are set out below
Balance at beginning of the year 2,073 1,204
Additional provisions required 538 851
Unwinding of discount and effect of changes in the discount rate 49 18
Balance at end of the year 2,660 2,073

Notes to the consolidated financial statements
continued
72 IDP Education Limited Annual Report 2016
CAPITAL STRUCTURE AND FINANCING
16. CASH FLOW INFORMATIONCash and cash equivalents include cash on hand, deposits held at call with financial institutions, other short-term highly liquid investments with maturities of three months or less, net of bank overdrafts.
The reconciliation of profit for the year after tax to net cash flows from operating activities is as follows:
30 June 2016 $’000
30 June 2015 $’000
Net profit after tax 39,914 31,476
Adjustment for:
Depreciation and amortisation 7,397 6,629
Doubtful debt provision (40) (281)
Share of joint venture loss – 33
Net foreign exchange loss/(gain) 154 (656)
Share-based payments 2,087 816
Unwinding discount of provisions 49 18
Loss on disposal of plant and equipment 201 180
Movement in working capital:
Trade and other receivables (3,079) (4,016)
Derivative financial instruments 9,079 (4,998)
Other assets 329 (2,143)
Trade and other payables (7,092) 15,951
Current and deferred tax assets (6,107) 901
Provisions 950 583
Net cash inflow from operating activities 43,842 44,493
Reconciliation of cash and cash equivalents
30 June 2016 $’000
30 June 2015 $’000
Cash and bank at call 35,353 43,184
Short term deposits – 8,000
35,353 51,184
Financing arrangement
The Group has access to the following borrowing facilities at the end of the year:
30 June 2016 $’000
30 June 2015 $’000
Total facilities available (1) 10,000 10,000
Facilities utilised at end of the year – –
Total facilities not utilised at end of the year 10,000 10,000
(1) Total loan facilities will expire on 31 December 2016

73Personal journeys, global growth
17. LEASE COMMITMENTS
Operating lease commitments30 June 2016
$’00030 June 2015
$’000
Non-cancellable operating leases contracted for but not capitalised in the financial statements
Not later than one year 8,837 6,469
Later than one year and not later than five years 13,063 9,249
Later than five years 1,459 3,410
Minimum lease payments 23,359 19,128
The Group leases various offices under non-cancellable operating leases expiring within one to ten years. The leases have varying terms, escalation clauses and renewal rights.
18. CONTRIBUTED EQUITY18.1. Share capital
Note30 June 2016
$’00030 June 2015
$’000
Ordinary shares fully paid 27,450 27,450
Treasury shares 18.2 (2,400) –
25,050 27,450
Movement in share capitalNumber of
shares $ per share $’000
Balance at 1 July 2015 3,015,602 9.10 27,450
12 November 2015 Share split prior to IPO 247,279,364 – –
12 November 2015 Issue of new shares 2 – –
Balance at 30 June 2016 (including treasury shares) 250,294,968 27,450
Less: Treasury shares (905,660) 2.65 (2,400)
Balance at 30 June 2016 (excluding treasury shares) 249,389,308 25,050
A share split took place prior to the Group’s IPO in the year ended 30 June 2016, whereby an additional 82 shares were issued for every one existing share. In addition to the share split, two additional shares were issued at IPO. The number of shares on issue at 30 June 2016 was 250,294,968 (30 June 2015: 3,015,602).
18.2. Treasury shares
On 1 December 2015, IDP Education Employee Share Scheme Trust acquired 905,660 shares (at $2.65 per share) to be held in the Trust for the benefit of IDP Education Group employees who are participants in the IDP Education Employee Incentive Plan. These shares will be transferred to eligible employees under the Performance Rights plan once the vesting conditions are met.

Notes to the consolidated financial statements
continued
74 IDP Education Limited Annual Report 2016
19. FINANCIAL INSTRUMENTS19.1. Financial assets and liabilities
30 June 2016 $’000
30 June 2015 $’000
Financial assets
Cash and cash equivalents 35,353 51,184
Derivative financial instruments
Foreign exchange forward/option contracts 1,014 5,992
Trade and other receivables 31,114 27,995
Financial liabilities
Fair value through profit or loss
Contingent consideration 2,356 2,836
Derivative financial instruments
Foreign exchange forward/option contracts 4,264 163
Trade and other payables 41,402 42,319
Contingent consideration
As part of accounting for the acquisition of Beijing Promising Education Limited, contingent consideration with an estimated fair value of $2.8m was recognised at May 2015 (i.e. the acquisition date). The contingent consideration is classified as a financial liability at fair value through profit and loss. The final payment amount of the contingent consideration is dependent on the contract volume, contract revenue and total revenue of Promising Education Limited for the financial year ended 30 June 2016. The fair value of the contingent consideration was re-assessed as $2.4m as at 30 June 2016 and the payment is due at the end of August 2016.
Accounting policy
Derivative financial instruments and hedge accounting
Initial recognition and subsequent measurement
The Group uses derivative financial instruments, such as forward currency contracts and options to hedge its foreign currency risks. Such derivative financial instruments are initially recognised at fair value on the date on which a derivative contract is entered into and are subsequently remeasured at fair value. Derivatives are carried as financial assets when the fair value is positive and as financial liabilities when the fair value is negative.
Any gains or losses arising from changes in the fair value of derivatives are taken directly to profit or loss, except for the effective portion of cash flow hedges, which is recognised in other comprehensive income (OCI) and later reclassified to profit or loss when the hedged item affects profit or loss.
Cash flow hedges
Hedges are classified as cash flow hedges when hedging the exposure to variability in cash flows that is either attributable to a particular risk associated with a recognised asset or liability or a highly probable forecast transaction or the foreign currency risk in an unrecognised firm commitment.
The effective portion of the gain or loss on the hedging instrument is recognised in OCI in the cash flow hedge reserve, while any ineffective portion is recognised immediately in the statement of profit or loss as other operating expenses.
The Group uses forward currency contracts and options as hedges of its exposure to foreign currency risk in forecast transactions and firm commitments. The ineffective portion relating to foreign currency contracts is recognised in profit or loss.

75Personal journeys, global growth
19. FINANCIAL INSTRUMENTS (continued)
19.1. Financial assets and liabilities (continued)
Amounts recognised as OCI are transferred to profit or loss when the hedged transaction affects profit or loss, such as when the hedged financial income or financial expense is recognised or when a forecast transaction occurs.
If the hedging instrument expires or is sold, terminated or exercised without replacement or rollover (as part of the hedging strategy), or if its designation as a hedge is revoked, or when the hedge no longer meets the criteria for hedge accounting, any cumulative gain or loss previously recognised in OCI remains separately in equity until the forecast transaction occurs or the foreign currency firm commitment is met.
19.2. Financial risk management objectives and policies
The Group’s Corporate Treasury function provides services to the business, co-ordinates access to domestic and international financial markets, monitors and manages the financial risks relating to the operations of the Group through internal risk reports which analyse exposures by degree and magnitude of risks. These risks include market risk (including currency risk) and liquidity risk.
The Group seeks to minimise the effects of these risks by using derivative financial instruments to hedge risk exposures. The use of financial derivatives is governed by the Group’s policies approved by the Board of Directors, which provide written principles on foreign exchange risk, the use of financial derivatives and the investment of excess liquidity. Compliance with policies and exposure limits is reviewed by the internal auditors on a continuous basis. The Group does not enter into or trade financial instruments, including derivative financial instruments, for speculative purposes.
The Group’s Corporate Treasury function reports at least quarterly to the Group’s Audit and Risk Committee, an independent body that monitors risks and policies implemented to mitigate risk exposures.
Market risk
Foreign currency risk management
The Group’s activities expose it primarily to the financial risks of changes in foreign currency exchange rates. Foreign exchange risk arises when future commercial transactions and recognised assets and liabilities are denominated in a currency that is not the Group’s functional currency. Predominantly these foreign currencies include British Pounds (GBP), Indian Rupee (INR) and Chinese Yuan (CNY). The Group enters into a variety of derivative financial instruments to manage its exposure to foreign currency risk.
Foreign currency exchange rate risk arises from:
> GBP payments to the University of Cambridge Local Examinations Syndicate test materials commitment;
> Other foreign currencies income or operational expenses (mainly CNY and INR); and
> GBP, USD, CAD and NZD receivable from student placement revenue.
Cash flow hedge
The Company utilises a variety of methods to manage its foreign currency exchange rate risk. The key method is the use of forward exchange contracts and currency option contracts. The Company’s hedging policy permits the purchase of forward exchange contracts up to 100% and currency option contracts up to 50% of the currency exposure on the current and following year’s forecast cash operating expenses and revenues (net of any forecast cash receipts and payments in the same currency). The main currencies currently covered by the hedging strategy are GBP, CNY and INR.
The Company’s current policy is to enter into hedges during the current year covering up to 25% each quarter of the foreign currency exchange rate exposure of the following financial year’s forecast cash operating expenses (net of any forecast cash receipts). The balance of the hedge program is completed when the Board approves the Company’s budget and cash flow forecasts for the following financial year (which is prior to the commencement of that financial year).

Notes to the consolidated financial statements
continued
76 IDP Education Limited Annual Report 2016
19. FINANCIAL INSTRUMENTS (continued)
19.2. Financial risk management objectives and policies (continued) Market risk (continued) Foreign currency risk management (continued)
The following table details the significant forward currency contracts and options outstanding at the end of the reporting period.
Foreign currency Fair value (AUD)
Buy GBP30 June 2016
$00030 June 2015
$00030 June 2016
$00030 June 2015
$000
0 to 3 months 8,394 8,794 (1,307) 2,007
3 to 6 months 1,710 4,125 11 980
6 months to 1 year 9,335 13,950 (1,737) 2,262
Over 1 year 4,170 – (106) –
Sell INR30 June 2016
$00030 June 2015
$00030 June 2016
$00030 June 2015
$000
0 to 3 months 174,692 133,661 54 (42)
3 to 6 months 225,144 167,501 92 (11)
6 months to 1 year 360,670 283,926 257 49
Over 1 year 5,935 – 3 –
Buy CNY30 June 2016
$00030 June 2015
$00030 June 2016
$00030 June 2015
$000
0 to 3 months 77 5,177 (153) 68
3 to 6 months 12,284 10,432 (151) 126
6 months to 1 year 26,110 23,033 (207) 278
Foreign currency denominated monetary assets and monetary liabilities
The carrying amounts of the Group’s foreign currency denominated monetary assets (cash and trade receivables) and monetary liabilities (trade and other payables) at the end of the reporting period are as follows:
2016 2015
AUD equivalentAssets
$000Liabilities
$000Assets
$000Liabilities
$000
USD 9,055 (426) 11,396 (2,105)
CNY 3,608 (3,168) 5,013 (4,731)
GBP 5,299 (12,261) 5,764 (14,244)
INR 1,738 (4,388) 3,018 (5,877)
NZD 1,451 – 1,118 –
VND 1,437 (822) 1,675 (1,771)
CAD 1,442 (98) 1,957 (156)
Other Currencies 6,258 (3,398) 4,968 (3,566)
Total 30,288 (24,561) 34,909 (32,450)

77Personal journeys, global growth
19. FINANCIAL INSTRUMENTS (continued)
19.2. Financial risk management objectives and policies (continued) Market risk (continued) Foreign currency risk management (continued)
Foreign currency sensitivity analysis
The following table details the Group’s sensitivity to a 10% movement in the Australian dollar against the significant foreign currencies. 10% is the sensitivity rate used when reporting foreign currency risk internally to key management personnel and represents management’s assessment of the reasonably possible change in foreign exchange rates. The sensitivity analysis includes only outstanding foreign currency denominated monetary items and foreign exchange contracts. A positive number below indicates an increase in profit or equity whereas a negative number below indicates a decrease in profit or equity.
Effect on profit and loss Effect on equity
$000 $000
USD
2016 10% 604 604
2015 10% 650 650
CNY
2016 10% 31 605
2015 10% 20 662
GBP
2016 10% (487) 2,834
2015 10% (594) 2,232
INR
2016 10% (186) (1,374)
2015 10% (200) (1,101)
Other currencies
2016 10% 23 204
2015 10% 49 255
Interest risk rate management
As at 30 June 2016, the Group did not have any financial liabilities exposed to interest rate movement risk (2015: nil). The carrying amount of the Group’s financial assets and financial liabilities are not significantly exposed to interest rate risk at the end of the reporting period.
Liquidity risk management
The Board of Directors is ultimately responsible for liquidity risk management. The Group has established an appropriate liquidity risk management framework for the management of the Group’s short, medium and long term funding and liquidity management requirements. The Group manages liquidity risk by maintaining adequate borrowing facilities by continuously monitoring forecast and actual cash flows, and by matching the maturity profiles of financial assets and liabilities.
The Group has a policy which describes the manner in which cash balances will be invested. The investment policy is to ensure sufficient flexibility to capture investment opportunities as they may occur, yet maintain reasonable parameters in the execution of the investment program.
The following table details the Group’s liquidity analysis for its derivative financial instruments. The table has been drawn up based on the undiscounted contractual net cash inflows and outflows on derivative instruments that settle on a net basis, and the undiscounted gross inflows and outflows on those derivatives that require gross settlement.

Notes to the consolidated financial statements
continued
78 IDP Education Limited Annual Report 2016
19. FINANCIAL INSTRUMENTS (continued)
19.2. Financial risk management objectives and policies (continued) Market risk (continued) Liquidity risk management (continued)
Less than 1 year $’000
1-5 years $’000
More than 5 years Total
$’000
30 June 2016— Foreign exchange forward contracts 3,996 268 – 4,264
30 June 2015— Foreign exchange forward contracts 163 – – 163
Credit risk management
Credit risk refers to the risk that a counterparty will default on its contractual obligations resulting in financial loss to the Group. The Group has adopted a policy of only dealing with creditworthy counterparties and obtaining sufficient collateral, where appropriate, as a means of mitigating the risk of financial loss from defaults. The Group only transacts with financial institutions that are rated the equivalent of investment grade and above. Credit rating information is supplied by independent rating agencies where available and, if not available, the Group uses other publicly available financial information and its own trading records to rate its major customers. The Group’s exposure and the credit ratings of its counterparties are continuously monitored and the aggregate value of transactions concluded is spread amongst approved counterparties. Credit exposure for cash and cash equivalents is controlled by counterparty limits that are reviewed and approved by the Audit and Risk Committee annually.
The Group’s customer base comprises of Australia universities, UK, US, Canada and New Zealand universities and institutions and IELTS test centres. Credit risk assessments are conducted on new and renegotiated contracts to evaluate each customer’s creditworthiness. Management considers the Group’s credit risk is low due to the industry characteristic of major customers and the diverse customer base.
Management also considers many factors that influence the credit risk of its customer base including the industry default risk and country in which customers operate in. Management closely monitors the economic and political environment in geographical areas to limit the exposure to particular volatility. The Group’s activities are increasingly geographically spread reducing the credit risk associated with one particular market or region.
For trade and other receivables the Group does not hold any credit derivatives or collateral to offset its credit exposure.
19.3. Fair value of financial instruments
Critical accounting estimates and assumptions
The Group measures fair value of financial instruments at each reporting date. Fair value is the price that would be received to sell an asset or paid to transfer a liability in an orderly transaction between market participants at the measurement date. The fair value measurement is based on the presumption that the transaction to sell the asset or transfer the liability takes place either:
> In the principal market for the asset or liability, or
> In the absence of a principal market, in the most advantageous market for the asset or liability
The Group uses valuation techniques that are appropriate in the circumstances and for which sufficient data are available to measure fair value, maximising the use of relevant observable inputs and minimising the use of unobservable inputs.
All assets and liabilities for which fair value is measured or disclosed in the financial statements are categorised within the fair value hierarchy, described as follows:
> Level 1 — Quoted (unadjusted) market prices in active markets for identical assets or liabilities;
> Level 2 — Valuation techniques for which the lowest level input that is significant to the fair value measurement is directly or indirectly observable; and
> Level 3 — Valuation techniques for which the lowest level input that is significant to the fair value measurement is unobservable

79Personal journeys, global growth
19. FINANCIAL INSTRUMENTS (continued)
19.3. Fair value of financial instruments (continued) Critical accounting estimates and assumptions (continued)
Fair value of the Group’s financial assets and financial liabilities that are measured at fair value on a recurring basis
Financial assets/financial liabilities
Fair value hierarchy
Fair value as at 30 June 2016
$’000
Fair value as at 30 June 2015
$’000
Valuation techniques and key inputs
Significant unobservable inputs
Relationship of unobservable inputs to fair value
Foreign currency forward contracts
Level 2 Assets: 1,014 Liabilities: 4,264
Assets: 5,992 Liabilities: 163
Discounted cash flow. Future cash flows are estimated based on forward exchange rates (from observable forward exchange rates at the end of the reporting period) and contract forward rates, discounted at a rate that reflects the credit risk of various counterparties.
N/A N/A
Fair value of financial assets and financial liabilities that are not measured at fair value on a recurring basis (but fair value disclosures are required)
The Directors consider that the carrying amounts of financial assets and financial liabilities recognised in the consolidated financial statements approximate their fair values as detailed in Note 19.1.
19.4. Capital management
The Group’s objective in managing capital is to safeguard the Group’s ability to continue as a going concern so that it can continue to provide returns for shareholders and benefits for other stakeholders and to maintain an optimal capital structure to minimise the cost of capital.
In order to maintain or adjust the capital structure, the Group may adjust the level of dividends paid to shareholders, return capital to shareholders or issue new shares.
The capital structure of the Group is monitored through the gearing ratio. The ratio is calculated as net debt divided by total capital with net debt calculated as total interest bearing financial assets and financial liabilities (including derivative financial instruments) less cash and cash equivalents. Total capital is calculated as equity shown in the statement of financial position plus net debt.
During the years ended 30 June 2016 and 30 June 2015, the Group’s business strategy has resulted in a gearing ratio close to or at 0%. Debt facilities have been utilised to maintain liquidity and fund working capital requirements.
Notes to the consolidated financial statements
continued
80 IDP Education Limited Annual Report 2016
OTHER NOTES
20. SHARE-BASED PAYMENTSCritical accounting estimates and assumptions
Estimating fair value for share-based payment transactions requires determination of the most appropriate valuation model, which depends on the terms and conditions of the grant. This estimate also requires determination of the most appropriate inputs to the valuation model including the expected life of the share option or performance right, volatility and dividend yield and making assumptions about them. The assumptions and models used for estimating fair value for share-based payment transactions are disclosed in the Note 20.3 below.
Accounting policy
Share-based compensation benefits are provided to key management personnel (KMP) and certain employees via long-term incentive (LTI) performance rights and options plan.
The fair value of equity-settled rights and options granted under the plans is recognised as an employee benefit expense over the period during which the employees become unconditionally entitled to the rights and options with a corresponding increase in equity. The total amount to be expensed is determined by reference to the fair value of the rights and options granted, which includes any market performance conditions and the impact of any non-vesting conditions but excludes the impact of any service and non-market performance vesting conditions. Non-market vesting conditions are included in assumptions about the number of options that are expected to vest which are revised at the end of each reporting period. The impact of the revision to original estimates, if any, is recognised in the consolidated statement of profit or loss, with a corresponding adjustment to equity.
The fair value is measured at grant date and the expense recognised over the life of the plan. The fair value of performance rights and options is independently determined using Monte Carlo Simulation or similar pricing model that takes into account the exercise price, the term of the plan, the impact of dilution, the share price at grant date and expected price volatility of the underlying share, the expected dividend yield and the risk-free interest rate for the term of the option. The expected price volatility is based on the historic volatility (based on the remaining life of the options), adjusted for any expected changes to future volatility due to publicly available information.

81Personal journeys, global growth
20. SHARE-BASED PAYMENTS (continued)
20.1. Performance rights and option plans
The LTI plan is designed to align executives’ interest with those of shareholders by incentivising participants to deliver long term shareholders returns. Under the plan, participants are granted performance rights that have vesting hurdle. The vesting hurdles must be satisfied at the end of the performance period for the rights to vest.
Details of the grant of performance rights and options are included in the remuneration report and summarised in the table below:
Performance rights/options awards
No. of performance
rights/ options Grant date
Grant date fair
valueExercise
priceVesting conditions
Vesting date
The IPO Award – Performance Rights
467,124 21-Feb-14 1.40 N/A Completion of the IPO offer and service condition
26-Nov-15(1)
The Prospectus Performance Rights Award
285,852 21-Feb-14 1.40 N/A Actual earnings and service condition
24-Aug-16(1)
2013 LTI Performance Rights Award – Part 1
499,992 21-Feb-14 1.40 N/A EPS target compound annual growth rate (CAGR)
31-Aug-16
2013 LTI Performance Rights Award – Part 2
75,115 30-Jan-15 1.40 N/A EPS target CAGR 31-Aug-16
2014 LTI Performance Rights Award – Part 1
499,992 21-Feb-14 1.40 N/A EPS target CAGR 31-Aug-17
2014 LTI Performance Rights Award – Part 2
130,725 30-Jan-15 1.40 N/A EPS target CAGR 31-Aug-17
The FY16 Performance Right Award – Tranche 1
398,566 19-Oct-15 1.68 N/A Net profit after tax 31-Aug-18
The FY16 Performance Right Award – Tranche 2
398,566 19-Oct-15 1.68 N/A Net profit after tax CAGR
31-Aug-18
The FY16 Performance Right Award – Tranche 3
398,317 19-Oct-15 0.95 N/A Total shareholder return (TSR) CAGR
31-Aug-18
CEO Sign-on Options – Tranche 1
1,383,361 17-Aug-15 0.60 1.44 Net profit after tax CAGR
31-Aug-18
CEO Sign-on Options – Tranche 2
1,383,361 17-Aug-15 0.60 1.44 Net profit after tax CAGR
31-Aug-18
CEO Sign-on Options – Tranche 3
1,383,278 17-Aug-15 0.51 1.44 Total shareholder return (TSR) CAGR
31-Aug-18
(1) An additional service vesting condition requires that the participant maintains continuous employment with the Company for 12 months from the Vesting Date

Notes to the consolidated financial statements
continued
82 IDP Education Limited Annual Report 2016
20. SHARE-BASED PAYMENTS (continued)
20.2. Grants during the year
The table below summarises the movement in the number of performance rights/options in these plans during the year:
2016
Number of options or rights
Grant date
Vesting period (years)
Exercise price
Opening balance
Granted during the
year
Exercised during the
year
Forfeited during the
yearClosing balance
Options plan
CEO sign-on options(1) 17-Aug-15 3.0 $1.44 – 4,150,000 – – 4,150,000
Total Options – 4,150,000 – – 4,150,000
Performance right plans
IPO award 21-Feb-14 2.75 $0.00 592,205 – – (125,081) 467,124
The Prospectus performance award 21-Feb-14 3.5 $0.00 410,933 – – (125,081) 285,852
2013 LTI 21-Feb-14 2.5 $0.00 750,154 – – (250,162) 499,992
2013 LTI 30-Jan-15 1.6 $0.00 75,115 – – – 75,115
2014 LTI 21-Feb-14 3.5 $0.00 750,154 – – (250,162) 499,992
2014 LTI 30-Jan-15 2.6 $0.00 130,725 – – – 130,725
FY16 performance rights award 19-Oct-15 3.0 $0.00 – 1,195,449 – – 1,195,449
Total Performance Rights 2,709,286 1,195,449 – 750,486 3,154,249
Total All Plans 2,709,286 5,345,449 – 750,486 7,304,249
Weighted average exercise price – 1.12 – – 0.82
(1) The expiry date of the CEO sign-on options is 17 August 2020
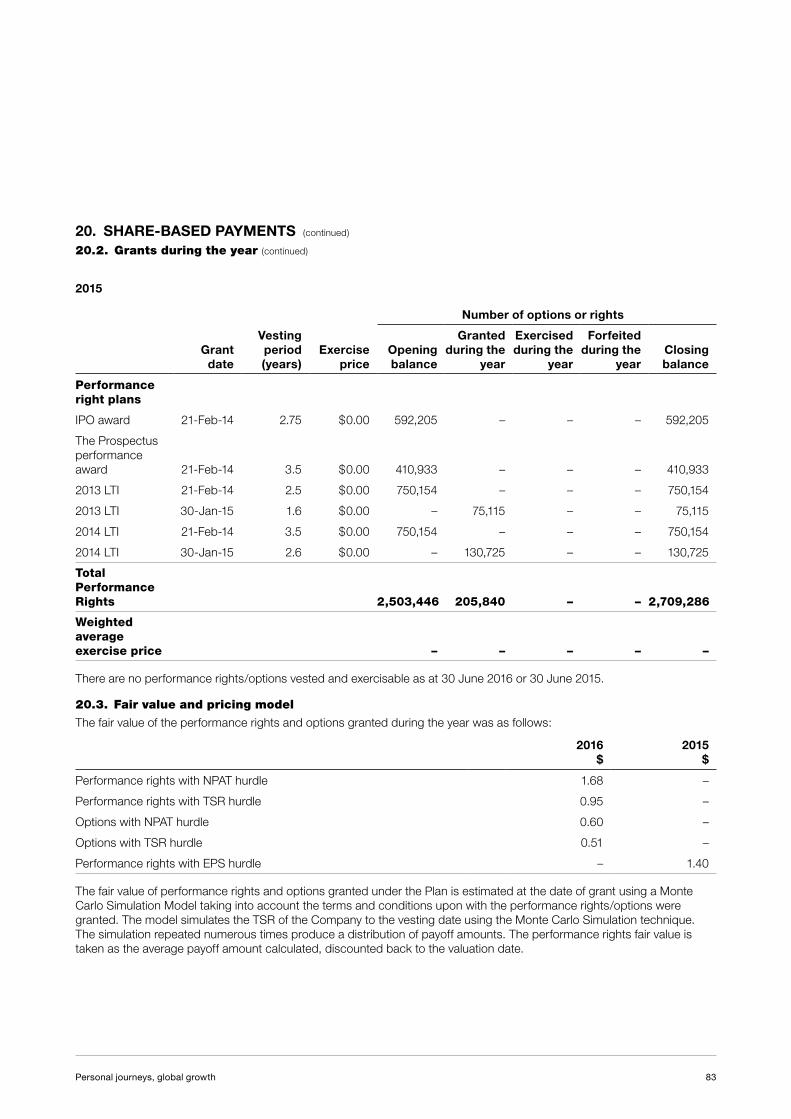
83Personal journeys, global growth
20. SHARE-BASED PAYMENTS (continued)
20.2. Grants during the year (continued)
2015
Number of options or rights
Grant date
Vesting period (years)
Exercise price
Opening balance
Granted during the
year
Exercised during the
year
Forfeited during the
yearClosing balance
Performance right plans
IPO award 21-Feb-14 2.75 $0.00 592,205 – – – 592,205
The Prospectus performance award 21-Feb-14 3.5 $0.00 410,933 – – – 410,933
2013 LTI 21-Feb-14 2.5 $0.00 750,154 – – – 750,154
2013 LTI 30-Jan-15 1.6 $0.00 – 75,115 – – 75,115
2014 LTI 21-Feb-14 3.5 $0.00 750,154 – – – 750,154
2014 LTI 30-Jan-15 2.6 $0.00 – 130,725 – – 130,725
Total Performance Rights 2,503,446 205,840 – – 2,709,286
Weighted average exercise price – – – – –
There are no performance rights/options vested and exercisable as at 30 June 2016 or 30 June 2015.
20.3. Fair value and pricing model
The fair value of the performance rights and options granted during the year was as follows:
2016 $
2015 $
Performance rights with NPAT hurdle 1.68 –
Performance rights with TSR hurdle 0.95 –
Options with NPAT hurdle 0.60 –
Options with TSR hurdle 0.51 –
Performance rights with EPS hurdle – 1.40
The fair value of performance rights and options granted under the Plan is estimated at the date of grant using a Monte Carlo Simulation Model taking into account the terms and conditions upon with the performance rights/options were granted. The model simulates the TSR of the Company to the vesting date using the Monte Carlo Simulation technique. The simulation repeated numerous times produce a distribution of payoff amounts. The performance rights fair value is taken as the average payoff amount calculated, discounted back to the valuation date.

Notes to the consolidated financial statements
continued
84 IDP Education Limited Annual Report 2016
20. SHARE-BASED PAYMENTS (continued)
20.3. Fair value and pricing model (continued)
In valuing the performance rights and options, a number of assumptions were used as shown in the table below:
17 August 2015 Options
19 October 2015 Performance
Rights
Exercise price $1.44 –
Share value at grant date $1.96 $1.96
Expected volatility 40% 40%
Expected dividend yield 5.29% 5.29%
Risk free interest rate 2.17% 1.81%
The expected volatility is a measure of the amount by which the price is expected to fluctuate during a period. As the Company’s shares were not traded prior to listing on the ASX in the current financial year, the expected volatility was based on two comparator stocks using daily return data over 3 years.
20.4. Total share-based payment expenses for the year
The following expenses were recognised in employees benefit expenses during the year relating to share-based payments described above:
2016 $’000
2015 $’000
LTI performance rights/options plans 2,087 816
2,087 816
21. RELATED PARTY TRANSACTIONSNote 23 provide the information about the Group’s structure including the details of the subsidiaries.
21.1. Transactions with Key management personnel
30 June 2016 $
30 June 2015 $
Short term employee benefits 2,784,214 3,247,001
Post-employment benefits 145,719 127,806
Other long-term benefits 20,821 50,801
Share-based payments 1,201,223 325,082
Total compensation paid to key management personnel 4,151,977 3,750,690
Within the key management personnel compensation, $93,950 (2015: $250,533) in Directors fees were paid directly to Seek Limited, the organisation which the Directors represent.
Refer to the Remuneration Report, which forms part of the Directors’ Report for further details regarding KMP’s remuneration.

85Personal journeys, global growth
21. RELATED PARTY TRANSACTIONS (continued)
21.2. Transactions and balances with ultimate parents and other related parties
Directors fees AdvertisingAmounts owed by
related partiesAmounts owed to
related parties
30 June 2016
$
30 June 2015
$
30 June 2016
$
30 June 2015
$
30 June 2016
$
30 June 2015
$
30 June 2016
$
30 June 2015
$
Seek Limited* 93,950 250,533 5,950 6,567 – – – 20,878
* Seek Limited was no longer a related party from 30 November 2015 as all interests held by Seek Limited were sold during the IPO. The transactions disclosed above were for 1 July 2015 to 30 November 2015 period.
22. REMUNERATION OF AUDITORSThe auditor of IDP Education Limited is Deloitte Touche Tohmatsu (Australia). During the year, the following fees were paid or payable for services provided by the auditors of the Group or its related practices.
30 June 2016 $
30 June 2015 $
Group Auditor, Deloitte Touche Tohmatsu (Australia)
Audit and review of financial statements 458,166 434,390
Other consultancy service 235,000 –
Other assurance service 10,000 30,000
Member firms of Deloitte Touche Tohmatsu in relation to subsidiaries
Audit and review of financial statements 291,376 218,688
Taxation advisory services 66,562 –
Other advisory services 18,904 –
1,080,008 683,078

Notes to the consolidated financial statements
continued
86 IDP Education Limited Annual Report 2016
23. SUBSIDIARIESDetails of the Group’s subsidiaries at the end of the reporting period are as follows:
Name of subsidiary Principal activity
Place of incorporation and operation
Proportion of voting power
held by the Group
2016 2015
IELTS Australia Pty Limited Examinations Australia 100% 100%
IDP World Pty Ltd Holding company Australia 100% 100%
IDP Education Pty (Korea) Student Placements Korea 100% 100%
IDP Education Australia (Thailand) Co. Ltd (1) English Language Teaching
Thailand 100% 100%
IDP Education (Vietnam) Ltd Company Student Placements Vietnam 100% 100%
Yayasan Pendidikan Australia (2) Student Placements Indonesia 100% 100%
IDP Consulting (Hong Kong) Co. Ltd Holding company Hong Kong 100% 100%
IDP Education India Pvt Ltd Student Placements & Examinations
India 100% 100%
IDP Education Services Co. Ltd (1) Student Placements Thailand 100% 100%
IDP Education Cambodia Ltd English Language Teaching
Cambodia 100% 100%
IDP Education LLC Client Relations United States of America
100% 100%
IDP Education UK Limited Client Relations United Kingdom 100% 100%
IDP Education (Canada) Ltd Client Relations Canada 100% 100%
IDP Education (Bangladesh) Pvt Ltd Student Placements Bangladesh 100% 100%
IDP Education (Egypt) LLC Student Placements Egypt 100% 100%
IDP Education Consulting (Beijing) Co., Ltd (3) Student Placements China 100% 100%
Guangzhou IDP Consulting Services Co., Ltd (3) Student Placements China 100% 100%
IDP Business Consulting (Shanghai) Co., Ltd (3) Student Placements China 100% 100%
Beijing Promising Education Limited (4) Student Placements China 100% 100%
IDP Education Services New Zealand Limited Student Placements New Zealand 100% 100%
IDP Education Turkey LLC (5) Student Placements Turkey 100% –
IDP Education Lanka (Private) Limited (5) Student Placements Sri Lanka 100% –
IDP Education Pakistan (Private) Limited (5) Examinations Pakistan 100% –
IDP Education Nepal Private Limited (5) Examinations Nepal 100% –
IDP Vendor Limited (5) Holding company Australia 100% –
(1) IDP Education Limited owns 100% ordinary Class A shares, which represents 49% of total shares of IDP Education Australia (Thailand) Co. Ltd and IDP Education Services Co. Ltd. According to the company constitution, ordinary Class A shares holds 100% voting right of the company. Based on these facts and circumstances, management determined that, in substance, the Group controls these entities with no non-controlling interest
(2) Foundation controlled through IDP Education Limited’s capacity to control management of the company
(3) 100% wholly owned by IDP Consulting (Hong Kong) Co. Ltd
(4) Acquired on 20 May 2015
(5) New subsidiaries incorporated during the financial year ended 30 June 2016

87Personal journeys, global growth
24. PARENT ENTITY INFORMATIONIDP Education Limited is the parent of the Group. The financial information presented below represents that of the parent and is not comparable to the consolidated results.
Financial information
Financial position30 June 2016
$’00030 June 2015
$’000
Current assets 45,855 54,205
Total assets 114,593 119,809
Current liabilities 74,300 49,721
Total liabilities 76,887 55,917
Equity
Issued capital 25,050 27,450
Retained earnings 9,589 36,170
Reserves 3,067 272
Total equity 37,706 63,892
Financial performanceJune 2016
$00030 June 2015
$000
Profit for the year 21,419 25,048
Other comprehensive income (323) 870
Total comprehensive income 21,096 25,918
25. CONTINGENT LIABILITIESThe Directors are not aware of any significant contingent liabilities.
26. EVENTS AFTER THE REPORTING PERIODExcept for the dividends declared as detailed in the Note 6, there were no significant events since the balance date.

88 IDP Education Limited Annual Report 2016
Directors’ declaration
In the Directors’ opinion:
(a) the financial statements and notes of IDP Education Limited and its controlled entities (the Group) set out on pages 48 to 87 are in accordance with the Corporations Act 2001, including:
(i) complying with Accounting Standards, the Corporations Regulations 2001, and other mandatory professional reporting requirements; and
(ii) giving a true and fair view of the Group’s financial position as at 30 June 2016 and of its performance, as represented by the results of its operations, changes in equity and its cash flows, for the year ended on that date; and
(b) there are reasonable grounds to believe that the Company will be able to pay its debts as and when they become due and payable.
Note 1 confirms that the financial statements also comply with International Financial Reporting Standards as issued by the International Accounting Standards Board.
The Directors have been given the declarations by Chief Executive Officer and Chief Financial Officer required by section 295A of the Corporations Act 2001.
The declaration is made in accordance with a resolution of the Directors.
Peter Polson Andrew BarklaChairman Managing Director
Melbourne24 August 2016

89Personal journeys, global growth
Liability limited by a scheme approved under Professional Standards Legislation.
Member of Deloitte Touche Tohmatsu Limited. 78
Deloitte Touche Tohmatsu ABN 74 490 121 060 550 Bourke Street Melbourne VIC 3000 GPO Box 78 Melbourne VIC 3001 Australia Tel: +61 3 9671 7000 Fax: +61 3 9671 7001 www.deloitte.com.au
Independent Auditor’s Report to the Members of IDP Education Limited
Report on the Financial Report We have audited the accompanying financial report of IDP Education Limited which comprises the statement of financial position as at 30 June 2016, statement of profit or loss, the statement of comprehensive income, the statement of cash flows and the statement of changes in equity for the year ended on that date, notes comprising a summary of significant accounting policies and other explanatory information, and the directors’ declaration of the consolidated entity, comprising of the company and the entities it controlled at the year’s end or from time to time during the financial year as set out on pages 48 to 88. Directors’ Responsibility for the Financial Report The directors of the company are responsible for the preparation of the financial report that gives a true and fair view in accordance with Australian Accounting Standards and the Corporations Act 2001 and for such internal control as the directors determine is necessary to enable the preparation of the financial report that gives a true and fair view and is free from material misstatement, whether due to fraud or error. In Note 1, the directors also state, in accordance with Accounting Standard AASB 101 Presentation of Financial Statements, that the consolidated financial statements comply with International Financial Reporting Standards. Auditor’s Responsibility Our responsibility is to express an opinion on the financial report based on our audit. We conducted our audit in accordance with Australian Auditing Standards. Those standards require that we comply with relevant ethical requirements relating to audit engagements and plan and perform the audit to obtain reasonable assurance whether the financial report is free from material misstatement. An audit involves performing procedures to obtain audit evidence about the amounts and disclosures in the financial report. The procedures selected depend on the auditor’s judgement, including the assessment of the risks of material misstatement of the financial report, whether due to fraud or error. In making those risk assessments, the auditor considers internal control, relevant to the company’s preparation of the financial report that gives a true and fair view, in order to design audit procedures that are appropriate in the circumstances, but not for the purpose of expressing an opinion on the effectiveness of the company’s internal control. An audit also includes evaluating the appropriateness of accounting policies used and the reasonableness of accounting estimates made by the directors, as well as evaluating the overall presentation of the financial report. We believe that the audit evidence we have obtained is sufficient and appropriate to provide a basis for our audit opinion.
Independent auditor’s report

Independent auditor’s report
continued
90 IDP Education Limited Annual Report 2016
79
Auditor’s Independence Declaration In conducting our audit, we have complied with the independence requirements of the Corporations Act 2001. We confirm that the independence declaration required by the Corporations Act 2001, which has been given to the directors of IDP Education Limited would be in the same terms if given to the directors as at the time of this auditor’s report. Opinion In our opinion: (a) the financial report of IDP Education Limited is in accordance with the Corporations Act 2001,
including:
(i) giving a true and fair view of the consolidated entity’s financial position as at 30 June 2016 and of its performance for the year ended on that date; and
(ii) complying with Australian Accounting Standards and the Corporations Regulations 2001;
and (b) the consolidated financial statements also comply with International Financial Reporting
Standards as disclosed in Note 1. Report on the Remuneration Report We have audited the Remuneration Report included in pages 17 to 34 of the directors’ report for the year ended 30 June 2016. The directors of the company are responsible for the preparation and presentation of the Remuneration Report in accordance with section 300A of the Corporations Act 2001. Our responsibility is to express an opinion on the Remuneration Report, based on our audit conducted in accordance with Australian Auditing Standards. Opinion In our opinion the Remuneration Report of IDP Education Limited for the year ended 30 June 2016 complies with section 300A of the Corporations Act 2001.
DELOITTE TOUCHE TOHMATSU
Chris Biermann Partner Chartered Accountants Melbourne, 24 August 2016
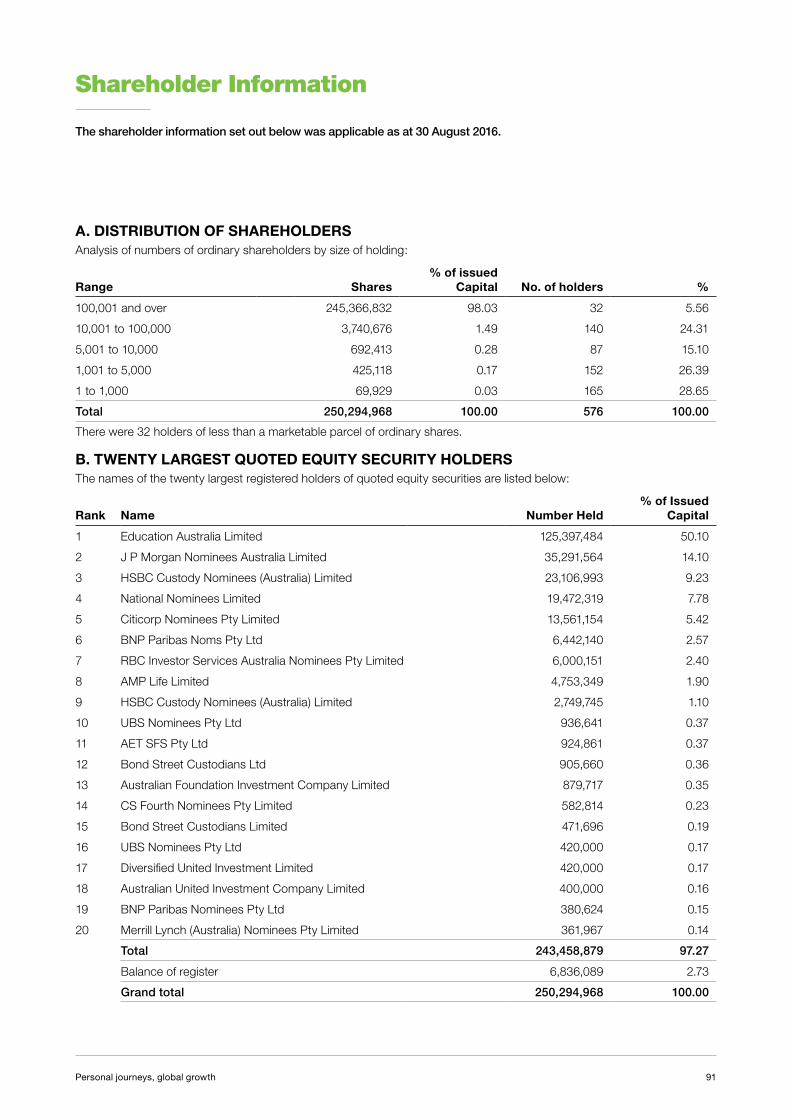
91Personal journeys, global growth
Shareholder Information
The shareholder information set out below was applicable as at 30 August 2016.
A. DISTRIBUTION OF SHAREHOLDERSAnalysis of numbers of ordinary shareholders by size of holding:
Range Shares% of issued
Capital No. of holders %
100,001 and over 245,366,832 98.03 32 5.56
10,001 to 100,000 3,740,676 1.49 140 24.31
5,001 to 10,000 692,413 0.28 87 15.10
1,001 to 5,000 425,118 0.17 152 26.39
1 to 1,000 69,929 0.03 165 28.65
Total 250,294,968 100.00 576 100.00
There were 32 holders of less than a marketable parcel of ordinary shares.
B. TWENTY LARGEST QUOTED EQUITY SECURITY HOLDERSThe names of the twenty largest registered holders of quoted equity securities are listed below:
Rank Name Number Held% of Issued
Capital
1 Education Australia Limited 125,397,484 50.10
2 J P Morgan Nominees Australia Limited 35,291,564 14.10
3 HSBC Custody Nominees (Australia) Limited 23,106,993 9.23
4 National Nominees Limited 19,472,319 7.78
5 Citicorp Nominees Pty Limited 13,561,154 5.42
6 BNP Paribas Noms Pty Ltd 6,442,140 2.57
7 RBC Investor Services Australia Nominees Pty Limited 6,000,151 2.40
8 AMP Life Limited 4,753,349 1.90
9 HSBC Custody Nominees (Australia) Limited 2,749,745 1.10
10 UBS Nominees Pty Ltd 936,641 0.37
11 AET SFS Pty Ltd 924,861 0.37
12 Bond Street Custodians Ltd 905,660 0.36
13 Australian Foundation Investment Company Limited 879,717 0.35
14 CS Fourth Nominees Pty Limited 582,814 0.23
15 Bond Street Custodians Limited 471,696 0.19
16 UBS Nominees Pty Ltd 420,000 0.17
17 Diversified United Investment Limited 420,000 0.17
18 Australian United Investment Company Limited 400,000 0.16
19 BNP Paribas Nominees Pty Ltd 380,624 0.15
20 Merrill Lynch (Australia) Nominees Pty Limited 361,967 0.14
Total 243,458,879 97.27
Balance of register 6,836,089 2.73
Grand total 250,294,968 100.00

Shareholder Information
continued
92 IDP Education Limited Annual Report 2016
Unquoted equity securities
Performance Rights and Options issued under IDP Education’s Long Term Incentive Plan:
Name Number HeldNumber of
Holders
Options 4,150,000 1
Performance Rights 3,154,249 12
C. SUBSTANTIAL HOLDERSSubstantial holders in the company are set out below:
Name Number Held% of Issued
Capital
Education Australia Limited 125,397,484 50.10
D. VOTING RIGHTSThe voting rights attaching to each class of equity securities are set out below:
Ordinary shares
On a show of hands every member present at a meeting in person or by proxy shall have one vote and upon a poll each share shall have one vote.
Performance Rights and Options
No voting rights.

93Personal journeys. Global growth.
Corporate Directory
DIRECTORS
Peter L PolsonChairman
Andrew BarklaManaging Director and Chief Executive Officer
Ariane Barker
ProfessorDavidBattersbyAM
ChrisLeptosAM
Belinda Robinson
Greg West
Secretary
MurrayWalton
PRINCIPaL REGISTERED OFFICE IN auSTRaLIaLevel8535 Bourke StreetMELBOURNEVIC3000AUSTRALIA
Ph: +61 3 9612 4400
SHaRE REGISTRYLinkMarketServicesLimitedTower 4 727 Collins StreetMelbourneVICTORIA3008
auDITORDeloitte Touche Tohmatsu550 Bourke StreetMELBOURNEVIC3000AUSTRALIA
Ph: +61 3 9671 7000
STOCk ExCHaNGE LISTINGIDP Education Limited shares are listed on the Australian SecuritiesExchange(ASXcode:IEL)
WEbSITEwww.idp.com
abN59 117 676 463

IDP
Ed
ucation Lim
ited A
nnual Rep
ort 2016
www.idp.com