annual administrative report (2016 -2017) - tripura
TRANSCRIPT

Page 1 of 24
Government of Tripura Department of Animal Resources Development
Annual Administrative Report (2016 -2017)
Functions &Strategies :
Animal Resources activities contributes significantly in supplementing the income of small, marginal farmers and landless laborers through generation of self-employment,many of whom are woman who are engaged in management of livestock in Tripura. This sector also contributes in providing nutritiousprotein rich balanced food in the form of Milk,Meat, and Egg and value added products. Animal Resources Development Department plays a major role in providing veterinary health care services and improving the genetic merit of livestock and birds for enhancement of production and productivity. Beside this, various beneficiary oriented schemes are also taken up by the Department for the economic upliftment and welfare of the poor,downtrodden and weaker sections of the society.
Department continuously providing services like treatment of livestock and birds,vaccination,Aritificial insemination in conducting animal health camps, fertility management camps, training etc. through the following Veterinary Hospitals, Dispensaries, Disease investigation laboratory, Veterinary Sub- centers as well as supplying Inputs of Improved Germplasm from Government farm.
Strategies/ interventions considered by the Department.
Milk Sector
1. Augmenting milk production by increasing number of crossbreed cattle through intensification of
artificial insemination and induction of high yielding cattle from outside state.
2. Setting up of mini dairy through credit link bank loan. 3. Awareness camp & supply of dewormer and Min.mix. 4. Castration of ND and stray bulls. 5. Increasing the numberof door step A.I. worker and incentivizing them. 6. Conducting milk yield competition, 2 calf rally and fertility management camps. 7. Supply of calf growth meal at subsidized rate. 8. Cultivation of perennial fodder and azolla for reducing feed cost and augmentation of milk production.
9. Insurance of milch cattle. Egg Sector
1. Massive production of backyard poultry through Block Level Brooder Houses.
Meat Sector
i) Setting up of beneficiary oriented piggery demonstration and pig breeding units under FRA.
ii) Tapioca cultivation under MGNREGA in FRA and other areas. iii) Increasing productivity of goats under conventional small holding /pastoral system.
MINISTER INCHARGE :- SRI AGHORE DEBBARMA. SECRETARY :- SRI M.L.DEY. DIRECTOR :- DR. MANORANJAN SARKAR
Page 2 of 24
2.(B) GROUP WISE STAFF POSITION: (2016 – 2017)
S.L No
Category of Staff Sanctioned
strength Man in
Position Vacant.
A B C D E 01 Group – A (Gazetted) 142 71 71
02 Group – B (Gazetted) 247 105 142
SANCTIONED STRENGTH AND FILLED UP POST DURING THE YEAR 2016-17UNDER
ESTABLISHMENT SECTION (GAZETTED)
SL.No. Category of Employees Sanctioned
strength Man in
Position. Vacant.
A B C D E Tripura Veterinary Cadre Service(TVS):-
1 Director (TVS-1) 1 Nil 1
2 Additional Director (TVS-II) 2 Nil 2
3 Jt. Director (TVS-II) 8 4 4
4 Dy. Directors (TVS-III) 35 8 27
5 Asstt. Directors (TVS-IV) 85 57 28
6 Veterinary Officer. (TVS-V) 217 104 113
Tripura Dairy Services (TDS) :-
1 Dy. Director(TDS-I) 2 Nil 2
2 Asstt. Director(TDS-II) 8 1 7
3 Dairy Officer (TDS-III) 27 Nil 27
TRIPURA HIGHER AGRI.SERVICE & TRIPURA AGRI. FIELD SERVICE :-
1 Dy. Director (THAS-III) Nil Nil Nil
2 Asstt. Director (THAS-IV) Nil Nil Nil
3 Fodder officer Nil Nil Nil
ENGINEERING SERVICE :-
1 Asstt. Engineer (Civil) 1 1 Nil
2 Dairy Engineer 1 Nil 1
OTHERS :-
1 Administrative Officer/ Accounts Officer 2 1 1
2 Research Officer / Statistical Officer Nil Nil Nil

Page 3 of 24
SANCTIONED STRENGTH, AND FILLED UP POST DURING THE YEAR 2016-17UNDER ESTABLHMENT SECTION (NON-GAZETTED)
SL. No.
Category of Employees
Sanctioned strength
Man in Position.
Vacant.
A B C D E 1 Junior Engineer ( Civil) 05 03 02 2 Junior Engineer( Mechanical) 02 02 Nil 3 Junior Engineer( Electrical) 01 01 Nil 4 Work Assistant 06 Nil 06 B MINISTERIAL STAFF. 1 Office Superintendent 12 04 08 2 Head Clerk/ Accountant 54 43 11 3 Stenographer(PA-I) Nil Nil Nil 4 Stenographer(PA-II) Nil Nil Nil 5 U.D. Clerk 68 27 41 6 Store- Keeper 30 06 24 7 LDC/Cashier/Typist/Cashier-cum-LDC. 142 88 54 C STATISTICAL STAFF. 1 Asstt. Statistical Officer 03 Nil 03 2 Inspector (Stat) 06 Nil 06 3 Senior Computer /Data entry operator 06 Nil 06 4 Enumerator 17 03 14
D ARD.TECHNICAL & FIELD STAFF.
1 A.R. D. Extension Officer 40 26 14 2 Sr. A.R.D. Asstt. 131 56 75 3 A.R.D. Asstt. 712 487 225
4 Laboratory Technician 18 15 03 5 Radiographer 01 01 Nil 6 Pharmacist 01 01 Nil E GROUP-C,TECHNICAL STAFF. 2 Driver 34 23 11
3 Gestetner Operator 08 03 05 4 Asstt. Foreman 01 Nil 01 5 Junior Mechanics 05 01 04 6 Jr.Electrical cum Mechanical 01 Nil 01 7 Junior Mechanics(Farm) 01 Nil 01 8 Photographer 01 Nil 01 9 Jr. Carpenter 01 01 Nil
10 Junior Operator (Power Tiller) 03 Nil 03 11 Cinema Operator 02 Nil 02 12 Junior Mechanics(Dairy) 03 01 01 13 Hatchery Assistant. 01 Nil 02 14 Junior Mechanic (Boiler) 02 Nil 01 15 Junior Mechanic (B) 01 Nil 01 16 Junior Mechanic (Refrigerator) 01 Nil Nil F GROUP-D STAFF. 1 Class- IV (Group-D) 405 253 152 2 Livestock Farm Worker( Gr.-D). 949 699 250 3 Peon(ATTF Returnee) 23 19 04 4 Permanent labourer 1068 994 74 5 Daily Rated Worker 18 18 Nil 6 Casual Worker 100 100 Nil

Page 4 of 24
2.(C ) THE PRESENT SCENARIO OF DISTRICT WISE VETY. INSTITUTIONS 2016-17.
Sl. No.
Particulars (as on 2016-17) DISTRICT
TOTAL
West Khowai Shipahijala Gomoti South Unokoti North Dhalai
1 No. of Veterinary Hospitals 02 01 02 02 02 01 02 04 16
2 No. of Veterinary Dispensary 8 05 13 8 10 06 05 05 60
3 No. of Veterinary Sub centre (First Aid centre/Stockman centre
87 49 73 52 68 31 36 39 435
4 No. of Veterinary AI Centre 0 02 02 02 01 01 01 02 11
5 D.I. Laboratory 01 0 0 01 0 0 01 01 04
6 Feed Analytical Laboratory 01 0 0 0 0 0 0 0 01
7 Veterinary Training Institute 01 0 0 0 0 0 0 0 01
8 Feed Mixing Plant 02 0 01 01 0 0 0 0 04
9 Veterinary Medicine store 01 0 0 01 0 0 01 01 04
10 Frozen semen Bank 01 0 0 0 01 0 01 01 04
11 No. of Pig Breeding farm 01 01 01 0 03 01 01 02 10
12 No. of Goat Breeding farm 0 0 01 0 01 0 0 0 02
13 No. of Rabbit Breeding farm 01 0 01 0 0 0 0 0 02
14 No. of Duck Breeding farm 01 0 01 0 0 0 0 0 02
15 No. of Poultry Breeding farm 02 0 0 01 0 0 01 0 04
16 No. of Cattle Breeding farm 01 0 0 0 0 0 0 0 01
17 No. of Block Level brooder house (BLBH)
08 12 11 09 09 04 10 09 72
18 Government Fodder farm 02 01 01 0 01 0 0 02 07
Page 5 of 24
3.(A)Impact of Perspective plan [covering two plan (10th& 11th)
3.(A)Achievements’ & Per Capita Availability of Meat, Egg & milk of 10th 11th&12th Plan
Sl
No Parameters Unit
Achievement
10th Plan
(2006-07)
11th Plan
(2011-12)
12th Plan
(2016-17)
1 Production of Meat Mt 14098 25000 39685
2 Production of Milk Mt 91312 110300 158716
3 Production of Egg crore 13.2 16.50 22.94
4 Per capita availability of Meat Kg/Year 3.65 6.38 10.32
5 Per capita availability of Milk gm/day 70 78 113.03
6 Per capita availability of egg Nos/year 34 43 59.63
3.(B)BUDGET PROVISION (2016 - 2017)
(Rs. in lakh)
Name of the Scheme Budget
Estimate Revised Estimate
Expenditure (Provisional)
State Plan a) Salary 596.00 642.67 536.01
b) Non-Salary 1701.00 1447.09 1404.33
State Non-
Plan
a) Salary 5600.00 6978.67 6350.82
b) Non –Salary 105.00 86.00 84.91
CSS 1420.59 233.35 171.36
NEC 0 213.04 173.18
SPA 98.00 186.42 122.21
SCA 0 14.11 12.29
NitiAuyog 0 300 298.39
NABARD 1000.00 0 0
Total 10520.59 10101.35 9153.5

Page 6 of 24
3. (C) ABBREVIATION -
Sl No Short Name Full Name
A B C 1 D.D Dy. Director 2 P.O Project Officer 3 E.E Executive Engineer 4 D.E Dairy Engineer 5 A.D Assistant Director 6 A.E Assistant Engineer 7 V.O Veterinary Officer 8 D.O Dairy Officer 9 Adm. O Administrative Officer
10 A.O Accounts Officer 11 J.E Junior Engineer 12 A.R.D.E.O Animal Resources Development Extension Officer 13 Sr. A.R.D.A Senior Animal Resources Development Assistant 14 A.R.D.A Animal Resources Development Assistant 15 H.Q Head Quarter 16 C.D Cattle Development 17 A.H Animal Health 18 I.C.D.P Intensive Cattle Development Project 19 T.L.D.A Tripura Livestock Development Agency 20 BL Block Level 21 D.V.M.S. District Veterinary Medicine Store 22 D.I.L Disease Investigation Laboratory 23 V.H Veterinary Hospital 24 V.D Veterinary Dispensary 25 A.I.C Artificial Insemination Centre 26 S.M.S.C Stockman Sub-Centre 27 V.F.A.C Veterinary First Aid Centre 28 A.D (F) Assistant Director(Fodder) 29 A.D (D) Assistant Director(Dairy) 30 F Fodder 31 St Store 32 Plan Planning 33 D Dairy 34 H.R.S Heifer Rearing Scheme 35 S. Cell Statistical Cell 36 P.D Poultry Development 37 RKVY RashtriyaKrishiVikashYojona 38 C.G.M Calf Growth Meal

Page 7 of 24
4. ISS ESTIMATE ON PRODUCTION OF MILK, MEAT & EGG FOR
THE YEAR (2016 -17)
Sl. No. Name of the
District For the year Milk (in MT) Eggs (in Nos.) Meat (in MT)
A B C D E
1 West District 2016-2017 33218403.28 32429398.64 8441952.21
2 Khowai District Do 16508595.76 28657859.82 4235523.11
3 Sepahijala District Do 25110871.53 33265968.31 6034658.97
4 Gomoti District Do 23620453.49 29782498.64 5590401.28
5 South District Do 22407635.00 49749037.73 5128314.12
6 Unokoti District Do 9238319.90 11147150.60 2953247.00
7 North District Do 14632072.04 23217763.31 3496050.27
8 Dhalai District Do 13979365.26 21176149.40 3805187.48
Grand Total of State 158715716.26 229425826.45 39685334.44
1. Per capita availability ofMilkis113.03 gmsper day during the year 2016-17.
2. Per capita availability oflocalEggis approximately59.63Nos.during the year 2016-2017.
3. Per capita availability ofMeatis approximately 10.32 Kg. during the year 2016-2017. Population Considered – 38,47,225Nos.
Page 8 of 24
5. VETERINARY SERVICE AND ANIMAL HEALTH:
For effective management of preventive and curative measure a state wise veterinary services net work has been ensured which comprises provision of diagnostic facilities, Veterinary Clinical Institution, Veterinary Medical Stores, Vaccine procurement, Storage and transport facilities.
5. (A) DISTRICT-WISE ACHIEVEMENTS OF ANIMAL HEALTH COVERAGE:- (2016-17).
SL No
Name of the item West Khowai South Sepahijala Gomati Unokuti North Dhalai Total
1 2 3 4 5 6 7 8 9 10 11
1
Health Coverage: i) Animal Treated 100916 50353 37469 53460 98473 83312 51225 90601 565809
ii) Birds Treated 813056 321980 414622 525524 739533 423010 313537 561838 4113100
Total = 913972 372333 452091 578984 838006 506322 364762 652439 4678909
Converted (Animal & Birds) 109046 53572 41615 58715 105868 87542 54360 96219 606937
2 Castration
i) Bull 236 370 298 189 152 1100 732 182 3259 ii)Bull (With Incentive)
0 11 1 0 0 0 650 837 1499
iii) Kid 95 129 26 266 29 238 302 129 1214
iv) Pig 848 280 55 162 54 139 302 143 1983
Total 1179 790 380 617 235 1477 1386 1291 7955
3
A.I (cattle)
Dep’t Inst. 14899 8594 12065 15604 18938 4801 6193 5084 86178
Doorstep. 28921 7124 3647 23555 8916 331 3152 5138 80784
A.I (Buffalo)
Dep’t Inst. 0 0 0 0 0 89 108 8 205
Doorstep. 0 0 0 0 0 17 247 10 274
G. Total of AI 43820 15718 15712 39159 27854 5238 9700 10240 167441
4
Calf Born (cattle)
Dep’t Inst. 5955 4097 4819 5877 6995 1576 2179 2151 33649
Doorstep. 9002 1959 1221 8146 2632 151 1158 2559 26828
Calf Born (Buffalo)
Dep’t Inst. 0 0 0 0 0 16 21 0 37
Doorstep. 0 0 0 0 0 0 44 0 44
G. Total of CB 14957 6056 6040 14023 9627 1743 3402 4710 60558
5
Vaccination
I) F.M.D 76955 63518 39723 52835 84357 58915 98064 91474 565841
II) H.S. 59476 46440 56950 59151 45379 38305 72209 57296 435206
III) B.Q. 46686 61027 60572 36537 107957 36252 54805 67574 471410
iv) Anthrax 10734 0 3370 902 500 600 10605 0 26711
V) Combined 56867 21701 15837 53055 50844 69367 65746 31771 365188
vi) S.F 9447 2182 1165 3752 2134 482 2654 9212 31028
vii) A.R.V. 5576 1193 726 2331 1953 1702 620 806 14907
Viii) P.P.R. 10407 0 1765 4176 4400 0 92 3135 23975
ix) F1 Strain. 447800 172900 160650 418546 470450 199662 283190 160765 2313963
x) R2B 134635 74007 115900 130209 169264 112562 154746 146589 1037912
xi) I.B.D. 534260 110300 88800 331195 219700 162437 245624 187760 1880076
xii) D.P. 6071 4850 2430 9265 4009 1900 5966 3900 38391
xiii) D.C. 3170 7500 2747 1900 2740 0 0 750 18807
xiv) R.D. Losata 552720 90730 88800 178579 90470 78735 132105 138040 1350179
xv)Goat Pox 0 0 0 0 0 0 0 991 991
xvi)Other,if any 0 0 8200 0 0 510 0 0 8710
xvii)Fowl pox 330 0 0 0 0 0 0 0 330
Total Vaccination 1955134 656348 647635 1282433 1254157 761429 1126426 900063 8583625

Page 9 of 24
5.(B) ACHIEVEMENT OF DISEASE INVESTIGATION LABORATORIES DURING THE YEAR 2016-17.
SL No
Name of the item
State D.I. Lab,
D.I. Lab, Udaipur,Gomati
D.I. Lab, Dharma-
Nagar.
D.I. Lab,
Ambassa
Total. (in nos.)
1 2 3 4 5 6 7 1 Post Mortem Report 131 160 99 22 412
2 Cultural Examination 109 35 0 0 144
3 Blood Serum Examination 1391 70 0 35 1496
4 Fecal Sample Exam. 1684 2390 806 440 5320
5 Urine (R.E.) Exam. 1 50 14 0 65
6 Skin Scraping Exam. 6 62 0 0 68
7 Milk Sample Test. 77 0 3 0 80
8 Antibiotic Sensitivity Test 80 19 0 0 99
9 Bull Semen Exam/Tissue smear 0 63 0 0 63
10 Blood Test (Haemogram/Smear) 363 55 0 0 418
11 Liver, Lung, & intestinal etc. Smear. 0 0 0 0 0
12 Brucellosis Test. 0 0 0 0 0
13 Screening Test for Pullorum
Disease
0 79 0 0 79
14 Tuberculosis Test 0 0 0 0 0
15 Blood Smear 0 0 0 0 0
16 HA / HI Test 0 0 0 0 0
17 ELISA TestSample collection for
FMD
0 0 0 0 0
18 Histopathological Exam. 0 0 0 0 0
19 Uterine Discharge 0 0 0 0 0
20 D.I. & Health Camp. 0 31 0 0 31
21 Farm Visit (Govt.+ SHG ) 23 42 44 0 109
22 Seminar & Exhibition 0 3 0 0 3
23 Revenue 0 0 0 0 0
24 Awareness Camp 0 0 0 0 0
25 Animal Feed Analysis 367 0 0 0 367
26 FMD LPB ELISA 0 0 0 0 0
27 Sera/ET collection for
seromonitoring
0 0 0 0 0
28 Training on Bird Flu/BSF 0 0 1 0 1
29 FMD DIVA FLISA 0 0 0 0 0
30 Collection & sending serum sample for HPAI
0 0 0 0 0
31 Awareness Camp on A.I./Vaccination /Deworming/BirdFlue/ SF/BSF/Different disease aspects of Livestock & Poultry
0 51 17 0 68

Page 10 of 24
6. Cattle Development
The Cattle population of Tripura is mostly of non- descript type. The Department through the Intensive Cattle Development Programme had been providing artificial insemination services to the farmers. Of late, the dept. under the National project for Cattle and Buffalo Breeding (NPCBB) programme have taken steps for providing AI services at the door step of farmers. 6. (A) Major Achievements of Cattle Development during the year 2016 – 2017.
SL.No
Parameter ICDP- I ICDP- II
Total. West
Sepah ijala
Khowai Gomoti South Unokoti Dhalai North
1 No. of semen Production Centre at Bull Rearing Station
Nil Nil. Nil Nil Nil Nil Nil Nil Nil
2 No. of Frozen Semen Bank 1 0 0 1 0 1 0 1 4 3 No. of Artificial Insemination Centre (AIC) 81 82 48 43 50 37 45 49 435 4 No. of DSAIW trained 10 3 0 6 0 3 1 8 31 5 No. of Door step A.I. workers 50 34 18 20 10 6 13 11 162
6
i)A.I. Performed by Dept.Inst. Target 180000
14899 15604 8594 18938 12065 4801 5084 6193 86178 ii)A.I. done by DSA worker 28921 23555 7124 8916 3647 331 5138 3152 80784
iii)Buffalo A.I. done by Dept. 0 0 0 0 0 89 8 108 205
iv)Buffalo A.I done DSAIW 0 0 0 0 0 17 10 247 274 Grand Total 43820 39159 15718 27854 15712 5238 10240 9700 167441
7
Calves Born :
Deptl Cow I ) Male 3059 3181 2057 3514 2347 778 1075 1050 17061 Ii ) Female 2896 2696 2040 3481 2472 798 1076 1129 16588
Doos step Cow i) Male 4234 4030 902 1257 598 75 1271 547 12914 ii) Female 4768 4116 1057 1375 623 76 1288 611 13914
Dept.Buffalo Buffalo i) Male 0 0 0 0 0 11 0 15 26 ii) Female 0 0 0 0 0 5 0 6 11
DSAI Buffalo Buffalo i) Male 0 0 0 0 0 0 0 25 25 ii) Female 0 0 0 0 0 0 0 19 19
Grand Total 14957 14023 6056 9627 6040 1743 4710 3402 60558
8
Liquid Nitrogen Plant in operation:-
i) Quantity of Liquid Nitrogen production 101708( In Litres)
ii) Quantity of Liquid Nitrogen Purchased West :-54683.354 North:- Not submitted iii) Quantity of Liquid Nitrogen Supplied
9 Total qty. of LN2 evaporated during transportation
10
Frozen Semen Straw
(i) Opening balance:
100% JR Straw 16021
31575
50% JR Straw 6737 100% S, wal 1382 50% HF 6533 PT Straw 60 Buffalo 842
(ii) Procurement of F.S. Straw:
100% JR Straw 141000
245000
50% JR Straw 77000 100% S, wal 4500 50% HF 21500 PT Straw 0 Buffalo 1000
(iii) Supply of F.S. Straw:
100% JR Straw 18484 25699 10573 23296 14949 0 7630 1180
7
197697
50% JR Straw 9822 15665 6430 10349 7044 0 5051 4418
100% S, wal 321 995 100 200 544 0 0 0
50% HF 7738 10679 1393 600 600 0 200 2204 PT Straw 0 40 0 0 0 0 0 0 Buffalo 0 0 0 0 0 0 13 938
(iv) Balance in hand:
100% JR Straw 44583
78878
50% JR Straw 24958
100% S, wal 3722
50% HF 4719
PT Straw 20
Buffalo 876
Page 11 of 24
6. (B)STOCK POSITION AS ON 31.03. 2017 OF RECBF R.K.NAGAR,
(Figure in nos.)
SL.NO. Kinds of Animals.
Jersey Cross Sahiwal Murrah Buffalo
Total
1 Cows in Milk 4 37 1 3 45
2 Cows in dry 6 24 17 6 53
3 Heifers 6 28 1 0 35
4 Bull 2 5 3 3 13
5 Male Calf 0 15 1 3 19
6 Female Calf 2 11 6 3 22
Total 20 120 29 18 187
6. (C) No. of Calves Born in during the Year 2016– 2017.
6. (D) Extension performance of RECBF, R.K Nagar during the year 2016-17.
SL NO
Particulars Achievements
During 2016-17 1 Quantity of Milk Produced during 2016-2017 92,353.61 Kg.
2 Quantity of Milk supplied (GCMPUL)during 2016– 2017 78,911.66 Kg.
3 Quantity of Milk utilized for calf feedingduring 2016-2017 10,229.00 Kg.
4 Quantity of Milk utilized for Incentives during the year 2016–17 3,186.15 Kg.
5 Quantity of Milk utilized for practical classes. 27 Kg.
6 Average Milk Production / Cow/day during 2016– 2017 --
7 Number of milch Animals supplied under Govt. programme --
8 Number of Culled Animals Sold during 2016– 2017. --
9 Number of Breeding Bulls Supplied during 2016-2017. --
8
Revenue Generated during 2016-2017 --
(i) Livestock Sold (in Rs.) 2727539.00
(ii) Milk sold (in Rs.) 204000.00
(iii) Manure/Others (in Rs.) 1250.00
Total 2932789.00
SL.NO. Breed. Male Calves Female Calves Total
1 Jersey 0 01 1 2 Cross 14 11 25 3 Sahiwal 1 01 2 4 Murrah Buffalo 2 1 3
Total 17 14 31

Page 12 of 24
(E) REPORT OF PARTICIPATION/HOLDING OF ADMINISTRATIVE CAMP/HEALTH CAMP ETC. ORGANISED BY DISTRICT/BLOCKLEVEL OFFICE.
Sr. No.
Name of the Head of Offices
Particulars Achievements
1 The DD,ARD (West),
a) Administrative Camp 13
b) Animal Health /Vaccination / Awareness Camp
1939
c) Infertility camp 2
2 The DD, ARD (South),
a) Administrative Camp 8
b) Animal Health /Vaccination / Awareness Camp
749
c) Infertility camp 8
3 The DDARD (Sepaijala),
a) Administrative Camp 12
b) Animal Health /Vaccination /Awareness Camp
1655
c) Infertility camp 3
4 The DD, ARD (Khowai),
a) Administrative Camp 4
b) Animal Health /Vaccination / Awareness Camp
1232
c) Infertility camp 0
5 The DD,ARD (Unokuti),
a) Administrative Camp 24
b) Animal Health /Vaccination / Awareness Camp
653
c) Infertility camp 0
6 The DD, ARD (Gomati),
a) Administrative Camp 21
b) Animal Health /Vaccination / Awareness Camp
1918
c) Infertility camp 9
7 The DD, ARD (North),
a) Administrative Camp 21
b) Animal Health /Vaccination / Awareness Camp
2539
c) Infertility camp 2
8 The DDARD (Dhalai),
a) Administrative Camp 31
b) Animal Health /Vaccination / Awareness Camp
1871
c) Infertility camp 0
Total
a) Administrative Camp 134
b) Animal Health /Vaccination / Awareness Camp
12556
c) Infertility camp 24
Grand Total 0

Page 13 of 24
7. PIGGERY DEVELOPMENT -
There are 10 (Ten) Pig breeding Farms in the State. There is a great potential for the growth of Pig husbandry in Tripura. The main objective of the Government to enhance pig production of the state by upgrading the local variety of pigs through cross breeding with the exotic pigs. Adult body weight of the improved pigs come up to 70 to 80 kg with increased litter size. Carcass weight was found to be 56 to 70 % of live weight.
7. (A) DISTRICT WISE PIG FARM LOCATIONS ARE AS GIVEN BELOW -
SL No S.L No Name the Farm Area Name of the District
1 1 Belbari TTAADC West District
2 1 Howaibari, State Government Khowai District
3 1 CLF Devipur, State Government Shipahijala District
4 1 Jalefa State Government
South District 5 2 Birchandra Manu State Government
6 3 Birchandra Manu TTAADC
7 1 Nabincherra TTAADC Unokoti District
8 1 Kanchanpur TTAADC North District
9 1 Nalicharra, State Government Dhalai District
10 2 Nalkata, State Government

Page 14 of 24
7. (B)ACHIEVEMENT OF THE GOVERNMENT PIG FARMS DURING THE YEAR 2016-17.
Particulars Nal Kata. NaliCharra Belbri ADC
Devi Pur. Howaibari B.C. Manu B.C.Manu
ADC Jalefa
Kanchanpur ADC
Nabin-charra
ADC
Grand Total
1 2 3 4 5 6 7 8 9 10 11 12
Strength as on 31-03-2017:-
Stock Position
Boar 12 8 22 14 15 5 0 8 10 0 94
Sow 143 52 81 53 62 78 0 12 54 0 535
Young Boar
0 0 0 0 2 0 0 0 0 0 2
Gilt 0 7 17 0 5 17 0 21 13 0 80
Piglet 22 90 141 101 94 191 0 19 144 0 802
Total 177 157 261 168 178 291 0 60 221 0 1513
Production of Piglet
Male 105 197 507 188 270 361 270
40 236
0 3891
Female 108 193 534 174 249 322 37 0
Total 213 390 1041 362 519 683 270 77 236 0 3791
Piglets sold for breeding purpose.
Male 117 76 395 177 243 337 275
7 208
0 3152
Female 120 56 416 174 234 312 5 0
Total 237 132 811 351 477 649 275 12 208 0 3152
Sold for Table
purpose
Piglet Male 05 5 0 22 7 9 0 1 0 0 49
Piglet Female 28 18 0 21 17 23 0 10 0 0 117
Adult Male 0 0 0 0 0 0 0 0 0 0 0
Adult Female 0 0 0 0 0 0 0 0 0 0 0
Total 33 23 0 43 24 32 0 11 0 0 166
Mortality
Adult 38 5 0 5 1 0 0 0 0 0 49
Male 85 86 44 8 39 59 0 36 39 0 396
Female 90 69 30 10 35 52 0 37 62 0 385
Total 213 160 74 23 75 111 0 73 101 0 830
Total Revenue (In Rs ) 876500 457680 3360375 1476240 1367648 2055520 597000 216300 970650 0 11377913
*PBF.Devipur(Mega seed project)(Stock Position- Boar-2,Sow-19,Gilt-11,Piglet-27Total=59)Production-180Distribution-166Rs.410400/-

Page 15 of 24
8. GOATARY DEVELOPMENT -
The Composite Live Stock Farm, Devipur has been engaged in preserving the genetic pool of Black Bengal variety of Goats, which is considered as the best quality goat meat in the country. However, with a view to evaluate the adaptability, some other varieties of goats are being reared in this farm.
8. (A) Stock Position ofGovernment Goat farm as on 31- 03 – 2017 (figure in nos)
Sr. No
Name of the Farm Breed Adult Finisher Grower Weaner Suckling
Total Male Female Male Female Male Female Male Female Male Female
1 C L F, Devipur Black Bangle Goat 24 128 3 17 0 0 10 15 25 25 247
2 CLFB.C. Manu. Black Bangle Goat 8 17 0 0 0 0 0 0 0 0 25
Total 32 145 3 17 0 0 10 15 25 25 272
8. (B) Production and Distribution of Government Goat farm for the year 2016-17.
Sr. No
Name of the Farm
Breed Kid Born
Kid Supplied
for Breeding
Kid Supplied for Table
Adult Supplied
for Breeding
Adult Supplied for Table
Mortality Total Disposal Total Revenue earned (in Rs)
Male Female Male Female
M F M F M F M F M F Adult Kid Adult Kid Adult Kid Adult Kid
1 C L F,
Devipur B.B. Goat
74 75 0 0 8 4 1 0 8 24 0 0 0 0 29 32 98628
2 CLF
B.C. Manu. B.B. Goat
16 0 0 0 0 0 0 7 0 0 0 0 0 0 0 0 6370
Total 165 0 0 8 4 1 0 39 0 0 0 0 29 32 Rs.104998/-

Page 16 of 24
9. POULTRY DEVELOPMENT –
The primary objective of the scheme is to augment poultry/duck egg and meat production, including broiler meat to make the State self sufficient. Dept. maintains poultry and duck breeding farms for production and supply of quality chicks and ducklings of LIT variety. The major obstacle of poultry industry in Tripura is the cost of poultry feed. This scheme entails scope of huge employment generation for the youths of both urban and rural masses and especially to the weaker section of people of the State. Accordingly this is a high priority scheme of the ARDD.
9. (A) Performance of Govt. Poultry farm during the year 2016-17.
S.l No
Particulars
S.P.F, Gandhigram.
DPF, Panisagar DPF, Udaipur Belbari
TTAADC Grant TOTAL
Parent line
Commercial
Parent line
Commercial
Parent line
Commercial
Parent line
Commercial
Parent line
Commercial
1 Strength as on
31.03.2017 (In Nos.)
i) Cock:- 0 0 183 0 0 0 217 0 400 0 ii) Hen:- 0 0 797 0 0 0 1057 0 1854 0 iii) Cockerel: 679 0 0 0 0 0 01 0 680 0 iv) Pullet:- 2602 0 0 0 0 0 661 0 3263 0 v) Chicks:- 0 0 2753 0 0 0 0 0 2753 0 Total = 3281 0 3733 0 0 0 1936 0 8950 0
2 Egg Produced (In Nos.) 2323 147965 96710 205422 452420
3 Total Eggs disposed :
i) For Table Purpose:- 0 47373 62609 51947 161929 ii) Sold for hatching:- 0 342 0 147 489 iii) Utilized for hatching:- 0 98730 36877 123446 259053 iv) Spoiled eggs :- 485 259 1012 0 1756 v) Balance in hand 0 3121 0 0 3121 Total 485 149825 100498 175540 426348
4 No. of DOC Produced(In Nos.) 40829 66217 25189 101462 233697
5
Distribution (DOC):- i) To the Farmer 3510 22052 2886 25040 53488 ii) To the BLBH 37319 44165 20726 75390 177600 iii) For Breeding 0 0 0 0 0 Total 40829 66217 23612 100430 231088
6
Sold for Table Purpose (In Nos.)
i) Adult 0 1423 1840 526 3789 ii) Grower(Chicks) 0 0 0 298 298 Total 0 1423 1840 824 4087
7 Mortality (In Nos.)
i) Chicks ( 0- 136 days) 0 667 0 525 1192 ii) Grower 0 391 0 0 391 iii) Adult 0 872 666 530 2068 Total = 0 1930 666 2703 5299
8 Revenue earned (In Rs.)
i) From egg: 2388 165831 174434 208490 551143 ii) Hatching egg 0 0 0 1911 1911 ii) From DOC:- 480588 780395 0 1332072 2593055 iii) From Breeding Sold 0 0 0 0 0 iv) From Meat Sold 0 270753 314843 163974 749570 v) Manure/Others: 1000 4335 4605 8727 18667 vi) Fodder 4550 0 0 0 4550 vii) Others 0 0 0 129287 129287 viii) Outstanding credit 0 0 0 494960 494960 ix)Bird 19114 0 287292 1800 308206 Total 507640 1221314 781174 2341221 4851349
Page 17 of 24
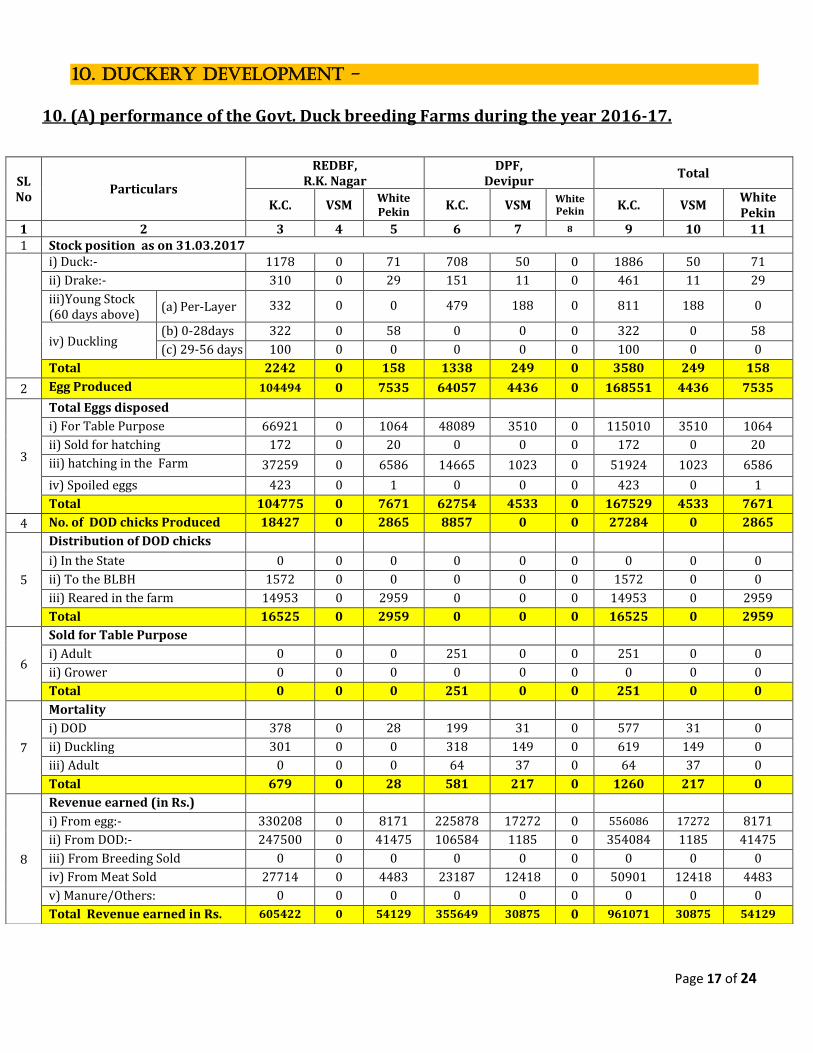
10. DUCKERY DEVELOPMENT -
10. (A) performance of the Govt. Duck breeding Farms during the year 2016-17.
SL No
Particulars
REDBF, R.K. Nagar
DPF, Devipur
Total
K.C. VSM White Pekin K.C. VSM
White Pekin K.C. VSM
White Pekin
1 2 3 4 5 6 7 8 9 10 11 1 Stock position as on 31.03.2017
i) Duck:- 1178 0 71 708 50 0 1886 50 71
ii) Drake:- 310 0 29 151 11 0 461 11 29
iii)Young Stock (60 days above)
(a) Per-Layer 332 0 0 479 188 0 811 188 0
iv) Duckling (b) 0-28days 322 0 58 0 0 0 322 0 58
(c) 29-56 days 100 0 0 0 0 0 100 0 0
Total 2242 0 158 1338 249 0 3580 249 158
2 Egg Produced 104494 0 7535 64057 4436 0 168551 4436 7535
3
Total Eggs disposed
i) For Table Purpose 66921 0 1064 48089 3510 0 115010 3510 1064
ii) Sold for hatching 172 0 20 0 0 0 172 0 20
iii) hatching in the Farm 37259 0 6586 14665 1023 0 51924 1023 6586
iv) Spoiled eggs 423 0 1 0 0 0 423 0 1
Total 104775 0 7671 62754 4533 0 167529 4533 7671
4 No. of DOD chicks Produced 18427 0 2865 8857 0 0 27284 0 2865
5
Distribution of DOD chicks
i) In the State 0 0 0 0 0 0 0 0 0
ii) To the BLBH 1572 0 0 0 0 0 1572 0 0
iii) Reared in the farm 14953 0 2959 0 0 0 14953 0 2959
Total 16525 0 2959 0 0 0 16525 0 2959
6
Sold for Table Purpose
i) Adult 0 0 0 251 0 0 251 0 0
ii) Grower 0 0 0 0 0 0 0 0 0
Total 0 0 0 251 0 0 251 0 0
7
Mortality
i) DOD 378 0 28 199 31 0 577 31 0
ii) Duckling 301 0 0 318 149 0 619 149 0
iii) Adult 0 0 0 64 37 0 64 37 0
Total 679 0 28 581 217 0 1260 217 0
8
Revenue earned (in Rs.)
i) From egg:- 330208 0 8171 225878 17272 0 556086 17272 8171
ii) From DOD:- 247500 0 41475 106584 1185 0 354084 1185 41475
iii) From Breeding Sold 0 0 0 0 0 0 0 0 0
iv) From Meat Sold 27714 0 4483 23187 12418 0 50901 12418 4483
v) Manure/Others: 0 0 0 0 0 0 0 0 0
Total Revenue earned in Rs. 605422 0 54129 355649 30875 0 961071 30875 54129

Page 18 of 24
11. RABBITRY DEVELOPMENT -
The main objective of the scheme is to popularize rabbit rearing in rural areas for production of
non-conventional meat of rabbit as an alternative source for less cholesterol containing meat.
11. (A) Performance of the Govt. Rabbit Breeding Farms during the year 2016-17.
SL.No.
Particulars Rabbit Farm Total.
R.K. Nagar (FC) B. C. Manu
1 2 3 4 5
1
SC NZW Total SC NZW Total SC NZW Total
Stock position of
Rabbit as on 31.03.2017
i) Male 5 18 23 4 0 4 9 18 27
ii) Female 42 39 81 7 0 7 49 39 88
iii) Weiner 5 2 7 0 0 0 5 2 7
iv) Kit 60 63 123 0 0 0 60 63 123
v)Grower 12 19 31 15 0 15 27 19 46
Total 124 141 265 26 0 26 150 141 291
Kid Born
SC Male
436 15 935
Female
NZW Male
484 Female
Total Male
920 15 935 Female
3
Adult Rabbit Supplied for
Breeding Purpose
SC Male 159
5 665 Female 173
NZW Male 152
Female 176
Total Male 332
5 665 Female 328
4
Adult Rabbit Supplied for
Table Purpose
SC Male 29
13 54 Female
NZW Male 12
Female
Total Male 41
13 54 Female
5 Mortality
SC Male 0 0
0 Female 0
NZW Male 0 0
0 Female 0
Total Male 0 0
0 Female 0
6 TotalRevenue earned Rs. 73640.00 Rs. 2712.00 Rs.76351.00

Page 19 of 24
12. (a) FEEDS & FODDER DEVELOPMENT -
Under the feeds & fodder development programme cultivation of fodder and grass were under taken and grazing facilities were developed for the milch animals. Development of fodder production in farmers land in the block level, definite programme was also adopted involving panchayats.
There are 7 Fodder Seed production Farms under State Govt. 1) R. K. Nagar Fodder Farm 2) Devipur Fodder Farm 3) B. C. Manu Fodder Farm 4) Nalicharra 5) Nalkata Fodder Farm 6) SPF Gandhigram & 7) Hawaibari Pig farm.
12. (A) Details Fodder development activities under govt. Farms & in farmer’s field.
Sl No
Name of items / Development Activities Unit Achievement 2016-2017
Remarks
1 2 3 4 5
1
i)Production of Fodder Seed annually In Mt. 0.15 ii)Requirement of perennial cutting annually Nos.in Lakh 10.32
iii)Requirement of Tapioca cutting annually In Mt. 2.283
2
Area under Fodder crops in Govt. Farms :
(i) Kharif/ Perennial In Haq. 18.32
(ii) Rabi/ Annual In Haq. 2.18
(iii) Area under Pasture; In Haq. 30
3
Production of Fodder in Govt. Farms.
(i) Green Fodder In Mt. 1605.83
(ii) Dry Fodder In Mt. 36
(iii) Silage In Mt. 191.26
4
Achievement in Govt. Farms. (i) Green Fodder supplied In Mt. 1605.83
(ii) Dry Fodder supplied In Mt. 36
(iii) Tapioca Plantation In Ha. 10.48
(iv) Silage Production& supplied In Mt. 360
(v) Area under Grain In Haq. 191.26
(vi) Revenue earned (by cash selling) Rs. In lakhs
2.97625
(vii) Revenue earned (by Supply value) 37.50922
5
Achievement in Farmers field.
(i) Tapioca Plantation In Ha. 67.28
(ii) Tapioca production(expected) In Mt. 1682
(iii) Perennial Fodder plantation In Ha. 73.0312
(iv) Perennial Fodder production(expected) In Mt. 8763.744
(v) Fodder Minikit distribution In Nos. 2500
(vi) Seed distribution under minikit
distribution In Mt.
5.0
(vii) Area covered under minikit
distribution In Ha.
200
(viii) Seasonal fodder production In Mt. 4000
(ix) Azolla cultivation unit In Nos. 250

Page 20 of 24
12. (A) FEEDS & FODDER DEVELOPMENT -
Sl No
Name of items / Development Activities Unit Achieveme
nt Remarks
1 2 3 4 5 GRAND TOTAL ACHIEVMENT ON 2016-2017(GOVT FARM+FARMER’S FIELD)
6
i)Area covered under perennial & seasonal Fodder grass In Ha. 293.53 ii)Production of perennial & Seasonal Fodder grass In Mt. 14369.5 i)Area covered under tapioca cultivation In Ha. 77.76 ii)Production of Tapioca tuber In Mt. 1943
12.(B ) UTILISATION OF MGNREGA FUND FOR FODDER DEVELOPMENT ACTIVITIES DURING 2016-17.
Sl.No. Name of Districts
Actual Expenditure (Rs. In lakh)
Man days Generation
Nos.of units undertaken& area covered
Estimated producation
1 West 44.15212 33399 203Unit-19.88Ha. Perennial Grass-
8733MT.Tapioca tuber
-1682Mt. Azolla-2.5Mt.
2 Sepahijala 20.5824 11600 163Unit-20.8Ha. 3 Khowai 25.10654 10511 223Unit-15.008Ha. 4 South 46.3166 19137 482Unit-27.44Ha. 5 Gomati 55.43548 21659 629Unit-31.7772Ha. 6 North 14.008 4776 190Unit-9.6Ha. 7 Unakoti -- -- No implementation programme has
been taken during 2016-17
8 Dhalai 24.34132 10614 203Unit-19.88Ha. Grand Total 229.9425 111696
12.( C)Achievement Of Fodder Dev. Activities in the farmers field under RKVY 2016-17
Sl.No.
District
Achievement During-2016-17
Nos.of Beneficiary
covered
Quantity of seed distributed @ 2Kg.per unit
Area Covered
(Ha.)
Production (Mt.)
1 West 350 700 28 560 2 Sepahijala 350 700 28 560 3 Khowai 150 300 12 240 4 South 200 400 16 320 5 Gomati 350 700 28 560 6 North 250 500 20 400 7 Unakoti 175 350 14 280 8 Dhalai 175 350 14 280 TOTAL OF NON ADC ZOME
2000 4000 160 3200
1 TTAADC West Zone 120 240 9.6 192 2 TTAADC South Zone 150 300 12 240 3 TTAADC North Zone 115 230 9.2 184 4 TTAADC Dhalai Zone 115 230 9.2 184 500 1000 40 800 GRAND TOTAL OF STATE 2500 5000 200 4000

Page 21 of 24
13. FEED MIXING PLANT
13. (A) ACHIEVEMENTS OF GOVT. FEED MIXING PLANTS DURING THE YEAR 2016-17
SL No
Particulars
Feed Mixing Plant, R.K.
Nagar
Feed Mixing Plant,
Gandhigram.
Feed Mixing plant
Devipur
Feed Mixing plant
Udaipur
1 2 3 4 5 6
1 Total quantity of Compounded Ration Procured (in Mt)
-- --
6825(Pig Ration kg from R.K.
nagar)
--
2 Total quantity of Compounded Live stock Ration Prepared (in Mt)
1610.688 -- 201948.90 --
3 Total hours machine functioned
in plant (Approx) 157.5 -- -- --
4 C.G.M. Supplied under High
plane of Nutrition(Govt.Scheme) 593.355 -- -- --
5 Poultry ration supplied 175.702 -- -- -- 6 Duck Ration Supplied (in Mt) 101.871 -- -- -- 7 Pig Ration Supplied (in Mt) 533.185 -- -- --
8 Cattle Ration Supplied including
HRS (in Mt) 790.355
-- -- --
9 Goat Ration Supplied (supplied CGM as goat ration))
0.90 -- -- --
10 Rabbit Ration Supplied (in Mt) 7.720 -- -- --
11
Quantity of Feed Concentrate Produced annually-
a) Cattle Feed (in Mt) 791.960 -- -- --
b) Poultry Feed (in Mt) 175.402 -- -- --
c) Pig Ration (in Mt) 533.735 -- 156206 --
d) Duck Ration (in Mt) 101.871 -- 44142.90 --
e) Rabbit Ration (in Mt) 7.720 -- -- -- f) Concentrate Mixture for Goat (in Mt)
-- -- 1600 --
g)Crushed Topioca (in Mt) -- -- -- -- h) Crushed Rice bran / Wheat bran/
Dry fish/ MOC (DO)/GNC(DO) -- -- -- --
i) Crushed Yellow Maize -- -- -- --

Page 22 of 24
14. DAIRY DEVELOPMENT -
14. (A) Performance/Achievements of GCMPUL during the year 2016-17
SL.No Particulars Unit Achievement 2016– 17.
1 2 3 4 Procurement of Milk from:-
1 i) Milk Producers Co – Op Societies Kg. 18,21,027.37
ii) Government Farm Kg. 78,906.76
2 Marketing of Milk Lts. 41,57,096.40
3 Ghee Sold Kg 1,235.10
4 Paneer Sold Kg 15,748.00
5 Ice Cream Sold Lts. 1,587.08
6 Misty Dui Sold Kg 15,599.20
7 New Society organized Nos. --
8 No. of MPCS function Nos. 99
9 No. of farmers members Nos. 5867
10 Supply of milch Ration MT. 1,803.68
11 Training of milk Producers Nos. 225
12 Distribution of Crossbred Heifers Nos. -
13 Others Nos. 1,Cap.2000L
**************