annual and daily meteorological cycles at high altitude … · of sajama (triangle) and nevado...
TRANSCRIPT

1899Bulletin of the American Meteorological Society
1. Introduction
Abundant evidence indicates that dramatic changesin climate and in the hydrological cycle are occurringin the Tropics. Freezing-level height, for example, rose~110 m from 1970 to the late 1980s, which appears tobe linked to an increase in sea surface temperature(Diaz and Graham 1996). Ice caps and glaciers havebeen rapidly melting and retreating in South America(Francou and Ribstein 1995; Jordan 1995; Thompsonet al. 1993; Schubert 1992), East Africa (Hastenrathand Kruss 1992; Kaser and Noggler 1996), and insoutheast Asia (Peterson and Peterson 1996). Thecause of these changes is not clear, although generalcirculation model experiments suggest that high eleva-tions in the Tropics may be particularly vulnerable togreenhouse gas–induced warming (Mitchell et al.
1990). The significance of these observed changes canbe appreciated only in the context of fluctuations overa longer time frame, yet instrumental records are gen-erally short. Consequently, long-term, high-resolutionproxy records from the Tropics are an essential pre-requisite to placing the contemporary climate condi-tions in perspective. High-elevation ice cores canprovide such proxy climate information.
Ice cores from low latitudes generally have highaccumulation rates, providing high-resolution recordsof atmospheric processes involved in moisture trans-port to the site (e.g., Grootes et al. 1989) and of pre-vailing air masses and atmospheric circulation in thepast (e.g., Mayewski et al. 1993). Among the impor-tant proxies for paleoclimatic reconstruction fromtropical ice core records are microparticles (dust), con-centration of chemical species [e.g., chloride (Cl−),nitrate (NO
3−), and sulfate (SO
42−)], precipitation
amount (water equivalence), and stable isotope con-tent (δ18O, δD) (Thompson et al. 1984; Thompsonet al. 1985; Thompson et al. 1995; Thompson 1995).In the past, the climatic information required for in-terpreting geochemical variations in climatic terms(calibration models) has not been available; as a re-
Annual and Daily MeteorologicalCycles at High Altitude
on a Tropical Mountain
Douglas R. Hardy, Mathias Vuille, Carsten Braun,Frank Keimig, and Raymond S. Bradley
Department of Geosciences, University of Massachusetts Amherst, Amherst, Massachusetts
ABSTRACT
An automated weather station was installed in October 1996 at the summit of Nevado Sajama, located in the west-ern Andean Cordillera of Bolivia (6542 m, 18°06′S, 68°53′W). Meteorological conditions on the mountain are beingobserved to improve the calibration of geochemical variations within tropical ice cores. This article documents the de-sign and operation of the station and presents a discussion of measurements made through the first annual cycle. Variablesanalyzed include pressure, incoming solar radiation, air temperature, humidity, wind, and snow accumulation. Largediurnal fluctuations were recorded in most variables, which is not unexpected given the location at 18°S; the data alsoreveal substantial day-to-day variability and rapid seasonal changes in weather and circulation. As a result, snowfallevents and periods of evaporation are more episodic in nature than previously believed. Measurement of atmosphericconditions during and between snowfall events will therefore greatly facilitate the interpretation of geochemical varia-tions in each resultant snowpack layer.
Corresponding author address: Douglas R. Hardy, Dept. of Geo-sciences, Morrill Science Center, University of Massachusetts,Amherst, Amherst, MA 01003-5820.E-mail: [email protected] final form 23 April 1998.©1998 American Meteorological Society

1900 Vol. 79, No. 9, September 1998
sult, the climatic signal represented by the variabilityof some constituents in tropical ice cores (e.g., nitrate)is poorly understood (Thompson et al. 1995). Forexample, models of stable isotope content typically re-late δO18 and δD to air temperature, but such relation-ships are especially questionable at low-latitude sites(Rozanski and Araguás 1995). Also important arethe climatic conditions at the moisture source, andfractionation processes during moisture transport andfollowing deposition (e.g., Grootes et al. 1989).Furthermore, there is a strong relationship in the Trop-ics between the stable isotope composition (δO18, δD)and the precipitation amount (e.g., Aravena et al. 1989;Rozanski and Araguás 1995).
To improve the calibration of geochemical varia-tions within tropical ice cores, we installed satellite-linked, automated weather stations (AWS) at thesummits of two Andean mountains in Bolivia (Fig. 1).Nevado Sajama is an ice-capped volcano (6542 m,18°06′S, 68°53′W), where we are collaborating withL.G. Thompson (Ohio State University), whose grouprecovered two ice cores to bedrock from the summitin June and July of 1997. The other station is locatednear the summit of Nevado Illimani in the CordilleraReal (6265 m, 16°39′S, 67°47′W), where another drill-ing campaign is anticipated within the next few years.
The objective of our ice-core calibration effort isto better understand the atmospheric signals in thesnow, by developing associations between propertiesof individual snowpack strata and both the airmass andpostdepositional history of that snow, at a finescalevertical resolution. The Sajama and Illimani stationsare both designed to measure all critical meteorologi-
cal variables. The analysis of station data is closely tiedto the results of annual snowpack studies carried outin the vicinity of the automatic weather stations.Individual stratigraphic layers in the snow pits are de-lineated and sampled in detail (for oxygen isotope ra-tios, microparticles, and major ions), enabling theepisodes of snowfall to be characterized in terms ofprecipitation geochemistry. Ultimately, the analysis ofthe prevailing meteorological conditions associatedwith precipitation events, as measured at the stations,combined with regional airflow derived from satelliteimagery, and reconstructed from NMC [National Me-teorological Center, now the National Centers forEnvironmental Prediction (NCEP)] global analyses,will enable different airflow patterns to be associatedwith variations in the geochemistry of the snow. Thiswill then provide valuable insight into the interpreta-tion of downcore geochemical variations.
In this paper we provide a description of theNevado Sajama station design and operation andpresent a discussion of observations through the firstannual cycle (October 1996 to September 1997). Thisnew station is 1000 m higher in altitude than any otherin either North or South America and will be operatedin conjunction with that on Illimani for several moreyears. Data from additional years will provide furtherinformation on climate variability at these sites. Adetailed analysis of the geochemical calibration pro-cess will be presented elsewhere.
2. Regional climate
The volcano Sajama is the highest mountain inBolivia; it is located in the southern Tropics, in thewestern Andean Cordillera, near the border with Chile(Fig. 1). The climate in this area is semiarid, with anaverage annual precipitation of 316 mm at the base ofSajama (Sajama Village, 4220 m, 1975–85). However,the interannual precipitation variability in this area ishigh (Ronchail 1995). During the summer months(November–March) the southern altiplano is mostlyinfluenced by the tropical circulation. Strong convec-tion and afternoon showers are the result of heating andthe rising motion of air masses over the altiplano(Garreaud and Wallace 1997). Moisture advectionfrom the interior of the continent (Amazon and ChacoBasins) maintains a high humidity level throughout thesummer months (P. Aceituno and A. Montecinos1997, personal communication). Nevertheless, precipi-tation events occur in discrete episodes with durations
FIG. 1. Nevado Sajama, viewed from the south (6542 m, 18°06′S, 68°53′W). Inset shows northern South America, with locationof Sajama (triangle) and Nevado Illimani (crosshair; 6265 m,16°47′W). Rivers are shown in gray.

1901Bulletin of the American Meteorological Society
of a few days rather than being a constant feature. Incontrast, the winter season is normally dry, interruptedonly by occasional outbreaks of polar air masses fromthe Pacific (cold fronts or upper-air lows) that some-times lead to snowfall even as far north as Sajama(Vuille and Ammann 1997).
The main features of the tropospheric circulationover this part of the Andes have been described in avariety of studies (Virji 1981; Nishizawa and Tanaka1983; Chu 1985; Fuenzalida and Rutllant 1987; Horelet al. 1989; Hoffmann 1992; Jacobeit 1992; Nogués-Paegle and Mo 1997; P. Aceituno and A. Montecinos1997, personal communication). In order to sustainconvection and associated precipitation, the upper-aircirculation plays a crucial role. Only upper-air diver-gence or strong easterly wind anomalies provide fa-vorable conditions for precipitation (Jacobeit 1992).During periods of upper-air convergence, convectionand precipitation are suppressed. Normally, this upper-air divergence, necessary to sustain convection, is as-sociated with anticyclonic outflow from an upper-levelhigh pressure system (“Bolivian high”). However,even as new and improved datasets have recently be-come available (e.g., Hastenrath 1997), and generalcirculation models have been shown to be very useful(e.g. Figueroa et al. 1995; Lenters and Cook 1995,1997), many features of the atmospheric circulationover the altiplano remain unclear. The AWS onNevado Sajama will therefore serve both to improveour knowledge about the climate at the ice-core siteand provide new insight about the midtroposphericcirculation (450-hPa level) over this part of the cen-tral Andes (cf. Vuille et al. 1998).
3. Sajama station design andequipment
We designed the Sajama station to allow recoveryof near-real-time measurements, and to provide theassurance of on-site data storage. The remote, high-elevation location of the station precludes unsched-uled service or repair visits, and immediate recoveryof the data stream was desired, permitting analysesimportant to the ice-core paleoclimate project tobegin. Therefore, mechanical and electrical reliabil-ity was essential, along with satellite telemetry.Excepting the custom-built tower, we used well-proven, commercially available components, config-ured to meet the demands of the site and projectobjectives (Fig. 2).
The tower is an adaptation of a design used byK. Steffen (University of Colorado) for the GreenlandClimate Network (http://cires.colorado.edu/people/steffen.group/gc-net.html). On Sajama, aluminum tub-ing is used throughout (6061 T6 alloy), with a 3-in.diameter, 0.25-in. wall thickness mast, the height ofwhich can be extended as snow accumulates at thesite. Horizontal supports are 1-in. diameter schedule80 pipe to reduce vibration in high velocity winds,attached to the vertical mast by plates that can be eas-ily adjusted upward.
Measurement and control functions are accom-plished by a Campbell Scientific, Inc. (CSI), modelCR10X datalogger. The reliability of the instrumenthas been well proven, with an estimated mean timebetween failures of 160 yr. With the current measure-ment and control program, the datalogger has suffi-cient memory to store 20 months of data, whilea solid-state data storage module provides an addi-
FIG. 2. Automated weather station at the summit of NevadoSajama (6542 m), 1 July 1997. GOES antenna is oriented to 68°true (ENE).

1902 Vol. 79, No. 9, September 1998
tional 12 months of on-site capacity. Both of thesedevices are provided with 4–6 yr of backup powerby independent lithium batteries, in the event of pri-mary power failure. Both were temperature tested atCSI by repeatedly cycling them between −55° and+85°C. Satellite telemetry is being provided by aGeostationary Operational Environmental Satellite(GOES) at an interval of 3 h, using a Telonics TGT1transmitter. The datalogger, transmitter, and periph-eral electronics are installed and housed in a sealed,fiberglass enclosure that was carried to the site alreadyassembled.
Most of the sensors used at the station (Table 1)received extended temperature testing or special cali-bration for the anticipated conditions at the summit.All sensors are controlled by the CR10X datalogger,with measurement and processing intervals that vary
between sensors (Table 1). Data are processed by thedatalogger hourly, then sent to storage and the trans-mitter. As indicated in the table, several additionalmeasurements began in July 1997, when the supple-mental sensors were installed.
Several experiments are being conducted at the sta-tion to help evaluate the quality of measurements. Forexample, identical temperature and relative humidityprobes are housed in two different radiation shields;one is aspirated by a blower and the other is naturallyventilated. This test is providing information aboutsolar loading effects on temperature and humiditymeasurements at high elevation. Two ultrasonic snowdepth sensors are situated 2 m apart, allowing a moreaccurate determination of accumulation or ablation byaveraging measurements at two sites. These two sen-sors also permit better temporal coverage, as during
Wind speed (upper) R.M. Young 05103 3.7 60 s 1 h Mean horizontal speed (m s−1)1 h Resultant mean speed (m s−1)24 h Maximum 1-min speed (m s−1),
time of, and temperature at time
Wind speed (lower) R.M. Young 05103 2.7 60 s 1 h Mean horizontal speed (m s−1)1 h Resultant mean speed (m s−1)
Wind direction (upper) R.M. Young 05103 3.7 60 s 1 h Resultant mean direction (deg.)1 h Std dev direction (5 subintervals)
Wind direction (lower) R.M. Young 05103 2.7 60 s 1 h Resultant mean direction (deg.)1 h Std dev direction (5 subintervals)
Barometric pressure Setra 270 1 hr 1 h Station pressure (hPa)
Air temperature Vaisala HMP35C 3.7 10 min 1 h Mean air temperature (°C)(aspirated shield) 1 h Max air temperature (°C), time
of, and 3.7-m wind speed at time
Airflow check, Gill 43408 3.7 10 min 1 h Mean of n = 6 checks (at eachaspirated shield (R.M. Young) check, 0 if switch open, 2 if
closed)
Air temperature Vaisala HMP35C 3.7 10 min 1 h Mean air temperature (°C)(naturally ventilated shield) 1 h Max air temperature (°C), time
of, and 3.7-m wind speed at time
Relative humidity Vaisala HMP35C 3.7 10 min 1 h Mean relative humidity (%)(aspirated shield)
TABLE 1. Sajama weather station sensors and measurements. All heights are at the time of the 1997 service and upgrade visit (1 July 1997). TheIllimani station configuration is similar.
Sensor manufacturer/ Zinitial
Sampling Data stored and transmittedVariable model (m) interval interval data (units)

1903Bulletin of the American Meteorological Society
precipitation events the acoustic signal quality issometimes diminished.
Electrical power to the station is provided by twoindependent 12V DC systems. Both use 10-W solarpanels and regulators to recharge sealed lead-acid bat-teries (24 and 25 A h). One system supplies 420–480 mA to the aspirated radiation shield fan andprovides power to the infrared temperature transducer.The datalogger, transmitter, and sensors are poweredby the second system.
Prior to shipment to Bolivia, the complete stationwas assembled and operated using one of the GOEStest channels. Considerable effort was made to ensuresuccessful installation of the station on Sajama, at analtitude where reduced oxygen concentration can im-pair human judgment. Fittings and hardware werecarefully labeled, and details were documented on
photographic prints. As further insurance, each mem-ber of the team from the University of Massachusettswas sufficiently familiar with station assembly to leadthe assembly effort, in the event of altitude-relatedphysiological problems among the group. At the sum-mit of Sajama, a site was chosen slightly to the north-east that is not directly within view from the highestpoint, to minimize disturbance of the station by anyof the estimated 100 climbers reaching the summiteach year.
4. Station operation
The Sajama station was installed on 1 October1996, shortly before the 1996–97 accumulation sea-son began. In June–July of 1997 eight days were spent
Relative humidity Vaisala HMP35C 3.7 10 min 1 h Mean relative humidity (%)(naturally ventilated shield)
Vapor pressure calculated (asp. sensors) 3.7 10 min 1 h Mean vapor pressure (kPa)
Incoming solar Eppley 8–48 4.5 60 s 1 h Mean incomingradiation; global irradiance (kW m−2)
Reflected solar LI-COR L1200X 2.7 60 s 1 h Mean refl. irradiance (kW m−2)radiation; global
Snow accumulation/ablation Campbell Scientific SR50 2.47 1 hr 1 h Distance to snow surface (m)(SW sensor) SW quadrant
1 hr 1 h Quality of measurement above(dimensonless integer)
Snow accumulation/ablation Campbell Scientific SR50 2.57 1 hr 1 h Distance to snow(NE sensor) surface (m) NE quadrant
1 hr 1 h Quality of measurement above(dimensionless integer)
Forward and reflected power 3 hr 3 h Forward and reflected power(from/to satellite transmitter) (decimal units)
Snow surface temperature* Everest Interscience 4000B 2.3 10 min 1 h Mean surface temperature (°C)*
Air temperature gradient* Type E thermocouples 0.03, 1.03, 10 min 1 h Mean temperature gradient(custom) 2.03, 3.7 (°C between sensors)*
Snow/firn temperature* Thermometrics 0.15, −1.85 10 min 1 h Snow temperature (1.85-mthermistors depth only on 1 July)*
TABLE 1. (Continued)
Sensor manufacturer/ Zinitial Sampling Data stored and transmittedVariable model (m) interval interval data (units)
*Installed June 1997.
1904 Vol. 79, No. 9, September 1998
at the site, midway through the 1997 ablation season,at which time the station was inspected and serviced.The heights of all sensors were raised, and severaladditional sensors were installed (Table 1).
Data from the station are accessible in two ways.At the site, the solid-state data storage module can bequickly replaced by another, allowing the completedataset to be downloaded in an environment morehospitable to computers. In addition, the telemetereddata are accessed daily through the National Environ-mental Satellite, Data and Information Service(NESDIS) of the National Oceanic and AtmosphericAdministration. In the climatology lab at the Univer-sity of Massachusetts (department of geosciences),integrated scripts and batch programs automaticallydial in to NESDIS in Virginia and acquire the data,screen all variables and flag those outside a predefinedrange, and transfer a backup of each file to anothercomputer. Every few days a series of graphs is con-structed from a template, which provides an additional,rapid quality control overview. Graphs of near-real-time data from the station are available from the cli-matology lab Web site (http://www.geo.umass.edu/climate/bolivia.html).
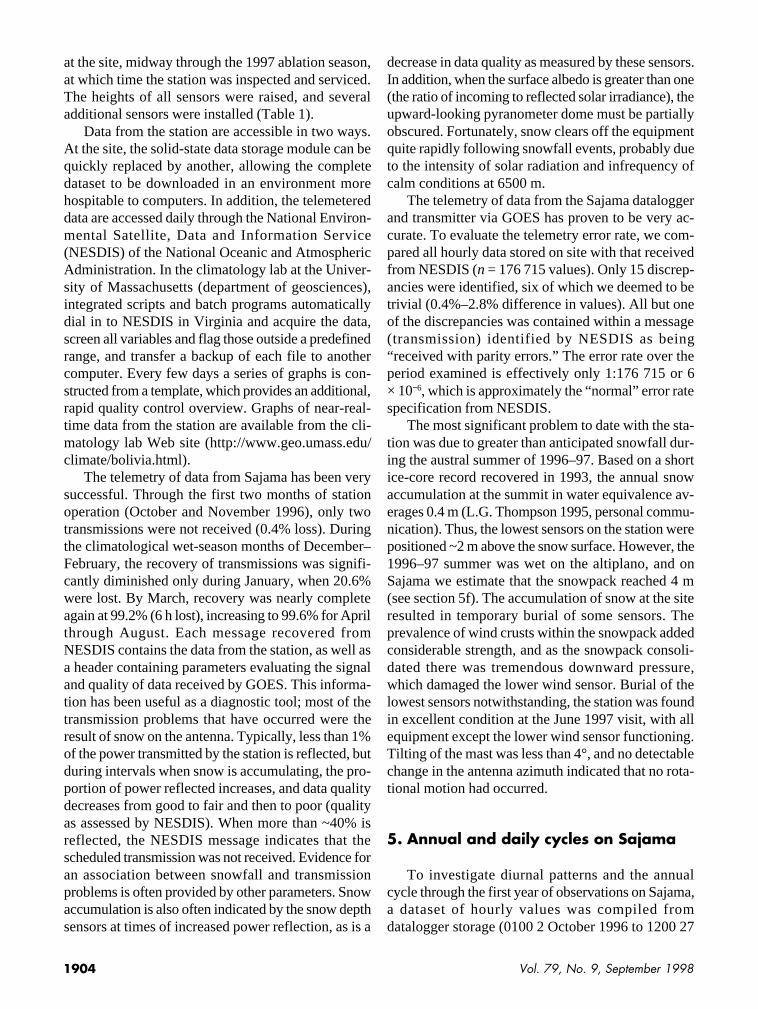
The telemetry of data from Sajama has been verysuccessful. Through the first two months of stationoperation (October and November 1996), only twotransmissions were not received (0.4% loss). Duringthe climatological wet-season months of December–February, the recovery of transmissions was signifi-cantly diminished only during January, when 20.6%were lost. By March, recovery was nearly completeagain at 99.2% (6 h lost), increasing to 99.6% for Aprilthrough August. Each message recovered fromNESDIS contains the data from the station, as well asa header containing parameters evaluating the signaland quality of data received by GOES. This informa-tion has been useful as a diagnostic tool; most of thetransmission problems that have occurred were theresult of snow on the antenna. Typically, less than 1%of the power transmitted by the station is reflected, butduring intervals when snow is accumulating, the pro-portion of power reflected increases, and data qualitydecreases from good to fair and then to poor (qualityas assessed by NESDIS). When more than ~40% isreflected, the NESDIS message indicates that thescheduled transmission was not received. Evidence foran association between snowfall and transmissionproblems is often provided by other parameters. Snowaccumulation is also often indicated by the snow depthsensors at times of increased power reflection, as is a
decrease in data quality as measured by these sensors.In addition, when the surface albedo is greater than one(the ratio of incoming to reflected solar irradiance), theupward-looking pyranometer dome must be partiallyobscured. Fortunately, snow clears off the equipmentquite rapidly following snowfall events, probably dueto the intensity of solar radiation and infrequency ofcalm conditions at 6500 m.
The telemetry of data from the Sajama dataloggerand transmitter via GOES has proven to be very ac-curate. To evaluate the telemetry error rate, we com-pared all hourly data stored on site with that receivedfrom NESDIS (n = 176 715 values). Only 15 discrep-ancies were identified, six of which we deemed to betrivial (0.4%–2.8% difference in values). All but oneof the discrepancies was contained within a message(transmission) identified by NESDIS as being“received with parity errors.” The error rate over theperiod examined is effectively only 1:176 715 or 6× 10⁻⁶, which is approximately the “normal” error ratespecification from NESDIS.
The most significant problem to date with the sta-tion was due to greater than anticipated snowfall dur-ing the austral summer of 1996–97. Based on a shortice-core record recovered in 1993, the annual snowaccumulation at the summit in water equivalence av-erages 0.4 m (L.G. Thompson 1995, personal commu-nication). Thus, the lowest sensors on the station werepositioned ~2 m above the snow surface. However, the1996–97 summer was wet on the altiplano, and onSajama we estimate that the snowpack reached 4 m(see section 5f). The accumulation of snow at the siteresulted in temporary burial of some sensors. Theprevalence of wind crusts within the snowpack addedconsiderable strength, and as the snowpack consoli-dated there was tremendous downward pressure,which damaged the lower wind sensor. Burial of thelowest sensors notwithstanding, the station was foundin excellent condition at the June 1997 visit, with allequipment except the lower wind sensor functioning.Tilting of the mast was less than 4°, and no detectablechange in the antenna azimuth indicated that no rota-tional motion had occurred.
5. Annual and daily cycles on Sajama
To investigate diurnal patterns and the annualcycle through the first year of observations on Sajama,a dataset of hourly values was compiled fromdatalogger storage (0100 2 October 1996 to 1200 27

1905Bulletin of the American Meteorological Society
June 1997) and via GOES te-lemetry (1100 28 June to 00002 October 1997).1 Within thedataset there are 69 h missingdue to station relocation in lateJune. Otherwise, gaps are gener-ally only 1–3 h duration (due totransient telemetry problems),resulting in a dataset that is98.9% complete for most vari-ables. With two exceptions, thevalues used here are hourlymeans based on either 10 or 60measurements, made during thepreceding hour (Table 1). Theexceptions are station pressureand distance to snow, which areactual hourly measurements. Alldaily minima and maxima (e.g.,temperature) represent the mini-mum and maximum hourlymean values each day, ratherthan individual extreme values.
a. PressureThe amplitude of the annual
change in barometric pressureon Sajama is very small, remain-ing within a range of 10 hPa allyear (Fig. 3a). Generally higherpressure during an extendedsummer season (i.e., Novem-ber–April) reflects the establish-ment of an annually recurring,upper-air high (“Bolivian high”)over Bolivia. The lowest annualpressure values were reachedduring Southern Hemispherewinter in the course of the north-ward displacement of the plan-etary west wind zone, and winterseason drops in pressure aremainly restricted to single events,when extratropical upper-air lows are cut off and dis-placed north toward the altiplano (Vuille and Ammann1997).
Through the entire annual cycle, a notable featureis the 12-hourly pressure tide, with a constant ampli-
tude of 1–2 hPa and maxima around 1130 and 2230LST (Fig. 4).
b. Incoming solar radiationFollowing the seasonal march of the sun, daily
solar irradiance maxima ranged between approxi-mately 1200 W m−2 during the summer and 800 W m−2
at the winter solstice (Fig. 5). Measured clear-sky glo-1Local standard time (LST) is used throughout this paper (UTC− 4 h).
FIG. 3. Color isopleth diagrams (daily versus hourly values) for the period 0100 2 Octo-ber 1996 to 0000 2 October 1997 (LST). Shown from top to bottom are (a) station pressure(hPa), (b) incoming solar irradiance (kW M−2), (c) aspirated air temperature (°C), (d) spe-cific humidity (g kg−1), and (e) wind speed (m s−1). Wind data are missing between 23 Feb-ruary and 13 April 1997 (see text). Note different y-axis scale for irradiance plot.

1906 Vol. 79, No. 9, September 1998
bal irradiance maxima were typically 85% of calcu-lated direct irradiance on a horizontal surface at the topof the atmosphere, reflecting the altitude of the stationand the dry atmosphere above the altiplano. Total dailyradiation receipts on Sajama were greatest during thespring months of October and November (Fig. 5),which is in agreement with data reported from theChilean altiplano by P. Aceituno and A. Montecinos(1997, personal communication). During the summermonths December–February, and extending intoMarch, moisture advection and afternoon convectivecloud cover over the altiplano significantly reduced thedaily receipt of solar radiation (Fig. 3b). Cloud coverwas reduced through the winter, as indicated by theaccordance of daily irradiance maxima (Fig. 5) and theregularity of the daily cycle (Fig. 3b), interrupted onlyby the passage of occasional cold fronts.
Solar irradiance measurements from AWS alwaysrequire cautious interpretation, as snow accumulationon the radiometer dome under certain conditions dur-ing precipitation events results in an apparent reduc-tion in irradiance. Some measurements must thereforebe considered minimum estimates. To investigate theextent of this problem on Sajama, we compared half-day totals of top-of-the-atmosphere calculated radia-tion receipts with those measured at the station (i.e.,sunrise to 1200 LST and 1201 to sunset; both in MJ).General agreement is evident between the patterns ofcalculated and measured radiation receipts in themorning (Fig. 6). The greatest deviations are appar-ent during December–February, the primary monthsof snow accumulation (with lesser deviations duringMarch and September). Figure 3b illustrates that mea-sured irradiance through the morning hours is lessregular (more variable) during these months, when aseasonal increase in moisture advection often resultsin morning cloudiness. However, the associated snow-fall must also account for some of the discrepancybetween the patterns in summer. Nonetheless, the ac-cordance through most of the annual cycle of the mea-sured and calculated patterns, in the typicallycloud-free morning, suggests that the measured datarepresent the radiation regime at the site reasonablywell.
The afternoon pattern of measured receipts differssignificantly from that calculated (Fig. 6). Considerableday-to-day variability in afternoon irradiance occurson Sajama (Fig. 3b), which we attribute primarily toclouds. Indeed, convective cloudiness in this regionof South America is well documented. Cloud covertypically increases rapidly between 1200 and 1700,
reaching a maximum around 1800, fol-lowed by a decrease until midnight(Garreaud and Wallace 1997). The dis-tinct morning and afternoon patterns ofradiation receipt (Fig. 6) suggest thatafternoon cloudiness occurs throughmuch of the year on Sajama, though to alesser extent during the winter.
c. Air temperatureTropical locations typically experi-
ence relatively little temperature changethrough the course of the year. Althoughthe Sajama station can still be consideredtropical, it is located at the very southernedge of the Tropics and is strongly influ-enced by extratropical circulation in the
FIG. 4. Daily cycle of mean hourly barometric pressure (hPa),2 October 1996 to 1 October 1997. Error bars for each hour are±1 std dev.
FIG. 5. Sajama maximum solar irradiance each day, in W m−2 from hourly val-ues (line with circles), and monthly mean daily radiation received, in MJ day−1
(line with triangles). Also shown is the maximum daily top-of-atmosphere irradi-ance (horizontal surface, in W m−2) at the location of Sajama (heavy line), fromhourly calculations made on the hour, LST.
1907Bulletin of the American Meteorological Society
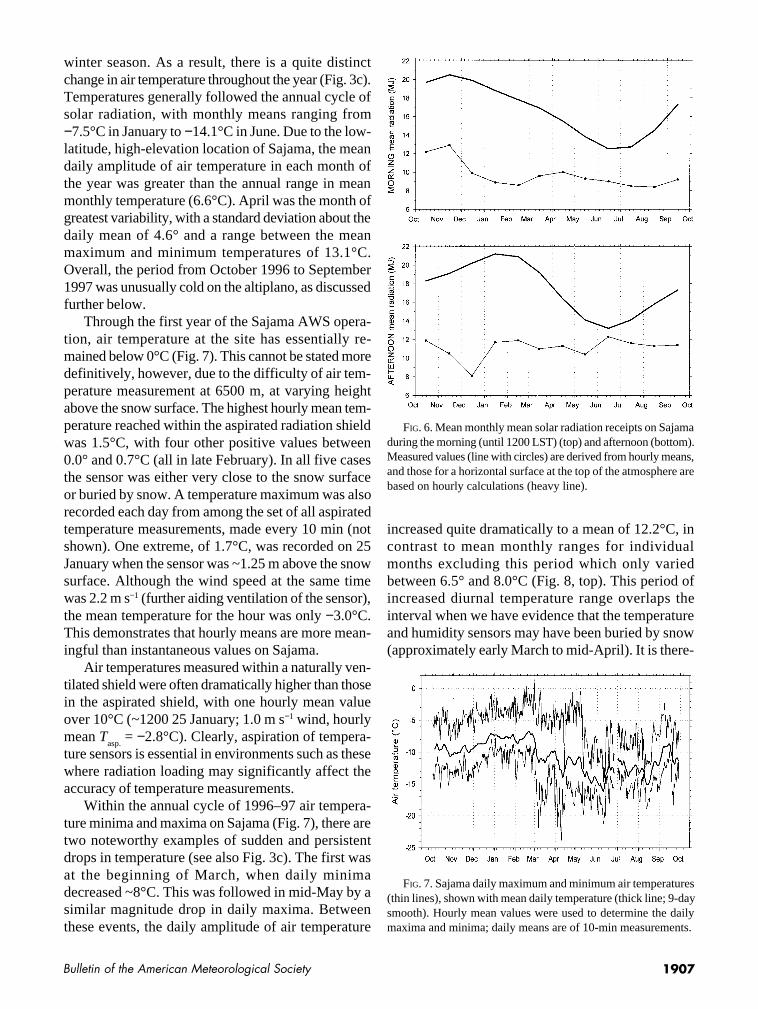
winter season. As a result, there is a quite distinctchange in air temperature throughout the year (Fig. 3c).Temperatures generally followed the annual cycle ofsolar radiation, with monthly means ranging from−7.5°C in January to −14.1°C in June. Due to the low-latitude, high-elevation location of Sajama, the meandaily amplitude of air temperature in each month ofthe year was greater than the annual range in meanmonthly temperature (6.6°C). April was the month ofgreatest variability, with a standard deviation about thedaily mean of 4.6° and a range between the meanmaximum and minimum temperatures of 13.1°C.Overall, the period from October 1996 to September1997 was unusually cold on the altiplano, as discussedfurther below.
Through the first year of the Sajama AWS opera-tion, air temperature at the site has essentially re-mained below 0°C (Fig. 7). This cannot be stated moredefinitively, however, due to the difficulty of air tem-perature measurement at 6500 m, at varying heightabove the snow surface. The highest hourly mean tem-perature reached within the aspirated radiation shieldwas 1.5°C, with four other positive values between0.0° and 0.7°C (all in late February). In all five casesthe sensor was either very close to the snow surfaceor buried by snow. A temperature maximum was alsorecorded each day from among the set of all aspiratedtemperature measurements, made every 10 min (notshown). One extreme, of 1.7°C, was recorded on 25January when the sensor was ~1.25 m above the snowsurface. Although the wind speed at the same timewas 2.2 m s−1 (further aiding ventilation of the sensor),the mean temperature for the hour was only −3.0°C.This demonstrates that hourly means are more mean-ingful than instantaneous values on Sajama.
Air temperatures measured within a naturally ven-tilated shield were often dramatically higher than thosein the aspirated shield, with one hourly mean valueover 10°C (~1200 25 January; 1.0 m s−1 wind, hourlymean T
asp. = −2.8°C). Clearly, aspiration of tempera-
ture sensors is essential in environments such as thesewhere radiation loading may significantly affect theaccuracy of temperature measurements.
Within the annual cycle of 1996–97 air tempera-ture minima and maxima on Sajama (Fig. 7), there aretwo noteworthy examples of sudden and persistentdrops in temperature (see also Fig. 3c). The first wasat the beginning of March, when daily minimadecreased ~8°C. This was followed in mid-May by asimilar magnitude drop in daily maxima. Betweenthese events, the daily amplitude of air temperature
increased quite dramatically to a mean of 12.2°C, incontrast to mean monthly ranges for individualmonths excluding this period which only variedbetween 6.5° and 8.0°C (Fig. 8, top). This period ofincreased diurnal temperature range overlaps theinterval when we have evidence that the temperatureand humidity sensors may have been buried by snow(approximately early March to mid-April). It is there-
FIG. 6. Mean monthly mean solar radiation receipts on Sajamaduring the morning (until 1200 LST) (top) and afternoon (bottom).Measured values (line with circles) are derived from hourly means,and those for a horizontal surface at the top of the atmosphere arebased on hourly calculations (heavy line).
FIG. 7. Sajama daily maximum and minimum air temperatures(thin lines), shown with mean daily temperature (thick line; 9-daysmooth). Hourly mean values were used to determine the dailymaxima and minima; daily means are of 10-min measurements.

1908 Vol. 79, No. 9, September 1998
fore of considerable importance to assess whetherthe range increase is spurious or reflects real climaticvariability.
Abundant evidence suggests that the increaseddaily range in air temperature from early March tomid-May is reflective of actual synoptic conditions,despite probable sensor burial. Coinciding with theearly March drop in minima at the station was a de-crease in minima elsewhere on the altiplano (Fig. 9).Significant changes in other variables measured onSajama were also associated with the decrease. Forexample, solar radiation receipts during the morninghours increased dramatically coincident with the dropin temperature minima (Fig. 3b), suggesting fewerovernight clouds and increased radiational cooling.Specific humidity also decreased abruptly, and re-mained lower (Fig. 3d), while the daily range in wa-ter vapor content increased (Fig. 8, bottom). At thetime of the temperature decrease there was an unusu-ally rapid, large drop in station pressure (Fig. 3a), andsimultaneous lowering of geopotential heights at450 hPa obtained from daily NCEP analyses. Winddata are not available from the station at this time (dueto sensor burial by snow), but zonal winds obtainedfrom NCEP output increased sharply, coinciding witha drop in temperature (especially at 400 hPa). When the
mid-May drop in temperature maxima occurred, simi-lar changes were observed in other variables, includ-ing a pronounced increase in wind speed at the stationand another large steplike decrease in specific humid-ity (Figs. 3e,d), and a decrease in the daily humidityrange (Fig. 8, bottom).
With supporting evidence from several variables,other stations, and NCEP output, we believe that thetemperature record from Sajama through this periodis essentially correct. If burial by snow did occur, thevalidity of measurements seems not to have been com-promised, perhaps due to the low density of the snowand adequate ventilation by wind. Furthermore, theexpected influence of sensor burial is nearly oppositethat observed (i.e., decrease in temperature minima andhumidity rather than an increase). Therefore, theSajama station data indicate that the change from thesummer to winter season occurred in a few abruptsteps, rather than as a gradual transition over severalmonths.
d. HumidityThe humidity of the atmosphere on Sajama varies
markedly through the course of the year, illustrated byrelative humidity extremes recorded in 1996–97 of0.2% and 99.9%. Through the summer months ofDecember–February, the median relative humiditywas greater than 90%, reflecting a mean specific hu-midity of 3.6 g kg−1 (Fig. 3d). Typically, the humiditylevel during summer months remains high due to dailyinjections of water vapor into midtropospheric levels(400–500 hPa) by vertical turbulent transport of mois-ture from lower levels and advection at this level(P. Aceituno and A. Montecinos 1997, personal com-
FIG. 8. The daily range in air temperature (top) and specifichumidity (bottom) on Sajama, determined as the difference be-tween the maximum and minimum hourly mean values each day.
FIG. 9. Minimum daily temperatures on Sajama, and Boliv-ian weather stations La Paz El Alto (4014 m, 16°31′S, 68°11′W)and Charana (4057 m, 17°35′S, 69°27′W) for days when dataare available.

1909Bulletin of the American Meteorological Society
munication). High humidity on Sajama during the wetseason is associated with easterly winds, which delivermoisture from the interior of the continent. The sum-mer of 1996–97 was unusually wet on the entire alti-plano, as discussed below, so the humidity levelsmeasured represent conditions that are above the long-term average.
The winter season is characterized by very dryconditions (Fig. 3d), when it is not uncommon for rela-tive humidity to remain below 20% for several con-secutive days. Indeed, the median specific humiditythrough these three months was less than 0.9 g kg−1.These dry conditions are commonly interrupted byshort periods of high humidity, when moist air epi-sodes related to outbreaks of polar air masses reachthe altiplano. These occurrences are also associatedwith higher wind speeds, lower pressure and air tem-perature, and sometimes snowfall as far north asSajama. Examples recorded at the station include twoevents during August and another in mid-September(Fig. 3).
Superimposed upon the distinct seasonal cycle ofhumidity is a seasonality of the diurnal cycle. Thisresults in seasonality of snow surface evaporation.Specific humidity on Sajama was always highest in theafternoon (Fig. 3d), with the daily peak lagging thesolar irradiance distribution by 1–3 h. Relative humid-ity also increased in the afternoon, but only during thewinter and through intervals when the atmosphere wasrelatively dry (low specific humidity). When the at-mosphere was moist, these two measures of humiditywere uncorrelated (Fig. 10), demonstrating the sea-sonal variability of evaporation on Sajama. Daily fluc-tuations in relative humidity through the summer (e.g.,Fig. 10, January) are largely due to the diurnal fluc-tuations in temperature, as the actual water vapor con-tent does not change dramatically (Fig. 11). During thewinter, however, when the daily range in air tempera-ture is equivalent to that in summer (5°–10°C; see topof Fig. 8), the day-to-day change in water vapor con-tent is much higher (Fig. 11). For example, throughthe two 10-day periods illustrated in Fig. 10, the me-dian daily increases in specific humidity were 140%and 840%, for summer and winter (respectively).Although large daily relative increases in specifichumidity occur periodically throughout the year (e.g.,1 and 2 February, Fig. 11), turbulent mass transfer (i.e.,evaporation) on Sajama is especially vigorous duringthe winter, when high humidity gradients between thesnow surface and the air are augmented by a seasonalincrease in wind speed.
e. Wind speed and directionWind data are missing from the 1996–97 record
between the end of February and mid-April, when bothsensors were affected by the unusually heavy summersnowfall. Nonetheless, NCEP output confirms that themost significant change in the wind speed occurred inmid-May, when winds suddenly accelerated and re-mained high for most of the winter season (Fig. 3e).This increase in wind speed reflects the northwardmovement of the west wind zone and the subtropicaljet, which is typically located at around 25°S in June.Through the winter, the wind was steadily from thenorth and northwest (Fig. 12) and the Sajama regionexperienced several months of high wind speeds, as-
FIG. 10. Ten-day periods of humidity measurements on Sajama,during the summer month of January (top) and in July (bottom).
FIG. 11. The relative change in specific humidity each day (per-cent increase), calculated as (maxima ÷ minima) × 100.

1910 Vol. 79, No. 9, September 1998
sociated with rather dry conditions. The highest meanhourly wind speed recorded was 27 m s−1 on 10 June,and mean hourly wind speeds rose above 20 m s−1 onlybetween May and October. During the summer months(December–February) wind speeds were much lower,averaging a surprisingly low 2.6 m s−1 for the period(Fig. 3e). Also through the summer, and extending intoMarch on Sajama, the predominance of winds from thesoutheast and east provides part of the explanation forthe above average precipitation (Fig. 12), as easterlywinds are necessary to sustain high humidity levels inthe atmosphere above the altiplano. By April windshad switched back toward the north and northwest,which remained the prevailing wind direction untilAugust.
The daily cycle of wind speed is not very pro-nounced; however, the lowest wind speeds are usuallyrecorded in the afternoon hours during the maximumexpansion of the troposphere (Fig. 3e), an effect alsofound by P. Aceituno and A. Montecinos (1997, per-sonal communication). Frequently, this daily cycle issuppressed by the influence of the larger-scale synopticcirculation.
f. Snow accumulation (precipitation)Snow accumulation measurements in 1996–97 are
continuous only until the end of January, at which timethe snow surface under both depth sensors reachedthe minimum distance-to-target specified by themanufacturer (0.4 m). Until then, net snow accumu-lation was greater than 2 m (Fig. 13). October 1996was dry, resulting in 14 cm of ablation, while twomajor snowfalls in November brought 32 cm ofsnow. Accumulation continued through December(58 cm) and January (119 cm). Snowfall between Feb-ruary and June can only be estimated based upon in-
direct evidence, but a net depth of3.3 m must have been reached bythe end of February, when the up-per wind sensor was affected. Wealso know that snow depth hadfallen back down to 3.3 m by mid-April, when the upper wind sensorbecame fully operational again. Amaximum depth of accumulationis estimated to have been 4.1–4.3 m, based on the ratio of Sajamamonthly precipitation to that in LaPaz and corroborated by evidencethat the uppermost equipment onthe station remained unburied (ra-
diometer, solar panel). By the end of June when thesnow depth sensor heights were adjusted, net accumu-lation since the previous October was ~2.1 m. FromJuly through September 1997, four snowfall events to-taled 53 cm, although there was a net surface lower-ing of 16 cm, due primarily to ablation and windscouring of the new snow.
There are important differences between the sum-mer and winter snowfall events on Sajama, a resultthat will bear upon the interpretation of geochemicaland isotopic variability measured in the snow and inthe ice cores. Figure 14 illustrates the evolution of pre-cipitation events typical of each season. Over 5 days,the magnitude of snowfall was equivalent (~21 cm),which belies significant differences. The Januaryevent (thin line, Fig. 14) represents a typical summersnowfall, characterized by strong convection andmoisture advection from the east. In general, theseevents tend to be relatively warm, with little day-to-day change in temperature or pressure, and with lowwind speeds from the easterly direction. On the other
FIG. 12. Change in the prevailing wind direction through the course of the year (rela-tive frequency). Data are missing between 23 February and 13 April 1997.
FIG. 13. Snow surface height on Sajama relative to datum of 1October 1996, smoothed with a 13-h running average. Sensorswere buried between late January and 1 July (see text).

1911Bulletin of the American Meteorological Society
hand, a winter snowfall as represented by the Augustevent (thick line, Fig. 14) is related to the north- andeastward movement of a cutoff upper-air low from theextratropical circulation. Temperatures are colder(e.g., 5.7°C for the periods shown) and drop as theupper-level low approaches, as does station pressure.Wind speed through the August event illustrated istwice that of the January event, with winds primarilyfrom the north. The variability of wind direction dur-ing the January and August events was similar (std dev= 14°); however, wind direction through the latterveered systematically, from north-northwest to northto east and back to north as the low progressed east-ward (not shown). Through both snowfall events,Sajama measurements complement and refine thesynoptic picture provided by the NCEP analyses (es-pecially 450-hPa geopotential heights). The stationdata confirm how crucial it is to analyze the climatic
pattern of single snowfall events and determine theassociated stratigraphic layer within the snowpack, asgeochemistry and stable isotopic composition areexpected to be significantly different during theseevents.
6. 1996–97 Sajama observations in alonger-term context
Measurements of precipitation and temperature atLa Paz provide a longer-term perspective on the firstyear of data from Sajama. Observations have beenmade since 1898 at La Paz El Alto (4014 m, 16°31′S,68°11′W), located at the JFK Airport above the cityof La Paz.
The period of November 1996 through March 1997was wetter than normal on the altiplano of Bolivia.Precipitation was above the median in all five months(Fig. 15), accounting for the unexpectedly high accu-mulation at the Sajama station. The March total at LaPaz El Alto (146 mm) was the fifth highest of the past100 yr. Precipitation during the fall and winter was
FIG. 14. Contrasting evolution of two 1997 snowfall eventsover 5 days (noon to noon), in summer (thin line; 10–15 January)and winter (thick line; 7–12 August). Shown from top to bottomare aspirated air temperature, wind speed, barometric pressure,snow depth above 1 October 1996 datum, and relative frequencyof wind direction (indicated directions are ±22.5° bins).
FIG. 15. Precipitation (top) and air temperature (bottom) at LaPaz El Alto (4014 m, 16°31′S, 68°11′W) for October 1996 to Sep-tember 1997, in a longer-term context (1996–95). Whisker plotboxes illustrate the median (line) and enclose the 25th and 75thpercentiles. Error bars enclose the 10th and 90th percentiles, withextremes indicated by circles.

1912 Vol. 79, No. 9, September 1998
normal in the context of the past 30 yr, but the totalfor September of 1997 was again unusually high.
The surface temperature at La Paz El Alto wasmore than one standard deviation below normal in allexcept 3 months of the period October 1996 to Sep-tember 1997 (Fig. 15). The greatest departures wereduring December, March, and April, when meanmonthly temperatures were the lowest of the periodof record (79 yr). The first year of temperature mea-surement on Sajama therefore seems to reflect condi-tions that were well below the long-term average.Indeed, the mean station temperature for the year of−10.7°C is slightly less than the −10.3°C value forboth the NCEP long-term mean at 450 hPa (1985–95),and that predicted by the 10-m-depth firn temperature(V. Zagoradnov 1997, personal communication).
7. Conclusions
Sajama weather station measurements are helpingto develop a more comprehensive view of climaticconditions at high altitudes in this remote part of thetropical Andes. The first year of measurements at thestation was carried out successfully, despite 4 m ofsnow accumulation and continuously subfreezing tem-perature. Analysis of the observations reveals con-siderable variability in weather at the summit. Whilea clear seasonality of atmospheric processes resultingin snowfall and governing evaporation has been dem-onstrated, the data also illustrate that these events orintervals are more episodic in nature than previouslybelieved. As measurements at the station continue, wewill report on annual and daily cycles further in thecontext of synoptic-scale circulation, incorporatingsatellite imagery, and NCEP output.
The Sajama station provides a unique climatic da-tabase, which in conjunction with snowpack analysiswill allow a more meaningful calibration of geochemi-cal and isotopic signals in tropical ice cores. Variabilityof geochemical and isotopic composition, as measuredwithin individual layers of the annual snowpack, will berelated to airmass origins and transport histories as wellas postdepositional influences. As the chronologicaland climatic significance of ice-core records are basedon such variability, these associations will provide apowerful tool for interpreting tropical ice-core records.
Acknowledgments. Funding for the Sajama weather stationproject, and the ice core drilling, is provided by the NOAA Of-fice of Global Programs (Paleoclimatology); the Swiss National
Science Foundation provides additional support. These agenciesare gratefully acknowledged. We received enormous logisticalsupport from B. Francou, B. Pouyaud, and the ORSTOM staff inLa Paz, as well as from L.G. Thompson and his team at Ohio StateUniversity. Thanks to John Sweeney for extra effort in the ma-chine shop. We would also like to thank Clyde Best and DanAnderson at Campbell Scientific for their assistance.
References
Aravena, R., H. Peña, A. Grilli, O. Suzuki, and M. Mordeckai,1989: Evolución isotopica de las Iluvias y origen de las masasde aire en el Altiplano Chileno (On the isotopic signal of rain-fall in relation to the origin of air masses on the Chilean Alti-plano). Isotope hydrology investigations in Latin America.IAEA-TECDOC-502, 14 pp. [Available from InternationalAtomic Energy Agency, Vienna International Centre,Wagramerstrasse 5, A-1400 Vienna, Austria.]
Chu, P.-S., 1985: A contribution to the upper-air climatology oftropical South America. J. Climatol., 5, 403–416.
Diaz, H. F., and N. E. Graham, 1996: Recent changes in tropicalfreezing heights and the role of sea surface temperature. Na-ture, 383, 152–155.
Figueroa, S. N., P. Satyamurty, and P.L. Da Silva Dias, 1995: Simu-lations of the summer circulation over the South American re-gion with an Eta coordinate model. J. Atmos. Sci., 52, 1573–1584.
Francou, B., and P. Ribstein, 1995: La actual deglaciación en losAndes centrales: Un indicador del cambio climatico en cursoen la alta montaña tropical (Present glacier retreat in the cen-tral Andes: An indicator of ongoing climatic change in thehigh mountains of the Tropics). Proc. Int. Symp. SustainableMountain Development, La Paz: Managing Fragile Ecosys-tems in the Andes, The United Nations University, 10–11.
Fuenzalida, H. P., and J. Ruttlant, 1987: Origen del vapor de aguaque precipita en el Altiplano de Chile (Study on the origin ofthe water vapor precipitating in the Altiplano during SouthernHemisphere summer). Anales del II Congreso Interamericanode Meteorologia, Buenos Aires, Argentina, Amer. Meteor.Soc., 6.3.1.–6.3.4.
Garreaud, R. D., and J. M. Wallace, 1997: The diurnal march ofconvective cloudiness over the Americas. Mon. Wea. Rev.,125, 3157–3171.
Grootes, P. M., M. Stuiver, L. G. Thompson, and E. Mosley-Thompson, 1989: Oxygen isotope changes in tropical ice,Quelccaya, Peru. J. Geophys. Res., 94 (D1), 1187–1194.
Hastenrath, S., 1997: Annual cycle of upper-air circulation andconvective activity over the tropical Americas. J. Geophys.Res., 102 (D4), 4267–4274.
——, and P. D. Kruss, 1992: The dramatic retreat of MountKenya’s glaciers 1963–87: Greenhouse forcing. Ann. Glaciol.,16, 127–133.
Hoffmann, J. A. J., 1992: Das kontinentale Luftdruck- undNiederschlagsregime Südamerikas (The pressure- and precipi-tation-cycle over the South American continent). Erdkunde,46, 40–51.
Horel, J. D., A. N. Hahmann, and J. E. Geisler, 1989: An investi-gation of the annual cycle of convective activity over the tropi-cal Americas. J. Climate, 2, 1388–1403.
1913Bulletin of the American Meteorological Society
Jacobeit, J., 1992: Die grossräumige Höhenströmung in derHauptregenzeit feuchter und trockener Jahre über demsüdamerikanischen Altiplano (On the large-scale upper-airflow during the main rainy season of dry and wet years on theSouth American Altiplano). Meteor. Z., 1 (6), 276–284.
Jordan, E., 1995: Estado actual de al glaciación en los Andes deBolivia y Colombia. Aguas, glaciares y cambios climaticos enlos Andes Tropicales (On the present state of deglaciation inthe Bolivian and Columbian Andes). Proc. Seminariointernacional, La Paz, Bolivia, Organisation de RechercheScientifique et Technique d’Outre-mere, 185.
Kaser, G., and B. Noggler, 1996: Glacier fluctuations in theRuwenzori Range (East Africa) during the 20th century—Apreliminary report. Z. Gletsch. Glazial., 32, 109–117.
Lenters, J. D., and K. H. Cook, 1995: Simulation and diagnosisof the regional summertime precipitation climatology of SouthAmerica. J. Climate, 8, 2988–3005.
——, and ——, 1997: On the origin of the Bolivian high and re-lated circulation features of the South American climate. J.Atmos. Sci., 54, 656–677.
Mayewski, P. A., L. D. Meeker, S. Whitlow, M. S. Twickler, M. C.Morrison, R.B. Alley, P. Bloomfield, and K. Taylor, 1993: Theatmosphere during the Younger Dryas. Science, 261, 195–197.
Mitchell, J. F. B., S. Manabe, V. Meleshko, and T. Tokioka, 1990:Equilibrium climate change and its implications for the future.Climate Change: The IPCC Assessment, J. T. Houghton, G. J.Jenkins, and J. J. Ephraums, Eds., Cambridge University Press,131–172.
Nishizawa, T., and M. Tanaka, 1983: The annual change in thetropospheric circulation and the rainfall in South America.Arch. Meteor. Geophys. Bioclimatol., 33B, 107–116.
Nogués-Paegele, J., and K. C. Mo, 1997: Alternating wet and dryconditions over South America during summer. Mon. Wea.Rev., 125, 279–291.
Peterson, J. A., and L. F. Peterson, 1996: Ice retreat from theneoglacial maxima in the Puncak Jayakesuma area, Republicof Indonesia. Z. Gletsch. Glazial., 30, 1–9.
Ronchail, J., 1995: Interannual variability of rainfall in Bolivia.Bull. Inst. Fr. Études Andines, 24 (3), 369–378.
Rozanski, K., and L. Araguás, 1995: Spatial and temporal vari-ability of stable isotope composition of precipitation over theSouth American continent. Bull. Inst. Fr. Études Andines, 24(3), 379–390.
Schubert, C., 1992: The glaciers of the Sierra Nevada de Mérida(Venezuela): A photographic comparison of recent deglacia-tion. Erdkunde, 46, 58–64.
Thompson, L. G., 1995: Late Holocene ice core records of cli-mate and environment from the tropical Andes, Peru. Bull. Inst.Fr. Études Andines, 24 (3), 619–629.
——, E. Mosley-Thompson, P. M. Grootes, M. Pourchet, andS. Hastenrath, 1984: Tropical glaciers: Potential for ice corepaleoclimatic reconstructions. J. Geophys. Res., 89 (D3),4638–4646.
——, ——, J. F. Bolzan, and B. R. Koci, 1985: A 1500 year recordof tropical precipitation in ice cores from the Quelccaya IceCap, Peru. Science, 229, 971–973.
——, ——, M. E. Davis, N. Lin, T. Yao, M. Dyurgerov, andJ. Dai, 1993: “Recent warming”: Ice core evidence from tropi-cal ice cores, with emphasis on central Asia. Global Planet.Change, 7, 145–156.
——, ——, M. E. Davis, P.-N. Lin, K. A. Henderson, J. Cole-Dai,J. F. Bolzan, and K.-B. Liu, 1995: Late glacial stage and Ho-locene tropical ice core records from Huascarán, Peru. Science,269, 46–50.
Virji, H., 1981: A preliminary study of summertime troposphericcirculation over South America estimated from cloud winds.Mon. Wea. Rev., 109, 599–610.
Vuille, M., and C. Ammann, 1997: Regional snowfall patterns inthe high arid Andes. Climate Change, 36, 413–423.
——, D. R. Hardy, C. Braun, F. Keimig, and R. S. Bradley, 1998:Atmospheric circulation anomalies associated with 1996/97summer precipitation events on Sajama Ice Cap, Bolivia. J.Geophys. Res., Atmos., 103 (D10), 11 191–11 204.