annual education results report 2016-2017 & three-year
TRANSCRIPT

Page 1
Annual Education Results Report 2016-2017 & Three-Year Education Plan 2017-2020
For a summary of the AERR visit the following linkhttp://calgarygirlsschool.com/wp-content/uploads/2017/11/2016-17-Summary-Sheet-Ver2.pdf CGS welcomes questions or feedback on the AERR and Education Plan. Contact the Superintendent via email at [email protected] or call the Board Office at 403.252.0702.

Page 2
Message from the Board Chair
The Board of Directors governs a successful, innovative public charter school. We practice responsible stewardship in hopes that generations of girls will benefit from the unique learning experiences at the Calgary Girls’ School. The all-for-girls learning environment fosters confident, courageous, and connected young women who practice leadership in their school community as preparation for leading in the global community. In the past year, fees for transportation increased by 2.5% to match the new contract with our service provider. Regrettably, transportation grant funding did not increase. This, in addition to requests for subsidies, resulted in a deficit in this area. The Board approved capital projects which included the replacement
of nearly all the flooring at Bel Aire and significant upgrades to the staff room kitchen. The antiquated phone system on both campuses was also replaced. These expenditures, which were extra to the budget, added to the operating deficit. However, these expenditures will be offset by funds from the accumulated operating surplus. The Board hosted its second annual parent Speak Out which was positively received. Parents overwhelmingly approved of the engagement opportunity. Feedback from Speak Out, parent Satisfaction Surveys and the Early-Exiting Survey informed the continuous improvement priorities noted in this Three-Year Education Plan. The Board of Directors welcomed Christine Jackson, alumni member of CGS and Gary Care as new members and thanked Shary Baig and Natalie Kwadrans for their service. The Board continued with its important advocacy on behalf of charter schools, and especially the unique and important contribution of an all-girls school as an important opportunity in public education. We are proud of the school’s accomplishments. Academic results continue to exceed provincial averages in Mathematics, Science, Social Studies and Language Arts. Similarly, stakeholder satisfaction is rated excellent. These outcomes align with the Board’s broad, strategic direction to establish CGS as the school of choice for girls. Our charter goals to enhance girls’ academic, social and emotional learning and to support teamwork and collaboration in pursuit of professional excellence are realized in our school’s culture and professional practice. We are impressed with our students and their many accomplishments. We appreciate our staff for their commitment to excellence. We are grateful for the parents and families who support our girls and choose the Calgary Girls’ School. Sincerely,
Natalya Nicholson, B.Sc. M.Sc.

Page 3
Accountability Statement The Annual Education Results Report for the 2017-2018 school year and the Education Plan for the three years commencing September 1, 2017 for the Calgary Girls’ School were prepared under the direction of the Board in accordance with its responsibilities under the School Act. This document was developed in the context of the provincial government’s business and fiscal plans. The Board has used the results reported in the document, to the best of its abilities, to develop the Education Plan and is committed to implementing the strategies contained within the Education Plan to improve student learning and results. The Board approved this combined Annual Education Results Report for the 2017/2018 school year and the three-year Education Plan for 2017/2020 on November 22, 2017.
On behalf of the Board of Directors,
Ms. Natalya Nicholson, Board Chair
Board of Directors: Margo Purcell, Vice Chair; Geordie MacPherson, Stanley Wong, Caroline Claussen*, Wayne Marshall*, Brad Takenaka, Gary Care* and Christine Jackson
*Parent Members of the Charter Board
Christine Jackson and Gary Care, elected in the Spring of 2017 replaced outgoing Directors Shary Baig and Natalie Kwadrans.

Page 4
Foundation Statements
Vision Our vision is to be a centre of excellence enabling girls and young women to become confident and innovative leaders in a complex and global world. Mission The girls and young women of CGS are agents of change who develop confidence and a strong sense of self in a safe, collaborative, inquiry-based learning environment. Values Values are fundamental principles and beliefs that serve as implicit criteria guiding all actions and decision-making. These include: Compassion, Courage, Diversity, Integrity, Curiosity, Democracy, and Collaboration.

Page 5
Profile of the Calgary Girls’ School The Minister of Education granted the Calgary Girls’ School Society its first charter to operate the school from September 2003 to June 2008. The Charter was renewed in 2012 and extended to 2027. A Board of Directors composed of elected parents and community members who are not parents of enrolled students governs the school. The Charter goals which make CGS a unique school of choice and innovation for girls include: enhancing academic achievement and social-emotional development through an all-girls learning environment, supporting staff in their pursuit of professional excellence, and building a school community characterized by team work and collaboration. In addition to the regular Alberta Programs of Study, students experience the Go Girls curriculum. Girls examine, understand and appreciate the contributions and place of women in history, in society today and into the future; develop the capacity to know and realize their own potential and efficacy; and improve rigor and depth in their acquisition of knowledge and skills to enable thoughtful career and life choices. Through inquiry, the primary pedagogical approach to instruction at CGS, girls develop the knowledge, skills, and attitudes necessary for posing and responding to great questions. The culture of teamwork and collaboration provides a place of belonging where girls thrive. CGS is a public school so all interested girls have opportunity to apply for admission within the context of the Charter Schools Regulation and our enrolment cap of 600 students. CGS operates two campuses which serve grades 4-9. Many shared activities ensure students feel at home on either campus. Together, girls from many socio-economic backgrounds and all quadrants of the city create a wonderfully distinct community of learners.

Page 6
Trends and Issues: Choice and Future Planning Choice Alberta’s education system is applauded choice, competition, and innovation in the public learning system. The proliferation of programs of choice affirms parents’ keen interest in opportunities for their children. Public charter schools offer unique, successful programs which enhance the broader learning system. Educating the public to the significant contributions of charter schools is a challenge when charter schools are often misunderstood and misrepresented in public discourse. Expanding Opportunity The opportunity to offer more girls an all-girls, all-for-girls learning environment depends on acquiring space to accommodate increased enrolment and additional grades. Both campuses are at capacity. Consolidating grades 4-9 and opening a second grades 4-9 campus in another quadrant of the city would better serve students by reducing their transportation time and distance. Access to CGS CGS serves girls from all quadrants of the city and all socio-economic circumstances. About 30% of the students are English Language Learners which is a reflection of increased immigration. CGS wants to provide opportunities for all interested girls, especially those from under represented population groups such as First Nations, to experience learning in an all-girls’ learning environment.
Spaces, Places and Tools that Engage Learners The Ministerial Order on Student Learning speaks to the importance of engaging students in collaborative inquiry. This requires both physical (e.g., Learning Commons and Maker-Spaces) and electronic spaces (e.g., devices, internet). Challenges include, maintaining servers, managing hardware and software for more than 600 simultaneous users, and ensuring secure online environments. The ever-changing world of technology insinuates the importance of reviewing our technology strategy to ensure decisions reflect defined learning outcomes for students while achieving affordable and sustainable services.

Page 7
Summary of Accomplishments Partnerships • Plant Operations and Maintenance (PO&M) services increased through a cost-effective sharing agreement with another charter school. Similarly, Technology Services partnered with another charter school to reduce costs for a shared firewall. • Connections with area universities supported Faculty of Education practicum students and the Partner Research Schools Agreement. • CGS organized and hosted seminars on Board governance topics for directors of Charter Schools within the Calgary area. These opportunities for shared learning were well received by participants. Stakeholder Engagement • CGS hosted parent Speak Out event with external facilitation. Results indicated high levels of parental satisfaction with the opportunity to
meaningfully engage with other parents, directors and staff. • The School Council whose membership includes all parents of enrolled students
continues to organize many events in support of enhanced programming such as the Speaker Series (successful women in both traditional and non-traditional careers share their insights in the noon-hour series).
Fee Review and Reduction • The Board reviewed fees for transportation, resources/materials, and technology with
the overall goals of reducing, ensuring transparency in subsidy requests, and maintaining enhanced opportunities such as field studies and off-campus learning. A one-time enrichment fee (excluding camps and band trips), based on a multi-year average was added to replace the many requests made throughout the year.
Technology
• CGS completed its migration from a lease program to school-owned technology. The benefits of depreciation will provide student ownership without buy-out costs for parents. The savings over time are significant.
• The board approved replacement of the antiquated phone system at both campuses which reduced operating costs while also improving security.
Inclusive Environment and Learning for All
• CGS wants to serve all girls who desire an all-girls learning environment including those with special learning needs. Whenever it is possible to provide appropriate learning supports, the school is pleased to welcome learners with special needs.

Page 8
• Governance policy and administrative procedure revisions reaffirmed the school’s commitment to a safe, caring, welcoming environment for all members of the school community.
Innovation and Research Informed Practice Professional development focused on:
• Social-emotional development of girls with emphasis on reducing anxiety, increasing self-regulation and mindfulness
• Academic competence and achievement especially in literacy (e.g., comprehension, academic language, reading strategies for content areas) and numeracy
• STEM teacher-training programs from Spark • Development of Maker Spaces at both campuses • Installation of the Lego Wall and Big Blocks • UC Research Partnership investigation (Grade 7): “Integrating coding into the K-12
curriculum using gender responsive pedagogy and a design-for-use approach can attract and sustain girls’ interest in STEM related studies.”
Environmental Stewardship The schools implemented or enhanced student awareness and action through:
• Expansion of the Outdoor Education elective • Eco Club and gardening • Inquiry based on questions related to our environmental footprint

Page 9
Key Priorities Staff Strategic Planning Fall 2017
The staff engaged in a multi-stage strategic planning process represented by the model shown. Various forms of stakeholder engagement including the Accountability Results (May 2017) and the Provincial Achievement Test Results (October 2017) informed the process. Michael Fullan (2015) in his book Coherence speaks to the importance of focus and alignment and what he calls “simplexity” in sustaining continuous improvement. The overall purpose is not to innovate the most, but to innovate selectively. It is too easy to seek external innovations and take on too many projects. The complexity inherently generates overload
and fragmentation. By contrast, it is important to focus on student learning as the central focus while keeping an eye out for external ideas that further the thinking and the vision of the school. The areas for improved outcomes that staff identified include:
• Communication with parents is responsive and collaborative. (Reviewing the technology strategy as well as approaches to assessment and reporting of student achievement are part of meeting this desired outcome).
• Numeracy results exceed provincial average for all students and all girls. • The Go Girls Curriculum develops socially and emotionally capable and confident young
women. The priority areas for improved outcomes align with the Charter Goals:
1. Academic Achievement 2. Social Development 3. Teamwork and Collaboration 4. Pursuit of Excellence
The priorities also align with the goals for Alberta’s Learning System:
1. Students are successful 2. Systemic achievement gap (FNMI) eliminated 3. Education system is inclusive 4. Excellent teachers, and school and school authority leaders 5. Education system is well governed and managed

Page 10
Combined 2017 Accountability Pillar Overall Summary (Required for Public/Separate/Francophone/Charter School Authorities and Level 2 Private Schools)
Measure Category Measure Calgary Girls' School Society Alberta Measure Evaluation
Current Result Prev Year
Result Prev 3 Year Average Current
Result Prev Year Result Prev 3 Year
Average Achievement Improvement Overall Safe and Caring Schools Safe and Caring 93.3 95.1 93.9 89.5 89.5 89.3 Very High Maintained Excellent
Student Learning Opportunities Program of Studies 91.9 92.5 91.4 81.9 81.9 81.5 Very High Maintained Excellent Education Quality 92.4 92.6 91.7 90.1 90.1 89.6 Very High Maintained Excellent Drop Out Rate 0.0 2.2 0.8 3.0 3.2 3.3 Very High Maintained Excellent
Student Learning Achievement (Grades K-9)
PAT: Acceptable 92.1 85.1 90.1 73.4 73.6 73.2 Very High Maintained Excellent PAT: Excellence 32.3 26.9 30.0 19.5 19.4 18.8 Very High Maintained Excellent Work Preparation 89.6 94.8 89.9 82.7 82.6 81.9 Very High Maintained Excellent Citizenship 90.6 94.0 92.4 83.7 83.9 83.6 Very High Declined Good
Parental Involvement Parental Involvement 84.7 88.2 84.6 81.2 80.9 80.7 Very High Maintained Excellent Continuous Improvement School Improvement 82.2 88.8 85.0 81.4 81.2 80.2 Very High Declined Good Notes: 1. Data values have been suppressed where the number of respondents/students is fewer than 6. Suppression is marked with an asterisk (*). 2. Overall evaluations can only be calculated if both improvement and achievement evaluations are available. 3. Results for the ACOL measures are available in the detailed report: see "ACOL Measures" in the Table of Contents. 4. Survey results for the province and school authorities were impacted by the changes in the number of students responding to the survey through the introduction of the OurSCHOOL/TTFM (Tell Them From
Me) survey in 2014. 5. Aggregated PAT results are based upon a weighted average of percent meeting standards (Acceptable, Excellence). The weights are the number of students enrolled in each course. Courses included:
English Language Arts (Grades 6, 9, 9 KAE); Français (Grades 6, 9); French Language Arts (Grades 6, 9); Mathematics (6, 9, 9 KAE); Science (Grades 6, 9, 9 KAE); and Social Studies (Grades 6, 9, 9 KAE).
6. Participation in Provincial Achievement Tests was impacted by the flooding in June 2013 (Grade 9 only) and by the fires in May to June 2016. Caution should be used when interpreting trends over time for the province and those school authorities affected by these events.
7. Aggregated Diploma results are a weighted average of percent meeting standards (Acceptable, Excellence) on Diploma Examinations. The weights are the number of students writing the Diploma Examination for each course. Courses included: English Language Arts 30-1; English Language Arts 30-2; French Language Arts 30-1; Français 30-1; Mathematics 30-1; Mathematics 30-2; Chemistry 30; Physics 30; Biology 30; Science 30; Social Studies 30-1; and Social Studies 30-2.
8. Caution should be used when interpreting evaluations and results over time for Mathematics 30-1/30-2, as equating was not in place until the 2016/17 school year. Alberta Education does not comment on province wide trends until it has five years of equated examination data.
9. Participation in Diploma Examinations was impacted by the flooding in June 2013 and by the fires in May to June 2016. Caution should be used when interpreting trends over time for the province and those school authorities affected by these events.
10. Weighting of school-awarded marks in diploma courses increased from 50% to 70% in the 2015/2016 school year. Caution should be used when interpreting trends over time. 11. Due to the change from previous data source systems to Provincial Approach to Student Information (PASI), Rutherford Scholarship Eligibility Rate results prior to 2015 are not available.

Page 11
Combined 2017 Accountability Pillar First Nations, Métis and Inuit Summary (Required for Public/Separate/Francophone School Authorities)
Measure Category Measure Calgary Girls' School Society (FNMI) Alberta (FNMI) Measure Evaluation Current Result Prev Year
Result Prev 3 Year Average Current
Result Prev Year Result Prev 3 Year
Average Achievement Improvement Overall Safe and Caring Schools Safe and Caring n/a n/a n/a n/a n/a n/a n/a n/a n/a
Student Learning Opportunities Program of Studies n/a n/a n/a n/a n/a n/a n/a n/a n/a Education Quality n/a n/a n/a n/a n/a n/a n/a n/a n/a Drop Out Rate * n/a n/a 5.8 6.1 6.7 * * * High School Completion Rate (3 yr) n/a n/a n/a 53.6 50.2 47.8 n/a n/a n/a
Student Learning Achievement (Grades K-9)
PAT: Acceptable * * n/a 51.7 52.4 52.1 * * * PAT: Excellence * * n/a 6.7 6.3 6.3 * * *
Student Learning Achievement (Grades 10-12)
Diploma: Acceptable n/a n/a n/a 77.1 76.1 76.3 n/a n/a n/a Diploma: Excellence n/a n/a n/a 10.7 10.2 10.2 n/a n/a n/a Diploma Exam Participation Rate (4+ Exams) n/a n/a n/a 21.8 20.7 20.3 n/a n/a n/a Rutherford Scholarship Eligibility Rate n/a n/a n/a 34.2 31.9 31.9 n/a n/a n/a
Preparation for Lifelong Learning, World of Work, Citizenship
Transition Rate (6 yr) n/a n/a n/a 31.8 33.5 33.3 n/a n/a n/a Work Preparation n/a n/a n/a n/a n/a n/a n/a n/a n/a Citizenship n/a n/a n/a n/a n/a n/a n/a n/a n/a
Parental Involvement Parental Involvement n/a n/a n/a n/a n/a n/a n/a n/a n/a Continuous Improvement School Improvement n/a n/a n/a n/a n/a n/a n/a n/a n/a Notes: 1. Data values have been suppressed where the number of respondents/students is fewer than 6. Suppression is marked with an asterisk (*). 2. Overall evaluations can only be calculated if both improvement and achievement evaluations are available. 3. Aggregated PAT results are based upon a weighted average of percent meeting standards (Acceptable, Excellence). The weights are the number of students enrolled in each course. Courses included:
English Language Arts (Grades 6, 9, 9 KAE); Français (Grades 6, 9); French Language Arts (Grades 6, 9); Mathematics (6, 9, 9 KAE); Science (Grades 6, 9, 9 KAE); and Social Studies (Grades 6, 9, 9 KAE).
4. Participation in Provincial Achievement Tests was impacted by the flooding in June 2013 (Grade 9 only) and by the fires in May to June 2016. Caution should be used when interpreting trends over time for the province and those school authorities affected by these events.
5. Aggregated Diploma results are a weighted average of percent meeting standards (Acceptable, Excellence) on Diploma Examinations. The weights are the number of students writing the Diploma Examination for each course. Courses included: English Language Arts 30-1; English Language Arts 30-2; French Language Arts 30-1; Français 30-1; Mathematics 30-1; Mathematics 30-2; Chemistry 30; Physics 30; Biology 30; Science 30; Social Studies 30-1; and Social Studies 30-2.
6. Caution should be used when interpreting evaluations and results over time for Mathematics 30-1/30-2, as equating was not in place until the 2016/17 school year. Alberta Education does not comment on province wide trends until it has five years of equated examination data.
7. Participation in Diploma Examinations was impacted by the flooding in June 2013 and by the fires in May to June 2016. Caution should be used when interpreting trends over time for the province and those school authorities affected by these events.
8. Weighting of school-awarded marks in diploma courses increased from 50% to 70% in the 2015/2016 school year. Caution should be used when interpreting trends over time. 9. Due to the change from previous data source systems to Provincial Approach to Student Information (PASI), Rutherford Scholarship Eligibility Rate results prior to 2015 are not available. 10. Student demographic data used when calculating Student Outcome Measures and Provincial Achievement Tests results was updated in October 2016. This impacted results based on enrolment (e.g.,
self-identified First Nations, Metis and Inuit), exception (e.g., learning disability) and grant program codes (e.g., English as Second Language students) reported in previous years.

Authority: 0152 Calgary Girls' School Society
Page 12
Measure Evaluation Reference (Optional) Achievement Evaluation Achievement evaluation is based upon a comparison of Current Year data to a set of standards which remain consistent over time. The Standards are calculated by taking the 3 year average of baseline data for each measure across all school jurisdictions and calculating the 5th, 25th, 75th and 95th percentiles. Once calculated, these standards remain in place from year to year to allow for consistent planning and evaluation. The table below shows the range of values defining the 5 achievement evaluation levels for each measure. Measure Very Low Low Intermediate High Very High Safe and Caring 0.00 - 77.62 77.62 - 81.05 81.05 - 84.50 84.50 - 88.03 88.03 - 100.00 Program of Studies 0.00 - 66.31 66.31 - 72.65 72.65 - 78.43 78.43 - 81.59 81.59 - 100.00 Education Quality 0.00 - 80.94 80.94 - 84.23 84.23 - 87.23 87.23 - 89.60 89.60 - 100.00 Drop Out Rate 100.00 - 9.40 9.40 - 6.90 6.90 - 4.27 4.27 - 2.79 2.79 - 0.00 High School Completion Rate (3 yr) 0.00 - 57.03 57.03 - 62.36 62.36 - 73.88 73.88 - 81.79 81.79 - 100.00 PAT: Acceptable 0.00 - 66.07 66.07 - 70.32 70.32 - 79.81 79.81 - 84.64 84.64 - 100.00 PAT: Excellence 0.00 - 9.97 9.97 - 13.44 13.44 - 19.56 19.56 - 25.83 25.83 - 100.00 Diploma: Acceptable 0.00 - 71.45 71.45 - 78.34 78.34 - 84.76 84.76 - 87.95 87.95 - 100.00 Diploma: Excellence 0.00 - 9.55 9.55 - 12.59 12.59 - 19.38 19.38 - 23.20 23.20 - 100.00 Diploma Exam Participation Rate (4+ Exams) 0.00 - 31.10 31.10 - 44.11 44.11 - 55.78 55.78 - 65.99 65.99 - 100.00 Transition Rate (6 yr) 0.00 - 39.80 39.80 - 46.94 46.94 - 56.15 56.15 - 68.34 68.34 - 100.00 Work Preparation 0.00 - 66.92 66.92 - 72.78 72.78 - 77.78 77.78 - 86.13 86.13 - 100.00 Citizenship 0.00 - 66.30 66.30 - 71.63 71.63 - 77.50 77.50 - 81.08 81.08 - 100.00 Parental Involvement 0.00 - 70.76 70.76 - 74.58 74.58 - 78.50 78.50 - 82.30 82.30 - 100.00 School Improvement 0.00 - 65.25 65.25 - 70.85 70.85 - 76.28 76.28 - 80.41 80.41 - 100.00 Notes: 12. For all measures except Drop Out Rate: The range of values at each evaluation level is interpreted as greater than or equal to the
lower value, and less than the higher value. For the Very High evaluation level, values range from greater than or equal to the lower value to 100%.
13. Drop Out Rate measure: As "Drop Out Rate" is inverse to most measures (i.e. lower values are "better"), the range of values at each evaluation level is interpreted as greater than the lower value and less than or equal to the higher value. For the Very High evaluation level, values range from 0% to less than or equal to the higher value.
Improvement Table For each jurisdiction, improvement evaluation consists of comparing the Current Year result for each measure with the previous three-year average. A chi-square statistical test is used to determine the significance of the improvement. This test takes into account the size of the jurisdiction in the calculation to make improvement evaluation fair across jurisdictions of different sizes. The table below shows the definition of the 5 improvement evaluation levels based upon the chi-square result. Evaluation Category Chi-Square Range Declined Significantly 3.84 + (current < previous 3-year average) Declined 1.00 - 3.83 (current < previous 3-year average) Maintained less than 1.00 Improved 1.00 - 3.83 (current > previous 3-year average) Improved Significantly 3.84 + (current > previous 3-year average) Overall Evaluation Table The overall evaluation combines the Achievement Evaluation and the Improvement Evaluation. The table below illustrates how the Achievement and Improvement evaluations are combined to get the overall evaluation. Achievement Improvement Very High High Intermediate Low Very Low Improved Significantly Excellent Good Good Good Acceptable Improved Excellent Good Good Acceptable Issue Maintained Excellent Good Acceptable Issue Concern Declined Good Acceptable Issue Issue Concern Declined Significantly Acceptable Issue Issue Concern Concern Category Evaluation The category evaluation is an average of the Overall Evaluation of the measures that make up the category. For the purpose of the calculation, consider an Overall Evaluation of Excellent to be 2, Good to be 1, Acceptable to be 0, Issue to be -1, and Concern to be -2. The simple average (mean) of these values rounded to the nearest integer produces the Category Evaluation value. This is converted back to a colour using the same scale above (e.g. 2=Excellent, 1=Good, 0=Intermediate, -1=Issue, -2=Concern)

Authority: 0152 Calgary Girls' School Society
Page 13
Charter Goals Charter Goal One: Girls’ academic achievement is enhanced in an all-girls learning environment. Outcome: Girls succeed in all curricular areas. Locally Determined Performance Measure: The percentage of enrolled students in Grades 6 and 9 who achieve Acceptable Standard or Standard of Excellence on the Provincial Achievement Tests exceeds the provincial averages.
CGS Results (in percentages)
Provincial Results (in percentages)
2013 2014 2015 2016 2017 2013 2014 2015 2016 2017
Acceptable Standard % 91.4 91.7 93.3 85.1 92.1 74.2 73.1 72.9 73.6 73.4 Standard of Excellence % 28.1 29.3 33.8 26.9 32.3 18.7 18.4 18.8 19.4 19.5 Comment on Results The overall results exceed provincial averages in meeting Acceptable Standard and Standard of Excellence. The school is pleased to note that results for Grade 6 mathematics which declined in 2016 improved this past year. Strategies
• Develop and sustain capacity for all teachers to be teachers of literacy and numeracy (e.g., to provide explicit instruction in developing technical vocabulary and strategies for interpreting technical and nonfiction text with high cognitive demand) and strategies for developing mathematical reasoning.
• Encourage girls to foster a growth mindset (e.g. iterative problem-solving, learning from failure, taking risks in their learning). • Engage girls in their learning through inquiry-based pedagogy. Strengthen achievement by mapping the Program of Studies
outcomes for interdisciplinary inquiry. • Review the Go Girls curriculum to ensure our learning environment supports adolescent girls as they struggle with pressures to be
“everything and nothing all at once” (as noted by Mary Pipher in Reviving Ophelia: Saving the Selves of Adolescent Girls). Charter Goal Two: Girls’ social development and awareness are enhanced in an all-
girls learning environment. Outcomes: Girls develop the skills and confidence to articulate their ideas in support of their learning. Girls develop competence, confidence, and connection through active participation in the life of the school. Locally Determined Performance Measures:
CGS Results (in percentages)
Provincial Results (in percentages
2013 2014 2015 2016 2017 2013 2014 2015 2016 2017 The percentage of students who agree they are safe at school, learning the importance of caring for and respecting others, and are treated fairly at school exceeds provincial averages.
83.9 87.6 88.3 89.4 86.2 84.2 83.1 83.0 83.4 83.3
The percentage of students who are satisfied that students model the characteristics of active citizenship (participate in and contribute to the life of the school including extra-curricular opportunities) exceed provincial averages.
79.7 85.8 86.9 88.5 83.5 76.2 74.5 74.2 74.5 74.4
Comment on Results The positive gap is growing over the last three years suggesting that students at CGS increasingly feel very positively about their own development with respect to social awareness, competence and confidence. Strategies
• Foster broad-based student participation in a wide variety of extra-curricular activities including sports, clubs, leadership (e.g., organizing and hosting school-wide assemblies), fine and performing arts (e.g. choir, drama productions). Most of these activities are multi-age to encourage connections and friendships with all other students.
• Review Go Girls Curriculum to ensure mindful and deliberate development of confidence and connection in social relationships. • Attend to peer conflict and isolation by improving the transition from Grade 5 (Bel Aire) to Grade 6 (Lakeview) as well as
the integration of new enrolment through deliberate connection-building among students and grades. • Include Grade 6 in the school’s options cycle.

Authority: 0152 Calgary Girls' School Society
Page 14
Charter Goal Three: The school community is supported through teamwork and collaboration.
Outcome: All members of the school community respect one another’s roles and are engaged and contribute to continuous improvement of student learning. Locally Determined Performance Measures:
CGS Results (in percentages)
Provincial Results (in percentages
2013 2014 2015 2016 2017 2013 2014 2015 2016 2017 The percentage of teachers, parents and students indicating that the school has improved over the last three years exceeds provincial average.
68.2 80.9 85.2 88.8 82.2 80.6 79.8 79.6 81.2 81.4
The percentage of parents satisfied with parental involvement in decisions about their child’s education exceeds provincial average.
58.2 69.5 66.4 76.4 73.2 72.2 73.1 73.4 73.5 73.9
Comment on Results The results show both continuous improvement for school improvement and exceed provincial average in all but one year over the past five. Parental satisfaction has increased in the past four years and now exceeds provincial average. Changes in assessment practice and reporting to parents contributed to the significant drop. Strategies
• Provide opportunities for authentic engagement with stakeholders through such events as Speak Out. • Develop School Council’s advisory role (e.g. regularly include agenda topics that seek parental input on school operations). • Support transparency by communicating more frequently (e.g., email/letters, newsletter cycle). • Attend to the communication strategies prior to change implementation. • Review the processes for communicating student learning (achievement and social/emotional development) to parents.
Reporting process need to satisfy parental expectations to be well informed about their daughter’s achievement on the Program of Studies and her growth/ development as a learner. This strategy supports the strategic priority “improve communication and engagement with parents.” (As identified by the staff through Strategic Planning 2017)
Charter Goal Four: Staff is supported in pursuing excellence. Outcome: Each staff member is supported in achieving professional or performance improvement goals. Locally Determined Performance Measures:
CGS Results (in percentages)
Provincial Results (in percentages
2013 2014 2015 2016 2017 2013 2014 2015 2016 2017 The percentage of teachers reporting professional development is focused, systematic and contributed significantly to their ongoing professional growth exceeds provincial averages.
90.4 86.3 93.1 98.2 93.7 82.2 81.0 82.4 83.9
84.3
• The Standards Assessment Inventory (SAI) developed by Learning Forward, formerly known as the National Staff Development Council (NSDC) measures the quality of a school system’s professional development. Aligning with the Standards leads to high quality professional development. The SAI provides a valid and reliable way to gain an overall picture that assists in focusing attention on the ways to improve the quality of professional development. Administer the SAI once every three years and compare to the baseline for monitoring purposes.

Authority: 0152 Calgary Girls' School Society
Page 15

Authority: 0152 Calgary Girls' School Society
Page 16
Outcome One: Alberta’s students are successful
Performance Measure Results (in percentages) Target Evaluation Targets 2013 2014 2015 2016 2017 2017 Achievement Improvement Overall 2018 2019 2020
Overall percentage of students in Grades 6 and 9 who achieved the acceptable standard on Provincial Achievement Tests (overall cohort results).
91.4 91.7 93.3 85.1 92.1 90
Very High Maintained Excellent 90 90 90
Overall percentage of students in Grades 6 and 9 who achieved the standard of excellence on Provincial Achievement Tests (overall cohort results).
28.1 29.3 33.8 26.9 32.3 33
Very High Maintained Excellent 33 33 33
Comment on Results The results remain very high overall. The Standard of Excellence in Grade 6 (LA) declined slightly whereas the results overall for mathematics improved. The targets reflect a maintenance focus as achievement is excellent. Strategies
1. Enhance peer coaching of teachers to support reflective practice in mathematics and language learning 2. Annually monitor student growth in numeracy and provide additional, targeted support/intervention to support at least a year’s
growth in achievement in each school year. (Using standardized assessment tool monitor Grade 8 (2017-18) for comparison to PAT results (June 2016) results.
3. Build shared understanding among teachers, learners and parents of strategies that develop mathematical competency in five areas (NCTM):
1. Conceptual understanding: comprehension of mathematical concepts, operations and relations 2. Procedural fluency: skill in carrying out procedures flexibly, accurately, efficiently, and appropriately 3. Strategic competence: ability to formulate, represent, and solve mathematical problems 4. Adaptive reasoning: capacity for logical thought, reflection, explanation, and justification 5. Productive disposition: habitual inclination to see mathematics as sensible, useful, and worthwhile, coupled with
a belief in diligence and one's own efficacy.
4. Provide professional development to support all teachers in developing both instructional and academic content vocabulary (e.g., high frequency general instruction words e.g., paraphrase; key words for test prompts e.g., analyze, persuade; summary frames; translating academic to social language; word etymology and other “word work” e.g., transitions; syntax (sentence patterns), technical vocabulary; strategies for interpreting text with high cognitive demand)
5. Enhance long range planning of cross curricular inquiry to ensure curriculum connections and desired conceptual understanding of transferable, “big ideas” that underpin the entire program of studies are explicitly mapped.
6. Consider book shares e.g., Understanding by Design (Wiggins G. & McTighe J., and/or Concept-Based Curriculum and Instruction for the Thinking Classroom (Erickson H. Lynn) as tools for reflection on instructional design.
Notes: 1. Overall evaluations can only be calculated if both improvement and achievement evaluations are available. 2. Aggregated PAT results are based upon a weighted average of percent meeting standards (Acceptable, Excellence). The weights are the
number of students enrolled in each course. Courses included: English Language Arts (Grades 6, 9, 9 KAE); Français (Grades 6, 9); French Language Arts (Grades 6, 9); Mathematics (6, 9, 9 KAE); Science (Grades 6, 9, 9 KAE); and Social Studies (Grades 6, 9, 9 KAE).
3. Participation in Provincial Achievement Tests was impacted by the flooding in June 2013 (Grade 9 only) and by the fires in May to June 2016. Caution should be used when interpreting trends over time for the province and those school authorities affected by these events.

Authority: 0152 Calgary Girls' School Society
Page 17
Outcome One: Alberta’s students are successful (continued)
Performance Measure Results (in percentages) Target Evaluation Targets 2012 2013 2014 2015 2016 2017 Achievement Improvement Overall 2018 2019 2020
Drop Out Rate - annual dropout rate of students aged 14 to 18 0.4 0.0 0.2 2.2 0.0 0.0 Very High Maintained Excellent 0.0 0.0 0.0
Comment on Results CGS is a Grades 4-9 school and thus data for Diploma Exam Results and several measures are not applicable to the school. The vast majority of students who complete Grade 9 at the school transition successfully to a high school program of choice within Alberta. Strategies
• Foster alumni connections through the annual “Chips and Chat” event that sees large numbers of former students returning to reconnect with previous teachers and other students. (The event this fall included current students along with alumni students and this practice will continue).
• Continue the Speaker Series which features role models of successful women in both traditional and nontraditional career paths. The speakers encourage girls to stay in school and to explore the many roads that will lead to success through persistence.
• Build leadership opportunities, formal and informal, through course work and extra-curricular events that abound at CGS – if it needs to be done, be sure a girl is provided the opportunity and support to do it!
• Provide one-to-one guidance (administration, grade team teachers, learning strategist) to support girls in transitioning to high school.
• Invite area high schools to make presentations to the girls so they are aware of the opportunities available to them. • Administer an annual Early Exit Survey (CGS survey) in late spring to gather data about satisfiers or dis-satisfiers that inform
decisions to withdraw prior to the end of Grade 9. Monitor the trend lines and respond to concerns.
Outcome One: Alberta’s students are successful (continued)
Performance Measure Results (in percentages) Target Evaluation Targets 2013 2014 2015 2016 2017 2017 Achievement Improvement Overall 2018 2019 2020
Percentage of teachers, parents and students who are satisfied that students model the characteristics of active citizenship.
89.3 90.8 92.5 94.0 90.6 90
Very High Declined Good 91 92 93
Percentage of teachers and parents who agree that students are taught attitudes and behaviours that will make them successful at work when they finish school.
88.2 87.8 86.9 94.8 89.6
90
Very High Maintained Excellent 90 91 92
Comment on Results (OPTIONAL) Both measures exceeded the targets set the previous year. Strategies
• All teachers incorporate digital citizenship in all curricular areas. Technology use for learning and instruction models the highest standards of digital citizenship.
• Develop the intended learning outcomes by grade re: Skills, Attitudes (digital citizenship) in using technology for learning. (Refer to Alberta Education’s Technology Framework and resources such as Reuben Puentedura’s SAMR Model to ensure the scope and sequence of outcomes focuses on learning strategies that could not happen without technology).
• Review the Go Girls Curriculum to define outcomes for developing digital citizenship, as well as broader citizenship through community service and social justice projects. Go Girls, a locally developed curriculum expires June 2018 and must be ready for Board review and approval prior to May 2018.
• Develop self-assessment tools and/or select structured tools such as inventories that will support student reflection on social/emotional growth (e.g., consider Habits of Mind as a framework for developing a self-assessment tool).
• Provide parents with a variety of opportunities to develop their understanding of the ways in which CGS promotes citizenship and teaches behaviors at school which support transition to post-secondary and the world of work. Provide opportunities for School Council to advise on strategies to address this performance measure.
Notes: 1. Survey results for the province and school authorities were impacted by the changes in the number of students responding to the survey through
the introduction of the OurSCHOOL/TTFM (Tell Them From Me) survey in 2014.

Authority: 0152 Calgary Girls' School Society
Page 18
Outcome One: Alberta’s students are successful (continued)
Performance Measure Results (in percentages) Target Evaluation Targets 2013 2014 2015 2016 2017 2017 Achievement Improvement Overall 2018 2019 2020
Percentage of teacher and parent satisfaction that students demonstrate the knowledge, skills and attitudes necessary for lifelong learning. (This measure is required for charter and private school authorities with only K-9 schools)
69.3 72.9 73.3 77.0 75.9
76
n/a n/a n/a 77 77 77
Comment on Results The results exceed the improvement target. The upward trend over the past 3-5 years suggests that students are developing a growth mindset. Lifelong learning depends on having a growth mindset so that failures or iterative attempts represent opportunities for further learning rather than a reason to give up or feel a sense of failure. Learning to persist in the face of set back or as yet unattained goals develops resiliency for lifelong learning. Strategies
• Engage all students in a variety of extra-curricular opportunities. • Encourage student-initiated extra-curricular clubs (e.g., peer tutoring, Speech and Debate). • Engage students in school-community service projects and community outreach (e.g., Eco club, plant wall.
maintenance, recycling, leadership, self-checkout and shelving in the Learning Commons). • Further develop the Maker Space to enhance collaborative opportunities for creating. • Review Go Girls Curriculum to ensure students develop skills in peace-making and conflict resolution. • Encourage teachers and parents to learn more about self-regulation (why it matters and how to help girls achieve it)
and anxiety reduction. Consider strategies like book shares, book conversations, and seminars. • For further information see:
o Self-Reg: How to Help Your Child (and You) Break the Stress Cycle and Successfully Engage with Life, Stuart Shanker (2016)
o Calm, Alert and Learning: Classroom Strategies for Self-Regulation, Stuart Shanker (2012) • Develop a communications strategy to provide parents and students with knowledge of the ways in which CGS
supports the growth of knowledge and skills and attitudes necessary for life-long learning. Provide opportunity for School Council to advise on this matter.
Notes: 1. Survey results for the province and school authorities were impacted by the changes in the number of students responding to the survey through
the introduction of the OurSCHOOL/TTFM (Tell Them From Me) survey in 2014.

Authority: 0152 Calgary Girls' School Society
Page 19
Outcome Two: The systemic education achievement gap between First Nations, Métis and Inuit students and all other students is eliminated
(Results and evaluations for First Nations, Métis and Inuit measures are required for Public/Separate/Francophone School Authorities only)
Performance Measure Results (in percentages) Target Evaluation Targets 2013 2014 2015 2016 2017 2017 Achievement Improvement Overall 2018 2019 2020
Overall percentage of self-identified FNMI students in Grades 6 and 9 who achieved the acceptable standard on Provincial Achievement Tests (overall cohort results).
n/a * * * *
* * *
Overall percentage of self-identified FNMI students in Grades 6 and 9 who achieved the standard of excellence on Provincial Achievement Tests (overall cohort results).
n/a * * * *
* * *
Overall percentage of self-identified FNMI students who achieved the acceptable standard on diploma examinations (overall results).
n/a n/a n/a n/a n/a
n/a n/a n/a
Overall percentage of self-identified FNMI students who achieved the standard of excellence on diploma examinations (overall results).
n/a n/a n/a n/a n/a
n/a n/a n/a
Comment on Results The number of identified FNMI students at CGS is fewer than six and therefore data is suppressed. Strategies
• Increase PD opportunities for staff to develop knowledge and skills required to support Truth and Reconciliation.
• Provide a variety of opportunities and resources for all students to develop understanding of the history of Treaties and collective rights legislation for Aboriginal populations. (e.g., Our Words, Our Ways: Teaching First Nations, Metis and Inuit Learners; Making Treaty Seven, various field study opportunities at the Glenbow Museum)
• Provide cross-curricular inquiry to develop understanding of contemporary issues that affect First Nations, Aboriginal and Inuit people
• Share the PISA findings with staff re: effective practices for improving achievement results for Indigenous learners.
• Infuse Aboriginal culture and contributions in subject disciplines (e.g., Fine Arts: include Aboriginal Art forms, PE: Aboriginal dance forms and games, SS: cultural disruption in the history of Aboriginal peoples and European settlers as well as key events in history such as the Indian Act (1876) and various restrictive amendments, legacy of residential schools, LA: Aboriginal literature and oral traditions, Aboriginal languages; Interdisciplinary Inquiry: Common issues faced by indigenous peoples around the world, cultural perspectives on various issues such as land stewardship). Recognize and celebrate National Aboriginal Day on June 21 (when it is a school day).
•
Notes: 1. Data values have been suppressed where the number of respondents/students is fewer than 6. Suppression is marked with an asterisk (*).

Authority: 0152 Calgary Girls' School Society
Page 20
Authority: 0152 Calgary Girls' School Society
Page 21
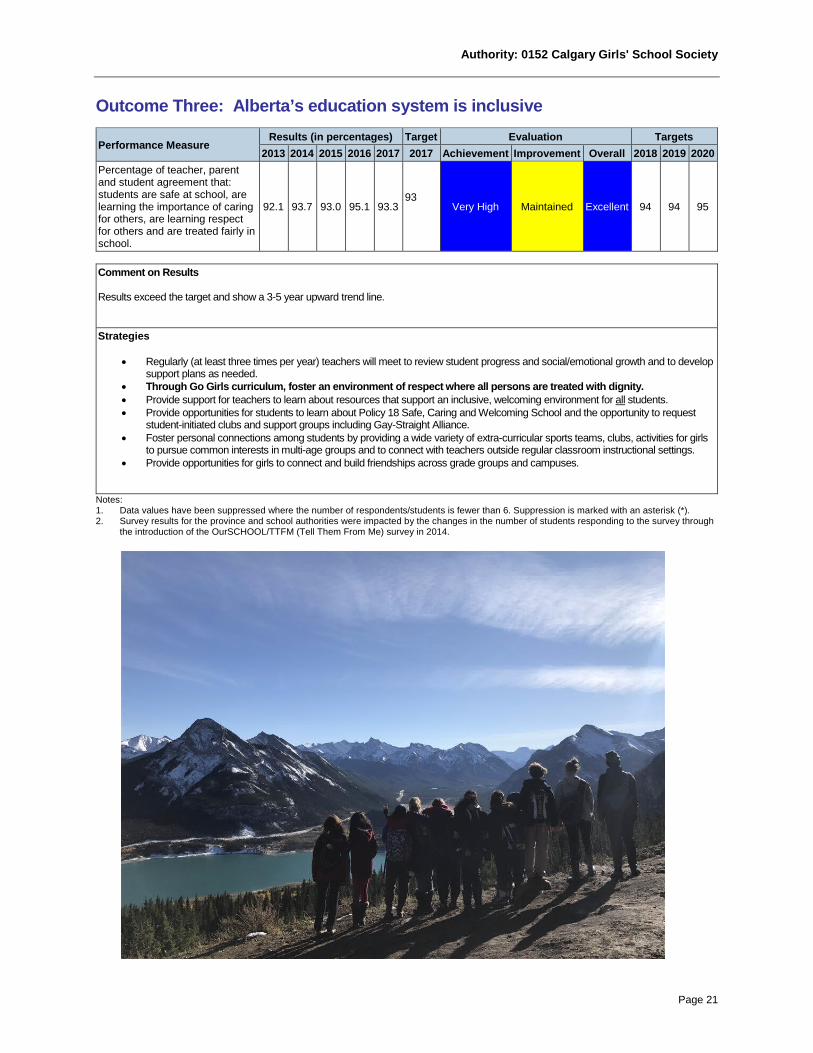
Outcome Three: Alberta’s education system is inclusive
Performance Measure Results (in percentages) Target Evaluation Targets 2013 2014 2015 2016 2017 2017 Achievement Improvement Overall 2018 2019 2020
Percentage of teacher, parent and student agreement that: students are safe at school, are learning the importance of caring for others, are learning respect for others and are treated fairly in school.
92.1 93.7 93.0 95.1 93.3
93
Very High Maintained Excellent 94 94 95
Comment on Results Results exceed the target and show a 3-5 year upward trend line. Strategies
• Regularly (at least three times per year) teachers will meet to review student progress and social/emotional growth and to develop support plans as needed.
• Through Go Girls curriculum, foster an environment of respect where all persons are treated with dignity. • Provide support for teachers to learn about resources that support an inclusive, welcoming environment for all students. • Provide opportunities for students to learn about Policy 18 Safe, Caring and Welcoming School and the opportunity to request
student-initiated clubs and support groups including Gay-Straight Alliance. • Foster personal connections among students by providing a wide variety of extra-curricular sports teams, clubs, activities for girls
to pursue common interests in multi-age groups and to connect with teachers outside regular classroom instructional settings. • Provide opportunities for girls to connect and build friendships across grade groups and campuses.
Notes: 1. Data values have been suppressed where the number of respondents/students is fewer than 6. Suppression is marked with an asterisk (*). 2. Survey results for the province and school authorities were impacted by the changes in the number of students responding to the survey through
the introduction of the OurSCHOOL/TTFM (Tell Them From Me) survey in 2014.

Authority: 0152 Calgary Girls' School Society
Page 22
Outcome Four: Alberta has excellent teachers, and school and school authority leaders
Performance Measure Results (in percentages) Target Evaluation Targets 2013 2014 2015 2016 2017 2017 Achievement Improvement Overall 2018 2019 2020
Percentage of teachers, parents and students satisfied with the opportunity for students to receive a broad program of studies including fine arts, career, technology, and health and physical education.
89.5 91.4 90.5 92.5 91.9
90
Very High Maintained Excellent 92 92 92
Comment on Results The results achieved exceed the target and remain very high and excellence overall. Strategies • Review the elections/options available with consideration to reducing the number of Locally Developed Courses which require
significant revision to meet curriculum development guidelines. Consider integrating the LDC’s into existing provincial curriculum by reviewing and aligning learning outcomes.
• Review and update the Go Girls Curriculum to specify grade level learning outcomes and performance measures. • Include Grade 6 students in the electives/options cycle so they are included in the full programming at Lakeview. Where possible,
consider multi-grade elective/options to foster connection among students from different grades. • Provide opportunities for students to learn in community settings (e.g., partnership with Shift Lab at the Calgary Science Centre, PE program
enhanced by using community facilities). • Develop a Handbook of Assessment and Reporting Practice to reflect and communicate “best practice” as well as to ensure
consistency (validity and reliability) across teachers. Such a handbook would support succession planning so that new staff have an informed opportunity to meet expectations for professional practice is this area.
Notes: 1. Data values have been suppressed where the number of respondents/students is fewer than 6. Suppression is marked with an asterisk (*). 2. Survey results for the province and school authorities were impacted by the changes in the number of students responding to the survey through
the introduction of the OurSCHOOL/TTFM (Tell Them From Me) survey in 2014.

Authority: 0152 Calgary Girls' School Society
Page 23
Outcome Five: Alberta’s education system is well governed and managed
Performance Measure Results (in percentages) Target Evaluation Targets 2013 2014 2015 2016 2017 2017 Achievement Improvement Overall 2018 2019 2020
Percentage of teachers, parents and students indicating that their school and schools in their jurisdiction have improved or stayed the same the last three years.
68.2 80.9 85.2 88.8 82.2
85 Very High Declined Good 85 85 85
Percentage of teachers and parents satisfied with parental involvement in decisions about their child's education.
69.9 83.5 82.0 88.2 84.7 91
Very High Maintained Excellent 85 85 85
Percentage of teachers, parents and students satisfied with the overall quality of basic education.
88.1 91.6 90.8 92.6 92.4 91
Very High Maintained Excellent 92 92 92
Comment on Results The continuous improvement target was set to reflect a maintenance goal as results are very high and continue to be excellent. The percentage of parents who are satisfied with their involvement continues to increase and recover was 2013. The target was ambitious and while it was not achieved, results “improved significantly.” Informing, consulting and responding to parental concerns is very important prior to implementing significant change. As well, starting small, improving, and then scaling increases parental trust. The results achieved in are very high and indicate a significant recovery from 2012-3013. Parental satisfaction with the overall quality of education is less of a concern (the trend is strongly positive) than the opportunity to participate in decision-making processes with respect to significant change. The call to transform the learning system implies some disruptive innovation as schools and Alberta’s education system strive not only to be best in the world, but to provide our students with the opportunities to develop the skills needed for their futures. As new technologies, personalized learning, and evidence-based practice continue to challenge pedagogy, CGS wants to be on the cutting edge – willing to take thoughtful risks to find the most effective ways to develop the engaged, ethical, entrepreneurial citizens envisioned by Inspiring Education. The school is grateful for supportive parents who are part of the journey as CGS grows its assessment and reporting processes that accurately reflect achievement in relationship to the intended outcomes in the Program of Studies and within the context of inquiry and girls learning. Parents are strongly encouraged to share their perspectives on assessment and reporting in the interests of building shared understanding and improving our school. Strategies
• Identify key documents that need to be translated for parents to support those whose first language is not English. • Provide regular, frequent and ongoing opportunities for parents to connect with their child’s teachers
o Parent teacher & student-led conferences at least two times per year & parent information evenings by grade teams o Consider “teacher voice” in the reporting conferences as Student –led conferences limit the opportunity, in the current
approach, for teachers and parents to build relationships by sharing their perspectives on learning and achievement. o Engage School Council in the advisory role as defined by Regulation. o Parent/teacher/student meetings as needed and requested by parents
• Review the processes and procedures for reporting learning and achievement to parents so that barriers are removed and parents express satisfaction that they are well informed about their child’s achievement on the Program of Studies as well as her social/emotional development.
• Develop communication plans associated with the implementation of change (e.g. disseminate research, Q & A’s, clarity on the definition of the problem to be solved, measures of progress towards desired goals, opportunities for course adjustment in response to feedback, implement on a small scale prior to scaling up)
• Host annual Speak Out for parents. • Review the Technology Strategy (consider developing a Technology Strategy Handbook) to ensure alignment with
Alberta Education’s Technology Policy Framework, defined learning outcomes and measures, as well as system hardware and software. Technology is every-changing and new developments provide opportunity to achieve cost-efficiencies to ensure a sustainable, affordable approach.
Notes: 1. Data values have been suppressed where the number of respondents/students is fewer than 6. Suppression is marked with an asterisk (*). 2. Survey results for the province and school authorities were impacted by the changes in the number of students responding to the survey through
the introduction of the OurSCHOOL/TTFM (Tell Them From Me) survey in 2014.
Authority: 0152 Calgary Girls' School Society
Page 24
Future Challenges for CGS
Transportation: Serving all girls who desire the opportunity depends on reasonable, cost-effective and safe solutions to transportation. Costs exceed the funding and fees are a barrier for some families. Despite efforts to achieve greater efficiency in the transportation services and the Board’s decision to reduce transportation fees, subsidy requests continue to rise from year to year. Grant funding has been stagnant for several years and is more restrictive for charter than other public schools. Transportation agreements with other school authorities may offer some solutions to the challenges.
Inclusive Education: CGS has a role to play in offering a girls-only, all-for-girls learning
environment to girls with special needs and those from under-served populations. Access to inclusive education funding and sensitivity to any perceived barriers are important in expanding girls-only learning to all interested girls in our community. The cap of 600 students means CGS is limited to offering only grades 4-9 and both campuses are operating at capacity. Access is limited by the opportunity to re-imagine the school’s grade configuration and location(s). Additionally, funding for special needs is more restrictive for charter compared to other public schools.
Advocacy for Choice in Public Education: It is important to address the myths and
misconceptions that undermine the best interests of girls who are well served by an all-girls public charter school.
Competition: Based on the success of charter schools in Calgary, other public boards have opened similar, alternative programs. The two campuses are both at capacity and in close proximity which means many girls are travelling considerably distances to attend CGS. Well located facilities, in more than one quadrant of Calgary would provide more girls with the option they most desire – all for girls learning. While imitation is a high form of flattery, increased competition impacts enrolment at CGS. Recent funding provided by Bill 1 removed transportation and other school fees for families whose children attend their designated (neighborhood) schools. Charter schools are thus forced to continue assessing fees that have been eliminated for other public schools.
Innovation, Research & Dissemination: CGS is responding to the mandate for innovative
programming, research-informed practice, and dissemination of effective practice to inform the broader education system. The challenges remain: to define the mandate, create a framework for success, and develop the essential partnerships. The challenges are also being addressed by the Association of Alberta Public Charter Schools (TAAPCS).
Authority: 0152 Calgary Girls' School Society
Page 25
Summary of Financial Results
The Audited Financial Statements, Budget 2017-2018, Fall Budget Update 2017-2018, and the Summary of the Facility and Capital Plan can be found on the CGS Website under Important Documents at the following link:
http://calgarygirlsschool.com/anout-cgs/important-documents/
A report on School Generated Funds is available in the Notes to the Audited Financial Statements (Note 11) at the link noted above. The provincial roll up of AFS for all school authorities can be found at the following link:
https://education.alberta.ca/financial-statements/combined-statements
For more detailed information, please contact Wendy Juergens, Secretary-Treasurer at the Business Office of the Calgary Girls’ School.
2016/2017 Revenues Government of Alberta Grant Funding
$5,757,016
Fees to Parents $858,955 Other Revenue $152,749 Total Revenue $6,768,720 Expenses (by Program Envelope) Instruction $5,233,976 Plant, Operations & Maintenance $785,518 Transportation $705,560 Board & System Administration $302,581 Total Expenses $7,027,635 Operating Surplus/(Deficit) -$258,915
Note: The 2016-2017 operating deficit includes expenses that are in addition to the 2016-17 approved Budget; however, the Board approved these additional expenditures on technology tools and infrastructure which include an advanced telephone/security system as well as extensive renovations at Bel Aire Campus. Total cost of these projects which were funded from the Accumulated Operating Surplus is approximately $140,000.

Authority: 0152 Calgary Girls' School Society
Page 26
Budget Summary
The Fall Budget 2017-2018 Update projects a deficit of $(1,451) resulting primarily from the difference between the spring projected enrolment (588) compared to the confirmed fall enrolment (568) of September 30. In response to the lower than budgeted enrolment, Certificated Staff was reduced by 0.6 FTE and non-certificated staff was reduced by 1.0 FTE. These reductions were achieved by attrition. PO&M funding is based on the prior’s year’s enrolment. Therefore, the 2017-2018 PO&M budget reflects funding based on the student enrolment of 588 that was confirmed September of 2016-17. Year over year, enrolment dropped in each of the past two years. Budget 2017-2018 was approved by the Board and submitted to Alberta Education in June 2017 based on a projected student count of 588. The Calgary Girls’ School continues to align with the principle of achieving a balanced budget, which can be seen in the Fall Budget Update which is summarized below.
2017/2018 Fall Budget Update
Revenues Government of Alberta $5,443,952 Fees to Parents $885,835 Other Revenue $48,697 Total Revenue $6,378,484 Expenses (by Program) Instruction $4,708,949 Plant, Operations & Maintenance $529,364 Transportation $688,004 Board & System Administration $356,598 External Services $97,020 Total Expenses $6,379,935 Operating Surplus/(Deficit) -$1,451

Authority: 0152 Calgary Girls' School Society
Page 27
Statement of Expenses 2016/2017 $ % Instruction 5,374,846 77 Plant Operations and Maintenance 505,379 7 Lease Expense 102,760 1 Transportation 687,367 10 System and Administration 318,529 5 Total 6,988,881 100
Instruction 77 %
PO&M 6 %
Lease Expense 1 %
Transportation 10 %
System and Administration
5 %
Expenses

Authority: 0152 Calgary Girls' School Society
Page 28
Statement of Revenue 2016/2017 $ % Alberta Education Instruction 4,499,694 66 Alberta education Lease Support 106,359 2 Alberta Education PO and M 680,647 10 Alberta Education Transportation 269,559 4 Alberta Education Board and System 200,757 3 Instructional and Technology Fees 497,698 7 Transportation Fees 361,257 5 Miscellaneous Income 152,749 2 Total 6,768,720 100
Alberta Education Instruction
67%
Alberta education Lease Support
2%
PO&M6%
AB Ed Transportation4%
Alberta Education Board and System
3%
IRF and Technology Fees
9%
Transportation Fees5%
Miscellaneous Income2%
Revenue

Authority: 0152 Calgary Girls' School Society
Page 29
Summary of Facility and Capital Plans In the Capital Plan 2018-2021, completed and submitted to Alberta Education and Alberta Infrastructure in April 2016, the Calgary Girls’ School repeated its request for major renovation of the Lakeview School and expansion to support consolidation at one site. The estimated cost was stated as $13.3 million in April 2015. To date the project has not been approved but details of the submission can be found on the CGS website as shown below:
http://calgarygirlsschool.com/wp-content/uploads/2013/11/Blims-April-2017.pdf
In addition, Calgary Girls’ School requested and was approved for two modular replacements. These were erected over the summer of 2017 and were fully operational for the beginning of the 2017-2018 School Year. The Board also approved an intensive renovation at the Bel-Aire Campus which included the replacement of the majority of the flooring and upgrades to the staff room. Calgary Girls’ School (CGS) continues to require support for the lease of the gymnasium, dance space and kitchen facilities at North Glenmore Community Association. North Glenmore Community Association has completed a number of upgrades that have made the space much more suitable for school program delivery.
Parental Involvement All parents of enrolled girls are members of the School Council which holds monthly meetings. School Council prepares an annual plan at its AGM in June and provides its annual report to the Board by the end of September. The Report includes a summary of key decisions, meeting minutes and financial records. School Council agendas, minutes and reports are located on the CGS website at the following link: http://calgarygirlsschool.com/updates/school-council/
• The Council is a vital part of the school community and provides many outstanding opportunities for the students. Every fall, Council hosts a back-to-school family BBQ to welcome new and returning families. The Council organizes used uniform sales, hot lunches, the Speaker Series, special events, and various fund-raising activities. The Council also organizes parent education seminars on topics such as nutrition and strengthening relationships.
• Parents are encouraged to participate in the learning community of CGS by volunteering, joining
their daughters for special events, attending assemblies, offering expertise in the classroom or for extra-curricular clubs and activities.
• The principal reports to the School Council on the Accountability Pillar Results and the Three-Year
Education Plan. Feedback from the Results Report informs the continuous improvement priorities. An annual parent Speak Out event provides a facilitated opportunity for consensus building on successes, challenges, and ideas for the way forward.
• The school’s website is updated regularly and frequently to include parents in school news. A
weekly email informs parents about school events. Using a personal login, parents have continuous opportunity to be informed about their daughter’s learning. Tweets, which are also posted to the website, provide snippets of information throughout the day.

Authority: 0152 Calgary Girls' School Society
Page 30
Timelines and Communication
The Calgary Girls’ School finalizes its Three-Year Education Plan after considering the Provincial Achievement Test and the Accountability Pillar Results provided in spring and fall respectively.
The Three Year Education plan is annually revised in a rolling forward approach. The staff, School
Council, and the Charter Board inform the broad strategic directions and provide input on the priorities related to the Charter Goals and desired provincial outcomes.
Staff considers results achieved, sets improvement targets and selects research-informed strategies that reflect current best practice. Calgary Girls’ School strives to realize the vision of Inspiring Education – fostering ethical, engaged, entrepreneurial citizens who are future-ready.
The Charter Board considers the Three-Year Education Plan and the Annual Education Results Report
(combined document) and approves submission to Alberta Education by November 30 as required. The Zone Director for Alberta Education is notified when the Three-Year Education Plan and Annual
Education Results Report is posted to the school’s website. The permalink is included in the email that is sent by November 30. http://calgarygirlsschool.com/wp-content/uploads/2017/11/Nov.-20-AERR-3YEP-2017.pdf

Authority: 0152 Calgary Girls' School Society
Page 31
Communication Plan: Effective Practice and Innovation Objectives:
o Advocacy with key decision-makers o Awareness-building of the role of public charter schools in the broader learning system o Accountability and Accessibility o Media relations
Audiences:
External: o Alberta Education o The Association of Alberta Public Charter Schools (TAAPCS) and other charter schools o Other public and private school authorities o Prospective parents/students o Teachers outside of CGS o Graduating university students (education/prospective employees) o Potential supporters and donors o Communities where CGS campuses are located o Members of the general public o Media
Internal: o Students o Parents & School Council o Staff and Administration o Board of Directors
Key Messages:
CGS: o is a tuition-free, public education alternative focused on high academic achievement and
enhanced social and emotional development of girls and young women. o engages girls through strategies that best support “girls’ learning” and develops their
confidence and sense of agency. o provides a safe, caring and welcoming environment for all students. o offers exemplary education for girls in an all-for-girls learning environment. o prepares girls for leadership, lifelong learning, employment and active citizenship. o helps girls to overcome gender stereotypes, develop to their greatest potential and live
inspired, meaningful lives. o seeks to serve all interested girls
Action Plan: o Building relationships with MLA’s and key decision-makers o Building positive relationships with education media o Attending and presenting at conferences (building understanding of best practice for
girls) o Partnering with post-secondary education programs o Reaching out to communities where CGS campuses are located o Reviewing CGS corporate branding to ensure logo use and overall brand image is
positive and appropriate in representing the organization o Gauging satisfaction of stakeholders through various surveys and other methods o Hosting special events such as employee appreciation o Participating fully in The Association of Alberta Public Charter Schools (TAAPCS) o Engaging technology and social media to enhance communication

Authority: 0152 Calgary Girls' School Society
Page 32
Whistleblower Protection
Calgary Girls’ School provides a caring, respectful environment in which staff are safe to disclose wrongdoing without fear of reprisal, consistent with the Public Interest Disclosure (Whistleblower Protection) Act and related Regulations of the Province of Alberta. CGS values courage, integrity and compassion among its enduring values and expects all staff to demonstrate high ethical standards in their work. In return, staff should expect a positive, trusting and accountable workplace. An Administrative Procedure titled Whistleblower Protection supports employees in making good faith reports of unlawful or improper conduct. During the 2016-17 school year, the Designated Officers received no disclosures of wrong-doing and therefore no investigations occurred.

Authority: 0152 Calgary Girls' School Society
Page 33
Class Size Report 2015/16 - 2017/18
The detailed report is available at the following link: http://calgarygirlsschool.com/wp-content/uploads/2017/11/Class_Size_17_18.pdf
4 to 6 7 to 9
2015/16 2016/17 2017/18 2015/16 2016/17 2017/18
Average Class Size 25.3 24.2 22.8 27.3 26.2 24.9 Smallest Class 21.0 21.0 21.0 9.0 13.0 8.0 Largest Class 31.0 26.0 25.0 30.0 32.0 29.0 Distribution of Class Sizes - % 4 to 6 7 to 9
2015/16 2016/17 2017/18 2015/16 2016/17 2017/18 1 to 5 6 to 10 7.8 0.9 6.6 11 to 15 6.8 6.3 8.3 16 to 20 9.7 6.3 11.6 21 to 25 75.9 71.0 100.0 4.9 33.0 26.4 26 to 30 18.1 29.0 68.9 46.4 46.3 31 to 35 6.0 1.9 7.1 0.8
Distribution of Class Sizes - # 4 to 6 7 to 9 2015/16 2016/17 2017/18 2015/16 2016/17 2017/18
1 to 5 6 to 10 8 1 8 11 to 15 7 7 10 16 to 20 10 7 14 21 to 25 88 76 103 5 37 32 26 to 30 21 31 71 52 56 31 to 35 7 2 8 1

Authority: 0152 Calgary Girls' School Society
Page 34
APPENDIX – Measure Details
The following pages include tables and graphs that provide detailed data for the performance measures.
Measure Evaluation Reference - Achievement Evaluation Achievement evaluation is based upon a comparison of Current Year data to a set of standards which remain consistent over time. The Standards are calculated by taking the 3 year average of baseline data for each measure across all school jurisdictions and calculating the 5th, 25th, 75th, and 95th percentiles. Once calculated, these standards remain in place from year to year to allow for consistent planning and evaluation. The table below shows the range of values defining the 5 achievement evaluation levels for each measure. Notes: 1. The range of values at each evaluation level is interpreted as greater than or equal to the lower value, and less than the higher value. For
the Very High evaluation level, values range from greater than or equal to the lower value to 100%. 2. Achievement Evaluation is not calculated for courses that do not have sufficient data available, either due to too few jurisdictions offering
the course or because of changes in examinations. Improvement Table For each jurisdiction, improvement evaluation consists of comparing the Current Year result for each measure with the previous three-year average. A chi-square statistical test is used to determine the significance of the improvement. This test takes into account the size of the jurisdiction in the calculation to make improvement evaluation fair across jurisdictions of different sizes. The table below shows the definition of the 5 improvement evaluation levels based upon the chi-square result.
Drop Out Rate – Measure Details
Drop Out Rate - annual dropout rate of students aged 14 to 18 Authority Province
2012 2013 2014 2015 2016 2012 2013 2014 2015 2016 Drop Out Rate 0.4 0.0 0.2 2.2 0.0 3.6 3.3 3.5 3.2 3.0 Returning Rate * * n/a * * 22.8 20.7 20.9 18.2 18.9
Graph of Authority Results (optional)
Graph of Authority Results (optional)
Notes: 1. Data values have been suppressed where the number of respondents/students is fewer than 6. Suppression is marked with an asterisk (*).

Authority: 0152 Calgary Girls' School Society
Page 35
Citizenship – Measure Details
Percentage of teachers, parents and students who are satisfied that students model the characteristics of active citizenship. Authority Province 2013 2014 2015 2016 2017 2013 2014 2015 2016 2017 Overall 89.3 90.8 92.5 94.0 90.6 83.4 83.4 83.5 83.9 83.7 Teacher 98.9 99.5 100.0 100.0 99.5 93.6 93.8 94.2 94.5 94.0 Parent 89.3 87.1 90.7 93.5 89.0 80.3 81.9 82.1 82.9 82.7 Student 79.7 85.8 86.9 88.5 83.5 76.2 74.5 74.2 74.5 74.4
Graph of Overall Authority Results (optional)
Graph of Detailed Authority Results (optional)
Notes: 1. Data values have been suppressed where the number of respondents/students is fewer than 6. Suppression is marked with an asterisk (*). 2. Survey results for the province and school authorities were impacted by the changes in the number of students responding to the survey through the
introduction of the OurSCHOOL/TTFM (Tell Them From Me) survey in 2014.
Work Preparation – Measure Details Percentage of teachers and parents who agree that students are taught attitudes and behaviours that will make them successful at work when they finish school. Authority Province 2013 2014 2015 2016 2017 2013 2014 2015 2016 2017 Overall 88.2 87.8 86.9 94.8 89.6 80.3 81.2 82.0 82.6 82.7 Teacher 97.4 100.0 97.0 100.0 100.0 89.4 89.3 89.7 90.5 90.4 Parent 79.0 75.7 76.9 89.6 79.3 71.1 73.1 74.2 74.8 75.1
Graph of Overall Authority Results (optional)
Graph of Detailed Authority Results (optional)
Notes: 1. Data values have been suppressed where the number of respondents/students is fewer than 6. Suppression is marked with an asterisk (*).

Authority: 0152 Calgary Girls' School Society
Page 36
Lifelong Learning – Measure Details Percentage of teacher and parent satisfaction that students demonstrate the knowledge, skills and attitudes necessary for lifelong learning. Authority Province 2013 2014 2015 2016 2017 2013 2014 2015 2016 2017 Overall 69.3 72.9 73.3 77.0 75.9 68.5 69.5 70.0 70.7 71.0 Teacher 82.9 91.9 86.4 94.5 92.9 75.7 76.0 76.0 77.3 77.3 Parent 55.8 54.0 60.3 59.4 58.8 61.2 63.0 64.0 64.2 64.8
Graph of Overall Authority Results (optional)
Graph of Detailed Authority Results (optional)
Notes: 1. Data values have been suppressed where the number of respondents/students is fewer than 6. Suppression is marked with an asterisk (*).

Authority: 0152 Calgary Girls' School Society
Page 37
Provincial Achievement Test Results – Measure Details PAT Course by Course Results by Number Enrolled. Results (in percentages) Target
2013 2014 2015 2016 2017 2017/18 A E A E A E A E A E A E
English Language Arts 6 Authority 99.0 39.0 95.3 40.6 98.2 37.5 93.3 34.2 96.0 29.0 96 30 Province 82.5 16.3 81.9 17.6 82.8 19.5 82.9 20.4 82.5 18.9
French Language Arts 6 Authority n/a n/a n/a n/a n/a n/a n/a n/a n/a n/a n/a n/a Province 88.6 16.3 88.0 15.6 87.5 13.6 87.7 14.2 85.1 13.5
Mathematics 6 Authority 84.8 12.4 90.4 20.2 93.8 21.4 78.3 11.7 86.0 14.0 86 15 Province 73.0 16.4 73.5 15.4 73.2 14.1 72.2 14.0 69.4 12.6
Science 6 Authority 89.5 36.2 95.2 26.9 95.5 42.0 84.2 25.0 92.0 34.0 92 34 Province 77.5 25.9 75.9 24.9 76.3 25.3 78.0 27.1 76.9 29.0
Social Studies 6 Authority 92.4 24.8 88.5 26.9 98.2 33.0 84.2 32.5 96.0 30.0 96 30 Province 72.7 19.0 70.4 16.6 69.8 18.1 71.4 22.0 72.9 21.7
English Language Arts 9 Authority n/a n/a 98.4 34.4 95.0 33.8 93.0 29.1 98.0 33.3 98 33 Province 76.7 14.8 76.3 15.0 75.6 14.4 77.0 15.2 76.8 14.9
English Lang Arts 9 KAE Authority n/a n/a * * * * * * * * Province 62.4 4.3 62.8 3.5 63.0 4.5 59.8 6.2 58.8 5.9
Mathematics 9 Authority n/a n/a 88.5 29.5 87.5 35.0 84.7 28.2 86.9 30.3 87 30 Province 66.8 18.3 67.1 17.3 65.3 17.9 67.8 17.5 67.2 19.0
Mathematics 9 KAE Authority n/a n/a * * * * * * * * Province 65.8 14.7 63.4 14.5 60.9 14.4 61.2 13.0 57.5 13.3
Science 9 Authority n/a n/a 93.4 27.9 93.8 47.5 83.9 27.6 94.9 51.5 95 50 Province 72.9 20.0 73.2 22.1 74.1 22.8 74.2 22.4 74.0 21.4
Science 9 KAE Authority n/a n/a * * * * * * * * Province 68.4 17.1 64.1 14.9 64.5 15.1 63.8 14.3 63.9 13.3
Social Studies 9 Authority n/a n/a 83.6 29.5 81.3 26.3 78.2 28.7 89.9 39.4 89 40 Province 65.5 18.8 65.5 19.9 65.1 19.8 64.7 18.0 67.0 20.2
Social Studies 9 KAE Authority n/a n/a * * * * * * * * Province 64.6 13.0 61.8 10.7 57.3 11.2 58.0 11.6 56.3 12.7
Notes: 1. Data values have been suppressed where the number of respondents/students is fewer than 6. Suppression is marked with an asterisk (*). 2. “A” = Acceptable; “E” = Excellence — the percentages achieving the acceptable standard include the percentages achieving the standard of
excellence. 3. Participation in Provincial Achievement Tests was impacted by the flooding in June 2013 (Grade 9 only) and by the fires in May to June 2016.
Caution should be used when interpreting trends over time for the province and those school authorities affected by these events.

Authority: 0152 Calgary Girls' School Society
Page 38
Graph of Overall Provincial Achievement Test Results
Notes: 1. Data values have been suppressed where the number of respondents/students is fewer than 6. Suppression is marked with an asterisk (*). 2. Participation in Provincial Achievement Tests was impacted by the flooding in June 2013 (Grade 9 only) and by the fires in May to June 2016.
Caution should be used when interpreting trends over time for the province and those school authorities affected by these events.
Graph of Provincial Achievement Test Results by Course
]

Authority: 0152 Calgary Girls' School Society
Page 39
Graph of Provincial Achievement Test Results by Course
Notes: • Data values have been suppressed where the number of respondents/students is fewer than 6. Suppression is marked with an asterisk (*). • Participation in Provincial Achievement Tests was impacted by the flooding in June 2013 (Grade 9 only) and by the fires in May to June 2016.
Caution should be used when interpreting trends over time for the province and those school authorities affected by these events.

Authority: 0152 Calgary Girls' School Society
Page 40
PAT Results Course by Course Summary by Enrolled With Measure Evaluation
Calgary Girls' School Society Alberta
Achievement Improvement Overall 2017 Prev 3 Year Average 2017 Prev 3 Year Average Course Measure N % N % N % N %
English Language Arts 6 Acceptable Standard Very High Maintained Excellent 100 96.0 113 95.6 49,572 82.5 46,989 82.5 Standard of Excellence Very High Declined Good 100 29.0 113 37.4 49,572 18.9 46,989 19.2
Mathematics 6 Acceptable Standard High Maintained Good 100 86.0 112 87.5 49,507 69.4 46,906 73.0 Standard of Excellence Intermediate Maintained Acceptable 100 14.0 112 17.8 49,507 12.6 46,906 14.5
Science 6 Acceptable Standard Very High Maintained Excellent 100 92.0 112 91.6 49,501 76.9 46,914 76.7 Standard of Excellence High Maintained Good 100 34.0 112 31.3 49,501 29.0 46,914 25.8
Social Studies 6 Acceptable Standard Very High Improved Excellent 100 96.0 112 90.3 49,485 72.9 46,903 70.5 Standard of Excellence High Maintained Good 100 30.0 112 30.8 49,485 21.7 46,903 18.9
English Language Arts 9 Acceptable Standard Very High Maintained Excellent 99 98.0 76 95.5 45,487 76.8 43,746 76.3 Standard of Excellence Very High Maintained Excellent 99 33.3 76 32.4 45,487 14.9 43,746 14.9
English Lang Arts 9 KAE Acceptable Standard * * * 3 * n/a n/a 1,428 58.8 1,576 61.9 Standard of Excellence * * * 3 * n/a n/a 1,428 5.9 1,576 4.8
Mathematics 9 Acceptable Standard Very High Maintained Excellent 99 86.9 75 86.9 45,020 67.2 43,295 66.7 Standard of Excellence Very High Maintained Excellent 99 30.3 75 30.9 45,020 19.0 43,295 17.6
Mathematics 9 KAE Acceptable Standard * * * 3 * n/a n/a 1,848 57.5 2,026 61.8 Standard of Excellence * * * 3 * n/a n/a 1,848 13.3 2,026 14.0
Science 9 Acceptable Standard Very High Improved Excellent 99 94.9 76 90.4 45,445 74.0 43,808 73.8 Standard of Excellence Very High Improved Significantly Excellent 99 51.5 76 34.3 45,445 21.4 43,808 22.4
Science 9 KAE Acceptable Standard * * * 3 * n/a n/a 1,440 63.9 1,547 64.1 Standard of Excellence * * * 3 * n/a n/a 1,440 13.3 1,547 14.8
Social Studies 9 Acceptable Standard Very High Improved Excellent 99 89.9 76 81.0 45,484 67.0 43,722 65.1 Standard of Excellence Very High Improved Excellent 99 39.4 76 28.2 45,484 20.2 43,722 19.2
Social Studies 9 KAE Acceptable Standard * * * 3 * n/a n/a 1,393 56.3 1,533 59.0 Standard of Excellence * * * 3 * n/a n/a 1,393 12.7 1,533 11.2
Notes: • Data values have been suppressed where the number of respondents/students is fewer than 6. Suppression is marked with an asterisk (*). • Achievement Evaluation is not calculated for courses that do not have sufficient data available, either due to too few jurisdictions offering
the course or because of changes in tests. • Participation in Provincial Achievement Tests was impacted by the flooding in June 2013 (Grade 9 only) and by the fires in May to June
2016. Caution should be used when interpreting trends over time for the province and those school authorities affected by these events.

Authority: 0152 Calgary Girls' School Society
Page 41
Measure Evaluation Reference - Achievement Evaluation Achievement evaluation is based upon a comparison of Current Year data to a set of standards which remain consistent over time. The Standards are calculated by taking the 3 year average of baseline data for each measure across all school jurisdictions and calculating the 5th, 25th, 75th, and 95th percentiles. Once calculated, these standards remain in place from year to year to allow for consistent planning and evaluation. The table below shows the range of values defining the 5 achievement evaluation levels for each measure.
Course Measure Very Low Low Intermediate High Very High English Language Arts 6 Acceptable Standard 0.00 - 67.95 67.95 - 78.40 78.40 - 86.09 86.09 - 91.37 91.37 - 100.00
Standard of Excellence 0.00 - 6.83 6.83 - 11.65 11.65 - 17.36 17.36 - 22.46 22.46 - 100.00 French Language Arts 6 Acceptable Standard 0.00 - 41.69 41.69 - 73.54 73.54 - 92.32 92.32 - 97.93 97.93 - 100.00
Standard of Excellence 0.00 - 2.72 2.72 - 8.13 8.13 - 15.29 15.29 - 23.86 23.86 - 100.00 Mathematics 6 Acceptable Standard 0.00 - 63.91 63.91 - 70.73 70.73 - 79.61 79.61 - 88.67 88.67 - 100.00
Standard of Excellence 0.00 - 8.53 8.53 - 11.31 11.31 - 18.13 18.13 - 25.17 25.17 - 100.00 Science 6 Acceptable Standard 0.00 - 60.36 60.36 - 78.51 78.51 - 86.46 86.46 - 90.64 90.64 - 100.00
Standard of Excellence 0.00 - 11.74 11.74 - 17.42 17.42 - 25.34 25.34 - 34.31 34.31 - 100.00 Social Studies 6 Acceptable Standard 0.00 - 58.97 58.97 - 68.15 68.15 - 76.62 76.62 - 83.55 83.55 - 100.00
Standard of Excellence 0.00 - 7.30 7.30 - 12.45 12.45 - 19.08 19.08 - 30.09 30.09 - 100.00 English Language Arts 9 Acceptable Standard 0.00 - 63.55 63.55 - 75.66 75.66 - 83.70 83.70 - 90.27 90.27 - 100.00
Standard of Excellence 0.00 - 5.96 5.96 - 9.43 9.43 - 14.72 14.72 - 20.46 20.46 - 100.00 English Lang Arts 9 KAE Acceptable Standard 0.00 - 29.97 29.97 - 53.86 53.86 - 76.19 76.19 - 91.85 91.85 - 100.00
Standard of Excellence 0.00 - 0.00 0.00 - 0.30 0.30 - 10.00 10.00 - 20.31 20.31 - 100.00 French Language Arts 9 Acceptable Standard 0.00 - 67.59 67.59 - 81.33 81.33 - 92.06 92.06 - 97.26 97.26 - 100.00
Standard of Excellence 0.00 - 1.67 1.67 - 6.81 6.81 - 17.11 17.11 - 28.68 28.68 - 100.00 Mathematics 9 Acceptable Standard 0.00 - 52.42 52.42 - 60.73 60.73 - 73.88 73.88 - 78.00 78.00 - 100.00
Standard of Excellence 0.00 - 8.18 8.18 - 12.49 12.49 - 18.10 18.10 - 24.07 24.07 - 100.00 Mathematics 9 KAE Acceptable Standard 0.00 - 28.14 28.14 - 53.85 53.85 - 75.83 75.83 - 94.44 94.44 - 100.00
Standard of Excellence 0.00 - 0.00 0.00 - 6.07 6.07 - 20.43 20.43 - 31.67 31.67 - 100.00 Science 9 Acceptable Standard 0.00 - 50.57 50.57 - 60.14 60.14 - 72.50 72.50 - 76.89 76.89 - 100.00
Standard of Excellence 0.00 - 3.39 3.39 - 6.71 6.71 - 11.81 11.81 - 15.85 15.85 - 100.00 Science 9 KAE Acceptable Standard 0.00 - 38.75 38.75 - 59.30 59.30 - 78.33 78.33 - 87.58 87.58 - 100.00
Standard of Excellence 0.00 - 0.00 0.00 - 7.47 7.47 - 21.41 21.41 - 40.82 40.82 - 100.00 Social Studies 9 Acceptable Standard 0.00 - 56.26 56.26 - 62.27 62.27 - 74.04 74.04 - 79.85 79.85 - 100.00
Standard of Excellence 0.00 - 10.03 10.03 - 12.78 12.78 - 19.76 19.76 - 24.03 24.03 - 100.00 Social Studies 9 KAE Acceptable Standard 0.00 - 38.79 38.79 - 53.82 53.82 - 72.42 72.42 - 84.88 84.88 - 100.00
Standard of Excellence 0.00 - 0.00 0.00 - 5.71 5.71 - 17.19 17.19 - 36.26 36.26 - 100.00 Notes: 1. The range of values at each evaluation level is interpreted as greater than or equal to the lower value, and less than the higher value. For the
Very High evaluation level, values range from greater than or equal to the lower value to 100%. 2. Participation in Provincial Achievement Tests was impacted by the flooding in June 2013 (Grade 9 only) and by the fires in May to June 2016.
Caution should be used when interpreting trends over time for the province and those school authorities affected by these events. 3. Achievement Evaluation is not calculated for courses that do not have sufficient data available, either due to too few jurisdictions offering the
course or because of changes in tests. Improvement Table For each jurisdiction, improvement evaluation consists of comparing the Current Year result for each measure with the previous three-year average. A chi-square statistical test is used to determine the significance of the improvement. This test takes into account the size of the jurisdiction in the calculation to make improvement evaluation fair across jurisdictions of different sizes. The table below shows the definition of the 5 improvement evaluation levels based upon the chi-square result.
Evaluation Category Chi-Square Range Declined Significantly 3.84 + (current < previous 3-year average) Declined 1.00 - 3.83 (current < previous 3-year average) Maintained less than 1.00 Improved 1.00 - 3.83 (current > previous 3-year average) Improved Significantly 3.84 + (current > previous 3-year average)

Authority: 0152 Calgary Girls' School Society
Page 42
Overall Evaluation Table The overall evaluation combines the Achievement Evaluation and the Improvement Evaluation. The table below illustrates how the Achievement and Improvement evaluations are combined to get the overall evaluation.
Achievement Very High High Intermediate Low Very Low Improved Significantly Excellent Good Good Good Acceptable Improved Excellent Good Good Acceptable Issue Maintained Excellent Good Acceptable Issue Concern Declined Good Acceptable Issue Issue Concern Declined Significantly Acceptable Issue Issue Concern Concern
Program of Studies – Measure Details
Percentage of teachers, parents and students satisfied with the opportunity for students to receive a broad program of studies including fine arts, career, technology, and health and physical education. Authority Province 2013 2014 2015 2016 2017 2013 2014 2015 2016 2017 Overall 89.5 91.4 90.5 92.5 91.9 81.5 81.3 81.3 81.9 81.9 Teacher 96.4 98.7 98.9 99.7 99.0 87.9 87.5 87.2 88.1 88.0 Parent 86.0 86.9 86.2 88.5 89.8 78.9 79.9 79.9 80.1 80.1 Student 86.2 88.4 86.4 89.3 86.9 77.8 76.6 76.9 77.5 77.7
Graph of Overall Authority Results (optional)
Graph of Detailed Authority Results (optional)
Notes: 1. Data values have been suppressed where the number of respondents/students is fewer than 6. Suppression is marked with an asterisk (*). 2. Survey results for the province and school authorities were impacted by the changes in the number of students responding to the survey through the
introduction of the OurSCHOOL/TTFM (Tell Them From Me) survey in 2014.

Authority: 0152 Calgary Girls' School Society
Page 43
Parental Involvement – Measure Details
Percentage of teachers and parents satisfied with parental involvement in decisions about their child's education. Authority Province 2013 2014 2015 2016 2017 2013 2014 2015 2016 2017 Overall 69.9 83.5 82.0 88.2 84.7 80.3 80.6 80.7 80.9 81.2 Teacher 81.6 97.4 97.6 100.0 96.2 88.5 88.0 88.1 88.4 88.5 Parent 58.2 69.5 66.4 76.4 73.2 72.2 73.1 73.4 73.5 73.9
Graph of Overall Authority Results (optional)
Graph of Detailed Authority Results (optional)
Notes: 1. Data values have been suppressed where the number of respondents/students is fewer than 6. Suppression is marked with an asterisk (*). Education Quality – Measure Details
Percentage of teachers, parents and students satisfied with the overall quality of basic education. Authority Province 2013 2014 2015 2016 2017 2013 2014 2015 2016 2017 Overall 88.1 91.6 90.8 92.6 92.4 89.8 89.2 89.5 90.1 90.1 Teacher 99.6 99.6 98.0 100.0 99.5 95.7 95.5 95.9 96.0 95.9 Parent 81.2 85.4 83.1 87.1 87.2 84.9 84.7 85.4 86.1 86.4 Student 83.6 89.7 91.4 90.8 90.4 88.7 87.3 87.4 88.0 88.1
Graph of Overall Authority Results (optional)
Graph of Detailed Authority Results (optional)
Notes: 1. Data values have been suppressed where the number of respondents/students is fewer than 6. Suppression is marked with an asterisk (*). 2. Survey results for the province and school authorities were impacted by the changes in the number of students responding to the survey through the
introduction of the OurSCHOOL/TTFM (Tell Them From Me) survey in 2014.

Authority: 0152 Calgary Girls' School Society
Page 44
Safe and Caring – Measure Details
Percentage of teacher, parent and student agreement that: students are safe at school, are learning the importance of caring for others, are learning respect for others and are treated fairly in school. Authority Province 2013 2014 2015 2016 2017 2013 2014 2015 2016 2017 Overall 92.1 93.7 93.0 95.1 93.3 89.0 89.1 89.2 89.5 89.5 Teacher 97.9 100.0 98.2 100.0 99.5 95.0 95.3 95.4 95.4 95.3 Parent 94.4 93.5 92.4 96.0 94.3 87.8 88.9 89.3 89.8 89.9 Student 83.9 87.6 88.3 89.4 86.2 84.2 83.1 83.0 83.4 83.3
Graph of Overall Authority Results (optional)
Graph of Detailed Authority Results (optional)
Notes: 1. Data values have been suppressed where the number of respondents/students is fewer than 6. Suppression is marked with an asterisk (*). 2. Survey results for the province and school authorities were impacted by the changes in the number of students responding to the survey through the
introduction of the OurSCHOOL/TTFM (Tell Them From Me) survey in 2014. School Improvement – Measure Details
Percentage of teachers, parents and students indicating that their school and schools in their jurisdiction have improved or stayed the same the last three years. Authority Province 2013 2014 2015 2016 2017 2013 2014 2015 2016 2017 Overall 68.2 80.9 85.2 88.8 82.2 80.6 79.8 79.6 81.2 81.4 Teacher 77.8 94.4 96.6 100.0 88.9 80.9 81.3 79.8 82.3 82.2 Parent 62.4 70.9 78.8 85.1 80.6 77.9 77.0 78.5 79.7 80.8 Student 64.4 77.4 80.3 81.5 77.2 82.9 81.2 80.7 81.5 81.1
Graph of Overall Authority Results (optional)
Graph of Detailed Authority Results (optional)
Notes: 1. Data values have been suppressed where the number of respondents/students is fewer than 6. Suppression is marked with an asterisk (*). 2. Survey results for the province and school authorities were impacted by the changes in the number of students responding to the survey through the
introduction of the OurSCHOOL/TTFM (Tell Them From Me) survey in 2014.