annual environmental management report boggabri … commencement date 1 january 2007 aemr completion...
TRANSCRIPT

March 2008
Name of Mine Boggabri Coal Mine
Mining Titles/Leases CL368
MOP Commencement Date 1 January 2006 MOP Completion Date 15 November 2011
AEMR Commencement Date 1 January 2007 AEMR Completion Date 31 December 2007
Name of Leaseholder Boggabri Coal Pty Limited
Name of Mine Operator Downer EDI Mining Pty Ltd
Reporting Officer Thor Berding
Title General Manager
Signature
Date 26 March 2008
Annual Environmental Management Report Boggabri Coal Pty Limited

2
Author: Joe Rennick
Reviewer: Thor Berding
Approved by: Thor Berding
Signed: ...................................................................................................
Date: 26 March 2008
Distribution: 1 x Department of Primary Industries; 1 x Department of Environment and Conservation; 1 x Department of Planning; 1 x Narrabri Shire Council

Annual Environmental Management Review Boggabri Coal Mine March 2008
Glossary
Colliery Holding A colliery holding registered under the Mining Act, 1992 for coal mining operations.
Contamination of Land As defined in the Contaminated Land Management Act (1997) as meaning “the presence in or under the land of a substance at a concentration above the concentration at which the substance is normally present in, on or under (respectively) land in the same locality, being a presence that presents a risk of harm to human health or any other aspect of the environment.
Disturbed Area The surface area disturbed during mining or any mining purpose. It includes all infrastructure facilities, emplacement area, residue disposal area, road and rail access, soil stockpile area, product stockpile area, water diversion and storage structures.
Endangered Flora/Fauna Species identified as endangered in the schedules of the Threatened Species Conservation Act (1995) and the Environment Protection and Biodiversity Conservation Act (1999).
Extraction Area The area proposed to be mined during the MOP period, including batters and pre-strip areas.
Flood prone land Land within 1 in 100 year flood boundaries as shown on regional maps. Where maps are not available other means may be required to assess flood potential.
Inspector of Mines Means an officer of the Department of Minerals Resources authorised as an Inspector under the Mining Act, 1992. This includes Department of Minerals Resources Environmental Officers.
Landscape Planning The sympathetic integration of the MOP‟s rehabilitated landforms, revegetation strategies with the environment surrounding the mine to achieve drainages and predetermined environmental outcomes and including land use (flora and fauna habitat and visual amenity)
Limits to Extraction The boundary of an area of land from which mineral can not be extracted due to a provision, restriction or condition imposed by a government instrument.
Mine Life The expected extent and scope of the mine as approved in the “Development Consent”. In most circumstances this will be as described in the Environmental Impact Assessment on which approval and grant of lease were based.
Mining Leases Leases granted under the Mining Act 1992 or any previous mining legislation.
Mining Purposes The construction, maintenance or use in or in connection with mining operations of buildings, plant, road, emplacement, stock pile and other infrastructure
Pollution The Protection of the Environment Operations Act (1997) comprehensively defines water, air and noise pollution. In essence:
Water pollution Means introducing anything which makes or is likely to make the water detrimental, undrinkable, poisonous, harmful or unsuitable for use, or changing the condition of the water.
Noise pollution Means the emission of an offensive noise
Air pollution Means the emission into the air of any impurity including smoke, dust, gases, mists odours or radioactive substances.
Land pollution Means the degradation of land because of the disposal of waste.
Processing Wastes Tailings from ore beneficiation and processing
Rural Land Capability Classification
A method of land classification published by the Soil Conservation Service of the Department of Land and Water Conservation.

Annual Environmental Management Review Boggabri Coal Mine March 2008
ii
Shaped Emplacement Areas
Mine and processing waste emplacements shaped to final design contours.
Soil Stripping Depth The depth from the surface to which soil material which is to be removed in the preparation of land for mining or mining purposes.
Sublease An interest registered under Section 161 of the Mining Act, 1992.
Threatened flora/fauna Species defined as threatened in the schedules of the Threatened Species Conservation Act (1995) and Environment Protection and Biodiversity and Conservation Act (1999).
Unshaped Emplacement Areas
Active mine and processing waste emplacements not shaped to the final design contours.
Water - Clean water Water from undisturbed vegetated parts of the site. Fit for diversion or direct discharge to receiving streams.
Water - Dirty water Water from disturbed but otherwise uncontaminated parts of the site. Fit for discharge, except for suspended solids which may require settling.
Water - Controlled Discharge
Typically water, saline but otherwise uncontaminated, collected within open cuts or underground mine workings as a result of groundwater seepage. Able to be discharged under certain conditions. For example, saline water which may be discharged under high flow conditions as part of the Hunter River Salinity Trading Scheme.
Water - Contaminated Water
Water containing potential contaminants or pollutants and not fit for discharge.

Annual Environmental Management Review Boggabri Coal Mine March 2008
ii
Abbreviations
AEMR Annual Environmental Management Report
AN Ammonium Nitrate
ANFO Ammonium Nitrate Fuel Oil mix
BC Boggabri Coal
BCM Boggabri Coal Mine
BCT Boggabri Coal Terminal
CL Coal Lease
CMA Catchment Management Authority
DEC Department of Environment and Conservation
DEDIM Downer EDI Mining PTY LTD
DMR Department of Minerals Resources
EIS Environmental Impact Statement
EMP Environmental Management Plan
EMS Environmental Management Strategy
EPL Environmental Protection License
GSC Gunnedah Shire Council
IAR Idemitsu Australia Resources Group
LOX Limit of Oxidation
MIA Mine Infrastructure Area
MMU Mobile Mixing Unit
MOP Mine Operations Plan
MSDS Material Safety Data Sheet
Mtpa Million tonnes per annum
MW Contaminated Water Dam
NSC Narrabri Shire Council
ROM Run Of Mine
RTA Roads and Traffic Authority
SD Sediment Dam
tpa Tonnes per annum
WCM Whitehaven Coal Mining Pty Ltd

Annual Environmental Management Review Boggabri Coal Mine
3
Contents
1. EXECUTIVE SUMMARY 7
2. INTRODUCTION 8
2.1 Consents, Leases and Licences 10
2.2 Mine Contacts 10
2.3 Actions Required at Previous AEMR Review 11
3. OPERATIONS DURING THE REPORTING PERIOD 12
3.1 Exploration 12
3.1.1 Exploration Activity 12
3.1.2 Drill Hole Sealing 13
3.1.3 Drill Site Rehabilitation 15
3.2 Land Preparation 17
3.2.1 Existing Vegetation 17
3.2.2 Vegetation Clearing 17
3.2.3 Soil Types 17
3.2.4 Soil Characteristics 18
3.2.5 Soil Profile 18
3.2.6 Topsoil stripping 18
3.3 Construction 19
3.3.1 Mine Infrastructure 19
3.4 Mining 19
3.4.1 Mine Design and Planning 19
3.4.2 Mining Method 19
3.5 Coal Processing 22
3.6 Coal Stockpiles 22
3.7 Waste Management 22
3.8 Water Management 23
3.8.1 General 23
3.8.2 Clean Water Drainage 24
3.8.3 Dirty Water Drainage 25
3.8.4 Contaminated Water Collection 27
3.9 Hazardous Materials 28
3.9.1 Diesel 28
3.9.2 Ammonium Nitrate 29
3.9.3 ANFO 29
3.9.4 Detonators 29
3.9.5 Hydraulic/Lubricating Oils 29
3.9.6 Cleaning Agents 30
3.9.7 Herbicides 31
3.9.8 Material Safety Data Sheets 31
4. ENVIRONMENTAL MANAGEMENT AND PERFORMANCE 31

Annual Environmental Management Review Boggabri Coal Mine
4
4.1 Weather Monitoring 32
4.1.1 General 32
4.1.2 Temperature 32
4.1.3 Rainfall 32
4.1.4 Wind 33
4.2 Air Quality Management and Performance 34
4.3 Site Water Management and Performance 38
4.3.1 Surface Water 38
4.3.2 Groundwater 39
4.4 Flora and Fauna Management and Performance 43
4.4.1 Monitoring Results 43
4.5 Rehabilitation and Land Management and Performance 47
4.5.1 Revegetation 47
4.6 Noise, Blast and Vibration Management and Performance 51
4.6.1 Blast Peak Vibration 51
4.6.2 Blast Overpressure 52
4.6.3 Noise Monitoring 53
4.7 Hydrocarbon and Contaminated Land Management and Performance 55
4.7.1 General 55
4.8 Aboriginal Archaeology and Cultural Heritage Management and Performance 56
4.9 Public Safety Management and Performance 56
4.9.1 Mine Access Roads 56
4.9.2 Private Coal Haul Road 56
4.9.3 Rural Lands Protection Board 57
4.9.4 Minesite Security 57
4.9.5 Fire Management 57
4.9.6 Site Lighting 57
5. COMMUNITY RELATIONS 57
5.1 Workforce 57
5.2 Community Complaints 58
5.3 Community Liaison 59
6. REHABILITATION 59
6.1 Buildings 59
6.2 Rehabilitation of Disturbed Land 59
6.3 Other infrastructure 60
6.4 Rehabilitation Trials and Research 60
6.5 Further Development of the Final Rehabilitation Plan 60
7. ACTIVITIES PROPOSED IN THE NEXT AEMR PERIOD 60
7.1 Activities proposed in 2008 60

Annual Environmental Management Review Boggabri Coal Mine
5
LIST OF TABLES
Table 1 BCM Consents Leases and Licences 10
Table 2 Actions Required 12
Table 3 Exploration Drill Holes 14
Table 4 Production and Waste Summary 23
Table 5 Sediment Dam Design Volumes 27
Table 6 Stored Water 27
Table 7 Contaminated Water Storage 28
Table 8 Summary of Environmental Management Plans (EMP’s) 31
Table 9 Summary of non compliant monthly dust observations 37
Table 10 Ecological Survey, Site Locations 47
Table 11 Noise Monitoring Locations for Boggabri Mine 54
Table 12 Rehabilitation Summary 2007 61
Table 13 Maintenance Activities on Rehabilitated Land 2007 62
LIST OF FIGURES
Figure 1 Exploration Drilling in Leard State Forest 13
Figure 2 Exploration Drill Hole Locations 15
Figure 3 2007 Rehabilitation of access track drill site TA13 16
Figure 4 2007 Rehabilitation of drill site TA13 16
Figure 5 Drilled interburden, northern extents of the Merriown Pit 20
Figure 6 Interburden Removal by Hitachi EX3600, northern extent of Jeralong Pit 21
Figure 7 Coal mining by Hitachi EX2500, Jeralong Pit 21
Figure 8 Coal loading for transport to the product stockpile at the rail terminal 22
Figure 9 Northern Clean Water Diversion Drain November 2006 24
Figure 10 Northern Clean Water Diversion Drain March 2008 24
Figure 11 Plan of MIA Water Management 26
Figure 12 Diesel Fuel Storage Tank 29
Figure 13 Waste Oil Awaiting Collection 30
Figure 14 Cleaning Fluids Stored Beside Wash Bay Area 30
Figure 15 Temperature 2007 32
Figure 16 Rainfall Totals 2007 33
Figure 17 Wind Summary 2007 33
Figure 18 Dust Monitoring Sites East of the Boggabri Mine 34
Figure 19 Dust Monitoring Sites West of the Boggabri Mine 35
Figure 20 Dust Monitoring Sites Adjacent to the Coal Terminal 35
Annual Environmental Management Review Boggabri Coal Mine
6
Figure 21 Dust Monitoring Sites South of the Haul Road 36
Figure 22 PM10 Results 2007 38
Figure 23 Bore Hole Standing Water Level 40
Figure 24 Bore Hole pH 41
Figure 25 Bore Hole Electrical Conductivity 42
Figure 26 Ecological Survey Sites in Leard State Forest 44
Figure 27 Ecological Survey Sites at Rocklea 45
Figure 28 Ecological Survey Sites in Vickery State Forest 46
Figure 29 Preparation of Final Landform for Aerial Seeding November 2007 49
Figure 30 Laser Bucket Repairing Washouts on Batter 49
Figure 32 Rehabilitation after Aerial Seeding January 2008 50
Figure 33 Grass Species Aerial Sown in November 2007 51
Figure 34 Peak Vibration Summary 52
Figure 35 Peak Overpressure Summary 2007 53
Figure 36 Noise Monitoring Summary 2007 55
Figure 37 Double Skinned Self Bunded Oil Storage Tanks 55
Figure 38 Aboriginal Archaelogical Site 56
Figure 39 Workforce Residential Locality Summary 2007 58
Figure 40 Workforce Origin 58
ATTACHMENTS (presented at the end of this document) Attachment 1 Aerial Photograph of Boggabri Mine
Attachment 2 Plan of Existing Infrastructure
Attachment 3 Environmental Monitoring Site Map
Attachment 4 Boggabri Coal Mine Topsoil Plan
Attachment 5 AEMR Topsoil Plan
Attachment 6 AEMR Rehab Plan
Annual Environmental Management Review Boggabri Coal Mine
7
1. EXECUTIVE SUMMARY
The Boggabri Coal Mine (BCM) is located approximately 15km north-east of the township
of Boggabri in north-western New South Wales. The mine area contains considerable
open cut and potential underground reserves.
The BCM includes development of an open cut coal mine with associated infrastructure
including a private haul road, rail loading facility and mine infrastructure area including
workshops, administration and coal processing and handling.
Production is based on 1.5 million tonnes of product coal per annum (Mtpa), with
potential to progressively increase production to 5 Mtpa.
The Boggabri Coal Mine‟s Mine Operations Plan (MOP) was approved in January 2006
and construction and mine development activities began forthwith. Topsoil stripping
commenced in the southern area of the coal lease area during May 2006. Mining
operations are undertaken using hydraulic excavators and trucks and the first coal was
delivered to the ROM pad in October 2006. The first six years of mining will concentrate
on two separate, progressively developed pits (Merriown Pit and Jeralong Pit) in the
south of the coal lease area.
This document describes all environmental management related activities during the
second year‟s operation of the BCM.
Name of Mine Boggabri Coal Mine
Mining Titles/Leases CL368
MOP Commencement Date 1 January 2006 MOP Completion Date 15 November 2011
Name of Leaseholder Boggabri Coal Pty Limited
Name of Mine Operator Downer EDI Mining PTY LTD
Reporting Officer Thor Berding
Title General Manager
Signature
Date 26 March 2008

8
2. INTRODUCTION
In December 1991, Idemitsu Boggabri Coal Pty Limited (IBC) became the sole
owner of the Boggabri Coal Mine (BCM). IBC is 100% owned by Idemitsu
Kosan Co. Ltd (IKC), a privately owned Japanese resource company whose
main business consists of importing crude oil, refining oil and the retail sale of
fuel products in Japan.
IKC has been involved in the Australian coal mining industry for 25 years,
currently operating the Ensham Mine in central Queensland, Muswellbrook Mine
in the Hunter Valley, New South Wales and the Boggabri Coal Mine in the
Gunnedah Basin. In January 2007, the Idemitsu Australia Resources Group
(IAR) underwent an internal reorganisation. As part of the reorganisation, the
assets and undertaking of Idemitsu Boggabri Coal Pty Limited were transferred
to Boggabri Coal Pty Limited (BC), a newly constituted wholly owned subsidiary
of Idemitsu Australia Resources.
The Boggabri Coal Mine is located approximately 15 km northeast of Boggabri
and lies within the Leard State Forest. Access to the site is via the Leard Forest
Road (SR12) off the Boggabri-Manilla Road (MR357). The area lies
immediately to the north of the Tarrawonga Mine, a joint venture between BC
and Whitehaven Coal Mining Pty Limited (WCM).
Development of the project commenced in 1976, and in the early 1980‟s
numerous environmental and engineering studies were prepared. In the mid
1980‟s these studies were reviewed and in 1988 an Environmental Impact
Statement (EIS) was submitted for the project. The project was granted
development consent on 25 August 1989. Coal Lease 368 was subsequently
granted on 15 November 1990 for a period of 21 years to 15 November 2011.
Between May and July 1979, a box cut pit (approximately 150m long and 35m
wide was developed to the Merriown seam in the south west of the lease area
near the Merriown seam limit of oxidation (LOX) line. A 100 tonne bulk sample
of Merriown seam coal was initially extracted and in November 1981 a further 10
tonne sample was excavated from the box cut. In November 1993 a bulk
sample of approximately 2,000 tonnes of Merriown seam was extracted by
auguring operations at the box cut.
Consistent with the lease expiry date, the Mine Operations Plan (MOP) was
prepared to cover a six year period, from when operations commenced in early
2006 extending to the end of the lease period. It is the intention of BC to seek
renewal of CL368 at the end of the current lease period to allow mining
operations to continue uninterrupted.
On 11 January 2006, IBC was granted an Environmental Protection Licence
(EPL 12407) and the Mine Operations Plan was submitted and approved on 25
January 2006. Subsequent to the granting of the required approvals,
construction of the project began.
Constructed items included a 17 km bitumen sealed private coal haul road from
the mine to the rail loading facility including a bridge over the Namoi River and
Kamilaroi Highway; a Run of Mine (ROM) pad; a coal crusher, conveyor and
truck load out facility; a 3 km rail loop and turnout, a product stockpile and
precision train loading facility; and the mine infrastructure area including

9
workshop and offices. These construction activities were completed by early
November 2006.
In accordance with the EIS prepared by BHP-AGIP-Idemitsu Joint Venture,
current development consent conditions allow development of the BCM at a rate
of 5 Mtpa. However, due to limits on rail capacity, initial production has been
restricted to approximately 1.5 Mtpa. Provided that market conditions remain
favourable, BC intends to expand the operation once rail and port capacity
restrictions are resolved. It is possible that this expansion could occur within the
first six years of operation.
Forest clearing began in February 2006 and Stage 1 clearing including timber
recovery was completed in August 2006. Topsoil stripping activities
commenced in May 2006 and the first coal was mined and delivered to the ROM
pad in October 2006.
Initially, coal is mined and transported to the run of mine (ROM) crushing facility
located in the south western corner of the mine lease, crushed and blended
(without further beneficiation) to produce an export quality steaming coal and a
product suitable for pulverised coal injection applications.
Product coal is hauled 17km via a bitumen sealed private coal haul road to the
Boggabri Coal Terminal (BCT) facility for loading and rail transport to the Port of
Newcastle.
The BCM employs approximately 100 mining and maintenance services
employees and 20 transport services employees. Local job opportunities have
been created as many positions have been filled by local residents. This is
outlined in further detail later in this report.
Mining operations are undertaken on a two shift, seven day,10.5 hours per shift
basis, with maintenance activities occurring 24 hours per day, 7 days a week.
Mining commenced from the south of the open cut area utilising large hydraulic
excavators and rear dump trucks. The first six years of mining will concentrate
on two separate, progressively developed pits (the “Merriown“ and “Jeralong”
pits).
Rehabilitation of in-pit and ex-pit emplacement areas will be undertaken
progressively. The rehabilitation objective will be to achieve a similar structure
to existing native forest composition with emphasis on the following commercial
native species: Narrow-leaved Ironbark (Eucalyptus crebra), White Box (E.
albens), Pilliga Box (E. pilligaensis) and Cypress Pine (Callitris glaucophylla).
The mine infrastructure area will be rehabilitated to pasture.
Clean water is diverted around the mine site via diversion channels and all dirty
water is collected in purpose built sediment dams where sediment is allowed to
settle prior to discharge. Potentially contaminated water is collected and utilised
within the mine site.
Facilities associated with the BCM are illustrated in Figure 5 which is a plan
showing all mine infrastructure.
10
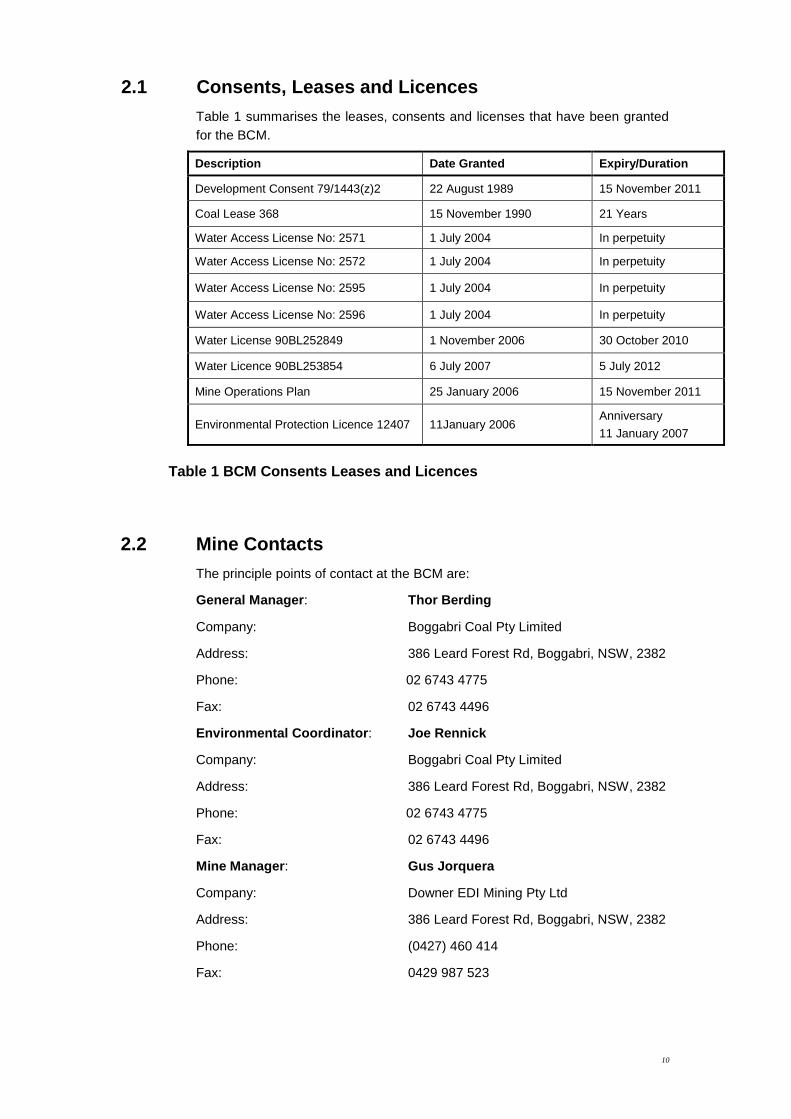
2.1 Consents, Leases and Licences
Table 1 summarises the leases, consents and licenses that have been granted
for the BCM.
Description Date Granted Expiry/Duration
Development Consent 79/1443(z)2 22 August 1989 15 November 2011
Coal Lease 368 15 November 1990 21 Years
Water Access License No: 2571 1 July 2004 In perpetuity
Water Access License No: 2572 1 July 2004 In perpetuity
Water Access License No: 2595 1 July 2004 In perpetuity
Water Access License No: 2596 1 July 2004 In perpetuity
Water License 90BL252849 1 November 2006 30 October 2010
Water Licence 90BL253854 6 July 2007 5 July 2012
Mine Operations Plan 25 January 2006 15 November 2011
Environmental Protection Licence 12407 11January 2006 Anniversary
11 January 2007
Table 1 BCM Consents Leases and Licences
2.2 Mine Contacts
The principle points of contact at the BCM are:
General Manager: Thor Berding
Company: Boggabri Coal Pty Limited
Address: 386 Leard Forest Rd, Boggabri, NSW, 2382
Phone: 02 6743 4775
Fax: 02 6743 4496
Environmental Coordinator: Joe Rennick
Company: Boggabri Coal Pty Limited
Address: 386 Leard Forest Rd, Boggabri, NSW, 2382
Phone: 02 6743 4775
Fax: 02 6743 4496
Mine Manager: Gus Jorquera
Company: Downer EDI Mining Pty Ltd
Address: 386 Leard Forest Rd, Boggabri, NSW, 2382
Phone: (0427) 460 414
Fax: 0429 987 523
11
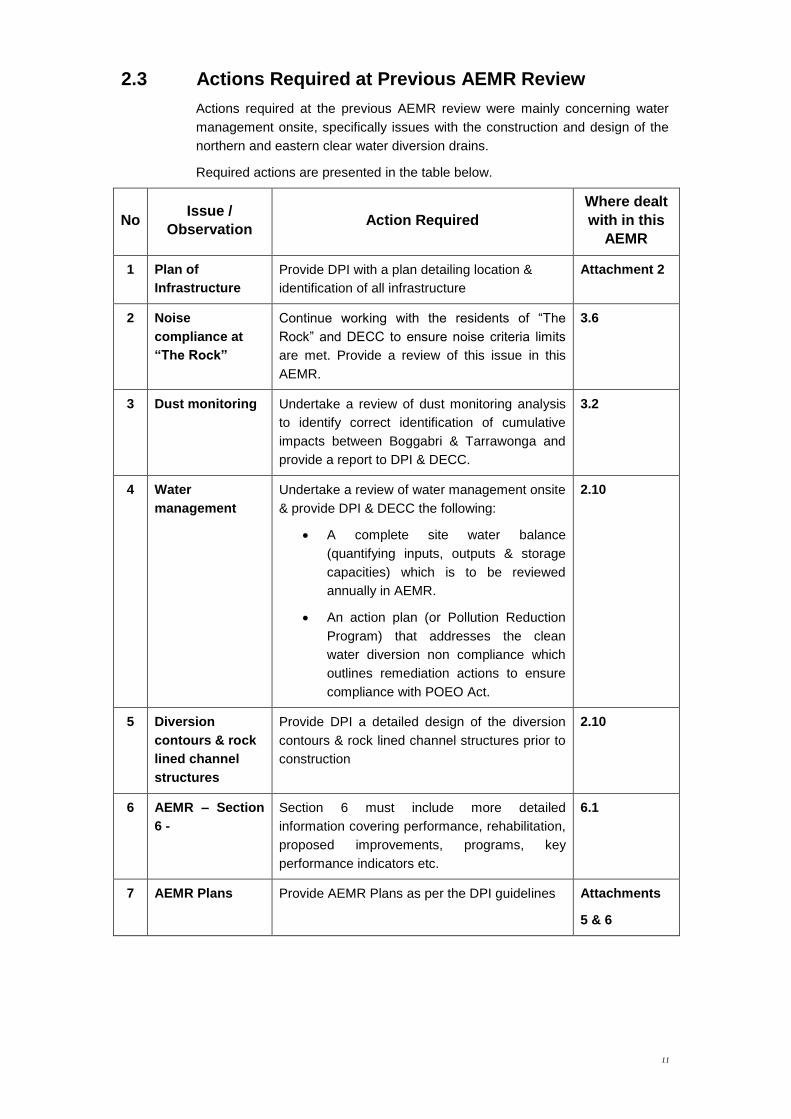
2.3 Actions Required at Previous AEMR Review
Actions required at the previous AEMR review were mainly concerning water
management onsite, specifically issues with the construction and design of the
northern and eastern clear water diversion drains.
Required actions are presented in the table below.
No Issue /
Observation Action Required
Where dealt
with in this
AEMR
1 Plan of
Infrastructure
Provide DPI with a plan detailing location &
identification of all infrastructure
Attachment 2
2 Noise
compliance at
“The Rock”
Continue working with the residents of “The
Rock” and DECC to ensure noise criteria limits
are met. Provide a review of this issue in this
AEMR.
3.6
3 Dust monitoring Undertake a review of dust monitoring analysis
to identify correct identification of cumulative
impacts between Boggabri & Tarrawonga and
provide a report to DPI & DECC.
3.2
4 Water
management
Undertake a review of water management onsite
& provide DPI & DECC the following:
A complete site water balance
(quantifying inputs, outputs & storage
capacities) which is to be reviewed
annually in AEMR.
An action plan (or Pollution Reduction
Program) that addresses the clean
water diversion non compliance which
outlines remediation actions to ensure
compliance with POEO Act.
2.10
5 Diversion
contours & rock
lined channel
structures
Provide DPI a detailed design of the diversion
contours & rock lined channel structures prior to
construction
2.10
6 AEMR – Section
6 -
Section 6 must include more detailed
information covering performance, rehabilitation,
proposed improvements, programs, key
performance indicators etc.
6.1
7 AEMR Plans Provide AEMR Plans as per the DPI guidelines Attachments
5 & 6

12
8 AEMR Section 1.3 should be expanded to provide
sufficient detail of the actions required by the
DPI following its environmental review of mining
operations and a copy of these requirements
should be included in the AEMR‟s appendices.
And
Section 3.1 should include a map showing the
location of air quality monitoring sites (and other
environmental monitoring sites), as well as
annual averages for deposited dust and PM10
air quality.
1.3
Attachment 3
Table 2 Actions Required
3. OPERATIONS DURING THE REPORTING PERIOD
Boggabri Mine operational mining activities have been confined to areas cleared
in 2006 with no new areas being disturbed during the reporting period, 2007.
3.1 Exploration
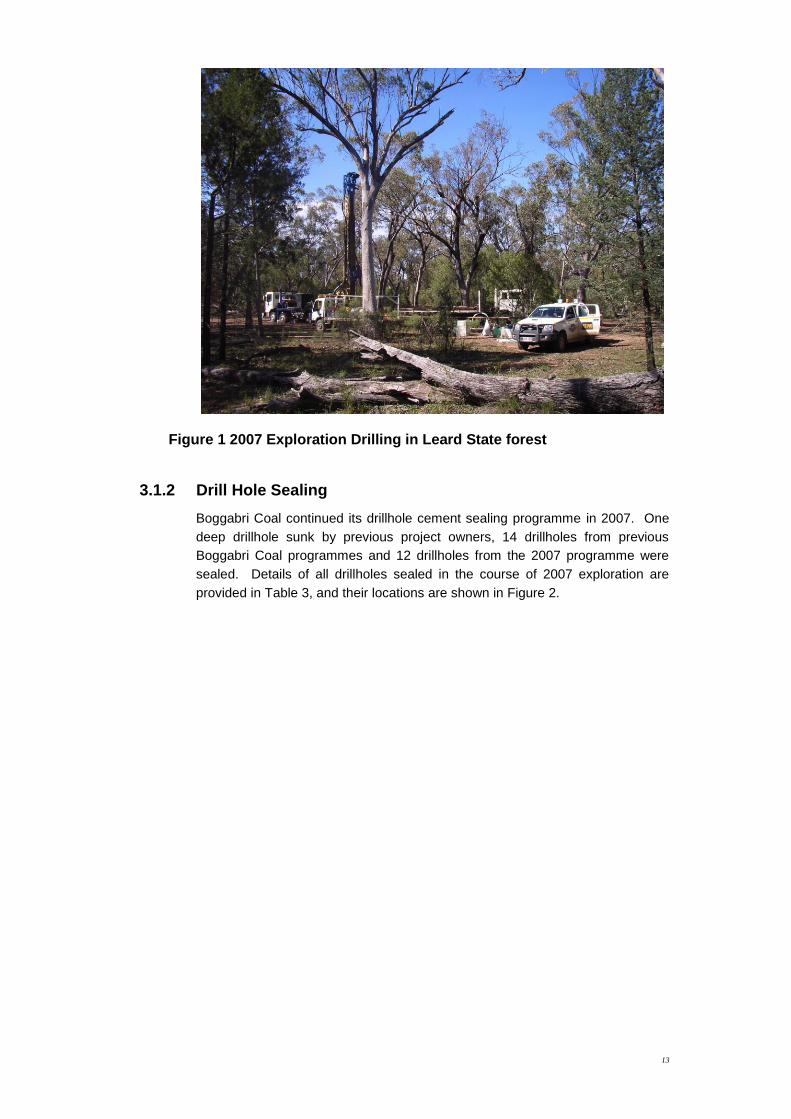
3.1.1 Exploration Activity
Exploration drilling was undertaken during 2007 to confirm coal quality, examine
possible fault locations and further define Tarrawonga and Templemore seam
extents within the identified open cut resource area at Boggabri. The
programme comprised the drilling of twelve fully cored HQ drillholes to intersect
the Templemore Seam. An additional six partial redrills were required at various
sites. Refer to Table 3 and Figure 2 for details and locations of drilling
undertaken.
13
Figure 1 2007 Exploration Drilling in Leard State forest
3.1.2 Drill Hole Sealing
Boggabri Coal continued its drillhole cement sealing programme in 2007. One
deep drillhole sunk by previous project owners, 14 drillholes from previous
Boggabri Coal programmes and 12 drillholes from the 2007 programme were
sealed. Details of all drillholes sealed in the course of 2007 exploration are
provided in Table 3, and their locations are shown in Figure 2.

14
Hole_ID East_MGA North_MGA Collar TD Drill_Start Drill_Finish Hole_Status Seal_Date
AB1145 226568.81 6612164.09 344.8 266.00 11/12/1978 22/01/1979 Sealed IBC 17-18/7/2007
IBC2120 228205.04 6610264.20 308.4 107.90 29/10/2005 3/11/2005 Sealed IBC 12-14/5/07
IBC2121 228609.80 6610172.12 313.1 114.10 3/11/2005 8/11/2005 Sealed IBC 14/05/2007
IBC2123A 228343.71 6610748.26 302.7 123.97 10/11/2005 2/12/2005 Sealed IBC 10/05/2007
IBC2130 228786.08 6610535.53 311.3 137.00 12/07/2006 31/07/2006 Sealed IBC 10/05/2007
IBC2131 229349.41 6610284.16 328.1 119.84 1/08/2006 7/08/2006 Sealed IBC 11/05/2007
IBC2132 229344.34 6609783.64 315.0 65.97 8/08/2006 10/08/2006 Sealed IBC 11/05/2007
IBC2133 228891.68 6609806.51 307.6 61.94 11/08/2006 22/08/2006 Sealed IBC 11/05/2007
IBC2134 228864.33 6610029.08 322.7 94.00 22/08/2006 23/08/2006 Sealed IBC 14/05/2007
IBC2135 228891.83 6610281.07 319.3 120.00 23/08/2006 23/08/2006 Sealed IBC 10/05/2007
IBC2136 228429.37 6610114.17 307.5 54.00 24/08/2006 24/08/2006 Sealed IBC 13/05/2007
IBC2137 228436.60 6610041.48 304.8 33.00 24/08/2006 24/08/2006 Sealed IBC 13/05/2007
IBC2140 228665.69 6609410.69 302.9 68.90 1/09/2006 14/09/2006 Sealed IBC 12/05/2007
IBC2142 228886.99 6609068.91 314.8 78.95 17/09/2006 20/09/2006 Sealed IBC 12/05/2007
IBC2144 228765.78 6608982.50 319.3 96.50 20/09/2006 20/09/2006 Sealed IBC 12/05/2007
BC2147 225667.75 6610107.35 299.8 174.34 1/06/2007 6/06/2007 Sealed BC 18/07/2007
BC2147R 225670.47 6610110.40 299.7 43.30 4/07/2007 5/07/2007 Sealed BC 17/07/2007
BC2148 226968.07 6611721.81 319.3 249.14 6/06/2007 21/06/2007 Sealed BC 21/6-
11/10/2007
BC2149 226560.34 6612161.61 345.1 257.94 21/06/2007 1/07/2007 Sealed BC 17-18/7/2007
BC2149R 226565.09 6612162.11 344.9 102.10 1/07/2007 4/07/2007 Sealed BC 17-18/7/2008
BC2150 227383.90 6612272.05 320.0 255.15 5/07/2007 16/07/2007 Sealed BC 2/8-
10/10/2007
BC2150R 227383.67 6612275.21 320.1 99.34 16/07/2007 17/07/2007 Sealed BC 10/10/2007
BC2151 228038.85 6612295.81 325.3 341.24 19/07/2007 29/07/2007 Sealed BC 10/10/2007
BC2152 226337.94 6610702.02 306.5 243.19 7/09/2007 23/09/2007 Sealed BC 11/10/2007
BC2152A 226338.58 6610700.11 306.6 54.24 31/07/2007 4/08/2007 Sealed BC 4/8-
11/10/2007
BC2153 228151.64 6611271.26 303.3 310.22 8/08/2007 5/09/2007 Sealed BC 10-
11/10/2007
BC2153A 228151.14 6611273.29 303.4 32.12 3/08/2007 7/08/2007 Sealed BC 10/10/2007
BC2154A 228853.52 6611285.07 315.0 367.01 25/09/2007 2/11/2007 To be sealed
BC2155 228711.18 6612333.55 332.5 360.67 1/11/2007 1/12/2007 To be sealed
BC2156 228860.43 6611778.20 322.7 345.17 2/11/2007 2/12/2007 To be sealed
BC2157 229654.22 6611269.51 340.0 372.66 1/12/2007 22/01/2008 To be sealed
BC2158 229615.46 6610536.67 337.0 351.18 3/12/2007 27/01/2008 To be sealed
Table 3 Exploration Drill Holes

15
Figure 2 Exploration Drill Hole Locations
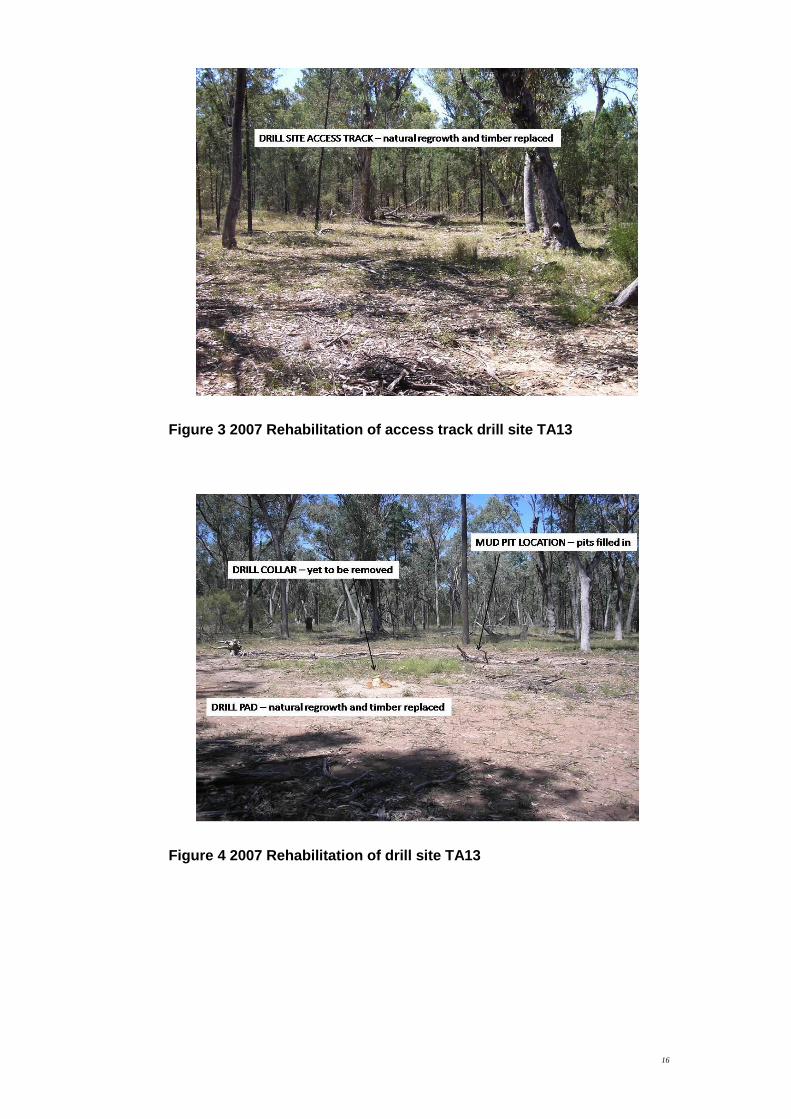
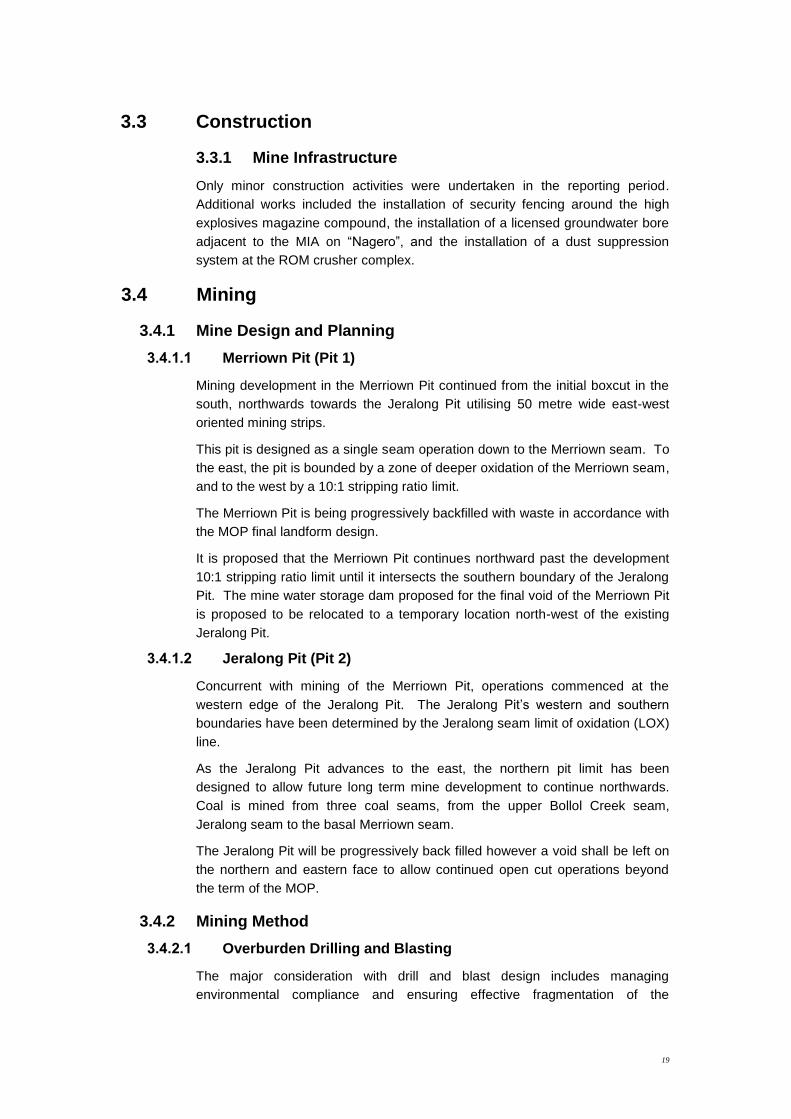
3.1.3 Drill Site Rehabilitation
Rehabilitation programs for 2007 drill sites are continuing. Activities have been
completed at sites BC2147 and BC2149. Partial rehabilitation has been
undertaken at sites BC2148, BC2150, BC2151 and BC2153. Rehabilitation of
the remaining sites will be undertaken once borehole sealing operations are
completed in March 2008.
16
Figure 3 2007 Rehabilitation of access track drill site TA13
Figure 4 2007 Rehabilitation of drill site TA13

17
3.2 Land Preparation
3.2.1 Existing Vegetation
Previous mapping of the site (Department of Land and Water Conservation
2002) indicated that the proposed mine infrastructure and development would
cover four main vegetation communities.
The four vegetation communities are:
Black-earth grassland
Riparian woodland
River Oak, Black Tea-tree woodland
White Cypress Pine, Ironbark Forest.
Details of the vegetation types are provided in the Flora and Fauna Assessment.
None of the above communities are listed as Endangered Ecological
Communities under either the NSW Threatened Species Conservation Act 1995
or the Environment Protection and Biodiversity Conservation Act 1999.
The dominant canopy species include White Box, Ironbark, Blakely‟s Red Gum
and White Cypress Pine. Recent studies and pre-clearing inspections indicate
that the vegetation mapping of the EIS appeared to be relatively accurate.
3.2.2 Vegetation Clearing
No vegetation clearing was undertaken in the reporting period. Additional
clearing is programmed for mid to late 2008.
3.2.3 Soil Types
Most of the soils within the lease area have developed from two major sources
of parent material. The parent materials are residuum of weathered sandy
conglomerates and alluvium and/or colluvium from weathering of surrounding
volcanic or sedimentary outcrops.
The texture of these soils ranges from gravely sandy clay loams to sandy clays.
There are basically three major types of soil groups in the lease area.
Detailed field observations of the soils have qualified soil mapping previously
prepared for the EIS. These observations indicate the area to be disturbed
during this MOP period can mainly be categorised as duplex soils (mainly
Sodosols) or structured loams (Tenosol and Rudosols).
The third soil type Lithsols are typically occupy the steeper sloping terrain and
ridge top areas, outside of the area of disturbance expected in this MOP
duration.
For most areas of the open cut area the soil profile consists of a sandy loam A
horizon developed upon a hard setting B_C Horizon.
Topsoil or A Horizon thickness varies across the area of operations from 50 mm
to 150 mm averaging at approximately 100mm.

18
The third soil type Lithsols are typically occupy the steeper sloping terrain and
ridge top areas, outside of the area of disturbance expected in this MOP
duration.
3.2.4 Soil Characteristics
For most areas of the open cut area the A horizon comprises recognisable A1
and A2 horizons, is non-saline, non sodic and slightly acidic. Compared with
other over-interburden material, while not considering the existing seed bank,
the A horizons are the most suitable plant growing media available for use in
rehabilitation.
Most of the strata are devoid of acid producing pyrites. The siltstone roof over
portions of the Braymont seam in the lease area have the potential to develop
acid producing conditions however, this type of material is not expected to be
encountered during the current MOP duration. If materials having the potential
to develop acid are identified they should be buried at a minimum of 2 metres
from the reclaimed surface.
As these sodic and potentially acid producing materials make up less than a
third of the total thickness of the overburden/interburden to be disturbed during
mining, appropriate scheduling of overburden/interburden emplacement will
ensure burial of these materials with the remaining non-saline, non-sodic
materials.
3.2.5 Soil Profile
For most areas of the open cut area the soil profile consists of a sandy loam A
horizon developed upon a hard setting B_C Horizon.
Topsoil or A Horizon thickness varies across the proposed varies from 50mm to
150mm.
Overburden material is highly variable. Overburden rock types include sandy
conglomerate, sandstone, siltstone, and shale/mudstone.
3.2.6 Topsoil stripping
A Cat D11R dozer and Cat 16H grader were used for the stripping of topsoil
from the areas of 2007 development operations. Recovered topsoil was loaded
into rear dump trucks by an Hitachi EX2500 hydraulic excavator and hauled
directly to reshaped areas on the OOPD for spreading to the required 100mm
thickness.
Quality control of the topsoil removal and replacement processes was
maintained throughout by regular inspections and by the introduction of a formal
„sign off‟ procedure executed by the environmental coordinator and the DEDIM
production supervisor.
A total of six hectares of topsoil stripping was undertaken in the 2007 reporting
period. A detailed topsoil plan of the Boggabri Mine is presented at the end of
this report in Attachment 4.
19
3.3 Construction
3.3.1 Mine Infrastructure
Only minor construction activities were undertaken in the reporting period.
Additional works included the installation of security fencing around the high
explosives magazine compound, the installation of a licensed groundwater bore
adjacent to the MIA on “Nagero”, and the installation of a dust suppression
system at the ROM crusher complex.
3.4 Mining
3.4.1 Mine Design and Planning
3.4.1.1 Merriown Pit (Pit 1)
Mining development in the Merriown Pit continued from the initial boxcut in the
south, northwards towards the Jeralong Pit utilising 50 metre wide east-west
oriented mining strips.
This pit is designed as a single seam operation down to the Merriown seam. To
the east, the pit is bounded by a zone of deeper oxidation of the Merriown seam,
and to the west by a 10:1 stripping ratio limit.
The Merriown Pit is being progressively backfilled with waste in accordance with
the MOP final landform design.
It is proposed that the Merriown Pit continues northward past the development
10:1 stripping ratio limit until it intersects the southern boundary of the Jeralong
Pit. The mine water storage dam proposed for the final void of the Merriown Pit
is proposed to be relocated to a temporary location north-west of the existing
Jeralong Pit.
3.4.1.2 Jeralong Pit (Pit 2)
Concurrent with mining of the Merriown Pit, operations commenced at the
western edge of the Jeralong Pit. The Jeralong Pit‟s western and southern
boundaries have been determined by the Jeralong seam limit of oxidation (LOX)
line.
As the Jeralong Pit advances to the east, the northern pit limit has been
designed to allow future long term mine development to continue northwards.
Coal is mined from three coal seams, from the upper Bollol Creek seam,
Jeralong seam to the basal Merriown seam.
The Jeralong Pit will be progressively back filled however a void shall be left on
the northern and eastern face to allow continued open cut operations beyond
the term of the MOP.
3.4.2 Mining Method
3.4.2.1 Overburden Drilling and Blasting
The major consideration with drill and blast design includes managing
environmental compliance and ensuring effective fragmentation of the

20
overburden. The major waste constituent is conglomerate. Drill and blast
design focuses on the following objectives:
control of air blast and ground vibration
minimise fly rock
optimise fragmentation
reduce coal seam damage.
Blasting of mining strips in the Jeralong Pit that fall within 500 metres of the
Leard Forest Road, require temporary road closures.
Figure 5 Drilled interburden, northern extents of the Merriown Pit
3.4.2.2 Overburden Removal
Overburden/interburden removal is carried out by Hitachi EX3600 and Hitachi
EX-2500 hydraulic excavators in backhoe configuration loading Cat 789 and Cat
785 rear dump trucks respectively.

21
Figure 6 Interburden Removal by Hitachi EX3600, northern extent of Jeralong Pit
The waste is hauled to both in-pit and ex-pit emplacements via haul roads
maintained within the advancing pit face and emplacement faces.
3.4.2.3 Coal Extraction
Coal is free dug using an Hitachi EX2500 hydraulic excavator and loaded into
Cat 785 rear dump trucks for transport to the ROM crusher pad. Coal is
stockpiled on the ROM pad for further blending and crushing.
Figure 7 Coal mining by Hitachi EX2500, Jeralong Pit

22
3.5 Coal Processing
Coal is recovered from the ROM pad by a Komatsu WA-600 front-end-loader
and trammed to a 500 tph crusher for sizing to a 50 mm x 0 mm size
specification. Product coal is batch loaded into over-mass B-double coal
haulers for transport to the Boggabri Coal Terminal (BCT), via the private haul
road. The BCT comprises a product stockpile and dozer push-reclaim system,
coal conveyors, train loading bin and 3 km rail loop. Coal is transported via rail
to the Port of Newcastle.
Figure 8 Coal loading for transport to the product stockpile at the rail
terminal
3.6 Coal Stockpiles
A 200m x 230 m ROM coal stockpile is located adjacent to crushing facility with
a nominal capacity of 100,000 tonnes.
The product coal stockpile at the rail loading facility has a nominal maximum
capacity of 90,000 tonne.
ROM coal is processed to a product specification sizing of 50 mm x 0 mm.
The stockpiled coal has a relatively high calorific value and low ash content.
The coal is also relatively low in sulphur, chlorine, phosphorous and trace
elements.
3.7 Waste Management
Waste emplacement areas have been created through the clearing of
designated out of pit areas and by in–pit emplacement in mined-out sections of
the mine. The main emplacement area is immediately bounded by the Merriown
Pit to the east, the Jeralong Pit to the north and the EIS surface mine limit to the
west and south.

23
At the end of the MOP period the emplacement area will be approximately 1,500
m long (north-south) and 1,000m wide (east-west). The majority of the
emplacement is designed to an RL of 330 m AHD, approximately 40 metres
above the natural ground level (varying with the slope of the landform). Side
slopes are designed at a maximum angle of 10 degrees and incorporate 8 metre
wide catch benches at 20 metre vertical intervals. Water management from the
emplacement areas consists of a system of contour drains installed on the catch
benches and drainage flumes that direct water to sediment control dams located
on natural surface.
Particular care is taken with the positioning of night lighting sets on the waste
dumps adjacent to the Leard Forest Road to avoid any hazard to road users due
to fugitive light.
The emplacement is progressively reshaped, spread with topsoil and an 8 ha
section has been rehabilitated during 2007 in accordance with the rehabilitation
management plan. Another 17 ha section is scheduled for rehabilitation in early
2008.
Cumulative Production
Start of Reporting Period (bcm)
At end of Reporting Period (bcm)
End of Next Reporting Period
(bcm)
Topsoil Stripped 371,896 377,886 406,168
Topsoil Replaced 5,000 13,000 30,241
Waste Rock 6,926,891 19,561,550 29,349,050
Coal 235,193 1,561,758 2,911,758
Processing Waste 0 0 0
Production 7,538,980 21,511,494 32,697,216
Table 4 Production and Waste Summary
3.8 Water Management
3.8.1 General
The basic approach to water management is to segregate clean runoff, dirty
runoff, and contaminated water.
The original site water balance prepared by Parsons Brinckerhoff indicated that
the BCM is likely to produce an excess quantity of groundwater.
The BCM holds a number of existing licenses for surface and ground water on
the BC properties “Daisymede”, “Heathcliffe” and Nagero. In the event of an
extended dry period, or if the mine does not produce an excess of water, the
BCM will utilise these existing water licenses to provide water for dust
suppression operations.
During 2007 it was recognised that the current water management plan was not
meeting site requirements. Parsons Brinckerhoff was commissioned to conduct
a review of the water management plan and to make recommendations for
improvement. This review was completed in late 2007. From this review a new
water management plan was prepared and submitted for approval in early 2008.
A copy of the new water management plan has already been sent to all of the
24
recipients of this report and therefore has not been included in the attachments
to this report.
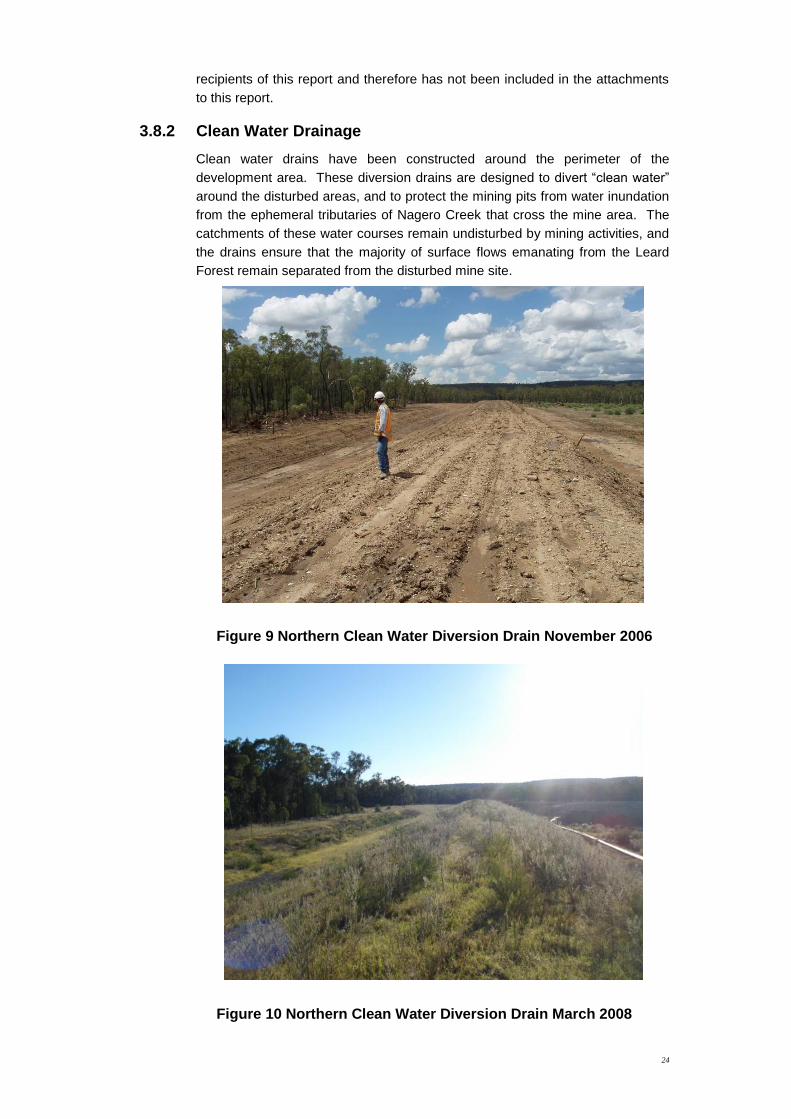
3.8.2 Clean Water Drainage
Clean water drains have been constructed around the perimeter of the
development area. These diversion drains are designed to divert “clean water”
around the disturbed areas, and to protect the mining pits from water inundation
from the ephemeral tributaries of Nagero Creek that cross the mine area. The
catchments of these water courses remain undisturbed by mining activities, and
the drains ensure that the majority of surface flows emanating from the Leard
Forest remain separated from the disturbed mine site.
Figure 9 Northern Clean Water Diversion Drain November 2006
Figure 10 Northern Clean Water Diversion Drain March 2008
25
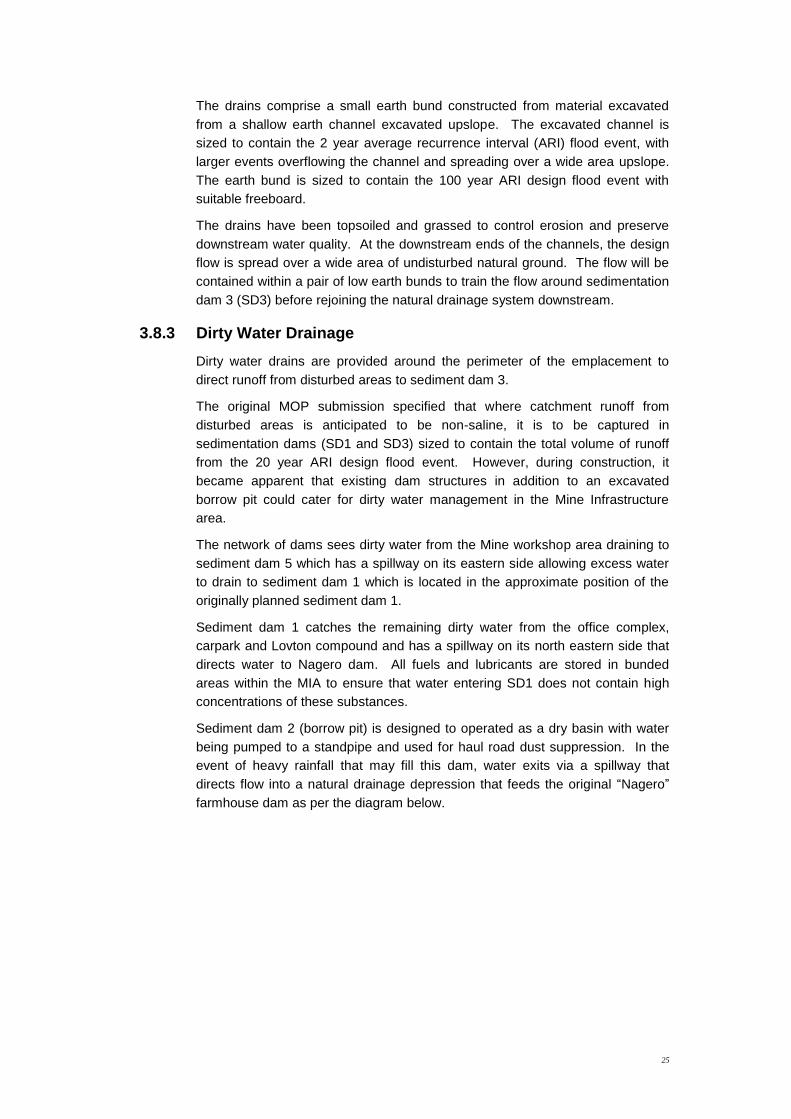
The drains comprise a small earth bund constructed from material excavated
from a shallow earth channel excavated upslope. The excavated channel is
sized to contain the 2 year average recurrence interval (ARI) flood event, with
larger events overflowing the channel and spreading over a wide area upslope.
The earth bund is sized to contain the 100 year ARI design flood event with
suitable freeboard.
The drains have been topsoiled and grassed to control erosion and preserve
downstream water quality. At the downstream ends of the channels, the design
flow is spread over a wide area of undisturbed natural ground. The flow will be
contained within a pair of low earth bunds to train the flow around sedimentation
dam 3 (SD3) before rejoining the natural drainage system downstream.
3.8.3 Dirty Water Drainage
Dirty water drains are provided around the perimeter of the emplacement to
direct runoff from disturbed areas to sediment dam 3.
The original MOP submission specified that where catchment runoff from
disturbed areas is anticipated to be non-saline, it is to be captured in
sedimentation dams (SD1 and SD3) sized to contain the total volume of runoff
from the 20 year ARI design flood event. However, during construction, it
became apparent that existing dam structures in addition to an excavated
borrow pit could cater for dirty water management in the Mine Infrastructure
area.
The network of dams sees dirty water from the Mine workshop area draining to
sediment dam 5 which has a spillway on its eastern side allowing excess water
to drain to sediment dam 1 which is located in the approximate position of the
originally planned sediment dam 1.
Sediment dam 1 catches the remaining dirty water from the office complex,
carpark and Lovton compound and has a spillway on its north eastern side that
directs water to Nagero dam. All fuels and lubricants are stored in bunded
areas within the MIA to ensure that water entering SD1 does not contain high
concentrations of these substances.
Sediment dam 2 (borrow pit) is designed to operated as a dry basin with water
being pumped to a standpipe and used for haul road dust suppression. In the
event of heavy rainfall that may fill this dam, water exits via a spillway that
directs flow into a natural drainage depression that feeds the original “Nagero”
farmhouse dam as per the diagram below.
26
Figure 11 Plan of MIA Water Management
Sediment dam 3 is designed to operate as a dry basin; with a (normally closed)
low level slow release outlet provided to ensure (water quality permitting) the
contents of the dams may be emptied over a 10 day period. This will allow
coarse particles in the runoff to settle before leaving the site. Where the
catchment potentially contains large quantities of stockpiled coal (SD2 and
SD4), sedimentation dams are sized to contain the total volume of run-off from a
100 year ARI 72 hour design storm event. Captured water is preferentially re-
used for dust suppression on stockpiles and roads.
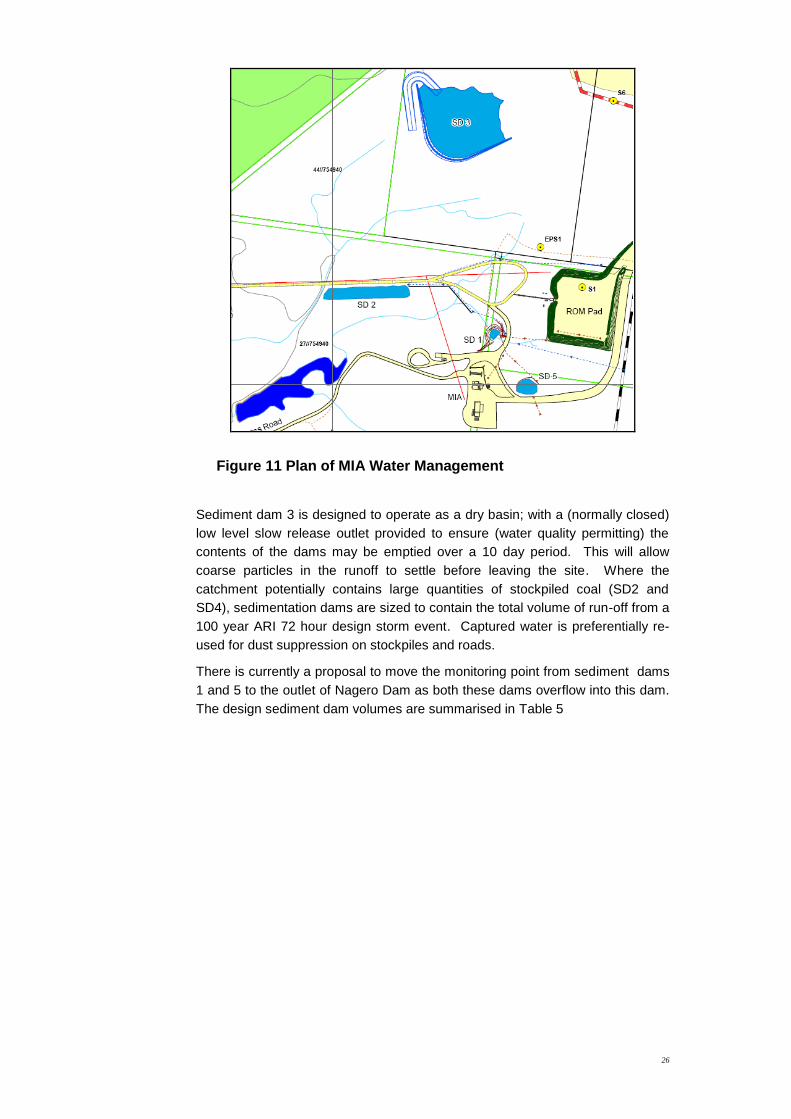
There is currently a proposal to move the monitoring point from sediment dams
1 and 5 to the outlet of Nagero Dam as both these dams overflow into this dam.
The design sediment dam volumes are summarised in Table 5
27
Location Description
Stored Water Catchment Area (ha)
Sizing Criteria Volume (ML)
SD1 &
SD 5
Mine Infrastructure Area
Dirty runoff from MIA 19
6
V = 20 year tc plus sediment
1 &1.5
SD2 Coal Processing Area
Dirty runoff from crusher and stockpiles (controlled discharge)
13 V = 100 year 72h plus sediment
20
SD3 SW corner of lease area
Location 45 V = 20 year tc plus sediment
35
SD4 Rail Loop Dirty runoff from Rail Loop (controlled discharge)
5 V = 100 year 72h plus sediment
8.1
Nagero Dam
Mine Infrastructure Area
Clean runoff from Nagero property & emergency dirty runoff
79
20
Table 5 Sediment Dam Design Volumes
3.8.4 Contaminated Water Collection
During 2007 all contaminated water was retained in dedicated contaminated
water dams for use in mine dust suppression operations. Additional storage of
accumulated water in excess of the contaminated water dam capacity will be
transferred to the Jeralong pit void. A new dam MW2 is scheduled for
construction in early 2008 to replace the existing one that will be
decommissioned ahead of mining development.
Volumes Held
Start of Reporting Period (cu.m)
At end of Reporting Period (cu.m)
Storage Capacity
(cu.m)
Clean Water 0 0 0
Dirty Water 0 30 58.3
Controlled discharge 0 30 31
Contaminated Water 0 75 150
Table 6 Stored Water

28
Location Location Description
Stored Water Sizing Criteria Volume (ML)
MW1 Year 2 Jeralong Pit
Contaminated Water
Maximum accumulated contaminated water volume from wettest year on record according to historical simulation water balance modelling
92
Pit 2 Void SW corner of site
Contaminated Water
Maximum accumulated contaminated water volume from wettest 6yr period on record according to historical simulation water balance modelling
800
MW2
S of MIA Contaminated Water
Not yet constructed 300
MW3
N of MW1 Contaminated Water
Not yet constructed 150
Table 7 Contaminated Water Storage
3.9 Hazardous Materials
A number of potentially hazardous materials have been, and are being used
within the operation of the BCM. These materials include:
Diesel fuel
Ammonium nitrate
ANFO
High explosives and detonators
Lubricating oils and greases
Cleaning agents
Herbicides
Appropriate licenses, for the storage and handling of these hazardous materials,
have been obtained by the mining contractor.
3.9.1 Diesel
Diesel fuel is stored in the maintenance workshop area in two double skinned,
aboveground tanks plumbed in series as „slave and master”, with a total nominal
capacity of approximately 110,000 litres. Fuel consumption is approximately
135,000 litres per week.
The transport services contractor also has a 55,000 litre double-skinned fuel
storage tank located adjacent to their workshop within the MIA.

29
Figure 12 Diesel Fuel Storage Tank
3.9.2 Ammonium Nitrate
Ammonium nitrate is used in the blasting process.
Ammonium nitrate is stored in one tonne bulker bags at the bunded Downer EDI
Blasting Services compound in an above ground storage shed. The AN storage
shed is fitted with lockable access gates and is subject to daily inspections to
safeguard against theft and/or spillages.
3.9.3 ANFO
ANFO is used in the blasting process and is delivered as required by mobile
mixing units (MMU) to the blast site.
3.9.4 Detonators
Detonators and other high explosives are used in the blasting process.
Detonators are stored in purpose built isolated magazines to the west of the
DEBS compound and at the toe of the ex-pit emplacement.
3.9.5 Hydraulic/Lubricating Oils
Hydraulic/lubricating oils are stored in double skinned above ground tanks near
the truck wash down pad next to the maintenance workshop area.
Waste oils are stored in a bulk oil tank, for regular collection by a licensed waste
contractor.

30
Figure 13 Waste Oil Awaiting Collection
3.9.6 Cleaning Agents
Cleaning agents are used in the equipment wash down facility used for
preparing the fleet of mobile equipment such as dozers, water trucks, lighting
plant and generators for maintenance.
The cleaning agents are stored in covered stores within the maintenance
workshop area, adjacent to the truck wash. All water collected in the sealed and
bunded truck wash is collected in a 55,000 litre tank for re-circulation at the
facility.
Figure 14 Cleaning Fluids Stored Beside Wash Bay Area
31
3.9.7 Herbicides
Herbicides will be used in the rehabilitation process if weed infestation becomes
an issue. Herbicides are also used around the site for noxious weed control
throughout the mine site. Herbicides are not stored on site but are purchased
on an as-needs basis.
3.9.8 Material Safety Data Sheets
Material Safety Data Sheets (MSDS‟s) for all hazardous material stored on site
are maintained by BC, Downer EDI and Lovton personnel with copies being
provided at appropriate locations throughout the project site such as,
maintenance workshops and stores and rail loading facility.
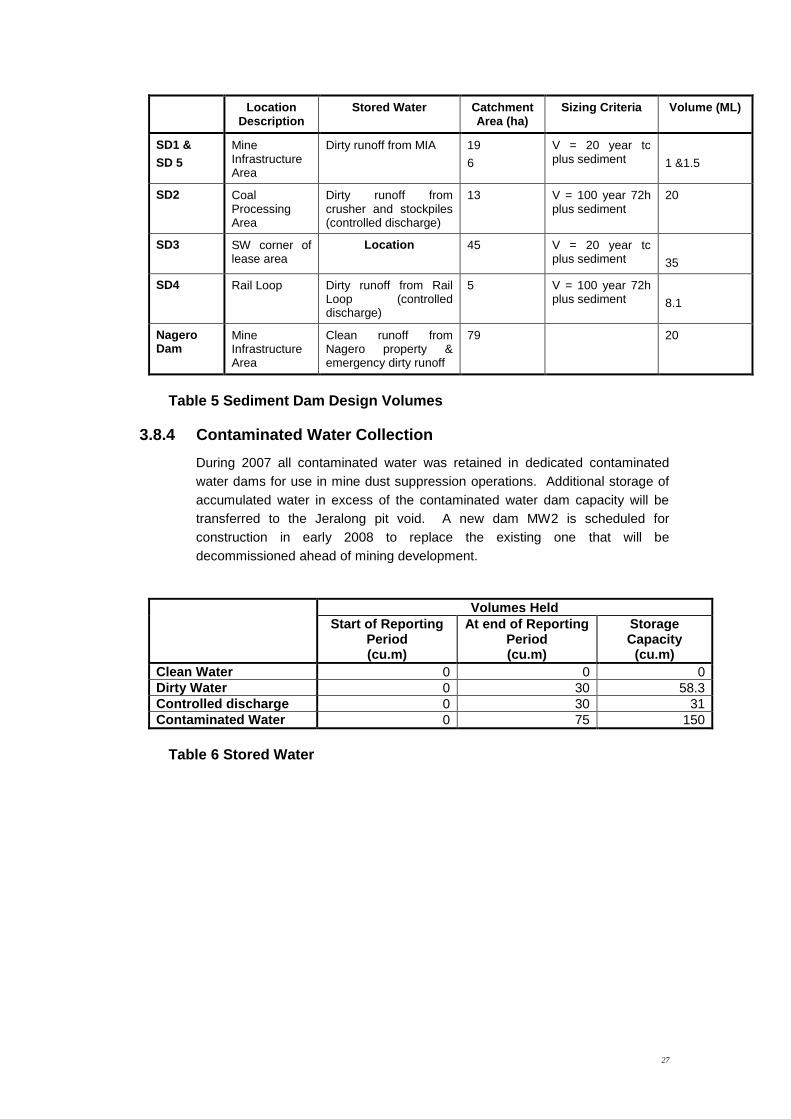
4. ENVIRONMENTAL MANAGEMENT AND PERFORMANCE
An “Environmental Risk Identification Matrix“ was used as a risk assessment
tool to identify mine activities, processes and facilities which require control
strategies to ensure environmental protection and compliance with conditions of
lease, licence and development consent.
Upon completion of the risk assessment process, all aspects relevant to
environmental performance were identified and incorporated in subsequent
Environmental Management Plans (EMPs). These EMPs are an integral part of
the operation‟s Environmental Management System (EMS).
Environmental Management Plans Construction Operations
Air Quality Management Plan X X
Site Water Management Plan (Surface/Ground Water and Erosion and Sedimentation Control)
X X
Flora and Fauna Management Plan X X
Rehabilitation and Land Management Plan (Rehabilitation, weed and soil)
X X
Noise, Blast and Vibration Management Plan X X
Hydrocarbon and Contaminated Land Management Plan
X X
Aboriginal Archaeology and Cultural Heritage Management Plan
X X
Waste Management Plan X X
Public Safety Management Plan – (Traffic, Bushfire, Lighting, Security)
X X
Table 8 Summary of Environmental Management Plans (EMP’s)
Environmental monitoring systems are in place to ensure compliance with the
EPL. These include continuous monitoring of weather conditions, dust
monitoring, noise and vibration monitoring and water quality testing. The site
map presented in Attachment 3 shows the locations of all monitoring sites.

32
4.1 Weather Monitoring
4.1.1 General
The Boggabri Coal Mine monitors local weather conditions using an automatic
weather station comprised of µSmart series sensors and data logger supplied
by Monitor Sensors. Monitoring is recorded at 15 minute intervals for
temperature, rainfall, wind speed and direction and solar radiation. The site is
labelled W1 on Attachment 3. The data collected is then presented in the
Boggabri Mine monthly environmental report.
4.1.2 Temperature
Maximum, minimum and average temperatures are recorded and reported in the
BCM monthly environmental reports. Figure 15 below shows monthly
temperature records for the reporting period
Figure 15 Temperature 2007
4.1.3 Rainfall
Rainfall is measured using an RG5 type flow through monitor recording every 15
minutes with 24 hours to 9am recorded on a 24 hour basis. Rainfall totals for
the reporting period are presented in Figure 16 below.

33
Figure 16 Rainfall Totals 2007
4.1.4 Wind
2007 wind data is presented in the wind roses below. Wind speed values are
shown in kilometres per hour. The wind roses show wind speed and direction
on a three monthly basis for the reporting period.
Figure 17 Wind Summary 2007
34
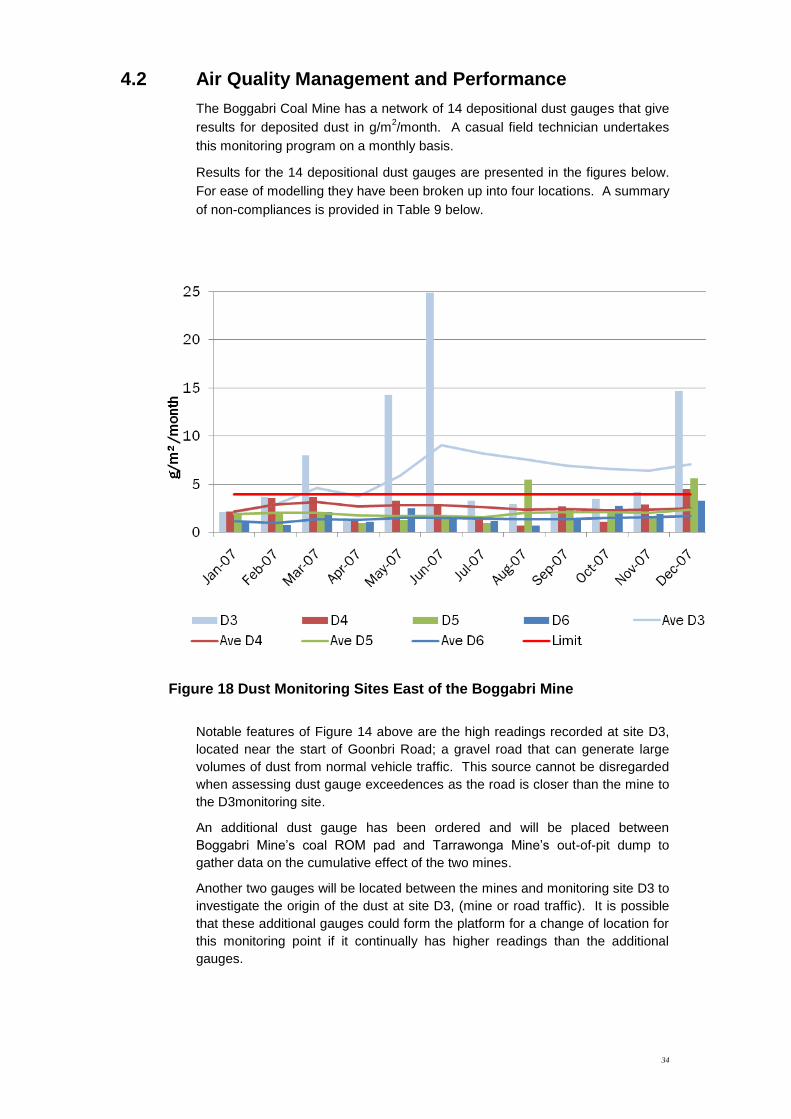
4.2 Air Quality Management and Performance
The Boggabri Coal Mine has a network of 14 depositional dust gauges that give
results for deposited dust in g/m2/month. A casual field technician undertakes
this monitoring program on a monthly basis.
Results for the 14 depositional dust gauges are presented in the figures below.
For ease of modelling they have been broken up into four locations. A summary
of non-compliances is provided in Table 9 below.
Figure 18 Dust Monitoring Sites East of the Boggabri Mine
Notable features of Figure 14 above are the high readings recorded at site D3,
located near the start of Goonbri Road; a gravel road that can generate large
volumes of dust from normal vehicle traffic. This source cannot be disregarded
when assessing dust gauge exceedences as the road is closer than the mine to
the D3monitoring site.
An additional dust gauge has been ordered and will be placed between
Boggabri Mine‟s coal ROM pad and Tarrawonga Mine‟s out-of-pit dump to
gather data on the cumulative effect of the two mines.
Another two gauges will be located between the mines and monitoring site D3 to
investigate the origin of the dust at site D3, (mine or road traffic). It is possible
that these additional gauges could form the platform for a change of location for
this monitoring point if it continually has higher readings than the additional
gauges.

35
Figure 19 Dust Monitoring Sites West of the Boggabri Mine
Figure 20 Dust Monitoring Sites Adjacent to the Coal Terminal

36
Figure 21 Dust Monitoring Sites South of the Haul Road

37
Month Site Value
(g/m2/month)
Possible Explanation
January D13 4.10 Site located next to a cultivation paddock
March D3 8.00 The proximity of this site to the start of
Goonbri road where it has the most local
traffic passing by, contributes to the elevated
dust readings at this site.
May D3 14.30 As above
June D3
D14
24.90
10.00
As above
This site was cultivated in June prior to sowing
July D14 8.40 The paddock in which D14 is located was sown to
feed oats during this month.
August D5 5.50 This site is located in a pasture paddock that
is showing signs of over grazing.
November D3
D13
D14
4.20
5.00
5.40
The proximity of this site to the start of
Goonbri road where it has the most local
traffic passing by, contributes to the elevated
dust readings at this site.
Strong winds and persistent dry weather
combined with little ground cover due to
overgrazing in adjacent paddocks.
December D3
D4
D5
D13
14.70
4.50
5.60
12.70
D3, D4 and D5 are all close to the Goonbi
Road. Average temperatures of close to 30˚
and considerable use of the road by harvest
trucks.
Pasture paddock where D13 is located was
overgrazed and then cultivated
Table 9 Summary of non compliant monthly dust observations for the Boggabri Mine

38
In addition to the 14 depositional dust gauges, the Boggabri Coal Mine also has
a „Hi Vol‟ sampler measuring PM10, yielding results in µg/m³. A summary of
these results is shown in Figure 22 below.
Figure 22 PM10 Results 2007
The PM10 monitor had to be repaired early in 2007. Because of this there were
no readings recorded between the 6th February and the 15
th of April. Note the
high result obtained for the 15th April (102 μg/m³). This was the first reading
taken after the site had been repaired and is therefore not considered to be an
accurate reading.
4.3 Site Water Management and Performance
4.3.1 Surface Water
Discharge and monitoring points 1, 2, 3 and 4 (SD1, SD2, SD3 and SD4) are to
be sampled at “Special Frequency 1” as detailed in condition M2 of EPL 12407;
where Special Frequency 1 means the collection of samples as soon as
practicable after a discharge, and in any case not more than twelve hours after a
discharge commences.
Discharge and monitoring points 5 and 6 (SW1 and SW2) are to be sampled at
“Special Frequency 2” as detailed in condition M2 of EPL 12407; where “Special
Frequency 2” is “as soon as practicable after a wet weather discharge from
points 1, 2 and 3, and in any case not more than 12 hours after a discharge
commences”. Monitoring Point 36 was only sampled and analysed once during
the 2007 reporting period. The reason for this non-compliance is the ongoing
discussions to move this monitoring point to the Nagero Dam.
39
Monitoring Points 37 and 38 were only sampled and analysed twice during the 2007 reporting period. This was an oversight by Boggabri Mine. Monitoring Point 39 had not received any water at the specified monitoring times. Consequently there were no samples analysed.
A discharge event occurred in late December 2007. As no staff were on site
due to the mine being closed for the Christmas shut down period (19th
December – 7th January) this monitoring event was missed.
In order to prevent recurrence of this non-compliance staffing arrangements will
be made so that during periods such as these, monitoring activities will be
covered either by BC staff or contractors.
4.3.2 Groundwater
During the June monitoring event the micro purge equipment failed and had to
be returned to the supplier for repairs. The monitoring programme was finished
in August 2007, once repairs were carried out.
Monitoring point 18 was missed in August 2007, but was then reported in
September. Monitoring data was picked up from the Tarrawonga Mine for the
January and June monitoring periods as this monitoring point is analysed by
both mines.
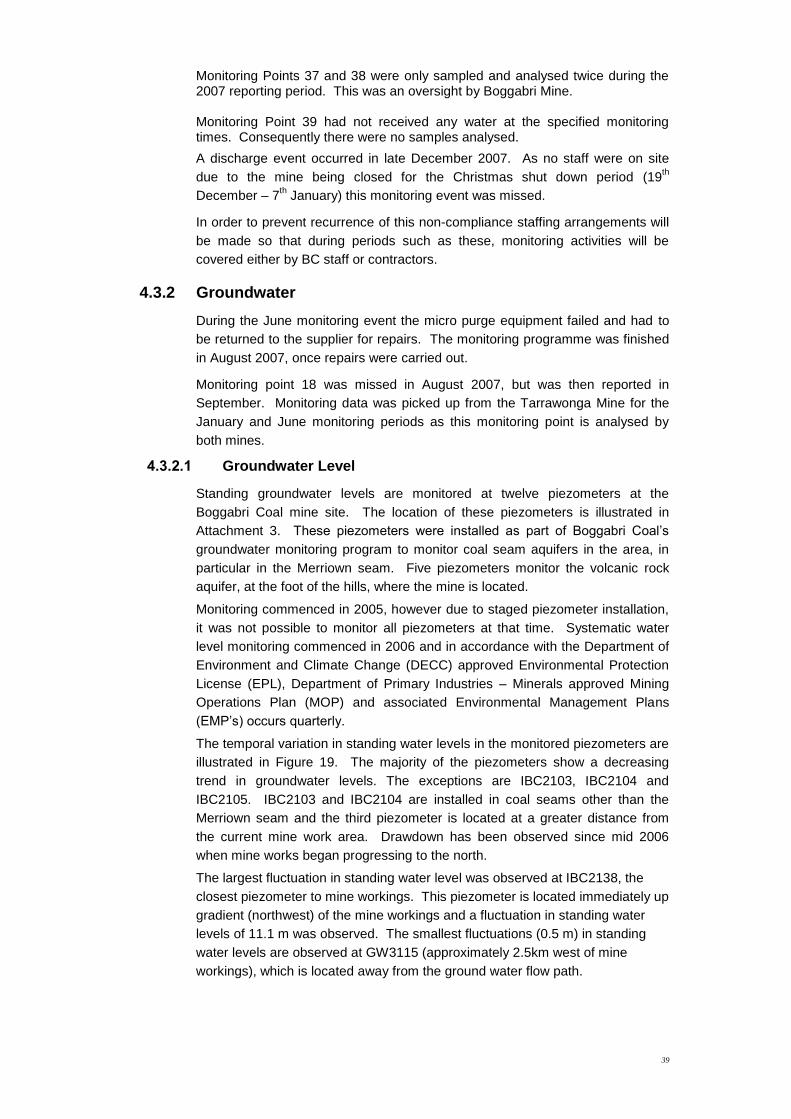
4.3.2.1 Groundwater Level
Standing groundwater levels are monitored at twelve piezometers at the
Boggabri Coal mine site. The location of these piezometers is illustrated in
Attachment 3. These piezometers were installed as part of Boggabri Coal‟s
groundwater monitoring program to monitor coal seam aquifers in the area, in
particular in the Merriown seam. Five piezometers monitor the volcanic rock
aquifer, at the foot of the hills, where the mine is located.
Monitoring commenced in 2005, however due to staged piezometer installation,
it was not possible to monitor all piezometers at that time. Systematic water
level monitoring commenced in 2006 and in accordance with the Department of
Environment and Climate Change (DECC) approved Environmental Protection
License (EPL), Department of Primary Industries – Minerals approved Mining
Operations Plan (MOP) and associated Environmental Management Plans
(EMP‟s) occurs quarterly.
The temporal variation in standing water levels in the monitored piezometers are
illustrated in Figure 19. The majority of the piezometers show a decreasing
trend in groundwater levels. The exceptions are IBC2103, IBC2104 and
IBC2105. IBC2103 and IBC2104 are installed in coal seams other than the
Merriown seam and the third piezometer is located at a greater distance from
the current mine work area. Drawdown has been observed since mid 2006
when mine works began progressing to the north.
The largest fluctuation in standing water level was observed at IBC2138, the
closest piezometer to mine workings. This piezometer is located immediately up
gradient (northwest) of the mine workings and a fluctuation in standing water
levels of 11.1 m was observed. The smallest fluctuations (0.5 m) in standing
water levels are observed at GW3115 (approximately 2.5km west of mine
workings), which is located away from the ground water flow path.
40
In piezometers IBC2110 and IBC2111, which are installed in the shallow and deep
volcanics, the standing water level declined by about 2 m during the October 2005 to
April 2007 period. These bores are located in the vicinity of the “Nagero” bore which
is being pumped as a water supply. The standing water levels have since
recovered, being close to pre-mining levels.
Between August and October 2007 no further decline in standing water level has
occurred.
The interpreted groundwater flow in the aquifer remains in the south-westerly
direction, with no significant trends observed.
Figure 23 Bore Hole Standing Water Level

41
4.3.2.2 Groundwater pH
The water is in general neutral with pH ranging from 6.5 to 7.5. IBC2110 is slightly
more alkaline than the other piezometers. All piezometers show the same
fluctuations in pH during the year, with the exception of IBC2110. The standard
deviation of pH value for all piezometers is within 5 % of the mean, with no
significant trends observed.
Figure 24 Bore Hole pH
4.3.2.3 Groundwater Electrical Conductivity
The highest conductivity value (3500 to 4000 uS/cm) was measured in GW3115
(located approximately 2.5km west of mine workings) while the lowest values were
recorded in piezometers to the north, which have higher elevations (IBC2102,
IBC2103, IBC2104 and IBC2105). The water quality in these piezometers has an
EC below 1000 uS/cm, while EC in the remaining piezometers varies from 1500 to
2500 uS/cm.
The standard deviation of measured EC is generally within 20% of the mean, and no
significant trends were observed for any of the bores. The monitoring in August
2007 indicates elevated EC comparing to previous monitoring. This is most likely
the result of the decline in standing water levels at that time, which has been
followed by a decrease in EC and the stabilisation of standing water levels.
In general the electrical conductivity values are below the upper limit guidelines for
irrigation and livestock use.

42
Figure 25 Bore Hole Electrical Conductivity
4.3.2.4 Groundwater Temperature
Temperatures are generally between 20 to 22 degrees. Seasonal temperature
variations can be observed in all bores. The highest standard deviation occurs in
bores located in the north of the mine lease and in shallow volcanics. This may
indicate that the groundwater at those locations is in contact with surface water
and/or is in the recharge area. Overall, the deviation is within 10 % of the mean
value with no significant trends observed.
4.3.2.5 Groundwater Redox
Redox values vary from negative -200 mV to 150 mV. Negative conditions prevail in
IBC2110, GW3115 and IBC2105 (-200 mV to -100 mV), while IBC2102, IBC 2103,
IBC2104 are positive (0 mV to 100 mV). Fluctuations over time are small in
comparison to differences in redox variations between bores. No significant trends
were observed.
Standard deviation can be up to 50 % of the mean, however this is considered to be
within the normal variation for field measurements of redox potential.
4.3.2.6 Groundwater Major ions
Major ions (calcium, sodium, potassium, magnesium, sulphate, chloride,
bicarbonate) were analysed during the half yearly monitoring events. The dominant
water types appear to be sodium and bicarbonate based, however, water type is
variable between bores and also with sample date. There does not appear to be
any trends associated with geology.

43
4.3.2.7 Groundwater Metals
Groundwater extracted from the piezometers was analysed for the following metals:
arsenic, cadmium, chromium, copper, lead, nickel, zinc and iron. Concentrations of
metals in most bores were below laboratory detection limits.
Metal concentrations were below guidelines for irrigation and stock for all metals
with the exception of iron, as expected for groundwater samples. Iron levels are only
marginally above the guideline concentrations (0.3 mg/L for irrigation and 0.2 mg/L
for stock) in bores IBC2102, IBC2103, IBC2105, IBC2115, IBC3115 and IBC2111. In
bore IBC2111 the pre-mining concentrations of iron were above the ANZECC (2000)
guidelines.
No trends were observed in metal concentrations for any of the bores.
4.3.2.8 Groundwater Nutrients
The nutrients (ammonia, nitrite and nitrate) were analysed with nitrate below
detection limits and nitrate values were below the guideline values for stock and
irrigation in most piezometers. Ammonia was detected at concentrations between
0.5 mg/L and 0.6 mg/L, slightly above the guideline value (0.5 mg/L) at IBC2113,
IBC2114, IBC2115, IBC2139 and IBC20432.
No trends in nutrient concentrations were observed.
4.4 Flora and Fauna Management and Performance
No new areas were cleared in 2007.
Specialist consultant ecologists from Parsons Brinckerhoff have been engaged to
perform regular ecological monitoring. This monitoring relates to the general
impacts of mining activities on native vegetation, fauna habitats and biodiversity
within Leard State Forest and does not relate to monitoring of the rehabilitation
program.
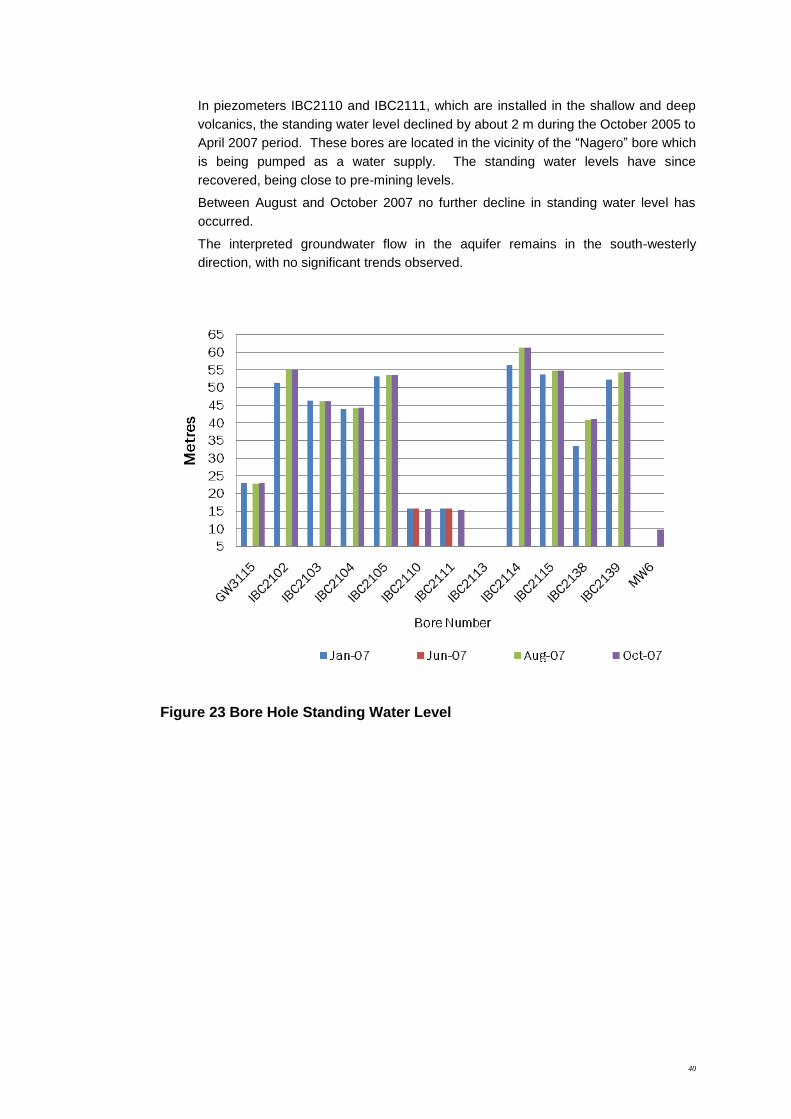
4.4.1 Monitoring Results
There was one survey event carried out during 2007 between 29th March and 6
th
April. No statistical analysis of this data has been undertaken as it was considered
to be too short a time period for any meaningful analysis to be undertaken.
Statistical analysis of this data will be carried out as part of the scheduled survey
event in April 2008. The survey locations are shown in Table 10 and the actual
locations of the various monitoring points are shown in the following figures.
44
Figure 26 Ecological Survey Sites in Leard State Forest

45
Figure 27 Ecological Survey Sites at Rocklea

46
Figure 28 Ecological Survey Sites in Vickery State Forest

47
Survey
Location
Site
Reference
No:
Location (MGA94
Zone 56)
Direction of
Transects
Slope of
Transects
Easting Northing A B A B
Leard
State
Forrest
LSF 1 226825 6614004 54 250 4 2
LSF 2 230545 6614270 17 90 1 -1
LSF3 226070 6611510 225 77 -1 -2
LSF4 230169 6609296 219 295 1 -2
Vickery
State
Forrest
VSF 1 235906 6596010 3 157 2 7
VSF2 235212 6597274 177 230 -3 5
VSF3 234902 6596744 177 342 2 -1
VSF4 237432 6594345 336 138 2 -2
“Rocklea”
Property
ROC 1 2130 6607181 105 195 5 5
ROC2 213016 6607172 286 169 7 8
ROC3 213614 6606534 303 13 15 6
ROC4 213713 6605664 75 108 2 -3
Table 10 Ecological Survey, Site Locations
4.5 Rehabilitation and Land Management and Performance
4.5.1 Revegetation
Rehabilitation aspects of this MOP have, and will be progressively developed and
implemented through the mine life with consideration given to the “Strategic
Framework for Mine Closure” developed by the Australian and New Zealand
Minerals and Energy Council.
Topsoil has been salvaged from all stripping areas and stockpiled appropriately in a
designated area east of the Merriown Pit. The topsoil stockpile and all other
disturbed areas have been seeded with a stabilisation seed mix
In November 2007 the washouts on the batter were repaired using a laser buket.
The area was then hilled for tree planting using a savannah plough to make the hills
approximately 350mm high and 5m apart. The laser bucket was used to rip in
between the hills to a depth of 300mm. The area was then aerially sown with
superbrew seed mix comprising Bisset Creeping Blue Grass (10%), Bare Fine-cut
Rhodes (70%), Green Panic (10%) and Premier Digitaria (10%). at a rate of 60kg
per hectare

48
Figure 29 Laser bucket Repairing Washouts on Batter
Figure 30 Savannah Plough used to Rip and Mound for Tree Planting

49
Figure 31 Preparation of Final Landform for Aerial Seeding November 2007
Figure 32 Forming Hills and Ripping of Batter Prior to Aerial Seeding November 2007

50
Figure 33 Aerial Seeding of Prepared Topsoil 2007
As at the end of 2007, approximately 13 ha (5 ha in 2006 and 8 ha in 2007) of
overburden dump had undergone reshaping to a final landform slope of 10 degrees,
with topsoil respread as a 100mm layer. All of this area has been seeded and
mounded in preparation for tree planting in March/April 2008.
Figure 34 Rehabilitation after Aerial Seeding January 2008
A good germination was achieved over the majority of the area helped by increased rain in the later part of 2007
51
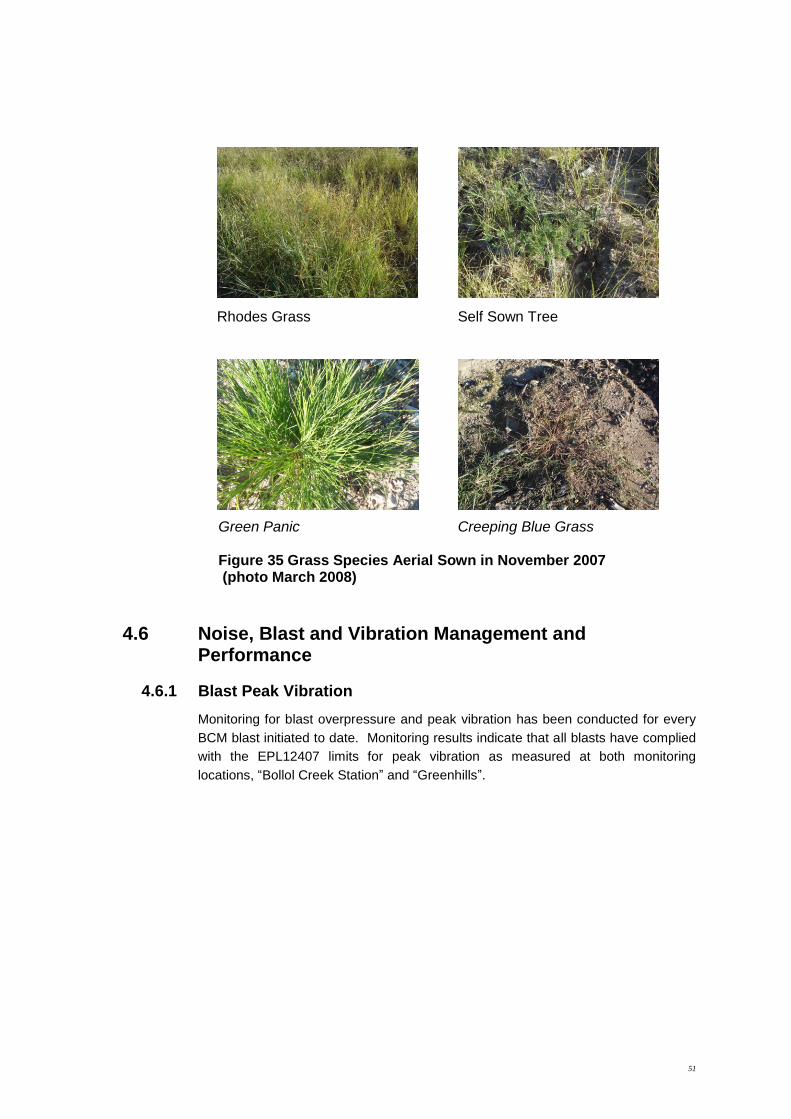
Rhodes Grass Self Sown Tree
Green Panic Creeping Blue Grass
Figure 35 Grass Species Aerial Sown in November 2007 (photo March 2008)
4.6 Noise, Blast and Vibration Management and Performance
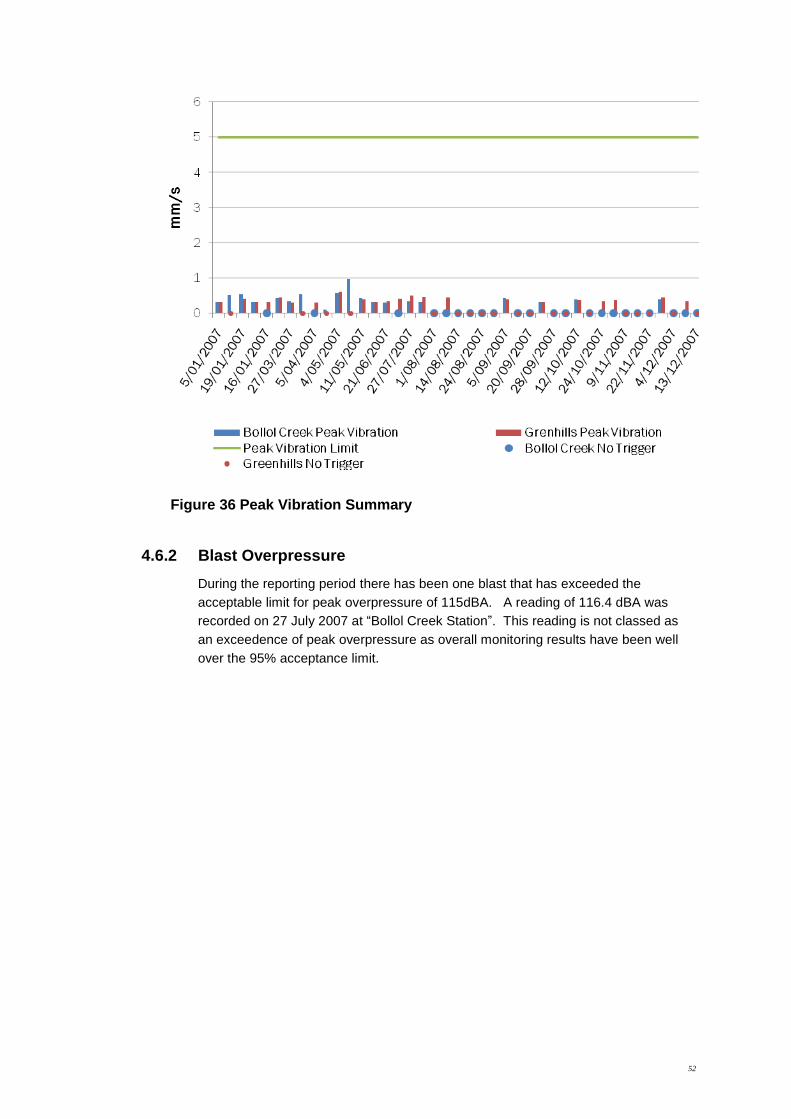
4.6.1 Blast Peak Vibration
Monitoring for blast overpressure and peak vibration has been conducted for every
BCM blast initiated to date. Monitoring results indicate that all blasts have complied
with the EPL12407 limits for peak vibration as measured at both monitoring
locations, “Bollol Creek Station” and “Greenhills”.
52
Figure 36 Peak Vibration Summary
4.6.2 Blast Overpressure
During the reporting period there has been one blast that has exceeded the
acceptable limit for peak overpressure of 115dBA. A reading of 116.4 dBA was
recorded on 27 July 2007 at “Bollol Creek Station”. This reading is not classed as
an exceedence of peak overpressure as overall monitoring results have been well
over the 95% acceptance limit.

53
Figure 37 Peak Overpressure Summary 2007
4.6.3 Noise Monitoring
A specialist consultant (Spectrum Acoustics Pty Ltd) is engaged to monitor BCM
noise levels according to the requirements of EPL12407.
Monitoring locations for the operations phase of the mine are presented in Table 11
below and their actual location can be seen in Attachment 3.
Operational Noise Monitoring
Locations
EPA Identification
No:
Closest Project Component
“Templemore” N4 Mine
“Bollol Creek Station” N3 Mine
“Goonbri” N1 Mine
“Greenhills” N2 Mine
“Tarrawonga” N6 Mine
“Bellvue” N5 Private Coal Haul Road
“Cooboobindi” N7 Private Coal Haul Road
“The Rock” N8 Private Coal Haul Road
“Hazeldene” N9 Rail Loop
54
“Springfield” N10 Rail Loop
“Roma” N11 Rail Loop
Table 11 Noise Monitoring Locations for Boggabri Mine
Monitoring was conducted during April, July, September and January 2007 with
results revealing two non-compliant events with noise criteria as follows:
April 2007 – 1.6 dBA exceedence at “Bellvue” in the evening. This
exceedence has been put down to the influence of temperature inversion
conditions being experienced at the time of monitoring. There have been no
further exceedence issues at “Bellvue”.
April 2007 – 4 dBA exceedence of 39dBA at “The Rock” associated with the
downhill acceleration of empty coal trucks on the haul road. Since this
exceedence a 50km speed limit has been imposed on the trucks and there
have been no further exceedence issues at “The Rock”.
Noise monitoring was not conducted at “Hazeldene”, “Springfield” or “Roma” due to
a communications break down between Boggabri Coal and their noise consultant;
Spectrum Acoustics, who mistakenly believed that this was an “events based”
requirement rather than “time based”. Monitoring at these sites is to be carried out
in late February 2008 and will continue as part of the normal monitoring program.
Early concerns of haul road noise exceedence at “The Rock” have led to more
comprehensive monitoring at this site. This includes a close analysis of individual
truck pass-bys on the haul road. The analysis shows the condition of the truck (full
or empty) and the time it first became audible, the duration of each passing truck
and the average levels for that duration period. This is then averaged into a fifteen
minute assessment period.
A night time measurement was taken at the bedroom window at “The Rock” to
determine maximum pass-by levels for comparison with the 45 dB(A),Lmax sleep
disturbance criterion. There has also been ongoing correspondence with the
residents at “The Rock”.
Noise monitoring results for the reporting period has been presented in Figure30
below.

55
Figure 38 Noise Monitoring Summary 2007
4.7 Hydrocarbon and Contaminated Land Management and Performance
4.7.1 General
All hydrocarbons are stored on site are in double skinned self bunded tanks. No
reportable spills of hydrocarbons occurred during the reporting period and all wastes
are removed from site by a licensed waste contractor.
Figure 39 Double Skinned Self Bunded Oil Storage Tanks

56
4.8 Aboriginal Archaeology and Cultural Heritage Management and Performance
A detailed archaeological survey of the BCM was completed in mid 2006 prior to
construction and the commencement of mining. No issues or findings in relation to
cultural heritage have occurred as a result of mine development during the reporting
period.
Sites of significance identified during the 2006 archaeological survey continue to be
maintained and protected.
Figure 40 Aboriginal Archaelogical Site
4.9 Public Safety Management and Performance
4.9.1 Mine Access Roads
The designated access route to the Boggabri Mine is from the Kamilaroi Highway
north of Boggabri via the Manilla Road (MR357) and the Leard Forest Road (SR12)..
Both of these roads are currently of gravel standard. However Boggabri Coal have
entered into negotiations with the Narrabri Shire Council to upgrade and seal the
designated access route to improve the level of safety associated with accessing the
mine. It is anticipated that the 14 km, $2M upgrade to sealed status will be
completed during 2008.
4.9.2 Private Coal Haul Road
The „at grade crossings‟ of Therribri and Leard Forest Roads give right of way to the
oversize haul trucks. Electronically operated boom gates restrict access of public
vehicles to the haul road and signage plus flashing lights that engage upon the
approach of the haul trucks warn motorists on the shire roads of coal trucks
approaching the haul road intersections. While no near misses or accidents have
been recorded at either intersection since commencement numerous safety

57
observations have been made by BCM personnel of shire road traffic failing to
observe the installed intersection signage.
4.9.3 Rural Lands Protection Board
Provision has been made for the safe and efficient movement of stock to the
satisfaction of the Narrabri Shire Council and Pastures Protection Board along
Travelling Stock Reserve # 83990 which is dissected by the private coal haul road.
This included the construction of fenced and locked gate laneways, and secure
holding pens located on the both sides of the haul road crossing.
4.9.4 Minesite Security
A 4 strand Iowa barb fence has been erected around the perimeter of the Stage 1
mine development area. Access to the Leard State Forest east of the active mine
area is via the mine entry and through gates that have been included in the
perimeter fence to the east of the active area. These gates allow access to the
monitoring sites (piezometers) located in the eastern part of CL 368 and also for the
Rural Fire Brigade should such access be required.
4.9.5 Fire Management
The lighting of fires on the BCM site is strictly prohibited and daily inspections are
conducted by the Open Cut Examiner to ensure that any bush fire hazards are
immediately dealt with. All welding on site is performed under the provisions of site
issued „hot work permits‟. All mine vehicles are equipped with fire extinguishers and
the two 17 kL water trucks have fire fighting capabilities. These water trucks are
always kept full of water when not in use in readiness should fire fighting be
required.
4.9.6 Site Lighting
Deployment of lighting plants for night work is done with due consideration so as to
minimise any stray light leaving the sight and affecting any neighbouring areas
beyond CL 368.
5. COMMUNITY RELATIONS
5.1 Workforce
The Boggabri Mine workforce consists of approximately 125 staff most of whom are
engaged on a permanent or sub-contract basis..
Where ever possible local people have been employed at the Boggabri Mine.
Figure 33 below shows the results of a recent survey conducted to ascertain where
the people in the current workforce are residing. In this instance a town refers to the
township itself and surrounding rural areas. Employees who fit into the category of
other NW NSW districts come from Wee Waa, Bingara, Tamworth and Quirindi.
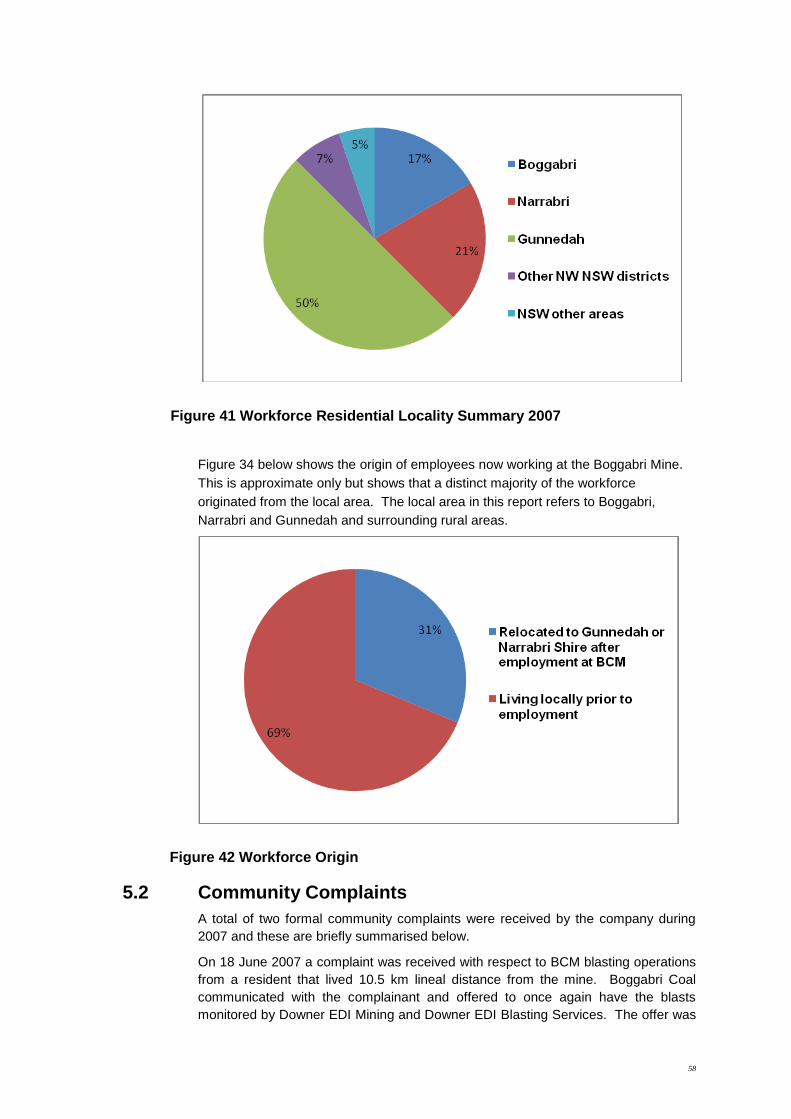
58
Figure 41 Workforce Residential Locality Summary 2007
Figure 34 below shows the origin of employees now working at the Boggabri Mine.
This is approximate only but shows that a distinct majority of the workforce
originated from the local area. The local area in this report refers to Boggabri,
Narrabri and Gunnedah and surrounding rural areas.
Figure 42 Workforce Origin
5.2 Community Complaints
A total of two formal community complaints were received by the company during
2007 and these are briefly summarised below.
On 18 June 2007 a complaint was received with respect to BCM blasting operations
from a resident that lived 10.5 km lineal distance from the mine. Boggabri Coal
communicated with the complainant and offered to once again have the blasts
monitored by Downer EDI Mining and Downer EDI Blasting Services. The offer was
59
refused as the last time BCM monitored at this residence no triggers were recorded.
The complainant subsequently withdrew the complaint.
In August 2007 a complaint was received from a local resident after a
misunderstanding with regard to blast monitoring on this person‟s property.
Communications with the resident have been re-established with no more
complaints resulting.
5.3 Community Liaison
Boggabri Coal continues to consult with the public and the following bodies to
monitor the impacts of mine operations upon the local community.
Narrabri Shire Council
Gunnedah Shire Council
Federal & State Local Members
Roads and Traffic Authority NSW
Rural Lands Protection Board – Narrabri
Boggabri Business Development Group
Department of Environment & Conservation Armidale
Forests NSW Dubbo
Red Chief Local Aboriginal Land Council
Gunidah Gunyah CDEP
Boggabri Service Clubs i.e. Lions, Rotary, HACC, RSL, SES, RFB, NSW
Police, NSW Ambulance, Narrabri Tafe, occurred.
6. REHABILITATION
6.1 Buildings
The existing “Nagero” homestead has now been refurbished and is being used as
the Boggabri Coal administration office. The potential exists for the farmhouse/office
to be utilised as a rural homestead following cessation of mining. There is no
heritage or conservation status relevant to this building.
6.2 Rehabilitation of Disturbed Land
At the end of this reporting period (2007) approximately, 13ha of overburden
emplacement had undergone treatment to final landform slope of 10 degrees and
topsoiled to a depth of 100mm. It is anticipated that a further 9 ha will be available
early in 2008 in preparation for tree planting in March/April 2008.
The long term rehabilitation objective is to re-establish native vegetation
commensurate with commercial native forestry, while at the same time establishing
suitable ecological functioning habitats. Boggabri Coal has initially sown the
rehabilitated slope to a vigorously growing pioneer grass mix so as to bind the soil in
place and reduce water runoff from the emplacement areas. After the successful

60
stabilisation by use of the pioneer pasture mix, it is proposed to selectively remove
the pasture sward and commence establishment of the native ecosystems as per
section 5.6.8 of the MOP.
6.3 Other infrastructure
No other rehabilitation works have been carried out at the Boggabri Mine other than
those already mentioned in this report.
6.4 Rehabilitation Trials and Research
No rehabilitation trials or research has been undertaken at this time.
6.5 Further Development of the Final Rehabilitation Plan
Not applicable at this time.
7. ACTIVITIES PROPOSED IN THE NEXT AEMR PERIOD
7.1 Activities proposed in 2008
Activities proposed by Boggabri Coal in 2008 include the extensive upgrade and
sealing in conjunction with the Narrabri Shire Council of a total of fourteen kilometres
of those portions of the Manilla Road (MR357), Leard Forest Road (SR12), SR15,
SR23 and SR26 which form the designated mine access road.
The construction of the new mine water dam (MW2) at the tailings dam site.
The establishment of fourteen thousand selected eucalyptus hardwood trees as part
of the ongoing mine rehabilitation program.
The construction of water management structures (contour drains, rock-lined flumes)
to optimise water management on the emplacement areas, and to control soil
erosion in the topsoiled reafforested areas.
Completion of the construction of the southern diversion drain culvert commenced in
December 2007. The culvert will divert clean water under the mine haul road and is
scheduled for completion in April 2008.
Affected Area/Rehabilitated
(hectares)
To date Last Report Next Report
(estimated)
A: MINE LEASE AREA
A1 Mine Lease(s) Area 3,547
B: DISTURBED AREAS 164 185

61
B1 Infrastructure area (other disturbed
areas to be rehabilitated at closure
including facilities, roads)
10.6 10.6 10.6
B2 Active Mining Area (excluding items
B3 – B5 below)
58.4 55.4 70
B3 Waste Emplacements
(active/unshaped/uncapped)
83 42 80
B4 Tailings Emplacements
(active/unshaped/uncapped)
0 0 0
B5 Shaped Waste Emplacement
(awaits final vegetation)
12 0 25
ALL DISTURBED AREAS 164 107.4 185
C: REHABILITATION PROGRESS
C1 Total Rehabilitated Land (except
for maintenance)
0 0 25
D: REHABILITATION ON SLOPES
D1 10 to 18 degrees 12 5 25
D2 Greater than 18 degrees 0 0 0
E: SURFACE OF REHABILITATED LAND
E1 Pasture and Grasses 12 0 25
E2 Native forest/ecosystems 0 0 25
E3 Plantations and Crops 0 0
E4 Other (include non vegetative
outcomes)
0 0
Table 12 Rehabilitation Summary 2007
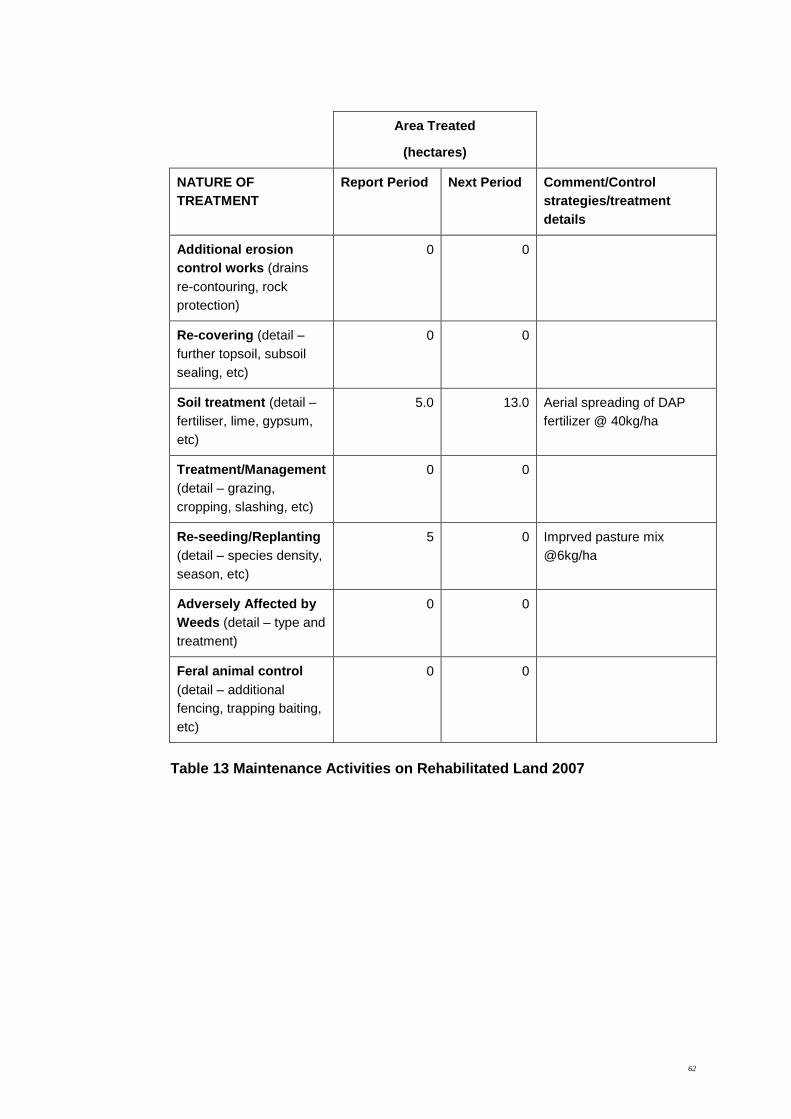
62
Area Treated
(hectares)
NATURE OF
TREATMENT
Report Period Next Period Comment/Control
strategies/treatment
details
Additional erosion
control works (drains
re-contouring, rock
protection)
0 0
Re-covering (detail –
further topsoil, subsoil
sealing, etc)
0 0
Soil treatment (detail –
fertiliser, lime, gypsum,
etc)
5.0 13.0 Aerial spreading of DAP
fertilizer @ 40kg/ha
Treatment/Management
(detail – grazing,
cropping, slashing, etc)
0 0
Re-seeding/Replanting
(detail – species density,
season, etc)
5 0 Imprved pasture mix
@6kg/ha
Adversely Affected by
Weeds (detail – type and
treatment)
0 0
Feral animal control
(detail – additional
fencing, trapping baiting,
etc)
0 0
Table 13 Maintenance Activities on Rehabilitated Land 2007