annual impact investor survey - thegiin.org · letter from the research director ... figure 8:...
TRANSCRIPT

ANNUALIMPACT INVESTORSURVEY
2018 THE EIGHTH EDITION


IA N N U A L I M P A C T I N V E S T O R S U R V E Y 2 0 1 8
2018 Annual Impact Investor SurveyAuthored by the GIIN Research TeamAbhilash Mudaliar, DirectorRachel Bass, Senior AssociateHannah Dithrich, Associate
About the Global Impact Investing Network (GIIN)The GIIN is a nonprofit organization dedicated to increasing the scale and effectiveness of impact investing. Impact investments are investments made into companies, organizations, and funds with the intention to generate social and environmental impact alongside a financial return. The GIIN builds critical infrastructure and supports activities, education, and research that help accelerate the development of a coherent impact investing industry. For more information, see http://www.thegiin.org/.
Acknowledgments
SponsorsThis report is made possible by the support of the American People through the United States Agency for International Development (USAID). The contents of this report are the sole responsibility of the Global Impact Investing Network and do not necessarily reflect the views of USAID or the United States Government.
The report was also produced with the support of the British people through the Department for International Development’s Impact Programme (DFID). The contents of this report do not necessarily reflect the views of DFID or the British Government.
Research supportThe Research Team would like to recognize the contributions of various members of the broader GIIN Team. We thank Aliana Pineiro for her contributions to the drafting and review of key sections and to the design of the final report. Further, we thank Rebecca Kurland for her research and writing on key market developments in 2017. For review and input, we thank Amit Bouri, Jennifer Lawrence, Giselle Leung, Kelly McCarthy, Pete Murphy, Katrina Ngo, Hannah Schiff, Allison Spector, and Amy Stillman.
Beta testersThe survey instrument was beta-tested by Claudia Belli of BNP Paribas, MaryKate Bullen of New Forests, Yvonne Bakkum of FMO, Nando van Kleeff of MN, and Christine Looney of the Ford Foundation.
Additionally, several GIIN team members beta-tested the survey instrument, providing valuable feedback: Lissa Glasgo, Sharon Kossoff, Rebecca Kurland, Kelly McCarthy, Pete Murphy, Annie Olszewski, Hannah Schiff, Aditi Sethi, Sapna Shah, and Amy Stillman.
Outreach partnersCollaboration among member networks and field-builders adds to the rigor of research efforts. Other field-building organizations in the impact investing industry extended invitations to their networks to complete the survey. For more information about these organizations, see Appendix 3.
June 2018

USD 228.1BILLION
226 respondents currently manage
in impact investing assets*
*Three respondents declined to provide AUM information.

IIIA N N U A L I M P A C T I N V E S T O R S U R V E Y 2 0 1 8
Letter from the Research DirectorDear reader,
I am thrilled to share with you the eighth edition of the GIIN’s Annual Impact Investor Survey, which provides a detailed look at a diverse, dynamic, and growing impact investing market. This year, we received responses from 229 organizations that collectively manage USD 228 billion in impact investing assets. I cannot overstate the importance of these data contributions, as they allow us to address knowledge gaps and better understand the market. For the 2018 report, we were able to leverage the growing data set to deepen our understanding of a number of interesting topics. For example:
• Industry Trends: Of the 229 organizations that participated this year, 82 also participated five years ago. These organizations have grown their impact investing assets under management at the robust rate of 13% per annum, and have done so in part by expanding into regions, sectors, and asset classes that have historically been less popular.
• Practice of ‘Conventional’ Investors: Over one in three respondents are organizations that are established in the ‘conventional’ investing markets and have also begun impact investing activities. Overwhelmingly, these organizations report that—compared to three years ago—they are now making more impact investments, deepening their commitment to impact measurement, and gaining more buy-in from key internal stakeholders. Such growth is exciting on many fronts, not least because it brings in new investors and more capital, but also because it works to enhance the broader credibility and professionalism of impact investing practice.
• Industry Integrity: The growing involvement of large-scale, mainstream firms also presents some risks – in particular, the risk of ‘impact washing’, i.e. that some actors may be adopting the label without meaningful fidelity to impact. Encouragingly, impact investors are cognizant of this concern and emphasize the importance of greater transparency around impact to mitigate this risk. Other ideas include third-party certification or the development of shared principles. Indeed, the GIIN has committed to developing a set of principles (to be launched in 2019) to strengthen the identity of impact investing to drive growth and protect the integrity of the market.
The data in the Annual Survey show momentum for the industry. But at the GIIN, we also believe they’re a signal of something bigger. It portends a shift in the broader financial markets where it is becoming increasingly unacceptable to invest without regard for the social and environmental impacts of one’s investment choices. Fundamental norms governing the role and purpose of capital in society are changing, and impact investing is at the forefront driving this transformational shift.
Abhilash Mudaliar Research Director, Global Impact Investing Network
The data in the
Annual Survey
show momentum
for the industry.
But at the GIIN,
we also believe
they’re a signal of
something bigger.
*Three respondents declined to provide AUM information.

IV G L O B A L I M P A C T I N V E S T I N G N E T W O R K
Methodology VIII
Executive Summary X
Sample Characteristics 1
Organization type .......................................................................................................................1Headquarters location ............................................................................................................... 2Year of first impact investment ................................................................................................. 2Target financial returns .............................................................................................................. 3Impact-only and conventional investors.................................................................................. 3Motivations for making impact investments .......................................................................... 4Sample characteristic by sub-group ........................................................................................ 5Sample characteristics among five-year repeat respondents ............................................... 5
Investment Activity 6
Capital invested since inception .............................................................................................. 6Activity in 2017 and plans for 2018 .......................................................................................... 6Plans for 2017 compared to activity in 2017 ............................................................................ 7Investment activity over the past five years ............................................................................ 8Top regions of investment during 2017 ................................................................................... 8
State of the Impact Investing Market 10
Progress on indicators of market growth .............................................................................. 10Challenges ................................................................................................................................. 11Underlying causes of common challenges ............................................................................12Insight: Organizations making both conventional and impact investments ......................13
Current Market Topics 16
Preserving impact integrity .....................................................................................................16Technology ................................................................................................................................17Policy ..........................................................................................................................................18Blended finance ........................................................................................................................19
Table of Contents

VA N N U A L I M P A C T I N V E S T O R S U R V E Y 2 0 1 8
Asset Allocations 21
Assets under management ......................................................................................................21AUM by organization type ..................................................................................................... 22AUM by geography of investment ....................................................................................... 22AUM by sector of investment ................................................................................................ 25AUM by instrument of investment ........................................................................................ 27AUM by stage of business ...................................................................................................... 28
The Fund Manager Landscape 29
Investing into funds ................................................................................................................. 29Fund manager activity ............................................................................................................. 29
Impact Measurement and Management 35
Impact objectives ..................................................................................................................... 35Impact targets .......................................................................................................................... 35Tools to measure social and environmental performance ....................................................37Alignment with the Sustainable Development Goals ......................................................... 38Gender lens investing ..............................................................................................................40Climate investing .....................................................................................................................40
Investment Performance and Risk 42
Target financial returns ............................................................................................................ 42Performance relative to expectations ....................................................................................44Realized gross returns.............................................................................................................. 45Risk ............................................................................................................................................ 45
2017 Market Development Boxes
Noteworthy announcements in impact investing .................................................................15Retail products for impact investing ...................................................................................... 34Impact investing efforts to address the UN SDGs .............................................................. 39Investing to address climate change .......................................................................................41
Appendices 47
Appendix 1. List of survey respondents ................................................................................48Appendix 2. List of definitions provided to survey respondents.........................................51Appendix 3. Outreach partners ............................................................................................. 53

VI G L O B A L I M P A C T I N V E S T I N G N E T W O R K
List of Tables and Figures
List of Tables
Table i: Respondent sub-groups referenced in the report ..................................................................................................... ixTable ii: Region codes ............................................................................................................................................................................. ixTable iii: Sector codes .............................................................................................................................................................................. ixTable iv: Number of investments and amount of capital invested in 2017 and planned for 2018 .......................... xiiTable v: Fund manager capital raises in 2017 and plans for raising capital in 2018 ...................................................... xiiTable vi: Areas of progress and challenge for the growth of the impact investing industry .....................................xvTable 1: Number of investments and amount of capital invested in 2017 and planned for 2018 ............................6Table 2: Investment activity by organization type ....................................................................................................................... 7Table 3: Capital invested and number of investments in 2017 among repeat respondents ...................................... 7Table 4: Areas of progress and challenge for the growth of the impact investing industry ......................................11Table 5: Ranking of ‘significant’ challenges, by region of investment ................................................................................ 12Table 6: The importance of various impact investing practices ........................................................................................... 17Table 7: The importance of government actions or policies to help organizations make impact investments .... 18Table 8: Investor participation in blended finance deals ......................................................................................................... 19Table 9: AUM by organization type ................................................................................................................................................22Table 10: Geographic allocations by various respondent segments ....................................................................................23Table 11: Growth in regional asset allocations among repeat respondents (2013–2017) ...........................................24Table 12: Sector allocations by various respondent segments ...............................................................................................26Table 13: Growth in sector asset allocations among repeat respondents (2013–2017) ...............................................27Table 14: Growth in instrument asset allocations among repeat respondents (2013–2017) ......................................28Table 15: Fund manager capital raises in 2017 and plans for raising capital in 2018 ..................................................... 30Table 16: Fund manager capital raises in 2017 and plans for capital raise in 2018, by sub-group ........................... 30Table 17: Capital raised in 2016 and 2017 among repeat respondents ............................................................................... 31Table 18: Repeat respondents’ planned 2017 capital raise compared to reported 2017 capital raise ..................... 31Table 19: Fund managers' sources of capital by various respondent segments (AUM-weighted) .......................32Table 20: Growth in sources of capital among repeat respondents (2013–2017) ...........................................................33Table 21: Number of fund managers noting increased client demand for each product type, by client type ...33Table 22: Target returns by organization type ................................................................................................................................42Table 23: Significant risk events experienced in 2017 by regional focus ............................................................................ 46
List of Figures
Figure i: Geographic allocations by AUM and percent of respondents ........................................................................... xiFigure ii: Sector allocations by AUM and percent of respondents ...................................................................................... xiFigure iii: Change in organizations’ perceptions and practice of impact investing in the last three years .......... xiiiFigure iv: Tracking impact investment performance to the UN SDGs ............................................................................. xiiiFigure v: Performance relative to expectations ...........................................................................................................................xivFigure vi: Average realized gross returns since inception .........................................................................................................xvFigure 1: Organization type .....................................................................................................................................................................1Figure 2: Location of organization headquarters ........................................................................................................................... 2Figure 3: Year of first impact investment ........................................................................................................................................... 2

VIIA N N U A L I M P A C T I N V E S T O R S U R V E Y 2 0 1 8
Figure 4: Target financial returns principally sought ...................................................................................................................... 3Figure 5: Types of investments made ................................................................................................................................................. 3Figure 6: Motivations for making impact investments .................................................................................................................4Figure 7: Sample breakdown by sub-group .......................................................................................................................................5Figure 8: Number of respondents that plan to increase, maintain, and decrease their level of activity in 2018 .......6Figure 9: Average deal size in 2017 among various respondent segments......................................................................... 7Figure 10: Reported activity in 2013 and 2017 among five-year repeat respondents .......................................................8Figure 11: Top three regions to which respondent deployed capital in 2017 ........................................................................8Figure 12: Top three sectors to which respondents deployed capital in 2017 ......................................................................9Figure 13: Progress on indicators of market growth ......................................................................................................................10Figure 14: Challenges to the growth of the impact investing industry ..................................................................................11Figure 15: Factors underlying a lack of high-quality investment opportunities (fund or direct)
with track record ...................................................................................................................................................................... 13Figure 16: Change in organizations’ perceptions and practice of impact investing in the last three years ..................13Figure 17: Significance of challenges to gaining buy-in for impact investing .................................................................... 14Figure 18: Approaches to mitigate the risk of impact washing ................................................................................................ 16Figure 19: The importance of various technologies for impact investing over the next three years........................ 17Figure 20: Roles of blended finance in impact investing ............................................................................................................ 19Figure 21: Reasons for not participating in blended finance deals ....................................................................................... 20Figure 22: Distribution of sample AUM............................................................................................................................................. 21Figure 23: Geographic allocations by AUM and percent of respondents ..........................................................................23Figure 24: Planned allocation changes in 2018, by geography .................................................................................................24Figure 25: Sector allocations by AUM and percent of respondents .....................................................................................25Figure 26: Planned allocation changes in 2018, by sector ...........................................................................................................26Figure 27: Instrument allocations by AUM and percent of respondents.............................................................................27Figure 28: Allocations by stage of business, by AUM and percent of respondents .......................................................28Figure 29: Impact fund manager competencies relative to conventional fund managers............................................29Figure 30: Capital raised in 2016 and 2017 among repeat respondents .............................................................................. 30Figure 31: Proportion of fund managers that manage capital from each investor type ................................................ 31Figure 32: Primary impact objectives ..................................................................................................................................................35Figure 33: Setting impact targets ..........................................................................................................................................................36Figure 34: Reasons to set impact targets ...........................................................................................................................................36Figure 35: How social and environmental performance is measured ....................................................................................37Figure 36: Tracking impact investment performance to the UN SDGs ..............................................................................38Figure 37: Motivations for tracking social or environmental performance to the SDGs ..............................................38Figure 38: Ways impact investors apply a gender lens to their investment process ......................................................40Figure 39: Ways impact investors address climate change through their investments .................................................40Figure 40: Target financial returns principally sought ....................................................................................................................42Figure 41: Average gross return expectations for 2017 vintage investments .....................................................................43Figure 42: Average gross returns expectations for 2013 and 2017 vintage investments ................................................43Figure 43: Performance relative to expectations ........................................................................................................................... 44Figure 44: Financial performance relative to expectations by target returns sought, asset class focus,
and geography of investment .......................................................................................................................................... 44Figure 45: Average realized gross returns since inception ........................................................................................................ 45Figure 46: Contributors of risk to impact investment portfolios ............................................................................................. 46

VIII G L O B A L I M P A C T I N V E S T I N G N E T W O R K
Methodology This report captures data from 229 impact investors collected via a survey distributed during January and February 2018. Respondents answered questions regarding their impact investing activities and allocations, their future plans, and their perceptions on key industry issues and trends.
Inclusion criteriaAll respondents represent impact investing organizations, not individual investors. To ensure that respondents have had meaningful experience managing impact investments, survey-eligibility criteria required that respondents either: (1) have committed at least USD 10 million to impact investments since their inception or (2) have made at least five impact investments, or both. The GIIN provided its definition of impact investing (see Appendix 2), which respondents used to self-report their eligibility.
Sample overlap with previous surveysThe sample for this survey changes to some extent each year, which is important to consider when comparing findings from this report with those from previous surveys. Of the 229 respondents in this year’s sample, 155 also responded in 2017. The full 2017 sample included 209 respondents. The Research Team analyzed this overlapping sub-sample to discern changes in activity across years by the same set of respondents. The Research Team also looked at changes and trends in investment activities over the last five years by comparing responses from 82 investors that completed both the 2014 and 2018 Annual Surveys. Results of both of these analyses are presented where appropriate.
Data accuracyWhile the GIIN Research Team conducted basic data checks and sought clarification as appropriate prior to analysis, all information in this report is based on self-reported data. Respondents were instructed to complete the survey with respect only to their impact investing portfolios. The GIIN provided its definition of ‘impact investing,’ which respondents applied to their portfolios as they saw fit.
Data recodingA handful of survey questions allowed respondents to provide free-form answers. To enable more useful interpretation of responses, where underlying meanings were unambiguous, the GIIN Research Team recoded these free-form responses into more uniform categories or themes.
Role of outliersAs is often the case in quantitative research, a handful of outliers in a sample can have outsized influence on aggregate findings. Some respondents to our Annual Survey manage comparatively large impact investing portfolios, possibly skewing aggregate analysis toward their particular concentrations. Where appropriate and feasible, this report presents analysis both including and excluding outliers in order to enable more nuanced interpretation of findings.
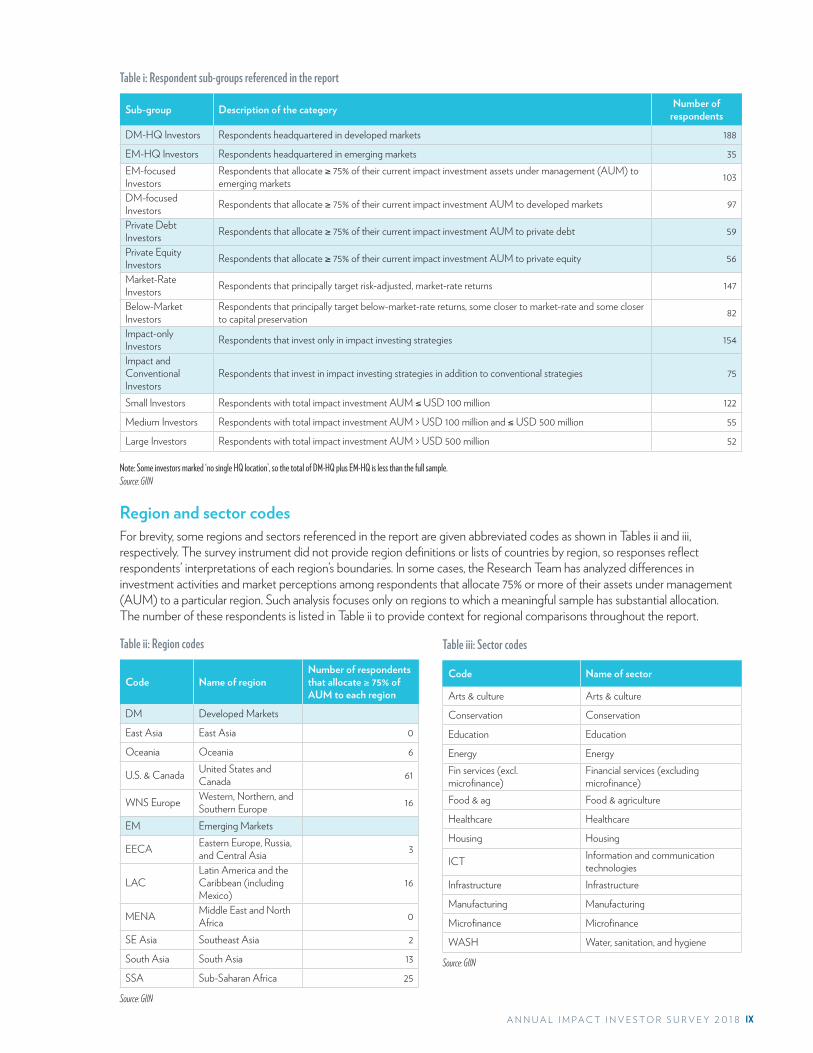
Analyzing data by sub-group to extract notable findingsMost findings presented in this report aggregate the responses of all 229 impact investors that responded to the survey. The report also presents statistically significant differences in responses by sub-groups of respondents—such as, for example, investors with a large majority of their capital allocated to a particular asset class or geography. The statistical significance of differences between sub-groups was tested at the 90% confidence level unless indicated otherwise. Table i presents a full list of these sub-groups. Additionally, this report presents more precise sub-group analysis as relevant, such as analysis of those respondents that are focused on a given region (see list of regions in Table ii).
This report does not provide estimates of the overall size of the impact investing market. Rather, the analyses offered herein are based only on a sample and are intended to provide a snapshot of global impact investing activity.
IXA N N U A L I M P A C T I N V E S T O R S U R V E Y 2 0 1 8
Table i: Respondent sub-groups referenced in the report
Sub-group Description of the category Number of respondents
DM-HQ Investors Respondents headquartered in developed markets 188
EM-HQ Investors Respondents headquartered in emerging markets 35EM-focused Investors
Respondents that allocate ≥ 75% of their current impact investment assets under management (AUM) to emerging markets 103
DM-focused Investors Respondents that allocate ≥ 75% of their current impact investment AUM to developed markets 97
Private Debt Investors Respondents that allocate ≥ 75% of their current impact investment AUM to private debt 59
Private Equity Investors Respondents that allocate ≥ 75% of their current impact investment AUM to private equity 56
Market-Rate Investors Respondents that principally target risk-adjusted, market-rate returns 147
Below-Market Investors
Respondents that principally target below-market-rate returns, some closer to market-rate and some closer to capital preservation 82
Impact-only Investors Respondents that invest only in impact investing strategies 154
Impact and Conventional Investors
Respondents that invest in impact investing strategies in addition to conventional strategies 75
Small Investors Respondents with total impact investment AUM ≤ USD 100 million 122
Medium Investors Respondents with total impact investment AUM > USD 100 million and ≤ USD 500 million 55
Large Investors Respondents with total impact investment AUM > USD 500 million 52
Note: Some investors marked ‘no single HQ location’, so the total of DM-HQ plus EM-HQ is less than the full sample. Source: GIIN
Region and sector codesFor brevity, some regions and sectors referenced in the report are given abbreviated codes as shown in Tables ii and iii, respectively. The survey instrument did not provide region definitions or lists of countries by region, so responses reflect respondents’ interpretations of each region’s boundaries. In some cases, the Research Team has analyzed differences in investment activities and market perceptions among respondents that allocate 75% or more of their assets under management (AUM) to a particular region. Such analysis focuses only on regions to which a meaningful sample has substantial allocation. The number of these respondents is listed in Table ii to provide context for regional comparisons throughout the report.
Table ii: Region codes
Code Name of regionNumber of respondents that allocate ≥ 75% of AUM to each region
DM Developed Markets
East Asia East Asia 0
Oceania Oceania 6
U.S. & Canada United States and Canada 61
WNS Europe Western, Northern, and Southern Europe 16
EM Emerging Markets
EECA Eastern Europe, Russia, and Central Asia 3
LACLatin America and the Caribbean (including Mexico)
16
MENA Middle East and North Africa 0
SE Asia Southeast Asia 2
South Asia South Asia 13
SSA Sub-Saharan Africa 25
Source: GIIN
Table iii: Sector codes
Code Name of sector
Arts & culture Arts & culture
Conservation Conservation
Education Education
Energy EnergyFin services (excl. microfinance)
Financial services (excluding microfinance)
Food & ag Food & agriculture
Healthcare Healthcare
Housing Housing
ICT Information and communication technologies
Infrastructure Infrastructure
Manufacturing Manufacturing
Microfinance Microfinance
WASH Water, sanitation, and hygiene
Source: GIIN

X G L O B A L I M P A C T I N V E S T I N G N E T W O R K
Executive SummaryThis report presents findings from the Global Impact Investing Network’s eighth Annual Impact Investor Survey. These findings reflect 229 respondents’ perspectives on the growth and development of the impact investing industry. The report includes analysis of respondents’ investment activity, asset allocations, impact measurement practices, and performance. For the first time, the report also presents trends analysis for a subset of 82 respondents that participated in the survey in 2013 and again this year. Major market developments over the course of 2017 are also described throughout the report.
Key Findings
The market is diverse
The impact investing industry is growing
Impact investors demonstrate a strong commitment to measuring and managing impact
Overwhelmingly, impact investors report performance in line with both financial and impact expectations
Impact investors acknowledge remaining challenges that need to be addressed within the industry
Altogether, the 229 respondents to this year’s survey represent a wide range of investors:
• Organization type: Nearly six in ten respondents are fund managers (59%), and a further 13% are foundations. Other significant categories include banks (6%), family offices (4%), and pension funds / insurance companies (4%).
• Headquarters location: A majority of respondents are headquartered in developed markets, most notably the U.S. & Canada (47%) and WNS Europe (30%).
• Target returns: Nearly two-thirds of respondents target risk-adjusted, market-rate returns (64%). The remainder seek below-market-rate returns that are either closer to market-rate returns (20%) or closer to capital preservation (16%).
• Investment focus: Two-thirds of respondents make only impact investments; the remaining third also make conventional investments.
• Asset class: Roughly one quarter of respondents invest primarily through each of private equity (26%) and private debt (24%).
• Geographic focus: Nearly the same portion of respondents invest primarily in emerging markets (45%) as in developed markets (42%).
This diversity is also reflected in respondents’ allocations across a range of geographies, sectors, asset classes, and stages of businesses. In aggregate, 226 respondents reported USD 228.1 billion in impact investing assets under management (AUM). Notably, the two largest respondents accounted for 38% of total AUM. At the median, respondents managed USD 92 million in impact investing assets.
Geography: Over half of total AUM was allocated to emerging markets (56%) and the remainder to developed markets (Figure i). Specifically, respondents allocated the greatest share of capital to the U.S. & Canada (20%), LAC (16%), and SSA (12%).
1
2
3
4
5
The market is diverse1

XIA N N U A L I M P A C T I N V E S T O R S U R V E Y 2 0 1 8
Figure i: Geographic allocations by AUM and percent of respondentsLeft side, Percent of AUM: n = 226; total AUM = USD 228.1 billion. Right side, Percent of respondents with any allocation to each geography: n = 229; respondents may allocate to multiple geographies.
Note: ‘Other’ includes investments with a global focus.Source: GIIN
U.S. & Canada
LAC
SSA
WNS Europe
EECA
South Asia
SE Asia
East Asia
MENA
Oceania
Other
48%
40%
46%
31%
20%
35%
31%
16%
15%
8%
13%
20%
16%
12%
11%
10%
7%
6%
5%
5%
3%
5%
Percent of respondentsPercent of AUM
Sector: Respondents demonstrate ongoing commitment to basic services sectors, with the top sectors of investment including financial services (19%), energy (14%), microfinance (9%), and housing (8%; Figure ii).
Figure ii: Sector allocations by AUM and percent of respondentsLeft side, Percent of AUM: n = 226; total AUM = USD 228.1 billion.Right side, Percent of respondents with any allocation to each sector: n = 229; respondents may allocate to multiple sectors.
Note: Other sectors include SMEs, child welfare, commercial goods, transport, retail, tourism, forestry, and commercial real estate.Source: GIIN
57%
45%
48%
35%
45%
17%
49%
25%
41%
15%
16%
23%
11%
45%
Fin services (excl. microfinance)
Energy
Microfinance
Housing
Food & ag
Infrastructure
Healthcare
WASH
Education
Manufacturing
Conservation
ICT
Arts & culture
Other
19%
14%
9%
8%
6%
5%
5%
4%
4%
3%
3%
3%
0%
16%
Percent of respondentsPercent of AUM
Instrument: Impact investors continue to invest primarily through private capital markets. Respondents allocate the greatest share of capital through private debt (41%), followed by private equity (18%) and public equities (14%).
Stages of business: Impact investors allocate capital to businesses across stages of development. The greatest share of AUM is invested in mature, private companies (39%) and growth-stage companies (35%). High numbers of investors allocate smaller amounts of capital into seed and venture-stage companies.

XII G L O B A L I M P A C T I N V E S T I N G N E T W O R K
Of all the respondents to the survey, over 50% made their first impact investment in the past decade, indicative of the ongoing entry of new players to the industry.
Together, 225 respondents invested USD 35.5 billion into 11,136 deals during 2017 (Table iv). These respondents plan to increase the amount of capital they invest by 8% and the number of deals by 5% during 2018. The subset of five-year repeat respondents increased the amount of capital invested that year by 27% and the number of deals made by 32%.
Table iv: Number of investments and amount of capital invested in 2017 and planned for 2018n = 225; excludes two large outliers and two respondents that did not report 2017 investment activity
Number of investments Capital invested (USD millions)
2017 Reported 2018 Planned 2017 Reported 2018 Planned
Mean 53 54 168 179
Median 8 8 17 25
Sum 11,136 11,712 35,526 38,465
Aggregate % growth (projected) 5% 8%
Source: GIIN
The 82 respondents that completed the survey five years ago and again this year demonstrated a compound annual growth rate (CAGR) of 13% for their collective AUM, growing from USD 30.8 billion in 2013 to USD 50.8 billion in 2017. This growth was spread out across the majority of regions, sectors and instruments, but was particularly pronounced in regions (East and Southeast Asia, MENA, Oceania), sectors (education and food & agriculture) and instruments (public equities) that have historically accounted for relatively smaller portions of global AUM, indicative of an expansion of the market across multiple vertices.
Fund managers and other intermediaries play a vital role within the impact investing ecosystem, working to effectively channel capital between investors and investees. Collectively, fund manager respondents raised USD 18.7 billion during 2017 and plan to raise USD 22.5 billion during 2018, a 20% increase (Table v).
Table v: Fund manager capital raises in 2017 and plans for raising capital in 2018Excludes respondents that did not report raising capital in 2017 or did not share their projections for 2018. All figures in USD millions.
All fund managers
2017 Reported 2018 Planned
n 94 113
Mean 199 199
Median 33 75
Sum 18,738 22,490
Source: GIIN
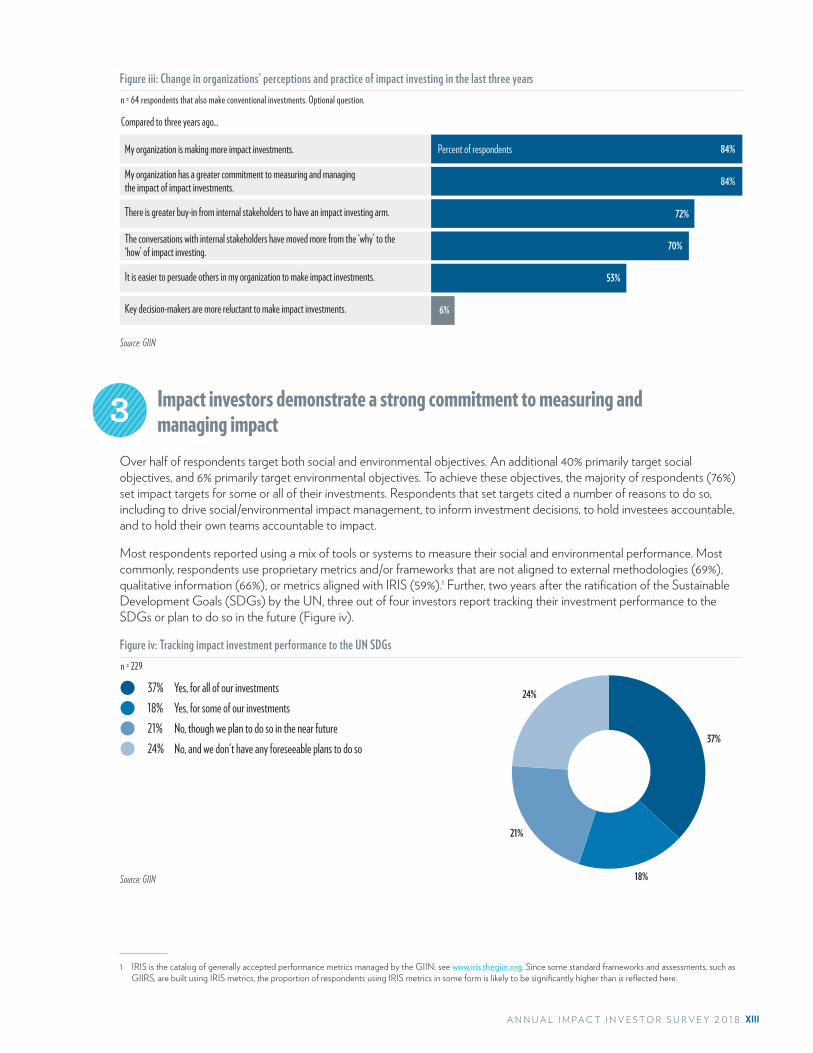
Respondents that make both impact and conventional investments also described changes within their own organizations during the past three years that indicate market growth (Figure iii). Overwhelmingly, they noted that their organizations are making more impact investments and are demonstrating greater commitment to measuring and managing their impact (84% each). Just 6% of respondents indicated greater reluctance to making impact investments at their organizations.
The impact investing industry is growing2
XIIIA N N U A L I M P A C T I N V E S T O R S U R V E Y 2 0 1 8
Figure iii: Change in organizations’ perceptions and practice of impact investing in the last three years
Source: GIIN
n = 64 respondents that also make conventional investments. Optional question.
84%
72%
70%
53%
6%
My organization is making more impact investments.
My organization has a greater commitment to measuring and managing the impact of impact investments.
There is greater buy-in from internal stakeholders to have an impact investing arm.
The conversations with internal stakeholders have moved more from the ‘why’ to the ‘how’ of impact investing.
It is easier to persuade others in my organization to make impact investments.
Key decision-makers are more reluctant to make impact investments.
84%
Compared to three years ago...
Percent of respondents
Over half of respondents target both social and environmental objectives. An additional 40% primarily target social objectives, and 6% primarily target environmental objectives. To achieve these objectives, the majority of respondents (76%) set impact targets for some or all of their investments. Respondents that set targets cited a number of reasons to do so, including to drive social/environmental impact management, to inform investment decisions, to hold investees accountable, and to hold their own teams accountable to impact.
Most respondents reported using a mix of tools or systems to measure their social and environmental performance. Most commonly, respondents use proprietary metrics and/or frameworks that are not aligned to external methodologies (69%), qualitative information (66%), or metrics aligned with IRIS (59%).1 Further, two years after the ratification of the Sustainable Development Goals (SDGs) by the UN, three out of four investors report tracking their investment performance to the SDGs or plan to do so in the future (Figure iv).
24%
18%
Figure iv: Tracking impact investment performance to the UN SDGs n = 229
Source: GIIN
Yes, for all of our investments Yes, for some of our investments No, though we plan to do so in the near future
37%18%21%
No, and we don't have any foreseeable plans to do so 24%37%
21%
1 IRIS is the catalog of generally accepted performance metrics managed by the GIIN; see www.iris.thegiin.org. Since some standard frameworks and assessments, such as GIIRS, are built using IRIS metrics, the proportion of respondents using IRIS metrics in some form is likely to be significantly higher than is reflected here.
3 Impact investors demonstrate a strong commitment to measuring and managing impact

XIV G L O B A L I M P A C T I N V E S T I N G N E T W O R K
Respondents also described their use of various ‘lenses’ to understand and manage impact. About 70% of respondents apply a gender lens to their investment process, typically through governance measures or by seeking investees that proactively address gender issues. Nearly three-quarters of respondents (72%) seek to address climate change through their investments, most commonly by targeting investments that reduce greenhouse gas emissions, seeking investments that prevent future greenhouse gas emissions, and seeking investments that support climate change adaptation.
Further, respondents described different approaches to mitigate the risks of ‘impact washing’ as the industry mainstreams. Eighty percent agree that ‘greater transparency from impact investors on their impact strategy and results’ would help mitigate risks of industry mission drift. Others pointed to third-party certification of impact investments, voluntary principles to govern investor behavior, and a code of conduct for investors.
A majority of respondents indicated that their investments have met their expectations for both impact (82%) and financial (76%) performance since inception (Figure v). Another 15% reported outperformance across each of these dimensions.
Figure v: Performance relative to expectations
Source: GIIN
Financial performanceImpact performance
Outperforming
In line
Underperforming
n = 218n = 216
3% 9%
Number of respondents shown above each bar; some respondents chose ‘not sure’ and are not included.
15% 15%
82% 76%
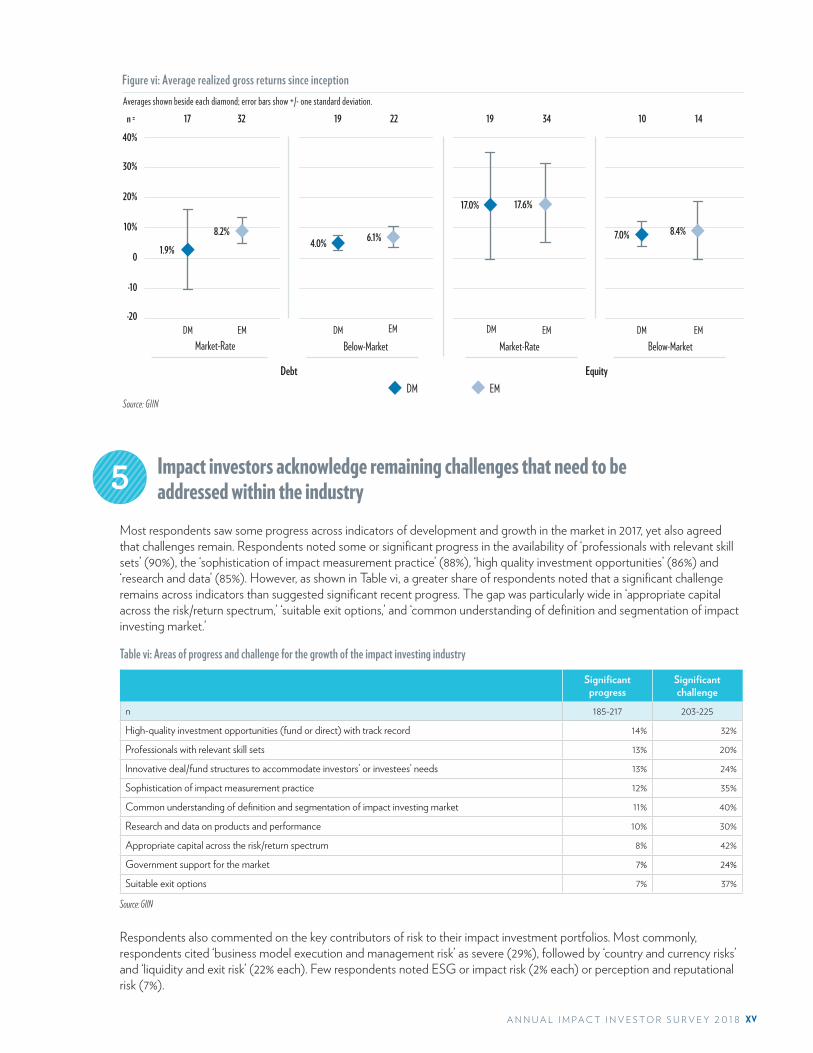
Respondents also self-reported their realized gross returns since inception (Figure vi). As could be expected, returns were higher on average among equity investments than among debt investments. Returns were also generally higher for those seeking risk-adjusted, market rates of return versus those seeking below-market returns. In most segments, emerging market investments performed similarly to developed market investments.
4 Overwhelmingly, impact investors report performance in line with both financial and impact expectations
XVA N N U A L I M P A C T I N V E S T O R S U R V E Y 2 0 1 8
Source: GIIN
-20
-10
0
10%
20%
30%
40%
Figure vi: Average realized gross returns since inception Averages shown beside each diamond; error bars show +/- one standard deviation.
1.9% 4.0%
17.0%
7.0% 8.2% 6.1%
17.6%
8.4%
19 1017 1922 1432 34
DM EM DM EM DM EM DM EM Market-Rate Market-Rate Below-MarketBelow-Market
Debt EquityDM EM
n =
Most respondents saw some progress across indicators of development and growth in the market in 2017, yet also agreed that challenges remain. Respondents noted some or significant progress in the availability of ‘professionals with relevant skill sets’ (90%), the ‘sophistication of impact measurement practice’ (88%), ‘high quality investment opportunities’ (86%) and ‘research and data’ (85%). However, as shown in Table vi, a greater share of respondents noted that a significant challenge remains across indicators than suggested significant recent progress. The gap was particularly wide in ‘appropriate capital across the risk/return spectrum,’ ‘suitable exit options,’ and ‘common understanding of definition and segmentation of impact investing market.’
Table vi: Areas of progress and challenge for the growth of the impact investing industry
Significant progress
Significant challenge
n 185-217 203-225
High-quality investment opportunities (fund or direct) with track record 14% 32%
Professionals with relevant skill sets 13% 20%
Innovative deal/fund structures to accommodate investors’ or investees’ needs 13% 24%
Sophistication of impact measurement practice 12% 35%
Common understanding of definition and segmentation of impact investing market 11% 40%
Research and data on products and performance 10% 30%
Appropriate capital across the risk/return spectrum 8% 42%
Government support for the market 7% 24%
Suitable exit options 7% 37%
Source: GIIN
Respondents also commented on the key contributors of risk to their impact investment portfolios. Most commonly, respondents cited ‘business model execution and management risk’ as severe (29%), followed by ‘country and currency risks’ and ‘liquidity and exit risk’ (22% each). Few respondents noted ESG or impact risk (2% each) or perception and reputational risk (7%).
5 Impact investors acknowledge remaining challenges that need to be addressed within the industry


1A N N U A L I M P A C T I N V E S T O R S U R V E Y 2 0 1 8
Sample CharacteristicsThe 2018 GIIN Annual Impact Investor Survey is based on data and insights from 229 impact investors. The following overview describes various characteristics of this sample.
Organization typeMost survey respondents were fund managers (59%; Figure 1); 46% and 13%, respectively, were for-profit and not-for-profit fund managers. Foundations comprise another 13% of the sample. Respondents also included banks (6%), family offices (4%), pension funds and insurance companies (4%), development finance institutions (3%), and others.
Figure 1: Organization typen = 229
Note: ‘Other’ organizations include community development finance institutions; non-governmental organizations; and advisors, incubators, and technical assistance providers that also make impact investments. Source: GIIN
46%
13%
13%
6%
4%
4% 3%
2% 9%
Fund manager: for-profitFund manager: not-for-profitFoundationBank / Diversified financial institutionFamily o�cePension fund / Insurance companyDFIPermanent investment companyOther
46%13%13%6%4%4%3%2%9%

2 G L O B A L I M P A C T I N V E S T I N G N E T W O R K
Headquarters locationThe majority of respondents were headquartered in developed markets (82% of the sample), including 47% headquartered in the U.S. and Canada and 30% based in WNS Europe (Figure 2). Fifteen percent were based in emerging markets, including 6% of respondents headquartered in SSA and 4% in LAC. The share of respondents headquartered in developed and emerging markets was consistent with that of last year’s sample.
Figure 2: Location of organization headquartersn = 229
Note: Six respondents reported no single headquarters location and are excluded from the map.Source: GIIN
47% U.S. & Canada 30% WNS Europe 6% SSA 4% LAC
2% SE Asia 2% South Asia 4% Oceania
1% East Asia 1% EECA0% MENA3% No single headquarters location
S. & Canada NS Europe AC
Asiauth Asia eania
n = 0
n = 10
n = 5
n =3
n = 3
n = 69
n = 108
n = 13n = 4
n = 8
Year of first impact investmentRespondents reported when they started making impact investments. Figure 3 shows that 16% of respondents have been making impact investments for over 20 years. Overall, findings indicate growth in the industry, as over half of respondents began impact investing during the last decade.
Figure 3: Year of first impact investmentn = 229
0
50
100
150
200
250
Source: GIIN
Pre-1997 1997
1998 1999
2000 2001
2002 2003
2004 2005
2006 2007
2008 2009
2010 2011 2012
2013 2014
2015 2016
2017
Number of organizations that made their first impact investment that year Cumulative number of organizations making impact investments
37
5 6 3 4 3
7 4 6
10 10 12 15 16
10 15
18 17
11 10 6 4
Cumu
lative
numb
er of
organi
zation
s maki
ngim
pact in
vestm
ents

3A N N U A L I M P A C T I N V E S T O R S U R V E Y 2 0 1 8
Target financial returnsMost survey respondents target risk-adjusted, market-rate returns (64%; Figure 4). The remaining 36% target below-market-rate returns, with 20% of respondents targeting returns that are closer to market rate and 16% seeking returns closer to capital preservation. The proportion of investors targeting market-rate returns was higher among Private Equity Investors (80%) than among Private Debt Investors (54%).
Figure 4: Target financial returns principally soughtn = 229
Source: GIIN
Risk adjusted, market-rate returnsBelow-market-rate returns: closer to market rateBelow-market-rate returns: closer to capital preservation
64%20%16%
64%
20%
16%
Impact-only and conventional investorsThis year, the Research Team asked respondents whether their organization exclusively makes impact investments or whether they also make ‘conventional investments’ (those without explicit impact intent). Most respondents (67%) solely make impact investments (Figure 5). The proportion of impact-only investors is much higher among EM-focused investors than DM-focused respondents: 85% of EM-focused investors make only impact investments, compared to 55% of DM-focused investors that do so.
Figure 5: Types of investments maden = 229
Source: GIIN
Impact investments onlyBoth impact and conventional investments
67%33%
67%
33%

4 G L O B A L I M P A C T I N V E S T I N G N E T W O R K
Motivations for making impact investmentsThe Research Team asked respondents what motivates them to make impact investments. The top three most-cited motivations—their mission, impact goals, or commitment as responsible investors—indicate that investors are driven by impact (Figure 6). The vast majority of respondents note that it is central to their mission to intentionally pursue impact though their investments or is part of their commitment as a responsible investor (with 98% noting each of these reasons as at least somewhat important). The third most common reason is that making impact investments is an efficient way to meet impact goals (97%).
Many investors are also motivated by more financially-driven factors. Eighty-six percent are motivated to make impact investments in response to client demand, with 46% noting client demand as a ‘very important’ motivation. This figure was higher among investors making conventional and impact investments than among investors making only impact investments (96% vs. 82%). Another motivation for making impact investments is that they are financially attractive relative to other investment opportunities (74% noting this as at least somewhat important).
Figure 6: Motivations for making impact investments
Note: Some respondents chose ‘not sure/not applicable’ and their responses are not included.Source: GIIN
Number of respondents that selected each answer shown beside each bar; optional question.
It is central to our mission to intentionally pursue impact through our investments.
They are part of our commitment as a responsible investor.
They are an e�cient way to meet our impact goals.
We are responding to client demand.
They provide an opportunity to gain exposure to growing sectors and geographies.
They are financially attractive relative to other investment opportunities.
They o er diversification to our broader portfolio.
We do so to meet regulatory demands. 9% 12% 79% 102
22% 33% 46% 129
43% 26% 181
34% 40% 26% 186
46% 40% 14% 170
73% 24% 4% 200
89% 9% 2% 204
91% 7% 2% 216
n =
31%
Very important Somewhat important Not important
Percent of respondents

5A N N U A L I M P A C T I N V E S T O R S U R V E Y 2 0 1 8
Sample characteristic by sub-groupFigure 7 shows the sample breakdown by basic characteristics such as geographic focus, instrument focus, and organization size. All sub-groups are defined in the Methodology section on page viii.
Figure 7: Sample breakdown by sub-group
Source: GIIN
Sub-group
DM-HQ Investors
EM-HQ Investors
EM-focused Investors
DM-focused Investors
Private Debt Investors
Private Equity Investors
Market-Rate Investors
Below-Market Investors
Impact-only Investors
Impact and Conventional Investors
Small Investors
Medium Investors
Large Investors
Percent of respondents
82%
15%
45%
42%
26%
24%
64%
36%
67%
33%
53%
24%
23%
Respondents headquartered in developed markets
Respondents headquartered in emerging markets
Respondents that allocate ≥ 75% of their current impact investment AUM to emerging markets
Respondents that allocate ≥ 75% of their current impact investment AUM to developed markets
Respondents that allocate ≥ 75% of their current impact investment assets under management (AUM) to private debt
Respondents that allocate ≥ 75% of their current impact investment AUM to private equity
Respondents that principally target risk-adjusted, market-rate returns
Respondents that principally target below-market-rate returns, some closer to market rate and some closer to capital preservation
Respondents that invest only in impact investing strategies
Respondents that invest in impact investing strategies in addition to conventional strategies
Respondents with total impact investment AUM ≤ USD 100 million
Respondents with total impact investment AUM > USD 100 million and USD 500 million
Respondents with total impact investment AUM > USD 500 million
Description of the category
n = 229
Notable overlap between sub-groups is outlined below:
• Eighty-five percent of EM-focused Investors are Impact-only Investors, while 55% of DM-focused respondents are Impact-only Investors.
• Among Large Investors, 88% seek market rates of return (compared to 73% of Medium Investors and 50% of Small Investors).
Sample characteristics among five-year repeat respondentsThe 82 respondents that completed the survey in 2014 and again in 2018 have characteristics consistent with the full sample, with little deviation in organization type or headquarters location. A slightly higher proportion target below-market returns (44%). A greater share of five-year repeat respondents make only impact investments (77%) compared to the full sample (67%). Lastly, in terms of their impact AUM, a slightly lower proportion are Small Investors (44%, compared to 53% for the full sample) and slightly more are Medium Investors (34%, compared to 24%).

6 G L O B A L I M P A C T I N V E S T I N G N E T W O R K
Investment Activity Capital invested since inceptionTogether, respondents reported a total of USD 447 billion of capital invested into 333,687 deals since their respective inceptions. Notably, this figure includes two outliers; the median respondent reported investing USD 106 million of capital invested into 42 deals since inception.
Activity in 2017 and plans for 2018Collectively, 225 respondents invested USD 35.5 billion into 11,136 investments during 2017 (Table 1). These respondents indicated plans for moderate growth. Together, they plan to invest USD 38.5 billion into over 11,700 investments in 2018, an 8% planned increase in the amount of capital and 5% increase in the number of deals. At the median, respondents plan to grow their capital invested from USD 17 million to USD 25 million while holding the number of investments steady, thus indicating anticipated growth in median deal size. The greatest share of respondents plan to increase the amount of capital they invest and their number of deals by more than 5% during 2018; only about a quarter plan to decrease their activity (Figure 8). Some fluctuation in investment activity is typical for investors given the often-cyclical nature of their activity.
Table 1: Number of investments and amount of capital invested in 2017 and planned for 2018n = 225; excludes two large outliers and two respondents that did not report 2017 investment activity.
Number of investments
Capital invested (USD millions)
2017 Reported
2018 Planned
2017 Reported
2018 Planned
Mean 53 54 168 179
Median 8 8 17 25
Sum 11,136 11,712 35,526 38,465 Aggregate % growth (projected) 5% 8%
Source: GIIN
By organization type, banks and diversified financial institutions reported the highest median amount of capital invested during 2017 (USD 150 million), followed by DFIs (USD 132 million; Table 2). DFIs also reported the highest median number of deals (38). Looking ahead, banks and diversified financial institutions reported the greatest expected growth in terms of capital investment in 2018 (projecting 24% growth), permanent investment companies (18%), and for-profit fund managers (16%). Foundations, on the other hand, indicated expectations to decrease the amount of capital they invest by 48%, a decrease notably driven by a single organization. Excluding this outlier, foundations plan to decrease the amount of capital they invest by 7%.
Number of deals
Figure 8: Number of respondents that plan to increase, maintain, and decrease their level of activity in 2018
Note: Excludes one respondent that did not report number of deals and two respondents that did not report capital invested.Source: GIIN
Increase by >5%
Maintain within 5% Decrease by >5%
49% 56%
25% 20%
26% 24%
Capital invested
n = 228 n = 227
Perce
nt of
respo
nden
ts

7A N N U A L I M P A C T I N V E S T O R S U R V E Y 2 0 1 8
Table 2: Investment activity by organization typeExcludes two outliers and two respondents that did not report investment activity.
Number of deals Capital invested (USD millions)
n Median 2017
Total 2017
Total Planned 2018
Median 2017
Total 2017
Total Planned 2018
Fund manager for-profit 105 8 7,857 8,273 23 18,344 21,261
Fund manager not-for-profit 30 10 701 717 13 1,133 1,346
Pension fund / Insurance company 9 9 155 109 116 5,408 4,273
DFI 6 38 321 371 132 5,169 5,614
Bank / Diversified financial institution 13 6 842 964 150 3,461 4,307
Foundation 30 5 221 206 10 1,189 619
Family office 8 4 50 51 5 92 87
Permanent investment company 4 4 17 23 1 50 60
Other 20 12 972 998 9 681 899
Total 225 8 11,136 11,712 17 35,526 38,465
Note: ‘Other’ organizations include community development finance institutions; non-governmental organizations; and advisors, incubators, and technical assistance providers that also make impact investments. Source: GIIN
Respondents that shared data on their investment activity had an average deal size in 2017 of USD 3.2 million (Figure 9). Market-Rate Investors made larger deals on average (USD 3.4 million) than Below-Market Investors (USD 2.1 million). DM-focused investors also reported a higher average deal size than did EM-focused Investors, although this difference was not statistically significant.
Figure 9: Average deal size in 2017 among various respondent segments Number of respondents shown above each bar; excludes two outliers and two respondents that did not report 2017 investment activity figures. Figures in USD millions.
Source: GIIN
3.22.7
3.7
1.8 1.8
3.4
2.1
Overall sample EM-focused Investors DM-focused Investors Private Debt Investors Private Equity Investors Market-Rate Investors Below-Market Investors
225 59 54 82101 95 143
USD m
illions
n =
Plans for 2017 compared to activity in 2017More than 150 respondents completed the survey both last year and this year, and Table 3 compares their planned investment activities to their reported activity. Nearly 70% of respondents exceeded their 2017 capital investment targets, in aggregate exceeding 2017 plans by 8%. However, most respondents fell short of their expected number of deals by 20% in aggregate for 2017. Excluding one respondent who drove a notable portion of this figure, aggregate deals exceeded plans by 9%.
Table 3: Capital invested and number of investments in 2017 among repeat respondentsn = 153; excludes two outlier respondents.
2017 Planned 2017 Reported Percent changePercent that exceeded by
>5%
Percent that met within +/- 5%
target
Percent that fell short by
>5%Number of deals 11,445 9,189 -20% 36% 23% 65%
Capital invested 23,722 25,527 8% 69% 45% 45%
Source: GIIN

8 G L O B A L I M P A C T I N V E S T I N G N E T W O R K
Investment activity over the past five yearsEighty-two respondents completed both the 2014 and 2018 surveys. In aggregate, these repeat respondents reported notable growth in yearly investment activity over this five-year period, increasing the amount of capital they invested from USD 6.1 billion in 4,140 deals in 2013 to USD 8.1 billion in 5,263 deals in 2017 (Figure 10). Together, this growth amounts to a 32% increase in yearly capital invested and a 27% increase in the number of deals over the five-year period. Average deal size held steady at approximately USD 1.5 million per investment.
Figure 10: Reported activity in 2013 and 2017 among five-year repeat respondents
Note: In the 2013 survey, respondents reported ‘capital committed’. In the 2017 survey, they reported ‘capital invested’.Source: GIIN
2013 2017
Capital invested (USD millions)
Number of deals
n = 82
6,115
8,091
4,140
5,263
Top regions of investment during 2017To better understand the nature of investment activity over the past year, the Research Team gathered information on the top three geographies and sectors to which respondents had deployed capital in 2017. Fifty-six percent of respondents indicated the U.S. & Canada among the top three regions to which they deployed capital (Figure 11). Other significant regions of investment included SSA (36%), LAC (29%), and WNS Europe (25%). This finding is consistent with overall portfolio allocations described in the Asset Allocations section on page 21.
Figure 11: Top three regions to which respondents deployed capital in 2017n = 220; showing percent of respondents that listed each geography in their top three for capital deployments in 2017. Optional question.
U.S. & Canada
SSA
LAC
WNS Europe
South Asia
SE Asia
EECA
Oceania
East Asia
MENA
Other
Source: GIIN
36%
29%
56%
22%
17%
25%
5%
4%
4%
10%
7%
Percent of respondents

9A N N U A L I M P A C T I N V E S T O R S U R V E Y 2 0 1 8
Respondents deployed capital across a diverse range of sectors (Figure 12). Thirty-seven percent listed food & agriculture among the top three sectors to which they deployed capital in 2017, followed by financial services (excluding microfinance; 27%), energy (26%), and housing (24%).
Figure 12: Top three sectors to which respondents deployed capital in 2017n = 215; showing percent of respondents that listed each sector in their top three for capital deployments in 2017. Optional question.
Food & ag
Fin services (excl. microfinance)
Energy
Housing
Microfinance
Education
Healthcare
ICT
WASH
Infrastructure
Conservation
Manufacturing
Arts & culture
Other
Note: ‘Other’ sectors include general environmentally sustainable investments, commercial real estate, inclusive supply chains, community development facilities, and retail services.Source: GIIN
27%
26%
37%
21%
20%
24%
9%
9%
8%
19%
7%
6%
4%
34%
Percent of respondents

10 G L O B A L I M P A C T I N V E S T I N G N E T W O R K
State of the Impact Investing Market Progress on indicators of market growthEach year, respondents share their views on progress in the past year on various indicators of market growth and development. As in previous years, respondents saw varying degrees of progress on different indicators (Figure 13).
Respondents were particularly positive about progress in the presence of ‘professionals with relevant skill sets’ (90% saw some or significant progress), the ‘sophistication of impact measurement practice’ (88%), the pipeline of ‘high-quality investment opportunities’ (86%), and the accessibility of ‘research and data’ (84%). On the other hand, 33% of respondents indicated seeing no progress in ‘government support for the market,’ and 14% perceived worsening government support. Nearly 40% of respondents indicated seeing no progress in the availability of ‘suitable exit options,’ and 25% indicated seeing no progress in the availability of ‘appropriate capital across the risk-return spectrum.’
Figure 13: Progress on indicators of market growthNumber of respondents shown above each indicator; some respondents chose ‘not sure/not applicable’ and are not included. Ranked by percent selecting ‘some progress’ or ‘significant progress’.
Source: GIIN
Sophistication of impact measurement
practice
Professionals with relevant skill sets
High-quality investment
opportunities (fund or direct) with track
record
Research and data on products and
performance
Innovative deal/fund structures to
accommodate investors’ or
investees’ needs
Common understanding of
definition and segmentation of impact
investing market
Appropriate capital across the risk/return spectrum
Suitable exit options
Government support for the market
13% 12% 14% 10% 13% 11% 8% 7% 7%
77% 76% 72% 74% 66% 66%63%
52% 45%
10% 11% 13% 15% 21% 18% 25% 40%33%
0%0% 0%0% 1% 6% 3% 2%15%
215 193202 184206n = 206215216 209
Perce
nt of
respo
nden
ts
WorsenedNo progressSome progressSignificant progress
In all regions of investment, respondents agreed that the industry has seen progress over the past year in the availability of skilled professionals, the sophistication of impact measurement practice, and the pipeline of high-quality investment opportunities. However, there were some notable variations:
• Eighty-three percent of investors allocating primarily to South Asia perceived some or significant progress in government support for the market versus 49% in the rest of the sample.
• LAC-focused investors saw less progress than others in a few areas, including the availability of suitable exit options (29% vs. 56%), availability of appropriate capital across the risk/return spectrum (47% vs. 75%), the use of innovative deal/fund structures to accommodate investors’ and investees’ needs (50% vs. 85%), and presence of professionals with relevant skill sets (75% vs. 90%).
Perceptions of progress also varied among other respondent segments. For example, Private Equity Investors were more likely to see significant progress on reaching a ‘common understanding of definition and segmentation of the impact investing market’ than were Private Debt Investors (14% vs. 6%). In many areas, market-rate-seeking investors indicated seeing more significant progress than did below-market investors, citing more progress on the ‘sophistication of impact measurement practice’ (15% vs. 7%), reaching a common understanding of definitions and segments (16% vs. 3%), availability of research and data (13% vs. 6%), and the pipeline of high-quality investment opportunities (18% vs. 7%).

11A N N U A L I M P A C T I N V E S T O R S U R V E Y 2 0 1 8
ChallengesAs has been true for the past several years, the lack of ‘appropriate capital across the risk/return spectrum’ was the most commonly cited challenge facing the growth of the impact investing industry (42%; Figure 14). Another 40% of respondents cited the lack of common understanding of the definitions and segments of the market as a significant challenge. Just one in five respondents this year perceived a lack of professionals with relevant skill sets to be a significant challenge.
Figure 14: Challenges to the growth of the impact investing industryNumber of respondents shown above each indicator; some respondents chose ‘not sure/not applicable’ and are not included. Ranked by percent selecting ‘significant challenge’.
Source: GIIN
Common understanding of
definition and segmentation of impact
investing market
Appropriate capital across the risk/return spectrum
Suitable exit options Sophistication of impact
measurement practice
High-quality investment
opportunities (fund or direct) with track record
Research and data on products and
performance
Innovative deal/fund structures to
accommodate investors’ or
investees’ needs
Government support for the
market
Professionals with relevant skill sets
42% 40% 37% 35% 32% 30% 24% 24% 20%
39% 39%37% 41% 43% 48%
44% 38% 41%
14% 16% 22% 18% 19% 19%23% 29% 25%
4%5% 6%5% 6% 3%9% 10% 14%
Perce
nt of
respo
nden
ts
221 221214 202222n = 219223224 207
Not a challengeSlight challengeModerate challenge Significant challenge
As shown in Table 4, a greater share of respondents noted that significant challenges remain across indicators than suggested seeing significant progress in the past year. This difference is to be expected, as ‘significant’ progress is rarely achieved in a single year. This gap was particularly wide in the availability of appropriate capital across the risk/return spectrum, suitable exit options, and a common understanding of definition and segmentation of impact investing market.
Table 4: Areas of progress and challenge for the growth of the impact investing industrySignificant
progressSignificant challenge
n 185-217 203-225
High-quality investment opportunities (fund or direct) with track record 14% 32%
Professionals with relevant skill sets 13% 20%
Innovative deal/fund structures to accommodate investors’ or investees’ needs 13% 24%
Sophistication of impact measurement practice 12% 35%
Common understanding of definition and segmentation of impact investing market 11% 40%
Research and data on products and performance 10% 30%
Appropriate capital across the risk/return spectrum 8% 42%
Government support for the market 7% 24%
Suitable exit options 7% 37%
Note: Scores are calculated by weighting each level of progress or challenge by the number of respondents selecting that level and summing those weighted totals. Source: GIIN
Respondents allocating capital to different, specific regions generally agreed that a lack of appropriate capital is a top challenge facing the industry (Table 5). Perceived challenges otherwise varied widely by region of investment:
• South Asia–focused investors perceived greater challenges in several areas, including a shortage of appropriate capital (69% citing it as ‘significant’ vs. 35% of the rest of the sample), lack of suitable exit options (62% vs. 41%), limited sophistication of impact measurement practice (58%), and lack of skilled professionals (38% vs. 19%).

12 G L O B A L I M P A C T I N V E S T I N G N E T W O R K
• Investors primarily allocating to the U.S. & Canada indicated greater challenges associated with the lack of ‘government support for the market’ (32% vs. 14%). However, they perceived fewer challenges in other areas, including the quality of available investment opportunities (21% vs. 33%) and availability of skilled professionals (12% vs. 19%).
• WNS Europe–focused investors were less likely to perceive the lack of a common understanding in the market as a significant challenge (20% vs. 40%). They did, however, indicate a lack of research and data to be a significant challenge (57% vs. 31%).
Table 5: Ranking of ‘significant’ challenges, by region of investment
LAC Oceania South Asia SSA U.S. &
CanadaWNS
Europen 15-16 5-6 12-13 20-25 53-58 13-15
Appropriate capital across the risk–return spectrum 63% 60% 69% 44% 29% 67%Common understanding of definition and segmentation of impact investing market 31% 0% 62% 52% 34% 20%
Suitable exit options 40% 0% 62% 35% 31% 40%
Sophistication of impact measurement practice 25% 17% 58% 32% 36% 27%High-quality investment opportunities (fund or direct) with track record 38% 0% 46% 32% 21% 43%
Research and data on products and performance 31% 17% 42% 13% 30% 57%Innovative deal or fund structures to accommodate investors’ or investees’ needs 31% 17% 38% 35% 16% 31%
Government support for the market 33% 17% 42% 23% 32% 36%
Professionals with relevant skill sets 20% 17% 38% 21% 12% 33%
≥ 50% ≥30%
Source: GIIN
Different segments of respondents also had varied perspectives on the severity of these challenges. Private Equity Investors, for example, were more likely to identify the lack of skilled professionals as a significant challenge than were Private Debt Investors (29% vs. 16%). Below-Market Investors perceived more significant challenges in several areas compared to Market-Rate Investors, namely the lack of a common understanding of the definitions and segmentation of the impact investing market (48% vs. 36%) and the ability to identify suitable exit options (47% vs. 31%). Market-rate-seeking respondents, on the other hand, were more likely to cite lack of research and data as a significant challenge (35% vs. 21% of Below-Market Investors).
Underlying causes of common challengesTo better understand several of these commonly faced challenges, the Research Team asked respondents to elaborate further on the factors underlying several commonly faced challenges.
Regarding the lack of appropriate capital across the risk/return spectrum, respondents noted that the industry needs several specific types of capital, including concessionary or catalytic capital, patient capital, and early-stage or high-risk capital. Respondents also noted constraints related to investors’ risk appetites (17%); respondents reported that investors perceive high risk among funds with little or no track record, among investments in certain geographies or sectors, and among investments into untested business models. Respondents also pointed out that investors often seek to invest larger amounts of impact capital than investees need, leading them to pass over smaller deals. Some investors’ lack of knowledge or understanding of impact investing (noted by 16%) highlighted the need for more tools and research (4%) and improved definitions and measurement of impact (3%). Finally, a handful of respondents consider the limited number of investment-ready businesses (5%) and insufficient cooperation among different players across the impact investing industry (5%) as barriers to placing capital.
Respondents also described challenges associated with a lack of high-quality investment opportunities. Nearly three-quarters pointed to the fact that it takes time to establish a track record, while many impact investment opportunities are new (Figure 15). Another two-thirds of respondents indicated that investors often perceive high risk associated with unfamiliar

13A N N U A L I M P A C T I N V E S T O R S U R V E Y 2 0 1 8
market segments or untested business models. Notably, a higher proportion of respondents cited perceived high risk (66%) than the proportion actual high risk (46%). In a positive sign for the industry, fewer respondents indicated that the lack of high-quality investment opportunities results from a lack of commercial opportunities in the impact investing space or from a lack of business acumen on investee management teams (37% and 26% of respondents, respectively).
Figure 15: Factors underlying a lack of high-quality investment opportunities (fund or direct) with track record
Note: ‘Other’ factors include a lack of seed and venture-stage capital, limited availability of capacity-building support, poor educational infrastructure (particularly in certain emerging markets), and high competition among impact investors for deals.Source: GIIN
n = 214; optional question.
66%
46%
37%
26%
8%
Establishing a track record takes time, and many investment opportunities in the space are new.Investors often perceive high risk due to the unfamiliar nature of new market segments or untested business models.
Good investment opportunities exist, but risks are higher in the markets in which many impact investment opportunities exist.Investment opportunities with commercial returns potential are limited in the impact investing space.
Investee management teams often have strong mission drive, but lack the business acumen of entrepreneurs in conventional markets.
Other
73%Percent of respondents
Lastly, respondents were asked to share specific topics on which further research could help inform and improve their work. Of 89 responses to this question, a plurality requested further research on investment performance, with 40% noting a need for more research on financial performance and 17% noting a need for impact performance research. Sixteen percent would welcome research on impact measurement, investment structures, and the UN Sustainable Development Goals (SDGs). Finally, 7% would find research on market trends and activity useful, especially for specific geographies and sectors.
Insight: Organizations making both conventional and impact investmentsWith the entry of a number of large financial players into impact investing in recent years, impact investing has become more ‘mainstream.’ The Research Team therefore delved further this year to better understand dynamics within such organizations (Figure 16). Eighty-four percent of these respondents noted that their organizations are making more impact investments and demonstrating greater commitment to measuring and managing their impact than they were three years ago. Another 72% indicated gaining greater buy-in from internal stakeholders, with internal conversations shifting from the question of ‘why’ impact investing to ‘how.’ Just 6% of respondents indicated facing greater reluctance by their organizations to make impact investments.
Figure 16: Change in organizations’ perceptions and practice of impact investing in the last three years
Source: GIIN
n = 64 respondents that make impact and conventional investments. Optional question.
84%
72%
70%
53%
6%
My organization is making more impact investments. Percent of respondents
My organization has a greater commitment to measuring and managing the impact of impact investments.
There is greater buy-in from internal stakeholders to have an impact investing arm.
The conversations with internal stakeholders have moved more from the ‘why’ to the ‘how’ of impact investing.
It is easier to persuade others in my organization to make impact investments.
Key decision-makers are more reluctant to make impact investments.
84%
Compared to three years ago...

14 G L O B A L I M P A C T I N V E S T I N G N E T W O R K
Looking ahead, respondents indicated that most potential organization-level challenges to growing impact investing were not significant at their respective firms (Figure 17). The greatest share of respondents cited the need to convince key decision-makers of the potential financial performance of impact investments as a significant challenge (31%). A fifth of respondents found it a significant challenge to demonstrate sufficient client demand for impact investing products, but more than two-fifths did not feel this was a challenge. Further, over half of respondents (55%) faced no difficulty demonstrating concrete examples of peers engaged in impact investing, and just 10% of respondents found it significantly challenging to prove that impact investments are consistent with their fiduciary duty.
Figure 17: Significance of challenges to gaining buy-in for impact investingNumber of respondents shown above each challenge; some respondents chose ‘not sure/not applicable’ and are not included. Ranked by percent selecting ‘significant challenge’. Optional question for organizations that also make conventional investments.
Source: GIIN
Demonstrating su�cient client demand for impact investing
products
21%
37%
42%
Convincing decision-makers of financial performance
potential (e.g., returns, risk mitigation, or diversification)
31%
47%
23%
Demonstrating concrete examples of
how peers are doing this
12%
33%
55%
Convincing decision-makers of
impact potential
14%
41%
45%
Persuading decision-makers about the broader ‘movement’ and of
the risks of not making impact investments
10%
45%
45%
Demonstrating that impact investments are
consistent with our fiduciary duty
10%
47%
43%
Other
33%
17%
50%
58 662n = 625843 56
Perce
nt of
respo
nden
ts
Not a challengeModerate challenge Significant challenge

15A N N U A L I M P A C T I N V E S T O R S U R V E Y 2 0 1 8
2017 Market DevelopmentNoteworthy announcements in impact investingContinuing the market’s strong growth in recent years, 2017 witnessed new large commitments and announcements from a wide range of investor types. Foundations that have long aligned their grant-making with their missions committed to investing some or all of their endowments in mission-aligned impact. Meanwhile, large asset managers and institutional investors committed billions to impact investing.
Foundation announcements
• In April 2017, Ford Foundation announced that it will commit USD 1 billion of its USD 12 billion endowment to mission-related investments over the next ten years, the largest commitment thus far of philanthropic endowment to impact investing. The Foundation will begin by focusing on investments in affordable housing in the United States and access to financial services in emerging markets.2
• The Heron Foundation announced in December 2016 that it had met its goal to move all of its USD 270 million endowment into impact investments by 2017, a process that began in 2012 and included a change to its investment policy stating that mission-alignment is part of the foundation’s fiduciary duty. Four years later, the completion of this process reinforces Heron’s commitment to impact investing. Its strategy aims to generate employment and alleviate poverty.3
• The Michael & Susan Dell Foundation announced in May 2017 that it would add USD 1 billion to its endowment, which had declined to USD 646 million after years of about 15% annual spending on grants and impact investments (much more than the required minimum of 5% per year). With its larger endowment, the foundation intends to increase its impact investments to focus on social entrepreneurs tackling child poverty in the United States, India, and South Africa.4
Fund and institutional announcements
• The Global Steering Group for Impact Investment (GSG) developed the India Education Outcomes Fund (IEOF) and the India Impact Fund of Funds (IIFF) in 2017, meeting with stakeholders and initiating fundraising. The funds, officially launching in 2018, each aim to raise USD 1 billion.5 The IEOF, which will be managed by a team at Social Finance India, will target improvements in primary and secondary education in the country and raise capital from government agencies, foundations, and fund managers.6 The IIFF will invest primarily in debt funds in a variety of sectors, such as agriculture, clean energy, financial inclusion, healthcare, affordable housing, and water and sanitation; it plans to raise first-loss capital from grantors and nonprofit organizations to catalyze investment from HNWIs, corporations, and endowments.7
• TPG Rise Fund announced in October 2017 that it had raised USD 2 billion, surpassing its target of USD 1.5 billion to reach the maximum amount of outside capital allowed by its investment agreement.8 The fund uses evidence-based approaches to invest in companies that generate positive social and environmental impact through their core business operations.9 It is investing globally in various sectors, including food & agriculture, financial services, ICT, energy, and education.10
• Zurich Insurance Group announced in November 2017 that it will more than double its commitment to responsible and impact investing from USD 2 billion to USD 5 billion. Zurich will invest globally in various asset classes, such as private equity, social and green bonds, and other investment vehicles it has yet to explore. Through these investments, Zurich aims annually to eliminate five million tons of CO2 emissions and improve the lives of five million people as beneficiaries of the projects in which it invests.11
2 Debby Warren, “Can Ford Foundation’s $1 Billion Impact Investing Commitment Alter the Field?,” Nonprofit Quarterly, March 6, 2017, https://nonprofitquarterly.org/2018/03/06/can-ford-foundations-1-billion-impact-investing-commitment-alter-field/.
3 Anne Field, “Mission Accomplished: How The Heron Foundation Went ‘All In’,” Forbes, March 30, 2017, https://www.forbes.com/sites/annefield/2017/03/30/mission-accomplished-how-the-heron-foundation-went-all-in/#87e5e7d4d179.
4 Ben Paynter, “Why The Dell Foundation Is Betting Big On Social Entrepreneurs,” Fast Company, May 11, 2017, https://www.fastcompany.com/40419354/why-the-dell-foundation-is-betting-big-on-social-entrepreneurs.
5 Taslima Khan, “Ronald Cohen’s Impact May Get $2 Billion for India,” The Economic Times, February 14, 2017, https://economictimes.indiatimes.com/small- biz/startups/newsbuzz/ronald-cohens-impact-may-get-2-billion-for-india/articleshow/62910525.cms.
6 Global Steering Group for Impact Investment , “Social Finance India & India Education Outcomes Fund: Business Plan,” February 14, 2018, http://gsgii.org/wp-content/uploads/2018/03/Preliminary-Draft_-IEOF-Business-Plan-FINAL.pdf.
7 Global Steering Group for Impact Investment, “India Impact Fund of Funds: Business Plan,” February 2018, http://gsgii.org/wp-content/uploads/2018/03/Preliminary-Draft_-IIFF-Business-Plan-FINAL.pdf.
8 Melissa Mittelman, “TPG Seals Record $2 Billion for Fund Co-Led by Bono,” Bloomberg, October 3, 2017, https://www.bloomberg.com/news/articles/2017-10-03/tpg-seals-record-2-billion-for-rise-impact-fund-co-led-by-bono.
9 The Rise Fund, “Vision,” accessed on March 27, 2018, http://therisefund.com/#vision.
10 The Rise Fund, “Leadership,” accessed on March 22, 2018, http://therisefund.com/#leadership.
11 Zurich Insurance Group, “Zurich Increases its Commitment to Impact Investments and Introduces Impact Targets,” news release, November 23, 2017, https://www.zurich.com/en/media/news-releases/2017/2017-1123-01.

16 G L O B A L I M P A C T I N V E S T I N G N E T W O R K
Current Market TopicsTo remain informed of the quickly-evolving impact investing industry, the Research Team gathers practitioners’ insights on key developments and ‘hot topics’ each year. Given the rapid growth of the market and the entrance of several prominent, mainstream investors, respondents offered their thoughts on the risks of ‘impact washing’ and how to preserve the market’s integrity through significant changes and growth. They also shared their views on emerging technologies, the importance of governmental policy to advancing the field, and the role of blended finance.
Preserving impact integrity The impact investing market has grown rapidly, with many well-known, large-scale firms entering over the past few years. Last year, respondents shared their opinions on the recent entry of these large investors, generally viewing the trend as positive but also identifying a risk of mission drift or ‘impact dilution.’ This year, they shared their views on how to mitigate risk of impact washing.
Most respondents highlighted the importance of greater transparency around impact, with 80% agreeing that ‘greater transparency from impact investors on their impact strategy and results’ would help mitigate the risk of mission drift (Figure 18). Forty-one percent agreed that ‘third-party certification of what qualifies as an impact investment’ would help mitigate the of risk impact washing, and 31% and 26%, respectively, agreed that shared principles or a code of conduct were potential approaches. Twenty-one percent believe that no action is necessarily required because ‘the market mechanism will address the risk of impact washing.’
Figure 18: Approaches to mitigate the risk of impact washingn = 212; optional question.
A code of conduct that impact investors need to commit to
The market mechanism will address the risk of impact washing
A (voluntary) set of principles governing impact investor behavior
Greater transparency from impact investors on impact strategy
and results
Third-party certification of what qualifies as an
impact investment
Source: GIIN
80%
41%31%
26% 21%
Perce
nt of
respo
nden
ts
To clarify what a shared set of principles or code of conduct might look like, respondents outlined their views on the importance of a variety of practices impact investors might demonstrate (Table 6). Most important, respondents reported, were practices core to the definition of impact investing: impact investors should intentionally target investments that positively address one or more social or environmental challenges (92% rating this very important), determine their impact goals or objectives at the time of investment (76%), and regularly measure their progress towards those goals throughout the lifetime of the investment (76%).
Also important, according to respondents, are articulation and communication of organizations’ impact strategies. Roughly two-thirds of respondents rated it very important for investors to articulate how impact is factored into investment decisions and management, to articulate a clear theory of change (i.e., linking their investment strategies to approaches to social or environmental challenges), and to regularly communicate progress towards impact goals to relevant stakeholders. Of lower importance are to link compensation to impact performance or to conduct independent, third-party audits of progress toward investors’ impact goals.

17A N N U A L I M P A C T I N V E S T O R S U R V E Y 2 0 1 8
Table 6: The importance of various impact investing practicesNumber of respondents varies from 207 to 212; optional question.
Practice Level of importance
Very important
Somewhat important
Not important
Intentional targeting of investments that positively address one or more social/environmental challenges 92% 7% 1%
Impact goals/objectives determined at the time of investment 76% 23% 1%
Measurement of progress against impact goals at regular intervals throughout investment 76% 23% 1%Articulation of how impact is factored into decisions about investment selection and management 67% 30% 2%
Articulation of a clear theory of change linking investment strategy to ways to address social/environmental challenge(s) 66% 29% 5%
Communication of progress against impact goals to relevant stakeholders at regular intervals 65% 32% 2%
Active management of ESG and impact risk 53% 42% 5%
Deliberate pursuit of strategies to try and ensure impact continues post-investment 50% 39% 10%
Articulation of investors’ contribution towards measures of impact achieved 31% 48% 21%Investor/advisor compensation linked to the impact performance of investments (not just financial performance) 30% 42% 29%
Audits of progress against impact goals by an independent third party 23% 50% 26%
≥50% ≥30% Source: GIIN
TechnologyTechnological advancement continues at a rapid pace, and many stakeholders wonder how these developments will affect the impact investing market. Respondents shared their views on the importance of various technologies for the field over the next three years (Figure 19). Respondents expect the most important technologies to be analysis and use of big data (56% rating this ‘very important’) and automated data collection and analysis (45%). Twenty-nine percent also cited blockchain technology as ‘very important’ for impact investing. Interestingly, 40% of respondents do not believe robo-advisors or algorithms for portfolio management will prove important. The effect of new technologies on impact investing remains to be seen, but some respondents speculated about both positive effects and risks. One fund manager, for example, noted, “robo-advisors may be important in bringing in new capital, but [are] also likely to result in significant watering down of what is termed an ‘impact investment.’”
Figure 19: The importance of various technologies for impact investing over the next three yearsNumber of respondents shown above each technology; some respondents chose 'not sure' and are not included. Ranked by percent se lecting 'very important'. Optional question.
Source: GIIN
Automated data collection & analysis
45%
47%
8%
Analysis / use of big data
56%
36%
7%
Machine learning / artificial intelligence
23%
52%
25%
Blockchain technology
29%
55%
17%
Robo-advisors / algorithms for portfolio management
15%
45%
40%
Augmented reality (AR) / virtual reality (VR) technology
8%
38%
54%
187n = 149 152184 157 145
Perce
nt of
respo
nden
ts
Not importantSomewhat importantVery important

18 G L O B A L I M P A C T I N V E S T I N G N E T W O R K
PolicyGovernment policy can encourage investors to make impact investments—or deter them. Respondents ranked the top three government actions or policies that they believe would most help their organizations make impact investments (Table 7). Most useful, according to respondents, is government provision of credit enhancement, such as guarantees or first-loss capital. For example, one organization commented that government guarantees or first-loss capital can help bring in other investors, especially with illiquid investments or those with lower expected financial returns to serve very marginalized groups of people. Several respondents identified risks of credit enhancement as well, such as the potential to distort the market through below-market debt or subsidies that could “undermine legitimate investment strategies.” These respondents noted that policymakers should carefully consider the structure of such policies to avoid potential negative consequences.
Other helpful policies, according to respondents, include tax credits or other subsidies for investors. As one fund manager commented, “climate policy and carbon markets directly influence our climate-smart forestry investment strategies. The extension of California’s cap-and-trade program to 2030 supported a new investment in the hundreds of millions of dollars that will deliver millions of tonnes of climate mitigation.” Another fund manager pointed to the benefits of taxes on environmentally detrimental industries (such as a greenhouse gas tax).
Additional helpful actions, according to respondents, include government funding of technical assistance for investees and co-investment into impact investments. Somewhat less important but still helpful to their ability to make impact investments, respondents suggest, would be regulation for investment offerings, including clearly defined regulation around fiduciary duty. The least important government action, according to respondents, is government procurement of goods and services from investees.
Table 7: The importance of government actions or policies to help organizations make impact investmentsn = 209; optional question.
Government policy or action Total score
Provision of credit enhancement (e.g., guarantees, first-loss capital) 356
Tax credits or subsidies for investors 220
Funding for technical assistance for investees 216
Co-investment by government agency 205
Streamlined, clearly defined regulation for investment offerings (e.g., fiduciary duty) 168
Procurement of goods and services from investees 61
Note: Respondents ranked the top three actions or policies from the six options in the table. Total scores were calculated by giving first-choice rankings a score of three, second-choice rankings a score of two, and third-choice rankings a score of one, then multiplying these by the number of respondents selecting each option. Source: GIIN
Respondents also commented on which current events (political or economic) have influenced their impact investing strategy or goals. Many noted that the Sustainable Development Goals have played a key role, such as in “providing an additional frame/lens” to communicate their work. They also remarked on specific country contexts. One respondent noted that the political environment and economic downturn in Brazil has affected some of their investees, particularly those that sell to the public sector. Another said that the country’s recent launch of a national policy on social finance—driven by the Brazilian National Advisory Board, supported by the Global Steering Group (GSG)—has “opened doors on several public agencies we wouldn’t be able to access before.” The GSG is active in sixteen total countries and the European Union. In another nod to conducive policies, a respondent pointed to the Indian government’s laws that allow incubators to use corporate social responsibility funding for startups. Conversely, an organization investing in Myanmar said they’ve held their investment activity there due to the government’s policies toward the Rohingya population.
In the U.S. context, one pension fund commented that “changes to [the] corporate tax rate and the possibility of federal housing subsidies going away may reduce [the] number of multifamily/low income housing tax credit transactions that we will have an opportunity to invest in.” Several respondents commented on changing energy policies—such as the U.S. Administration’s stance on clean energy, which one fund manager said has made it “more cautious about investing in renewable energy companies with major U.S. exposure.” On a positive note, another noted that changes in U.S. politics have made “more private sector players want to step up to impact.”

19A N N U A L I M P A C T I N V E S T O R S U R V E Y 2 0 1 8
Across the board, respondents agree that political shifts that cause inequality or other challenges simultaneously uncover opportunities for investment capital and market-based solutions to address these challenges. One fund manager noted, “increasing inequalities have strengthened our search for new impact themes for underserved groups, such as education.” Another pension fund commented that uncertainty around the implications of government budget changes and concern about “our ability to pursue advances in racial and economic equity have focused our investments on organizations most impacted.”
Blended financeBlended finance has attracted increasing interest as an impact investment approach. Respondents indicated whether they have participated in a blended finance deal (Table 8); if they have not, they offered some reasons for not participating (Figure 20). Seventy-five percent of respondents have either participated in a blended finance deal or plan to do so. A higher proportion of Below-Market Investors have participated in blended finance investments compared to Market-Rate Investors; the same holds true for Private Debt compared to Private Equity Investors.
Below-Market InvestorsOverall
Market-Rate Investors
Private Equity Investors
Table 8: Investor participation in blended finance deals
EM-focused Investors
DM-focused Investors
Source: GIIN
Yes 57% 51% 68% 56% 55% 38%
No, but we plan to in the future 17% 18% 16% 23% 12% 23%
No, and we do not plan to 25% 31% 16% 22% 33% 39%
Private Debt Investors
71%
10%
19%
n = 229 147 82 103 97 5659
Investors commented on the roles that blended finance plays in the impact investing industry (Figure 20). Most respondents agree that blended finance de-risks transactions for investors (83%) and can be used to ‘attract funding for large-scale, high-impact investments’ (66%) or ‘bring together expertise from different organizations and players’ (52%). Thirty-five percent of respondents also believe that blended finance can improve impact performance.
Figure 20: Roles of blended finance in impact investingn = 205
66%
52%
35%
83%To de-risk transactions for investors Percent of respondents
To attract funding for large-scale, high-impact investments
To bring together expertise from di�erent organizations/players
To improve impact performance
Source: GIIN
Blended finance is a strategy that combines capital with different levels of risk in order to catalyze risk-adjusted, market-rate-seeking capital into impact investments.

20 G L O B A L I M P A C T I N V E S T I N G N E T W O R K
Nonetheless, a quarter of organizations have neither taken part in a blended finance deal nor plan to do so. Interestingly, no investors have avoided blended finance deals for lack of confidence in their ability to create social or environmental impact (Figure 21). Most commonly, as cited by 45% of respondents not participating in blended finance deals, is that such deals do not fit their investment models. Other investors have not yet found the right deals (23%) or co-investors (20%). A smaller proportion note that these deals are too complex (12%) or time-consuming (8%) to execute. One fund manager commented, that “more progress needs to be made in order for blended finance to be replicable.”
Figure 21: Reasons for not participating in blended finance dealsn = 95; optional question.
23%
20%
12%
45%Blended finance deals do not fit our investment model. Percent of respondents
We haven’t found the right deals.
We haven’t found the right co-investors.
The deals are too complex.
8%
0%
18%
The deals are too time-consuming.
The deals would not yield the desired social/environmental impact.
Other
Note: ‘Other’ included reasons like regulatory restrictions, LP hesitations or lack of understanding, or simply that investors have not yet considered these types of deals or come across them.Source: GIIN

21A N N U A L I M P A C T I N V E S T O R S U R V E Y 2 0 1 8
Asset Allocations Assets under managementAs of year-end 2017, 226 respondents collectively managed USD 228.1 billion in impact investing assets.12 The median respondent managed USD 92 million, significantly lower than the average of USD 1.0 billion (Figure 22). Several respondents manage particularly large pools of capital; the two largest respondents account for 38% of total AUM. To nuance findings, analysis in this section will note either the inclusion or exclusion of these outliers.
Figure 22: Distribution of sample AUMn = 226; USD millions. Showing 5th through 95th percentiles.
Source: GIIN
0 1,000 500 3,000 3,500
AUM
(USD
millio
ns)
5TH Percentile 25TH Percentile 95TH Percentile Mean75TH PercentileMedian (50TH Percentile)
1,009
To better understand growth in impact investing activity over the past five years, the Research Team analyzed asset allocations among the 81 respondents that provided data for 2013 and 2017 and shared AUM data. Collectively, these respondents grew their AUM from USD 30.8 billion in 2013 to USD 50.8 billion in 2017, a 13% compound annual growth rate (CAGR). At the median, the same 81 respondents grew their AUM from USD 105 million to USD 156 million.
Many impact investors manage diversified portfolios that may also include conventional investments. The 65 respondents that make conventional and impact investments and shared their asset allocations collectively manage USD 87.9 billion in impact investing assets. On average, impact investments comprise 28% of their portfolios, but the range is wide; for some, impact investments are just a fraction of a percent of their overall activity while for others they represent nearly their full portfolio. Notably, larger organizations tend to allocate a smaller portion of their total AUM to impact investing.
12 Three respondents declined to provide AUM information.

22 G L O B A L I M P A C T I N V E S T I N G N E T W O R K
AUM by organization typeThe volume of impact investing AUM varies by organization type (Table 9). Fund managers comprise 59% of the sample and manage 32% of AUM. DFIs comprise just 3% of the sample yet account for 45% of AUM. Notably, the median AUM among DFIs is much higher than that of other organization types. Pension funds and insurance companies manage 13% of AUM.
Table 9: AUM by organization typen = 226
Organization type n Median (USD millions)
Mean (USD millions)
Sum (USD millions)
Percent of total AUM
DFI 7 7,000 14,703 102,923 45%
Fund manager: For-profit 106 135 637 67,494 30%
Fund manager: Not-for-profit 30 72 146 4,385 2%
Pension fund / Insurance company 9 450 3,282 29,542 13%
Bank / Diversified financial institution 14 400 1,042 14,591 6%
Foundation 30 63 201 6,036 3%
Family office 6 46 78 469 0.2%
Permanent investment company 4 6 37 148 0.1%
Other 20 30 126 2,513 1%
Note: ‘Other’ includes community development finance institutions; non-governmental organizations; and accelerators, incubators, and technical assistance providers that also make impact investments. Source: GIIN
Nearly 80% of capital was invested directly into companies, projects, or real assets, with the remaining 20% invested indirectly, including through funds or other intermediaries. As fund managers also participated in this survey, note that some portion of that 20% of AUM may be double-counted in total AUM figures. Excluding two outliers, 60% of capital invested directly is managed by fund managers, and 18% is managed by DFIs, who further manage a large portion of capital invested indirectly (39% excluding outliers). Banks or diversified financial institutions also manage a large amount of indirectly invested capital (22%).
AUM by geography of investmentImpact investors allocate capital globally, with respondents allocating the greatest share to the U.S. & Canada (20%), followed by LAC (16%) and SSA (12%; Figure 23). Respondents also deployed the most capital to these three regions in 2017 (see the Investment Activity section for more detail). Excluding two large outliers, the allocation to the U.S. & Canada increases to 29%, while the other top regions for investment remain largely the same. Altogether, respondents allocated over half of total AUM (56%) to emerging markets.
Figure 22 also shows the percentage of respondents with any capital allocated to each geography. The greatest proportion of respondents allocated capital to the U.S. & Canada (48%), followed by SSA (46%) and LAC (40%).

23A N N U A L I M P A C T I N V E S T O R S U R V E Y 2 0 1 8
Figure 23: Geographic allocations by AUM and percent of respondentsLeft side, Percent of AUM: n = 226; total AUM = USD 228.1 billion. Right side, Percent of respondents with any allocation to each geography: n = 229; respondents may allocate to multiple geographies.
Note: ‘Other’ includes investments with a global focus.Source: GIIN
U.S. & Canada
LAC
SSA
WNS Europe
EECA
South Asia
SE Asia
East Asia
MENA
Oceania
Other
48%
40%
46%
31%
20%
35%
31%
16%
15%
8%
13%
20%
16%
12%
11%
10%
7%
6%
5%
5%
3%
5%
Percent of respondentsPercent of AUM
Different respondent segments had somewhat varied geographic allocations (Table 10).13 The higher allocation shown among Private Equity Investors to the U.S. & Canada than among Private Debt Investors is remarkable but largely driven by two respondents. Below-Market Investors indicate geographic concentration in developed markets, whereas Market-Rate Investors allocate across both developed and emerging markets.
Private Equity InvestorsOverall
Private Debt Investors Medium Large
Table 10: Geographic allocations by various respondent segments
Asset class focus Size of impact investing AUMTarget returns
Market-Rate Investors
Below-Market Investors
Source: GIIN
U.S. & Canada 20% 8% 48% 19% 40% 36% 18%LAC 16% 23% 5% 17% 5% 10% 16%SSA 12% 16% 17% 12% 24% 19% 12%
WNS Europe 11% 4% 7% 5% 1% 15% 11%EECA 10% 17% 1% 11% 11% 3% 11%
South Asia 7% 9% 14% 10% 2% 9% 7%SE Asia 6% 11% 4% 7% 11% 3% 6%
East Asia 5% 3% 1% 5% 2% 1% 5%MENA 5% 6% 0.3% 6% 2% 0.6% 5%
Oceania 3% 0.3% 0.0% 3% 0.5% 0.6% 3%Other 5% 3% 4% 6% 1% 2% 6%
Number of investors 226 59 55 144 82 55 52Total AUM
(USD millions)228,100 37,771 13,140 216,697 11,404 15,022 208,415
Small 29%16%15%12%3%
13%5%
0.4%1%4%1%
1194,664
13 While these differences suggest interesting distinctions, they have not been tested for statistical significance.

24 G L O B A L I M P A C T I N V E S T I N G N E T W O R K
Looking ahead, respondents indicate strong interest in emerging markets in the coming year. The greatest share of respondents plans to increase their allocations to SSA and SE Asia in the coming year (44% each; Figure 24), and 41% of respondents also expect to increase their allocations to LAC. Notably, 10% and 8% of respondents plan to decrease their allocations to EECA and LAC, respectively, in 2018.
Figure 24: Planned allocation changes in 2018, by geography
Source: GIIN
Decrease Begin to assess Maintain Increase
EECA
Oceania
U.S. & Canada
MENA
WNS Europe
South Asia
East Asia
LAC
SE Asia
SSA
10%
2%
5%
5%
6%
3%
4%
8%
1%
5%
8%
21%
8%
15%
7%
8%
8%
5%
9%
7%
60%
52%
61%
53%
56%
55%
52%
46%
46%
44%
23%
25%
27%
27%
31%
34%
36%
41%
44%
44%
62
44
104
59
71
64
95
99
87
111
n =Percent of respondents
Number of respondents shown beside each region some respondents chose 'not applicable' and are not included. Ranked by percent selecting 'increase'. Optional question.
Among 81 five-year repeat respondents, the fastest growth in allocations were reported in Oceania (45%), East and SE Asia (28%), and MENA (26%; Table 11). South Asia and EECA also experienced growth, but at rates lower than the overall average.
Table 11: Growth in regional asset allocations among repeat respondents (2013–2017)n = 81; figures in USD millions.
Geography 2013 2017 CAGR
Oceania 37 164 45%East and SE Asia 2,721 7,258 28%MENA 481 1,224 26%LAC 4,761 8,226 15%SSA 4,961 8,394 14%U.S. & Canada 6,698 10,436 12%WNS Europe 3,258 4,865 11%South Asia 3,343 4,229 6%EECA 3,496 4,058 4%Other 1,034 1,922 17%Total 30,790 50,777 13%
Note: East and SE Asia were disaggregated as regions in 2017. To ensure comparability with 2013 responses, they have been recombined for this analysis. Source: GIIN

25A N N U A L I M P A C T I N V E S T O R S U R V E Y 2 0 1 8
AUM by sector of investmentThe impact investing market overall has significant diversification by sector (Figure 25). Together, respondents allocated the greatest share of capital to financial services excluding microfinance (19%), followed by energy (14%). However, a wide range of sectors receive 3% to 9% of allocations, including microfinance, housing, food & agriculture, infrastructure, and healthcare. Findings are largely the same when excluding outliers.
Fifty-seven percent of respondents noted at least some allocation to food and agriculture, more than to any other sector although it accounts for just 6% of total asset allocations. A high proportion of respondents also had allocations to healthcare (49%), energy (48%), financial services excluding microfinance (45%), and housing (45%).
Figure 25: Sector allocations by AUM and percent of respondentsLeft side, Percent of AUM: n = 226; total AUM = USD 228.1 billion.Right side, Percent of respondents with any allocation to each sector: n = 229; respondents may allocate to multiple sectors.
Note: Other sectors include SMEs, child welfare, commercial goods, transport, retail, tourism, forestry, and commercial real estate.Source: GIIN
57%
45%
48%
35%
45%
17%
49%
25%
41%
15%
16%
23%
11%
45%
Fin services (excl. microfinance)
Energy
Microfinance
Housing
Food & ag
Infrastructure
Healthcare
WASH
Education
Manufacturing
Conservation
ICT
Arts & culture
Other
19%
14%
9%
8%
6%
5%
5%
4%
4%
3%
3%
3%
0%
16%
Percent of respondentsPercent of AUM
Different segments of respondents indicated some variation in their sector allocations (Table 12):
• DM-focused respondents allocated a greater share of capital to housing than did EM-focused respondents (20% vs. 1%).
• Conversely, EM-focused respondents allocated more to microfinance (12% vs. 0%).
• Private Debt Investors allocated more of their capital to microfinance than did Private Equity Investors (34% vs. 3%).
Looking ahead, respondents indicate strong interest in emerging markets in the coming year. The greatest share of respondents plans to increase their allocations to SSA and SE Asia in the coming year (44% each; Figure 24), and 41% of respondents also expect to increase their allocations to LAC. Notably, 10% and 8% of respondents plan to decrease their allocations to EECA and LAC, respectively, in 2018.
Figure 24: Planned allocation changes in 2018, by geography
Source: GIIN
Decrease Begin to assess Maintain Increase
EECA
Oceania
U.S. & Canada
MENA
WNS Europe
South Asia
East Asia
LAC
SE Asia
SSA
10%
2%
5%
5%
6%
3%
4%
8%
1%
5%
8%
21%
8%
15%
7%
8%
8%
5%
9%
7%
60%
52%
61%
53%
56%
55%
52%
46%
46%
44%
23%
25%
27%
27%
31%
34%
36%
41%
44%
44%
62
44
104
59
71
64
95
99
87
111
n =Percent of respondents
Number of respondents shown beside each region some respondents chose 'not applicable' and are not included. Ranked by percent selecting 'increase'. Optional question.
Among 81 five-year repeat respondents, the fastest growth in allocations were reported in Oceania (45%), East and SE Asia (28%), and MENA (26%; Table 11). South Asia and EECA also experienced growth, but at rates lower than the overall average.
Table 11: Growth in regional asset allocations among repeat respondents (2013–2017)n = 81; figures in USD millions.
Geography 2013 2017 CAGR
Oceania 37 164 45%East and SE Asia 2,721 7,258 28%MENA 481 1,224 26%LAC 4,761 8,226 15%SSA 4,961 8,394 14%U.S. & Canada 6,698 10,436 12%WNS Europe 3,258 4,865 11%South Asia 3,343 4,229 6%EECA 3,496 4,058 4%Other 1,034 1,922 17%Total 30,790 50,777 13%
Note: East and SE Asia were disaggregated as regions in 2017. To ensure comparability with 2013 responses, they have been recombined for this analysis. Source: GIIN
As the impact investing industry evolves, investors continue to refine their strategies and their determination of which of their activities qualify as ‘impact investments.’ Sometimes, these adjustments— especially when made at large organizations— lead to large shifts in aggregate reported allocations from one year to the next.

26 G L O B A L I M P A C T I N V E S T I N G N E T W O R K
Private EquityInvestors
Private Debt Investors
Asset class focus
Market-Rate Investors
Below-Market Investors
Source: GIIN
Overall
Table 12: Sector allocations by various respondent segments
Geographic focus Target returns
Number of investors 226 59 55 144 82Total AUM
(USD millions)228,100 37,771 13,140 216,697 11,404
19% 17% 17% 20% 11%14% 18% 9% 15% 9%9% 34% 3% 9% 7%8% 5% 10% 7% 17%6% 6% 12% 6% 9%5% 1% 0.3% 5% 1%5% 5% 5% 4% 20%4% 1% 1% 4% 1%4% 5% 11% 4% 5%3% 3% 2% 3% 2%3% 1% 10% 3% 3%3% 0.5% 8% 3% 1%
0.3% 0.3% 0.0% 0.2% 0.8%16%
DM-focusedInvestors
9777,765
9%14%
0.3%20%
4%3%5%7%4%2%7%4%
0.6%21%
EM-focusedInvestors
101131,215
28%14%12%
1%8%7%4%3%4%4%
0.3%2%
0.0%13% 3% 11% 16% 13%
Fin services (excl. microfinance)Energy
MicrofinanceHousing
Food & agInfrastructure
HealthcareWASH
EducationManufacturing
ConservationICT
Arts & cultureOther
Over half of respondents anticipate growing their allocations to energy in the year ahead (Figure 26). Another 49% plan to increase their allocations to food and agriculture and 42% plan to increase their allocations to WASH. Meanwhile, 13% of respondents plan to decrease their allocations to microfinance and 9% plan to reduce allocations to manufacturing.
Figure 26: Planned allocation changes in 2018, by sector
Source: GIIN
Decrease Begin to assess Maintain Increase
ICT
Education
Fin services (excl. microfinance)
Housing
Infrastructure
Microfinance
Healthcare
WASH
Food & ag
Energy
4%
3%
7%
7%
3%
7%
13%
2%
4%
4%
13%
9%
4%
6%
8%
7%
4%
14%
3%
5%
49%
52%
52%
49%
50%
47%
44%
42%
44%
41%
34%
36%
36%
Arts & culture
Manufacturing
Conservation
5%
9%
10%
4%
11%
76%
59%
59%
10%
29%
30%
38%
39%
39%
40%
42%
49%
51%
85
118
121
42
70
71
117
72
122
96
105
156
130
n =Percent of respondents
Number of respondents shown beside each sector; some respondents chose 'not applicable' and are not included. Ranked by percent selecting 'increase'. Optional question.

27A N N U A L I M P A C T I N V E S T O R S U R V E Y 2 0 1 8
Five-year repeat respondents reported the largest CAGR in allocations to education (33%), followed by food and agriculture (23%; Table 13). Energy and healthcare have also experienced above average growth, with CAGRs of 16% and 15%, respectively. ICT is the only sector that has seen a contraction in AUM.
Table 13: Growth in sector asset allocations among repeat respondents (2013 –2017)n = 81; figures in USD millions.
Sector 2013 2017 CAGR
Education 721 2,283 33%Food & ag 1,850 4,216 23%Energy 3,390 6,048 16%Healthcare 2,105 3,648 15%Financial services (excl. microfinance) 5,712 8,113 9%Microfinance 8,631 11,621 8%WASH 191 255 7%Housing 3,129 4,143 7%ICT 625 475 -7%Other 4,436 9,976 22%Total 30,790 50,777 13%
Note: Sectors were further disaggregated in recent years to include arts & culture, conservation, infrastructure, and manufacturing. To ensure comparability with 2013 responses, these sectors have been combined with ‘other’ for this analysis. Source: GIIN
AUM by instrument of investmentRespondents use a range of instruments to make impact investments, most commonly private debt (41%, excluding outliers; Figure 27). Including outliers, the share of capital allocated to private debt increases slightly to 46%. A further 18% of capital, excluding outliers, was allocated through private equity. An allocation of 14% of capital through public equity demonstrates a growing practice of impact investing through publicly listed equities, which was unsurprisingly far more common among DM-focused respondents than among EM-focused respondents (24% vs. 0.6%). DM-focused respondents were also more likely to invest through real assets (20% vs. 0.5%). Overwhelmingly, the greatest proportion of respondents use private equity (78%) and private debt (71%).
Note: Other instruments include social impact bonds, revenue share agreements, swaps, and guarantees.Source: GIIN
Figure 27: Instrument allocations by AUM and percent of respondents
Private debt
Private equity
Public equity
Real assets
Public debt
Deposits & cash equivalents
Equity-like debt
Other
Left side, Percent of AUM: n = 224 (excludes two outliers); total AUM = USD 141.0 billion.Right side, Percent of respondents with any allocation to each instrument: n = 229; respondents may allocate to multiple instruments.
65%
71%
14%
16%
12%
14%
29%
11%
41%
18%
14%
9%
6%
3%
3%
7%
Percent of respondentsPercent of AUM

28 G L O B A L I M P A C T I N V E S T I N G N E T W O R K
Five-year repeat respondents grew their allocations to public equities most substantially (CAGR of 57%), albeit from a very small base (Table 14). Allocations also increased to private equity (19%) and private debt (17%). On the other hand, allocations decreased for equity-like debt (−5%) and other instruments (−7%).
Table 14: Growth in instrument asset allocations among repeat respondents (2013–2017)n = 81; figures in USD millions.
Instrument 2013 2017 CAGR
Public equity 326 1,962 57%Private equity 7,222 14,351 19%Private debt 12,338 23,379 17%Deposits & cash equivalents 983 1,429 10%Real assets 1,591 1,784 3%Public debt 4,012 4,453 3%Equity-like debt 2,673 2,202 -5%Other 1,647 1,217 -7%Total 30,790 50,777 13%
Note: The 2013 Survey included social impact bonds as an instrument. These were included in ‘other’ for this analysis. Source: GIIN
AUM by stage of businessImpact investors seek to invest in businesses across many stages of development (Figure 28). Of course, some impact investors do not invest into businesses but rather in real assets or other projects. Of AUM invested into businesses, the greatest share is allocated to mature, private companies (39%), followed by growth-stage companies (35%). Excluding outliers, the share allocated to mature, private companies falls slightly to 31% while the share allocated to mature, public companies increases to 21%. Notably, over 80% of respondents have some allocation to growth-stage companies; 65% percent allocate to venture-stage companies, and 42% allocate to seed-stage companies. However, seed and venture businesses receive just 11% of overall AUM.
Figure 28: Allocations by stage of business, by AUM and percent of respondentsLeft side, Percent of AUM: n = 189; total AUM = USD 169.4 billion. Optional question.Right side, Percent of respondents with any allocation by stage of business: n = 190; respondents may allocate to multiple stages.
Source: GIIN
14% Mature, publicly-traded companies 18%
39% Mature, private companies 41%
35% Growth stage 81%
10% Venture stage 65%
1% Seed/Start-up stage 42%
Percent of respondentsPercent of AUM

29A N N U A L I M P A C T I N V E S T O R S U R V E Y 2 0 1 8
The Fund Manager LandscapeFund managers and other intermediaries play a vital role in the impact investing ecosystem. This section describes the activities of fund manager respondents and the perspectives of respondents that invest into funds.
Investing into fundsForty percent of respondents (93 organizations) invest via funds or other intermediaries.14 At the median, such respondents invest half of their impact investing assets indirectly. All 93 respondents investing indirectly were asked to share their insights on the level of competence they see among impact fund managers compared to conventional fund managers, across a variety of skills.
Overwhelmingly, respondents find impact investing fund managers to be generally similar in competence to conventional fund managers (Figure 29). However, across most attributes, a slightly higher proportion of respondents reported that impact fund managers are weaker compared to conventional managers than the proportion that reported they are stronger. Impact fund managers are particularly recognized for developing compelling investment strategies, with 24% of respondents noting that impact fund managers are stronger in this area than their conventional counterparts. However, 22% of respondents noted that impact fund managers are generally weaker in marketing and fund administration, and 20% found impact fund managers weaker at pipeline development. Interestingly, EM-focused Investors noted stronger impact fund manager skills in developing a pipeline than did DM-focused Investors (11% vs. 0%).
Figure 29: Impact fund manager competencies relative to conventional fund managersn = 69-75. Figure shows percent of respondents indicating each level of fund manager competency.
Note: Some respondents answered ‘not sure’ and are not included. Source: GIIN
Developing a compelling investment strategy
Marketing (in-person pitch)
Developing pipeline
Structuring investments
Managing portfolio(s)
Administering the fund(s)
Structuring a fund
64%
66%
69%
78%
80%
81%
75%
12%
22%
20%
14%
15%
22%
15%
Generally weaker 24%
12%
11%
8%
4%
3%
5%
Generally strongerGenerally on par
Fund manager activityThe following section describes the activities and perspectives of 135 fund manager respondents,15 which constitute 59% of the total sample and account for 32% of total sample AUM. Of these respondents, 79% identify as for-profit fund managers and 21% identify as not-for-profit fund managers.
Capital raisingIn 2017, fund managers collectively raised USD 18.7 billion (Table 15), with a median capital raise in 2017 of USD 32.5 million. On average, for-profit fund managers raised more than not-for-profit fund managers (median capital raises of USD 52 million and USD 22 million, respectively). Overall, fund managers plan to raise USD 22.5 billion in 2018, a 20% year-on-year increase.16
14 This includes ten respondents that do not currently have impact investing assets allocated indirectly.
15 Of the 136 fund manager respondents, one did not respond to these questions.
16 Ninety-four organizations reported raising capital in 2017 (as not all fund managers raise capital every year), and 113 reported on their planned capital raises for 2018.

30 G L O B A L I M P A C T I N V E S T I N G N E T W O R K
Table 15: Fund manager capital raises in 2017 and plans for raising capital in 2018Excludes respondents that did not report raising capital in 2017 or did not share their projections for 2018. All figures in USD millions.
All fund managers For-profit fund managers Not-for-profit fund managers
2017 2018 P 2017 2018 P 2017 2018 P
n 94 113 69 87 25 26
Mean 199 199 259 245 34 44
Median 33 75 52 100 22 23
Sum 18,738 22,490 17,882 21,349 857 1,141 Source: GIIN
Table 16 shows 2017 capital raise and 2018 capital raise plans for fund managers across sub-groups. In 2017, DM-focused fund managers raised three times more capital at the median than EM-focused fund managers in 2017. Market-rate fund managers raised over four times as much at the median as did below-market-rate fund managers.
Table 16: Fund manager capital raises in 2017 and plans for capital raise in 2018, by sub-groupExcludes respondents that did not report raising capital in 2017 or did not share their projections for 2018. All figures in USD millions.
Headquarters locations Geographic focus Asset class focus Target returns
DM-HQ EM-HQ EM-focused DM-focused Private Debt Private Equity Market-Rate Below-Market
2017 2018P 2017 2018P 2017 2018P 2017 2018P 2017 2018P 2017 2018P 2017 2018P 2017 2018P
n 76 91 16 19 45 58 41 46 31 36 19 24 64 80 30 33
AUM Median 140 43 81 179 99 89 227 64
Capital raise
Mean 236 225 34 70 55 132 373 289 71 144 153 131 277 261 33 50
Median 37 75 13 32 20 52 60 80 27 28 30 75 51 100 11 20
Sum 17,966 20,477 538 1,325 2,461 7,630 15,291 13,311 2,215 5,195 2,912 3,149 17,749 20,841 989 1,649
Source: GIIN
Capital raised in 2016 and 2017 among repeat respondentsOf 95 fund managers that also responded to last year’s survey, 52% raised at least 5% more capital in 2017 than in 2016, and 43% raised at least 5% less this year than last (Figure 30). In aggregate, these fund managers raised 10% more capital year-on-year, collectively raising USD 10.1 billion in 2016 and USD 11.1 billion in 2017 (Table 17).
43%
Figure 30: Capital raised in 2016 and 2017 among repeat respondents n = 95; includes respondents that reported ‘zero’ capital raise.
Source: GIIN
Increased by at least 5% Stayed constant within 5% Decreased by at least 5%
52%5%43%
52%
5%

31A N N U A L I M P A C T I N V E S T O R S U R V E Y 2 0 1 8
Table 17: Capital raised in 2016 and 2017 among repeat respondentsExcludes respondents that did not report raising capital. All figures in USD millions.
All fund managers For-profit fund managers Not-for-profit fund managers
2016 2017 2016 2017 2016 2017
n 69 67 57 53 12 14
Mean 146 166 153 202 113 29
Median 42 30 50 57 12 7
Sum 10,091 11,094 8,733 10,692 1,358 402 Source: GIIN
The Research Team also compared repeat respondents’ capital-raise plans for 2017 with their reported capital raises in 2017. Among 84 fund managers that shared their 2017 capital-raise projections,17 most raised less than they had projected. In aggregate, they planned to raise USD 15.7 billion and reported raising USD 11.1 billion, or 29% less (Table 18).
Table 18: Repeat respondents’ planned 2017 capital raise compared to reported 2017 capital raisen = 84; excludes respondents that did not share their capital raise plans for 2017. All figures in USD millions.
All fund managers
2017 Planned 2017 Reported
Mean 187 132
Median 50 15
Sum 15,715 11,121 Source: GIIN
Fund managers’ sources of capitalFund managers collectively manage USD 71.9 billion in impact investing assets. The majority report managing at least some capital from family offices or HNWIs (70% of respondents) and foundations (65%; Figure 31). Just under half (49%) manage capital from banks, 44% manage assets from pension funds or insurance companies, and a third manage capital from DFIs. Other investors in impact funds include funds of funds, retail investors, endowments, and sovereign wealth funds.
Figure 31: Proportion of fund managers that manage capital from each investor type n = 135
65%
49%
44%
70%Family o�ces/HNWIs Percent of respondents
Foundations
Banks / Diversified financial institutions
Pension funds / Insurance companies
33%
29%
DFIs
Fund of funds
Other 25%Retail investors
16%
7%
43%
Endowments
Sovereign wealth funds
Other
Note: ‘Other’ sources include corporations, religious institutions, governments, nonprofits, and fund managers’ proprietary capital.Source: GIIN
17 Excludes fund managers that reported ‘zero’ for their 2017 capital raise projections. Not all fund managers project these figures.

32 G L O B A L I M P A C T I N V E S T I N G N E T W O R K
Fund managers reported the percent of capital they manage from each type of investor. While these 135 organizations collectively manage USD 71.9 billion, to show a more representative picture most analyses exclude five large fund managers with concentrated sources of capital.18 The remaining 130 fund managers collectively manage USD 46.3 billion, and their largest sources of capital are pension funds and insurance companies (22% of AUM), banks (18%), and family offices (17%; Table 19), followed by retail investors (11%), DFIs (10%), and foundations (7%).
Different types of fund managers also show some interesting variations:
• Not-for-profit fund managers manage a greater proportion of capital from banks than do for-profit fund managers (33% vs. 16%). A similar split is seen between below-market-rate-seeking fund managers and market-rate-seeking ones (28% vs 16%), which is likely driven by the overlap between those that are non-profit and below-market.
• A greater proportion of Private Equity-focused fund managers’ AUM comes from family offices compared to Private Debt-focused fund managers (33% vs. 5%).
Table 19: Fund managers' sources of capital by various respondent segments (AUM-weighted)
Pension funds / Insurance companies
Banks / Diversified financial institutions
Family o�ces/HNWIs
Retail investors
DFIs
Foundations
Endowments
Fund of funds
Sovereign wealth funds
Other
Number of investorsTotal AUM
(USD millions)
Note: All figures exclude five large outliers except those split by size of impact investing AUM. ‘Other’ sources include corporations, religious institutions, governments, nonprofits, and fund managers’ proprietary capital. Source: GIIN
Overall, excluding outliers
22%
18%
17%
11%
10%
7%
2%
2%
1%
11%
13046,290
For-profit
24%
16%
18%
12%
9%
6%
2%
2%
0.6%
11%
10141,908
Nonprofit
4%
33%
7%
3%
16%
16%
7%
1%
2%
10%
294,382
EM-focused
22%
18%
10%
4%
21%
4%
2%
2%
0.6%
17%
6719,835
DM-focused
24%
18%
24%
12%
2%
10%
3%
2%
1%
5%
5423,169
Private Debt
14%
22%
5%
15%
16%
5%
1%
2%
0.7%
21%
3915,377
Private Equity
25%
9%
33%
1%
9%
10%
5%
2%
1%
6%
369,390
Small
69
10%
10%
21%
8%
21%
16%
0.2%
5%
0.1%
10%
3,099
Medium
23%
18%
20%
6%
9%
10%
5%
2%
1%
7%
349,683
Large
24%
11%
11%
20%
6%
5%
3%
1%
1%
17%
3259,094
18 These large fund managers primarily managed a large proportion of their capital from retail investors and pension funds / insurance companies.

33A N N U A L I M P A C T I N V E S T O R S U R V E Y 2 0 1 8
Fund managers that responded five years ago and again in 2017 demonstrated an overall CAGR of 15% (Table 20). Among their sources of capital, the greatest growth came from endowments (37%), followed by retail investors (20%). The growth rate in capital sourced from foundations, pension funds or insurance companies, and funds of funds was slightly less than the average growth rate.
Table 20: Growth in sources of capital among repeat respondents (2013–2017)n = 37; figures in USD millions.
Source of capital 2013 2017 CAGR
Endowments (excl. foundations) 104 366 37%
Retail 2,341 4,880 20%
DFIs 1,605 2,918 16%
Banks / Diversified financial institutions 2,182 3,727 14%
Family offices / HNWIs 1,608 2,560 12%
Foundations 732 1,051 9%
Pension funds / Insurance companies 2,883 4,072 9%
Funds of funds 401 561 9%
Other - 730 -
Total 11,856 20,866 15%
Note: ‘Other’ was not included as an answer option in 2013. Source: GIIN
Client interest in various types of investment productsThe impact investing industry is growing quickly as new investors enter the market and new investment products are developed around the world. To better understand the intermediary landscape, fund managers described the types of product features that interest various types of investors (Table 21). Overall, fund managers reported the most interest in products with a specific impact theme, sector, or geographic focus, indicating an investor preference for specialization in terms of investment strategy. Regarding investment term, respondents noted that investors broadly have more or less equal interest in both highly liquid and long-term investment structures. However, banks and retail investors demonstrate relatively stronger interest in more liquid products, while DFIs, foundations, and pension funds are relatively more interested in longer-term products. Lastly, the nature of a fund’s structure itself (i.e., whether it is closed-ended or open-ended) seems to be investors’ least concern.
Table 21: Number of fund managers noting increased client demand for each product type, by client typen = 108
HNWIs / Family offices Foundations
Pension funds /
Insurance companies
Banks / Diversified
financial institutions
DFIs Retail investors
Sovereign wealth funds
Not sure / Not
applicable
Impact theme- or sector-focused 67 63 43 42 39 23 13 17
Geographically focused 31 40 20 16 26 12 6 30
Highly liquid 17 9 9 22 3 15 0 47
Long-term 18 20 18 10 13 6 2 41
Open-ended 21 10 10 16 4 12 1 54
Closed-ended 10 12 13 8 11 3 2 56
Source: GIIN

34 G L O B A L I M P A C T I N V E S T I N G N E T W O R K
2017 Market DevelopmentRetail products for impact investingInterest in impact investing has grown noticeably among individual investors over the past few years; 2017 has seen an influx of retail products for impact investors, including a wide array of online and crowdfunding platforms in addition to funds with low minimum investment requirements. According to Morgan Stanley’s 2017 report, Sustainable Signals: New Data from the Individual Investor, 75% of 1,000 investors surveyed were interested in “investments in companies or funds which aim to achieve market-rate returns while pursuing positive social and/or environmental impact.”19
For a number of years, a few pioneering products have directed retail capital to community development initiatives, primarily through investment notes such as those issued by Calvert Impact Capital,20 Enterprise Community Partners21 and RSF Social Finance.22 Other retail products, such as the Triodos Fair Share Fund and OikoCredit funds,23 invest in microfinance institutions in emerging markets. However, overall, the current availability of accessible impact investing products is certainly insufficient to meet the demand of retail investors. In response, several new products for individuals interested in impact investing were developed in 2017:
• Swell Investing, launched in May 2017, is an online product designed to serve individual investors’ specific impact and financial targets. Its management team selects what they deem to be high-growth public companies with the potential to have positive impact on society and the planet.24 Investors can choose from six specific impact themes: green tech, clean water, zero waste, renewable energy, disease eradication, and healthy living. Products require a minimum investment of USD 50 and charge a fee of 0.75%.
• CNote, an online platform of alternative savings options,25 introduced its first product, CNote savings, in September 2017. It provides individual investors an opportunity to contribute to specific community-development efforts, such as supporting women- and minority-owned businesses or funding affordable housing projects and community centers across the United States. CNote requires no minimum investment and returns approximately 2.5% annually. CNote’s annual report details the impact of its investments through metrics such as the number of businesses funded and number of jobs created, as well as offering stories of successful small businesses funded by investment proceeds.26
• The Low Income Investment Fund (LIIF), a U.S. Community Development Finance Institution that supports businesses serving low-income neighborhoods, launched its first Impact Note in the fall of 2017.27 LIIF Notes are available to individuals in 17 U.S. states and the District of Columbia, with a minimum investment of USD 1,000. Notes have no fees, offer flexible terms from six months to 10 years, and generate returns from 1% to 3%. The fund aims to support local community development efforts, such as affordable housing, quality education, access to childcare, and green energy. LIIF provides quarterly impact reports to its investors, including metrics updated based on the impact targets of each investment.
• In late 2017, Barclays launched its Multi-Impact Growth Fund,28 a fund of funds investing in opportunities with a strong financial track record and commitment to social or environmental impact, or both. Individuals can invest through a direct investing platform, called Smart Investor.29 The fund is diversified across geographies and asset classes, with a focus on public equities and bonds. Strategies range from responsible investing to impact investing (which Barclays terms “catalytic investing”). There is no minimum investment requirement, and fees are 1.4% of the value of the holding, per annum. While Barclays has not set specific impact targets, it intends to report annually on this fund’s overall impact.
• In early 2018, Triodos Bank introduced its crowdfunding platform,30 which allows UK investors to purchase bonds or equity investments in charities or enterprises screened for their commitment to deliver positive impact on society and the environment. Individuals can invest in any number of projects listed on the platform, ranging from a wind turbine company in the highlands of Scotland to a charity supporting people with disabilities. Investments can be as low as £100, and terms and return expectations vary by project. Triodos Bank maintains close relationships with the companies in which it invests, monitoring how loans are disbursed and tracking their impact.
The recent growth of retail products in response to investor demand signals impact investors’ interest in democratizing impact investing. However, there is much more opportunity for products that meet both investor demand and the capital needs of persistent social and environmental challenges.
19 Institute for Sustainable Investing, Sustainable Signals: New Data from the Individual Investor (New York: Morgan Stanley, August 7, 2017), http://www.morganstanley.com/pub/content/dam/msdotcom/ideas/sustainable-signals/pdf/Sustainable_Signals_Whitepaper.pdf.
20 Calvert Impact Capital, “Community Investment Note,” https://www.calvertimpactcapital.org/invest.
21 Enterprise, “About the Impact Note,” https://www.enterprisecommunity.org/invest/impact-note.
22 RSF Social Finance, “Social Investment Fund,” http://rsfsocialfinance.org/invest/social-investment-fund/.
23 James Vaccaro, Impact Investing for Everyone: A Blueprint for Retail Impact Investing (Zeist, The Netherlands: Triodos Bank, August 2014), http://www.socialimpactinvestment.org/reports/Triodos-Bank-report-on-Impact-investing.pdf; and Oikocredit, “Oikocredit 101,” http://oikocreditusa.org/what-we-do/development-approach/double-bottom-line.
24 Swell Investing, “Our Approach,” https://www.swellinvesting.com/investment_approach.
25 CNote, https://www.mycnote.com/.
26 CNote, “CNote 2017 Impact Report,” February 28, 2018, https://blog.mycnote.com/2018/02/28/cnote-2017-impact-report/.
27 Low Income Investment Fund, “LIIF Impact Note,” http://www.liifnote.org/.
28 Barclays, “Barclays Launches Industry First with New Impact Investing Fund,” news release, September 14, 2017, https://newsroom.barclays.com/r/3517/barclays_launches_industry_first_with_new_impact_investing.
29 Barclays, “Smart Investor: Barclays Multi-Impact Growth Fund,” https://www.smartinvestor.barclays.co.uk/invest/investments/funds-etfs-and-investment-trusts/impact-investing/barclays-multi-impact-growth-fund.html.
30 Triodos Bank, “Pioneering Sustainable Bank First to Launch Crowdfunding Platform,” news release, February 3, 2018, https://www.triodos.co.uk/en/about-triodos/news-and-media/media-releases/triodos-launches-crowdfunding-platform/.

35A N N U A L I M P A C T I N V E S T O R S U R V E Y 2 0 1 8
Impact Measurement and Management Impact objectivesImpact investors target a wide variety of social and environmental impact themes. More than half of respondents target both social and environmental impact objectives, a slight increase from recent years (Figure 32). An additional 40% primarily target social objectives, and 6% primarily target environmental objectives.
6%
Figure 32: Primary impact objectives n = 229
Source: GIIN
Both Social Environmental
54%40%6%
54%
40%
Market-Rate Investors were more likely to target both social and environmental impact objectives (61%) than were Below-Market Investors (41%). Conversely, 56% of Below-Market Investors targeted only social impact objectives, compared to 31% of Market-Rate Investors. Developed market-focused respondents reported a greater instance of primarily targeting environmental objectives (15%) than did emerging market-focused respondents (1%).
Impact targetsTo achieve their impact objectives and develop strategies to measure progress toward these objectives, many impact investors set impact targets. About half of respondents set impact targets for all of their investments, and another 28% set targets for some of their investments (Figure 33). One fund manager explained, “Targets are a joint prioritization [between the investor and investee] of impact-related activities to enhance and maximize impacts ahead.”
Below-market-rate seeking respondents were more likely to set targets (85% for some or all of their investments) than were market-rate seeking investors (71%). Nearly 60% of Private Equity Investors set impact targets for all of their investments, compared to 41% of Private Debt Investors.

36 G L O B A L I M P A C T I N V E S T I N G N E T W O R K
24%
Figure 33: Setting impact targets n = 229
Source: GIIN
We set impact targets for all of our investments We set impact targets for some of our investments We do not set impact targets
48%28%24%
48%
28%
Reasons to set impact targets Respondents that set impact targets identified several reasons to do so, most commonly to drive social/environmental impact management (81%; Figure 34). Another 68% of respondents use impact targets to inform investment decisions. Targets are also used to hold investees or investor teams accountable (62% and 54%, respectively). As one respondent explained, “Only by setting impact targets—and subsequently tracking performance—can we test our impact hypotheses and improve our understanding of impact creation for future investments.”
Figure 34: Reasons to set impact targetsn = 175; respondents could select multiple options.
To hold our teams accountable for social/environmental impact
Other To hold our investees accountable for social/environmental impact
To drive our social/environmental impact management
To inform our investment decisions (e.g., deal selection or
investment management)
Note: ‘Other’ reasons to set impact targets include assuring alignment of interests and expectations with investees, incentivizing organizational growth, ensuring deals meet the investor’s Theory of Change, communicating results, meeting investors’ goals, improving impact measurement and management processes, and facilitating the collection and analysis of comparable data.Source: GIIN
81%
68%62%
54%
11%Perce
nt of
respo
nden
ts
Reasons to not set impact targetsNearly one in four respondents don’t currently set impact targets. Most of these respondents shared that they do track social and environmental performance over time and indicated they may set formal targets in the future. Others stated that their portfolios are too diverse—across geographies, sectors, or stages of business—to set quantitative targets. Still others noted that impact targets are set by their co-investors, investees, or other partners. Lastly, some respondents explained that, in their view, cases where impact is embedded into the core of their investees’ products and services do not require impact targets.

37A N N U A L I M P A C T I N V E S T O R S U R V E Y 2 0 1 8
Tools to measure social and environmental performanceA hallmark of impact investing is investors’ commitment to measuring, managing, and reporting their social or environmental performance, or both. Impact investors often do so through the use of impact measurement and management tools and frameworks, which include broader goals and targets, the investment and impact theses projected to deliver on those goals, and approaches to collect and use relevant performance data. Nearly 70% of impact investors use proprietary metrics or frameworks that are not aligned to external methodologies (Figure 35). Another 66% use qualitative information, and 59% use metrics aligned with IRIS.31 Just 1% of respondents indicated that they do not currently measure their impact, yet noted that they plan to implement an impact measurement practice in the future.
Many impact investors use a combination of these methods, depending on their impact strategies and goals, to understand their impact. Among those respondents using multiple tools or frameworks, the most common combinations include:
• proprietary metrics and qualitative information (48% of respondents);
• IRIS-aligned metrics and qualitative information (43%); and
• IRIS-aligned metrics and proprietary metrics (35%).
EM-focused respondents were more likely to report using IRIS-aligned metrics than were DM-focused respondents (71% and 45%, respectively). On the other hand, DM-focused investors cited using qualitative data more often (72% vs. 58% of EM-focused respondents). Market-Rate and Below-Market Investors did not demonstrate statistically significant differences.
Figure 35: How social and environmental performance is measuredn = 229; respondents could select multiple options.
Through standard frameworks and assessments such as GIIRS, GRI,
SASB, IMP, etc
We do not measure social/environmental performance
Through metrics that are aligned with IRIS
Through proprietary metrics and/or frameworks that are not aligned to any external frameworks or methodologies
Through qualitative information
Note: Respondents that said they do not measure their social or environmental performance noted that they plan to do so in the future.Source: GIIN
69% 66%59%
41%
1%
Perce
nt of
respo
nden
ts
31 IRIS is the catalog of generally accepted performance metrics managed by the GIIN. Since several standard frameworks and assessments, such as GIIRS, are built using IRIS metrics, the proportion of respondents using IRIS metrics in some form may be even higher than is reflected here. For more on IRIS, see https://iris.thegiin.org.

38 G L O B A L I M P A C T I N V E S T I N G N E T W O R K
Alignment with the Sustainable Development GoalsThe Sustainable Development Goals (SDGs), adopted by the member states of the United Nations in 2015, established an ambitious set of goals for progress against a wide range of social and environmental factors. Central to the achievement of these goals is collaboration among the private, public, and philanthropic sectors. Just two years since the adoption of the SDGs, 55% of impact investors track their investment performance to them and another 21% plan to do so in the future (Figure 36).
There is significant variation between EM-focused and DM-focused investors when it comes to tracking to SDGs: nearly two-thirds of EM-focused investors do so compared with 41% of DM-focused investors. Twenty-three percent and 22% of EM-focused and DM-focused Investors, respectively, indicated planning to do so in the future.
24%
18%
Figure 36: Tracking impact investment performance to the UN SDGs n = 229
Source: GIIN
We track performance to the SDGs for all of our investments We track performance to the SDGs for some of our investments We do not track performance to the SDGs, though we plan to do so in the near future
37%18%21%
We do not track performance to the SDGs and don't have any foreseeable plans to do so 24%37%
21%
Impact investors that do track their performance to the SDGs cited a number of reasons for doing so (Figure 37). Ninety percent of these respondents indicated that the SDGs are a useful way to communicate impact externally, and 73% noted it is important to integrate into the global development paradigm. Just over half of respondents (53%) indicated that alignment to the SDGs helps attract investors. Fewer respondents cited reasons related to strategy, such as refining their impact or investment objectives (or both), or reasons related to deal-making, such as identifying co-investors or attracting investees.
Figure 37: Motivations for tracking social or environmental performance to the SDGs
Source: GIIN
n = 126; respondents could select multiple options.
73%
53%
43%
25%
15%
They are a useful way to communicate our impact externally since it’s a widely recognized framework. It’s important for us, as an impact investor, to integrate into the global development paradigm.
They enable us to attract investors.
They help us refine our theory of change and set appropriate impact objectives and impact targets.
They enable us to conceive of new investment strategies and opportunities.
They help us identify co-investors or co-investment opportunities.
7%
5%
They enable us to attract investees.
Other
90%Percent of respondents

39A N N U A L I M P A C T I N V E S T O R S U R V E Y 2 0 1 8
2017 Market DevelopmentImpact investing efforts to address the UN SDGsThe United Nations Sustainable Development Goals (SDGs), adopted by member states in 2015, are a collection of 17 interrelated global goals aimed at ambitious progress by the year 2030 in a broad range of areas, including poverty, hunger, health, education, climate change, gender equality, water, sanitation, energy, the environment, and social justice.
Meeting these goals will require substantial investments from private capital markets (to complement government and philanthropy) and provide significant opportunities for investors. According to a report by the Business and Sustainable Development Commission, achieving the SDGs could open USD 12 trillion of market opportunities and create 380 million new jobs by 2030.32 Impact investors have answered this call by tailoring products and funds to specifically address the SDGs. Fifty-five percent of respondents track the performance of at least some of their impact investments to the SDGs, a quarter of which noted that doing so helps them conceive of new investment strategies and opportunities (see page 38). Below are a few examples of new products launched in 2017 to target the SDGs.
• Blue like an Orange Sustainable Capital Fund, a private debt fund aiming to raise USD 1 billion, launched in April 2017. The fund targets progress toward SDGs 1, 2, 3, 4, 6, 7, 8, 9, and 11 through investments into small and medium-sized enterprises in sectors such as renewable energy, sustainable infrastructure, healthcare, education, financial services, and agribusiness. The fund leverages investment capital from public institutions, like the Inter-American Investment Corporation (IIC), to mobilize private investment at a 10:1 ratio.33 It sets impact targets aligned with the SDGs and tracks progress against key indicators using IRIS metrics. It also uses IIC’s DELTA (Development Effectiveness Learning Tracking and Assessment) tool and XSR (Expanded Annual Supervision Report) to assess and report on investments’ impact and financial performance.34
• The Mirova Land Degradation Neutrality Fund, which aims to raise USD 300 million, launched in September 2017 to target SDG 15 (Life on Land). The fund invests in sustainable agriculture, forestry, and related sectors, including green infrastructure and ecotourism in emerging markets.35 The fund has a layered structure that includes a technical assistance facility and blends private investment with contributions and investments from public institutions, such as the governments of France, Luxemburg, and Norway.36 The fund developed and integrated with the investment process an Environmental and Social Management System (ESMS) both to mitigate risks and to measure the positive impact generated toward SDG target 15.3, land degradation neutrality.37
• The UBS Global Impact Fund is a public equity fund launched in October 2017 that targets SDGs 1, 2, 3, 6, 7, 11, and 13 by investing in sustainable companies providing innovative products or services to meet environmental or social challenges, including climate change, air pollution, water and sanitation, health, food security, and poverty alleviation.38 The portfolio management team engages with investee companies to generate measurable positive impact and minimize ESG risks. The fund works with portfolio companies to set targets aligned with the SDGs and measure outputs, outcomes, and impacts of their products and services.39
32 Figure vii: Business & Sustainable Development Commission, Better Business, Better World (London: Business & Sustainable Development Commission, January 2017), http://report.businesscommission.org/report.
33 LAVCA Venture Investors, “BlueOrange Launches Impact Fund to Invest US$1BN in Latin America and the Caribbean,” news release, April 3, 2017, https://lavca.org/2017/04/03/new-fund-blueorange-capital/.
34 Mutuality in Business Research Team, Blue like an Orange Sustainable Capital (Oxford: Saïd Business School, May 2017), https://www.sbs.ox.ac.uk/sites/default/files/research-projects/MiB/Blue_like_an_Orange_-_Mutuality_Case_Study_23.10.17.pdf.
35 Mirova, Land Degradation Neutrality Fund (Paris: Mirova, August 2017), https://www2.unccd.int/sites/default/files/relevant-links/2017-09/ LDN%20Fund%20brochure%20-%20Aug2017.pdf.
36 United Nations Convention to Combat Desertification, “An Impact Investment Fund for Land Degradation Neutrality,” https://www2.unccd.int/actions/impact-investment-fund-land-degradation-neutrality.
37 Mirova, Land Degradation Neutrality Fund Project: Environmental & Social Standards (Paris: Mirova, August 2017), http://www.mirova.com/Content/Files/Mirova/Recherche/170830_LDNF%20ES%20Standards.pdf.
38 “UBS Asset Management Unveils New Global Sustainability Fund,” FINalternatives, October 26, 2017, http://www.finalternatives.com/node/36075; and Jessica Beard, “UBS AM Launches Global Sustainable Fund,” Citywire, October 25, 2017, http://citywire.ch/news/ubs-am-launches-global-sustainable-fund/a1062408.
39 UBS, “Making a Positive Impact: UBS Global Impact Equity Strategy” (factsheet), 2018, https://www.ubs.com/lu/en/asset_management/institutional/sustainable-investments/global-impact-equity.

40 G L O B A L I M P A C T I N V E S T I N G N E T W O R K
Gender lens investingAbout 70% of respondents apply a gender lens to their investment process, typically through governance measures or by seeking investees that proactively address gender issues (Figure 38). Respondents address gender equality through governance in several ways, including by seeking portfolio companies that have good internal policies related to gender equality (58%), working with companies to improve their policies (39%), and considering gender diversity in investment committee design (38%). Impact investors also seek to positively address gender issues by investing in portfolio companies for which women or girls are core beneficiaries (50%), that are led or owned by women (47%), or that address social issues primarily affecting women or girls (27%).
Notably, EM-focused respondents were much more likely to apply a gender lens to their investments than were DM-focused respondents (83% vs. 57%), though they use similar strategies to do so.
Figure 38: Ways impact investors apply a gender lens to their investment process
Source: GIIN
Note: ‘Other’ includes investing in bonds that benefit women, monitoring sta� ratios across investee organizations, targeting equal gender representation on the investor’s board, and disaggregating impact data by gender. Twenty-nine percent of respondents do not apply a gender lens to their investment process.
n = 153; respondents could select multiple options. Optional question.
50%
47%
39%
38%
27%
We seek portfolio companies that have good internal policies related to gender equality.
We seek portfolio companies that target women/girls as beneficiaries (whether customers, suppliers, employees, or distributors).
We seek portfolio companies led/owned by women.
We work with portfolio companies to improve their internal policies related to gender.
We consider gender diversity in the design of our investment committee.
We seek portfolio companies that address social issues mainly a�ecting women/girls (i.e. sex tra�cking, biases in media, wage gap, health access, and others).
17%Other
58%Percent of respondents
Climate investingNearly three-quarters of respondents seek to address climate change through their investments (Figure 39). The most common strategies to do so include targeting investments that reduce greenhouse gas emissions (70%), seeking investments that prevent future greenhouse gas emissions (68%), and seeking investments that support climate change adaptation (63%).
Market-rate-seeking respondents were more likely to address climate change through their investments than were below-market respondents (77% and 64%, respectively). Market-Rate Investors were especially likely to seek investments that mitigate climate change through reduced greenhouse gas emissions (76%) or the prevention of future emissions (75%).
Figure 39: Ways impact investors address climate change through their investments
Source: GIIN
Note: ‘Other’ includes reducing carbon by participation in the circular economy, investing in green bonds, incorporating climate-related metrics into impact measurement practice, using ESG screens, implementing environmental management systems, and advocating for energy policy. Twenty-seven percent of respondents do not address climate change through their investments
n = 155; respondents could select multiple options. Optional question.
68%
63%
34%
14%
We seek investments that mitigate climate change through a reduction in greenhouse gas emissions.We seek investments that mitigate climate change through prevention of future greenhouse gas emissions.
We seek investments that support climate change adaptation.
We seek investments that mitigate climate change through sequestration of greenhouse gases.
Other
70%Percent of respondents

41A N N U A L I M P A C T I N V E S T O R S U R V E Y 2 0 1 8
2017 Market DevelopmentInvesting to address climate changeIn 2015, the Paris Agreement set a course for climate mitigation and adaptation, including targets for reduced greenhouse gas emissions, strategies for adaptation and increased resilience in vulnerable regions, and promises of financing to enable these goals. However, as of 2017, progress against those reduction targets remained stalled; urgent action is therefore needed from all actors.40 Nearly three-quarters of impact investors responding to this year’s survey seek to address climate change through their investments (see page 40), and many have launched dedicated vehicles over the past year to support mitigation and adaptation efforts. Ranging from small-scale investments in clean energy innovation, conservation, and smallholder agriculture to large-scale investments in infrastructure and green bond issuances, impact investors are seriously heeding the Paris Agreement’s call to action. Announcements of notable recent projects and vehicles include the following:
• The Breakthrough Energy Ventures Fund announced in December 2016 that it had raised USD 1 billion in committed capital to invest over 20 years in clean energy technologies that reduce greenhouse gas emissions from electricity generation and storage, transportation, agriculture, manufacturing, and buildings.41 The fund was created by the Breakthrough Energy Coalition, a group that includes patient and risk-tolerant individual investors, corporations that produce or consume large amounts of energy, and financial institutions that can finance large astructure projects.42
• The Caribbean Climate-Smart Coalition is a public–private coalition formed in December 2017 that aims to catalyze USD 8 billion in investment to scale renewable energy and build low-carbon infrastructure in the Caribbean, a region prone to extreme weather events resulting from climate change. The coalition also established an accelerator to operate for a three-year period with a USD 6 to 10 million budget to develop projects and businesses. The group received funding from the Inter-American Development Bank, the World Bank, and the Caribbean Development Bank, as well as from various private investors and companies.43
• Climate Investor One, a blended fund developed by the Global Innovation Lab for Climate Finance, closed on a USD 412 million fund in July 2017 for ‘end-to-end’ financing of renewable energy infrastructure projects in emerging economies.44 Its three-part model finances projects through (1) a development fund for technical assistance in planning and development, (2) an equity fund with three tiers of capital for the financing of infrastructure construction, and (3) a long-term debt fund for the operation of the projects. The fund has attracted capital from donors and investors, including DFIs and institutional investors.45
• Livelihoods Carbon Fund 2 is a carbon offset fund launched in December 2017 that aims to raise USD 125 million from private companies to finance ecosystem restoration, agroforestry, and energy projects over 10 to 20 years in Africa, Asia, and Latin America. The fund will produce cash flows by financing projects to generate carbon credits, certified by the Gold Standard and Verified Carbon Standard; in turn, returns on investment will be paid to the investors in carbon credits.46
• Unilever and the Government of Norway announced a new climate resilience fund in November 2017 that will raise USD 400 million to invest in businesses that combine high-productivity agriculture with smallholder farming and forest conservation. The fund will leverage public and private investment to enhance resilience in the face of climate change in regions the partners consider most vulnerable to its effects.47
40 Brad Plumer and Nadia Popovich, “Here’s How Far the World Is From Meeting Its Climate Goals,” New York Times, November 6, 2017, https://www.nytimes.com/interactive/2017/11/06/climate/world-emissions-goals-far-off-course.html.
41 Breakthrough Energy, “The Landscape of Innovation,” accessed on April 16, 2018, http://www.b-t.energy/landscape/; and Kevin J. Delaney, “Bill Gates and Investors Worth $170 Billion Are Launching a Fund to Fight Climate Change through Energy Innovation,” Quartz, December 11, 2016, https://qz.com/859860/.
42 Breakthrough Energy, “Who We Are,” accessed on March 20, 2018, http://www.b-t.energy/coalition/who-we-are/.
43 Caribbean Development Bank, “Caribbean Leaders Launch Ambitious Plan to Create the World’s First ‘Climate-Smart Zone’,” news release, reliefweb, December 12, 2017, https://reliefweb.int/report/dominica/caribbean-leaders-launch-ambitious-plan-create-world-s-first-climate-smart-zone.
44 Jessica Pothering, “Climate Investor One Raises $412 Million for Wind and Solar Project Financing,” ImpactAlpha, July 3, 2017, https://news.impactalpha.com/climate-investor-one-raises-412-million-for-wind-and-solar-project-financing-dfcd8ff15a80.
45 Climate Investor One, accessed on March 21, 2018, http://climateinvestorone.com/nl/.
46 Livelihoods Funds, “Launch of a New Livelihoods Carbon Fund,” news release, December 4, 2017, http://www.sustainablebrands.com/press/launch_new_livelihoods_carbon_fund.
47 United Nations Climate Change, “Urgent Funding Needed for Resilience: Norway & Unilever Launch USD 400 Million Fund,” news release, November 14, 2017, https://cop23.unfccc.int/news/urgent-funding-needed-for-resilience-norway-unilever-launch-usd-400-million-fund.

42 G L O B A L I M P A C T I N V E S T I N G N E T W O R K
Investment Performance and Risk Target financial returnsOne particular feature of impact investing is that investors deliberately target a range of financial returns, from a concessionary return of capital to competitive market rates. Each year, survey respondents describe their overall target returns. This year, nearly two-thirds of respondents principally target risk-adjusted, market-rate returns (Figure 40). The remaining Below-Market Investors seek returns closer to market rates (20%) or closer to capital preservation (16%).
16%
Figure 40: Target financial returns principally sought n = 229
Source: GIIN
Risk-adjusted, market rate Below market: closer to market rate Below market: closer to capital preservation
64%20%16%
64%
20%
Of course, target returns vary according to the investor’s organizational structure, investment strategy, and impact strategy. Unsurprisingly, most for-profit fund managers target market rates of return (81%), whereas most not-for-profit fund managers target below-market returns (70%; Table 22). Six in ten foundations also principally target below-market-rate returns. Interestingly, all DFIs but one target market-rate returns, while two out of nine pension funds / insurance companies principally target below-market returns for their impact investing activities.
Table 22: Target returns by organization typeOrganization type n Below market Market rate
Fund manager: for-profit 106 19% 81%
Fund manager: not-for-profit 30 70% 30%
Foundation 31 61% 39%
Bank / Diversified financial institution 14 29% 71%
Family office 9 33% 67%
Pension fund / Insurance company 9 22% 78%
DFI 7 14% 86%
Permanent investment company 4 75% 25%
Other 19 47% 53%
Overall 229 36% 64% Source: GIIN
Average gross return expectations for 2017 vintage investments vary by asset class, geographic focus, and investor return philosophy (Figure 40). Unsurprisingly, expected gross returns are generally higher for equity than for debt and higher in emerging markets than in developed markets. Market-rate-seeking respondents expected higher returns than below-market respondents in most areas; however, they indicated very similar expectations for developed-market debt returns (4.8% vs. 4.7%).

43A N N U A L I M P A C T I N V E S T O R S U R V E Y 2 0 1 8
Interestingly, return expectations for below-market investments in emerging markets are higher than the market-rate expectations in developed markets in the corresponding asset class. Overall, expected returns also ranged widely within each asset class and market type, as the standard deviations suggest (shown by the bars in Figure 41).
Source: GIIN
0%
5%
10%
15%
20%
25%
30%
Figure 41: Average gross return expectations for 2017 vintage investments Averages shown beside each diamond; error bars show +/- one standard deviation.
4.8% 4.7%
13.4%
7.2% 9.8%
8.4%
18.9%
14.7%
20 1020n = 3126 1938 49
DM EM DM EM DM EM DM EM Market-Rate Market-Rate Below-MarketBelow-Market
Debt EquityDM EM
Interestingly, five-year repeat respondents indicated lower average gross returns expectations across all 2017 vintage investments than 2013 vintage investments (Figure 42). Investments into DM equity maintained the largest range of expected returns. For most segments, the range has remained fairly similar over time.
Source: GIIN
5%
10%
15%
20%
25%
30%
Figure 42: Average gross returns expectations for 2013 and 2017 vintage investmentsAverages shown beside each diamond; error bars show +/- one standard deviation.
23 2114n = 1226 2620 18
2013 2017 2013 2017 2013 2017 2013 2017DM DM EMEM
Debt Equity2013 2017
6.0%3.4%
9.3%8.2%
18.1%
11.5%
19.1%16.6%
0%

44 G L O B A L I M P A C T I N V E S T I N G N E T W O R K
Performance relative to expectationsA clear majority of respondents indicated that their investments have met or exceeded their expectations for both impact and financial performance since inception (Figure 43). Fifteen percent of respondents indicated exceeding their expectations in each aspect of investment performance. Just 3% of respondents have fallen short of their impact expectations and 9% of their financial expectations. Respondents that reported underperformance indicated some challenges in setting both impact and financial expectations, particularly in underdeveloped markets with unclear regulation, poor infrastructure, or currency fluctuations. Others noted variance in performance at the deal level.
Figure 43: Performance relative to expectations
Source: GIIN
Financial performanceImpact performance
Outperforming
In line
Underperforming
n = 218n = 216
15% 15%
82% 76%
3% 9%
Number of respondents shown above each bar; some respondents chose ‘not sure’ and are not included.
Perce
nt of
respo
nden
ts
Respondents across segments reported similar impact performance relative to their expectations, but they did indicate some variation in their levels of satisfaction with their financial performance (Figure 44). Most clearly, a greater portion of Below-Market Investors indicated underperformance than did Market-Rate Investors (14% vs. 6%). By target geography, more EM-focused Investors expressed underperformance than did DM-focused Investors (15% vs. 5%).
Figure 44: Financial performance relative to expectations by target returns sought, asset class focus, and geography of investment
Source: GIIN
Underperforming Outperforming
Overall
EM-focused Investors
PD-focused Investors
DM-focused Investors
PE-focused Investors
Below-Market Investors
Market-Rate Investors
9%
15%
5%
7%
8%
14%
6%
15%
12%
16%
13%
13%
14%
15%
Number of respondents shown beside each bar; some respondents chose ‘not sure’ or ‘in-line’ and are not included.
78
140
n =
53
56
93
99
218
Percent of respondents

45A N N U A L I M P A C T I N V E S T O R S U R V E Y 2 0 1 8
Realized gross returnsTo better contextualize financial performance, respondents also shared their realized gross returns since inception (Figure 45). As expected, equity investments generated higher returns on average than did debt investments. Market-rate equity investments had the highest variance among segments analyzed. In general, emerging-market investments performed similarly to developed-market investments, except among market-rate-seeking debt investments, where emerging-market deals fared significantly better than developed market investments (8.2% vs. 1.9%). Interestingly, DM market-rate-seeking debt investments generated lower average returns than their below-market-rate counterparts (1.9% vs. 4.0%) but with far greater variation. Overall, DM investments saw a wider range of realized returns than EM investments.
Source: GIIN
-20
-10
0
10%
20%
30%
40%
Figure 45: Average realized gross returns since inception Averages shown beside each diamond; error bars show +/- one standard deviation.
1.9% 4.0%
17.0%
7.0% 8.2% 6.1%
17.6%
8.4%
19 1017 1922 1432 34
DM EM DM EM DM EM DM EM Market-Rate Market-Rate Below-MarketBelow-Market
Debt EquityDM EM
n =
RiskIn addition to potential returns, impact investors consider risk when making and evaluating investments. As in past years, the greatest share of investors cited ‘business model execution and management risk’ as the most severe risk facing their portfolios (29%; Figure 46). A fifth or more of respondents also identified as severe ‘country and currency risks’ and ‘liquidity and exit.’ However, another fifth of respondents indicated that ‘country and currency risks’ do not affect their portfolios, reflecting wide variance by region; respondents investing primarily in SSA were particularly likely to cite these risks as severe (46%). Only 2% of respondents cited each of ‘impact risk’ and ‘ESG risk’ as severe.
Investors in different segments perceived these risks differently. For example, Private Equity Investors were more likely to identify ‘liquidity and exit risk’ as severe than were Private Debt Investors (29% vs. 16%). Private Equity Investors also indicated more severe ‘business model execution and management risk’ than did Private Debt Investors (39% vs. 24%).

46 G L O B A L I M P A C T I N V E S T I N G N E T W O R K
Figure 46: Contributors of risk to impact investment portfolios Number of respondents to each option shown above each column; some respondents chose ‘not sure/not applicable’, and are not included. Ranked by percent that selected ‘severe risk’.
Source: GIIN
Country & currency risks
Business model execution & management risk
Liquidity & exit risk
Financing risk Macroeconomic risk
Market demand & competition risk
Perception & reputational risk
Impact risk ESG risk
29% 22% 22% 16% 12% 12% 7% 2% 2%
48%
35%44%
44% 50%42%
28% 35%21%
20%
23%
28%28%
33%38%
49% 40%
40%
20%3%
11%6% 5%
8% 16% 23%37%
227n = 220 222223 225226215 215 213
Perce
nt of
respo
nden
ts
Not a riskSlight riskModerate riskSevere risk
Respondents also shared their experience of risk events during 2017. A clear majority of respondents (84%) reported experiencing no noteworthy adverse events during the year, but the rate of risk events did vary by region of investment (Table 23). For example, investors primarily focused on LAC experienced proportionally more risk events (31%) than did other respondents. Conversely, U.S. & Canada–focused investors cited a low rate of risk events (8%). By sub-group, Private Debt Investors cited a higher instance of risk events than did Private Equity Investors (26% vs. 11%).
Table 23: Significant risk events experienced in 2017 by regional focusOverall LAC South Asia SSA U.S. & Canada WNS Europe
n 229 16 13 25 61 15
No 84% 69% 85% 76% 92% 81%
Yes 16% 31% 15% 24% 8% 19% Source: GIIN
Respondents also shared additional color on the specific causes of risk events they experienced, including:
• complex and changing economic and political environments, such as in Kenya;
• demonetization in India and volatility in currency exchange rates;
• corruption; and
• climate change–related disasters, such as drought.

Appendices

48 G L O B A L I M P A C T I N V E S T I N G N E T W O R K
Appendix 1: List of survey respondentsWe are grateful to the following organizations for their contributions, without which this survey would not be possible.
Aavishkaar
ABN AMRO Social Impact Fund
Accion Venture Lab
ACTIAM
Acumen
Adobe Capital
Aegon
AgDevCo
AlphaMundi
Alterfin
Althelia Ecosphere (Mirova-Althelia)
Ameris Capital (Fondo De Inversión Social)
Annie E. Casey Foundation
Annona Sustainable Investments
Anonymous 1
Anonymous 2
Anonymous 3
Anonymous 4
Anonymous 5
Aqua-Spark
Ashburton Investments
Athena Capital Advisors
Australian Ethical Investment
Avanath Capital Management
Aventura Investment Partners, LLC
AXA Investment Managers
Bank Degroof Petercam
Battle Creek Community Foundation
BELLE Michigan Fund
BESTSELLER FOUNDATION
Bethnal Green Ventures
Beyond Capital Fund
IDB Invest
Big Issue Invest
Big Society Capital
BlackRock
Blue Haven Initiative
BlueOrchard Finance Ltd
BNP Paribas
Bridges Fund Management
Business Partners International
California Fisheries Fund
Calvert Impact Capital, Inc.
Capital 4 Development Partners
Capria
Capricorn Investment Group
CDC Group
Cheyne Capital
Christian Super
Citizen Capital
City Light Capital
Clean Energy Trust
Clearinghouse CDFI
Closed Loop Fund
Community Capital Management, Inc.
Community Forward Fund Assistance Corp
Community Investment Management, LLC
CONINCO Explorers in Finance SA
Conservation Resource Partners, LLC
Cooperative Fund of New England
CoopEst
Cordaid Investment Management
Core Innovation Capital
CoreCo Private Equity
Creation Investments Capital Management, LLC
Credit Suisse
Cultivian Sandbox
Dalio Family Office
DBL Partners
Deutsche Asset Management
Deutsche Bank Community Development Finance Group
Dev Equity
Développement International Desjardins
DOB Equity
Dolma Impact Fund
DWM
EcoEnterprises Fund
Ecosystem Investment Partners
Edwards Mother Earth Foundation
Elevar Equity
Enclude
ENGIE Rassembleurs d’Energies
Enterprise Community Partners

49A N N U A L I M P A C T I N V E S T O R S U R V E Y 2 0 1 8
Esmee Fairbairn Foundation
Farmland LP
Finance in Motion
Fledge
FMO
Ford Foundation
Fund of Regional Social Programs “Our Future”
Fundación Creas
Futuregrowth Asset Management
Gary Community Investments
GAWA Capital
Generation Investment Management
Global Innovation Fund
Global Partnerships
Grameen America, Inc.
Grameen Credit Agricole Foundation
Grassroots Capital Management; Caspian Impact Investment Adviser
Gray Ghost Ventures
Grofin
Habitat for Humanity International
HCAP Partners
HESTA
HRSV (Hooge Raedt Social Venture) B.V.
IDP Foundation, Inc.
IFU Investment Fund for Developing Countries
Impact Community Capital, LLC
Impact Engine
Impact Finance Management SA
Impact Investment Exchange
Impact Investment Group
Impax Asset Management
INCO
Incofin Investment Management
Injaro Investments
Insitor Impact Asia Fund
Inspirit Foundation
International Financial Corporation (IFC)
Invest in Visions
Investec Asset Management
Investir&+
Investisseurs & Partenaires (I&P)
iungo capital
JPMorgan Chase & Co.
KOIS Invest
Kukula Capital Plc
LeapFrog Investments
LGT Impact
Lion’s Head Global Partners
Living Cities, Inc.
Local Enterprise Assistance Fund
Lok Capital
Lumina Foundation
MacArthur Foundation
MainStreet Partners
Mary Reynolds Babcock Foundation
Mennonite Economic Development Associates (MEDA)
Media Development Investment Fund
Menterra Venture Advisors Private Limited
Mercy Corps
Michael & Susan Dell Foundation
MicroVest Capital Management
Mirova
National Australia Bank
National Community Investment Fund
NatureVest (The Nature Conservancy)
New Forests
New Market Funds
New Summit Investments
NewWorld Capital Group
NN IP
Nonprofit Finance Fund
Norsad Finance Limited
Nuveen, A TIAA Company
Oikocredit International
Omidyar Network
Omnivore P artners
Organización Román
Overseas Private Investment Corporation (OPIC)
Patamar Capital
PGGM
Phatisa
Phitrust Partenaires
Prudential Impact Investments
PSM Clean Energy (Private Securities Market, LLC)
QBE Insurance Group

50 G L O B A L I M P A C T I N V E S T I N G N E T W O R K
Renewal Funds
responsAbility Investments AG
Rianta Capital
Rockefeller Foundation
Root Capital, Inc.
RS Group
Sarona Asset Management
SeaChange Capital Partners
SEAF
Seattle Foundation
Self-Help Federal Credit Union
Shared Interest
Shell Foundation
SilverStreet Capital
SITAWI Finance for Good
Sitra
SJF Ventures
SLM Partners
SME Impact Fund
Social and Sustainable Capital
Social Finance
Social Investment Business
Social Ventures Australia
Symbiotics
Terra Global Investment Management, LLC
The California Endowment
The David and Lucile Packard Foundation
The DOEN Foundation
The Heron Foundation
The J.W. McConnell Family Foundation
The Lyme Timber Company
The McKnight Foundation
The NHP Foundation
The Osiris Group
The Rise Fund
The Russell Family Foundation
The Sasakawa Peace Foundation
Timber Capital Limited
Treehouse Investments, LLC
TriLinc Global
Triodos Investment Management
Triple Jump
Turner Impact Capital
UBERIS Capital
UBS
UN Capital Development Fund
UNICEF USA Bridge Fund
Upaya Social Ventures
Vancouver City Savings Credit Union
Vermont Community Loan Fund (VCLF)
Vilcap Investments
Villgro Innovations Foundation
Virginia Community Capital
Vital-Capital Fund
Vox Capital
W.K. Kellogg Foundation
WaterEquity
Wespath Benefits and Investments
WHEB Asset Management
Working Capital for Community Needs
XSML Capital

51A N N U A L I M P A C T I N V E S T O R S U R V E Y 2 0 1 8
Appendix 2: List of definitions provided to survey respondents
General• Impact investments: Investments made into companies, organizations, and funds with the intention to generate social
and environmental impact alongside a financial return.
• Blended finance: a strategy that combines capital with different levels of risk in order to catalyze risk-adjusted, market-rate-seeking capital into impact investments.
Instruments• Deposits & cash equivalents: Cash management strategies that incorporate intent toward positive impact.
• Private debt: Bonds or loans placed to a select group of investors rather than being syndicated broadly.
• Public debt: Publicly traded bonds or loans.
• Equity-like debt: An instrument between debt and equity, such as mezzanine capital or deeply subordinated debt. Often a debt instrument with potential profit participation. E.g. convertible debt, warrant, royalty, debt with equity kicker.
• Private equity: A private investment into a company or fund in the form of an equity stake (not publicly traded stock).
• Public equity: Publicly traded stocks or shares.
• Real assets: An investment of physical or tangible assets as opposed to financial capital, e.g. real estate, commodities.
Stages of growth• Seed/Start-up: Business idea exists, but little has been established operationally; pre-revenues.
• Venture: Operations are established, and company may or may not be generating revenues, but does not yet have positive EBITDA.
• Growth: Company has positive EBITDA and is growing.
• Mature: Company has stabilized at scale and is operating profitably.
Contributors of risk• Business model execution and management risks: Risks of a company generating lower profits than anticipated and
ineffective and/or underperforming management.
• Country and currency risks: Risks which include political, regulatory, local economic or currency-linked risks.
• ESG risk: Risk derived from noncompliance with environmental, social, or governance criteria.
• Financing risk: Risk of the investee not being able to raise subsequent capital necessary to its growth.
• Impact risk: The possibility that the investment does not achieve the desired social or environmental benefits.
• Liquidity and exit risk: The risk of being unable to exit the investment at the desired time.
• Macroeconomic risk: Risk that includes regional or global economic trends.
• Market demand and competition risk: Risks of low demand for the investee’s product or service or declining revenues from the actions of a competitor.
• Perception and reputational risks: Risks of loss resulting from damages to an investor’s or investee’s reputation.

52 G L O B A L I M P A C T I N V E S T I N G N E T W O R K
Technology• Augmented reality: A live direct or indirect view of a physical, real-world environment whose elements are
“augmented” by computer-generated or extracted real-world sensory input such as sound, video, graphics, haptics or GPS data.
• Automated data collection: Real-time data collection through business processes. Can be operations/business data or impact data.
• Blockchain technology: A continuously growing list of records, called blocks, which are linked and secured using cryptography. It can serve as an open, distributed ledger that can record transactions between two parties efficiently and in a verifiable and permanent way.
• Machine learning: A field of computer science in which computers can learn without explicit programming.
• Robo-advisors: Digital financial advisors that offer financial advice based on mathematical rules or algorithms.
• Virtual reality: A computer technology that uses headsets or multi-projected environments, sometimes in combination with physical environments or props, to generate realistic images, sounds and other sensations that simulate a user’s physical presence in a virtual or imaginary environment.
Climate change • Sequestration: The long-term storage of carbon dioxide or other forms of carbon to mitigate or defer global warming.
• Adaptation: reduction of the vulnerability of social and ecological systems to relatively sudden climate change and thus offset the effects of global warming.

53A N N U A L I M P A C T I N V E S T O R S U R V E Y 2 0 1 8
Appendix 3: Outreach partnersThe GIIN appreciates the assistance of the following organizations, which helped to encourage impact investors in their networks to participate in the survey.
Acrux Partners is an advisory firm focused on responsible and impact investing in South America. In addition to consulting work, Acrux Partners promotes and advocates for the development and consolidation of the responsible and impact investment sector in South America.
http://www.acruxpartners.com/
Asian Venture Philanthropy Network (AVPN) is a funders’ network based in Singapore committed to building a vibrant and high impact social investment community across Asia. AVPN’s mission is to catalyze the movement toward a more strategic, collaborative and outcome focused approach to philanthropy and social investing, ensuring that resources are deployed as effectively as possible to address key social challenges facing Asia today and in the future.
www.AVPN.asia
Austral University intends to serve society by pursuing truth, creating and disseminating knowledge, educating on virtues, and catering to every individual’s transcendent destiny, providing intellectual, professional, social, and public leadership.
http://www.austral.edu.ar/en/
The Bertha Centre for Social Innovation and Entrepreneurship is a specialised unit at the University of Cape Town’s Graduate School of Business (GSB). Its mission is to build the capacity and pioneering practices in Africa - with partners, practitioners and students - to advance the discourse and systemic impact of social innovation. In collaboration with the GSB, the Centre has integrated social innovation into the business school curriculum, established a wide community of practitioners and awarded over R7-million in scholarships to students from across Africa. It was established in 2011 in partnership with the Bertha Foundation, a family foundation that works with inspiring leaders who are catalysts for social and economic change and human rights, the Centre has become a leading academic centre in Africa.
www.gsb.uct.ac.za
Established by digital pioneers Jean and Steve Case, the Case Foundation invests in people and ideas that can change the world. For two decades, it has focused on harnessing the best impulses of entrepreneurship, innovation, technology, and collaboration to address urgent social challenges. Today it drives at two major movements—impact investing and inclusive entrepreneurship—on the belief that both have the potential to catalyze action to help solve pressing social problems and expand the economy while inspiring companies, organizations and people to be fearless so they can drive transformational change.
https://casefoundation.org/

Confluence Philanthropy advances mission-aligned investing. It supports and catalyze a community of private, public and community foundations, families, individual donors, and their values-aligned investment managers representing more than USD 70 billion in philanthropic assets under management, and over USD 3.5 trillion in managed capital. Members are committed to full mission alignment when prudent and feasible. Based in the United States, Europe, Latin America, Canada, and Puerto Rico, members collectively invest around the world.
http://www.confluencephilanthropy.org/
EMPEA is the global industry association for private capital in emerging markets. An independent, non-profit organization, the association’s membership comprises 300+ firms representing institutional investors, fund managers and industry advisors who together manage more than USD 5 trillion in assets across 130 countries.
https://www.empea.org/
The Global Steering Group is an independent global steering group catalyzing impact investment and entrepreneurship to benefit people and the planet.
http://gsgii.org/
Impact Investors Council is a member-based industry body that has been established to build a compelling and comprehensive India Impact story and strengthen Impact Investing in India. Envisioned in 2013, IIC was incorporated in December 2014. IIC promotes the cause of supporting underprivileged citizens through Impact Investing. Its mission is to encourage private capital to bridge the social investment gap in India in sectors such as financial inclusion, clean energy, education, water and sanitation, and healthcare. It has an active support from around 40 prominent impact investors and ecosystem players managing funds in excess of USD 1 billion.
www.iiic.in
The ImPact is a membership network of family enterprises (family offices, foundations, and businesses) that are committed to making investments with measurable social impact. The ImPact provides families with the knowledge and network they need to make more impact investments more effectively, and uses sophisticated technology for data aggregation, analysis, and reporting to shift the narrative of impact investing from one of inputs (dollars committed) to outcomes (impact created). Its purpose is to improve the probability and pace of solving social problems by increasing the flow of capital to investments generating measurable social impact.
http://theimpact.org/

55A N N U A L I M P A C T I N V E S T O R S U R V E Y 2 0 1 8
The Intentional Endowments Network (IEN) supports colleges, universities, and other mission-driven tax-exempt organizations in enhancing financial performance by aligning their endowment investment practices with their mission, values, and sustainability goals. It does this in a variety of ways, including hosting in-person forums and events; facilitating peer networking; curating useful resources on sustainable investing opportunities; and providing educational venues for information exchange around a variety of sustainable investing strategies, such as ESG integration, impact investing, and shareholder engagement. In doing so, this broad-based, collaborative network contributes to creating a healthy, just, and sustainable society. IEN is an initiative of The Crane Institute of Sustainability, a tax-exempt 501(c)(3) non-profit.
http://www.intentionalendowments.org/
Mission Investors Exchange is a leading network of foundations engaged in impact investing. Its more than 200 members comprise a vibrant community committed to tackling the world’s most intractable social and environmental issues, from climate change and global health to education and quality jobs.
www.missioninvestors.org
New Ventures (NV) catalyzes innovative enterprises that generate profit and contribute to solve environmental and social problems in Latin America. As the leading platform of the impact investing sector in the region, New Ventures works through four main pillars: acceleration, financing, promotion, and training to strengthen the regional social entrepreneurship ecosystem.
http://nvgroup.org/
The leading national network of community development financial institutions (CDFIs), Opportunity Finance Network (OFN) shapes policy, conducts research, and creates partnership and programs that help its members deliver high impact in financially stressed communities. OFN’s members offer responsible financial products and services in all types of communities—urban, rural, suburban, and Native—across the U.S. With its members, investors, and partners, OFN connects communities to capital that creates jobs, supports small business, builds affordable housing, cultivates healthy food and energy efficiency, and promotes safe borrowing and lending.
www.ofn.org
The Dutch Association of Investors for Sustainable Development (VBDO) is a not-for-profit multi-stakeholder organization. Its mission is to make capital markets more sustainable. Members include asset managers, non-governmental organizations, consultancies, trade unions, insurance companies, banks, pension funds, and individual investors. VBDO believes that we can no longer afford not to have sustainability embedded in capital markets. VBDO is the Dutch member of the international network of social investment fora (SIFs).
www.vbdo.nl

56 G L O B A L I M P A C T I N V E S T I N G N E T W O R K
About the Global Impact Investing Network
ResearchThe GIIN conducts research to provide data and insights on the impact investing market and to highlight examples of e�ective practice.
To learn more, visit:thegiin.org/research
Impact Measurment and Management (IMM)
Membership Initiative for Institutional Impact Investment
GIIN Membership provides access to a diverse global community of organizations interested in deepening their engagement with the impact investment industry.
To learn more, visit: thegiin.org/membership/
The GIIN provides tools, guidance, trainings, and resources to help investors identify metrics and integrate impact considerations into investment management.
To learn more, visit:thegiin.org/imm
The GIIN Initiative for Institutional Impact Investment supports institutional asset owners seeking to enter, or deepen their engagement with, the impact investing market, by providing educational resources, performance research, and a vibrant community of practice.
To learn more, visit: thegiin.org/giin-initiative-for-institutional-impact-investment
The Global Impact Investing Network (GIIN) is a nonprofit organization dedicated to increasing the scale and e�ective-ness of impact investing around the world. The GIIN builds critical infrastructure and supports activities, education, and research that help accelerate the development of a coherent impact investing industry.
To learn more, visit:thegiin.org

For more information
Please contact Rachel Bass at [email protected] with any comments or questions about this report.
To download industry research by the GIIN and others, please visit https://thegiin.org/research.
DisclosuresThe Global Impact Investing Network (“GIIN”) is a nonprofit 501c(3) organization dedicated to increasing the scale and effectiveness of impact investing. The GIIN builds critical infrastructure and supports activities, education, and research that help accelerate the development of a coherent impact investing industry.
Readers should be aware that the GIIN has had and will continue to have relationships with many of the organizations identified in this report, through some of which the GIIN has received and will continue to receive financial and other support.
The GIIN has collected data for this report that it believes to be accurate and reliable, but the GIIN does not make any warranty, express or implied, regarding any information, including warranties as to the accuracy, validity or completeness of the information.
This material is not intended as an offer, solicitation, or recommendation for the purchase or sale of any financial instrument or security.
[email protected] | www.thegiin.org | @theGIIN
2018_GIIN_ImpactReport_Print.indd 58 5/29/18 11:15 AM