annual investment report supplement reported under g.s ... commission... · annual investment...
TRANSCRIPT

Annual Investment Report Supplement – Reported under G.S. 147-69.12(b)
Fiscal Year 2015-2016
The report is divided into three sections:
Section 1, the Value and Performance Supplement, lists the market value and investment
return for each externally managed investment in the Retirement Systems portfolio.
Section 2, the Fee Supplement, lists the fees for each externally managed investment in the
Retirement Systems portfolio.
Section 3, entitled Additional Information, lists several additional items requested by G.S.
147-69.12(b).

Section 1 – Value and Performance Supplement

NCRS Fixed Income Portfolio
June 30, 2016
Fund Inception Market Value 1 Yr 3 Yr 5 Yr 10 Yr 15 Yr
Core IG Fixed Income 1997 $22,159,796,094 8.1 5.4 5.4 6.8 6.6
Core Fixed Income Benchmark 9.1 5.9 5.6 6.5 6.3
IG Fixed Income Cash 2014 $2,501,567,776 0.7 - - - -
iMoneyNet First Tier Inst'l Money Market Index 0.2 0.1 0.1 - -
Total $24,661,363,870 7.2 5.1 5.2 6.7 6.5
IG Fixed Income Benchmark 8.2 5.5 5.4 6.4 6.3
Methodology and Notes:
Returns
-Returns are calculated using a Modified Dietz time weighted rate of return methodology. This method uses the beginning and ending
valuation for the measurement period, and weights each cash flow by the amount of time it is invested. Returns are reported net of fees.
- The Core Fixed Income Benchmark consists of 30% Gov’t 5+yr / 35% Corp. (Inv. Grade - BBB Max 25%) 5+yr / 35% Mtg. Master
- The IG Fixed Income Custom Benchmark is a blend of the Core Fixed Income Benchmark and the IG Fixed Income Cash Benchmark using the
following weights: 10% IG Fixed Income Cash Benchmark and 90% Core Fixed Income Benchmark.

NCRS Public Equity Portfolio
June 30, 2016
Fund Inception Market Value 1 Yr 3 Yr 5 Yr 10 Yr 15 Yr
Baillie Gifford EAFE Plus Alpha 2007 $1,390,805,716 (11.9) 3.9 2.8 - -
MSCI EAFE (10.2) 2.1 1.7 1.6 4.3
Baillie Gifford Emerging Markets Equities 2008 $465,996,293 (13.4) 0.4 (2.5) - -
MSCI Emerging Markets (12.1) (1.6) (3.8) 3.5 9.1
BlackRock EAFE LC Growth 2016 $659,307,591 - - - - -
MSCI EAFE Growth Index (4.5) 4.5 3.6 3.2 5.0
BlackRock Emerging Markets Opportunities Fund 2009 $529,844,399 (11.1) (1.2) (1.6) - -
MSCI Emerging Markets (12.1) (1.6) (3.8) 3.5 9.1
BlackRock Frontier Markets Fund 2009 $180,306,585 (13.4) (0.7) 0.2 - -
MSCI Frontier Markets (11.7) 1.4 1.8 0.5 -
BlackRock Mid Cap Passive 2013 $321,908,170 1.0 - - - -
Russell Midcap Custom 1.0 - - - -
BlackRock MSCI ACWI ex US IMI 2010 $5,676,848,785 (9.3) 1.9 0.6 - -
MSCI ACWI ex US IMI Index (9.6) 1.7 0.4 2.2 5.4
BlackRock R1000 Passive 2013 $6,991,566,238 3.0 - - - -
Russell 1000 Custom 2.9 - - - -
Brandes Global Equity 2009 $929,737,160 (9.7) 4.2 5.2 - -
MSCI All Country World Net Index (3.7) 6.0 5.4 4.3 5.0
Brown Advisory Small Cap Growth 2008 $227,129,919 2.4 11.2 10.6 - -
Russell 2000 Growth (10.8) 7.7 8.5 7.1 5.9
Earnest Partners Small Cap Value 2002 $397,728,022 (1.1) 9.3 10.0 6.3 -
Russell 2000 Value (2.6) 6.4 8.1 5.2 7.7
ECM Feeder Fund 2 2016 $125,220,397 - - - - -
Equity Hedge Benchmark (1.3) 1.1 - - -
FIS Non-US 2013 $157,942,982 (8.2) 2.3 - - -
MSCI ACWI Ex US (10.2) 1.2 0.1 1.9 5.0
Franklin Templeton Int’l SC 2010 $461,410,247 (9.8) 3.3 3.9 - -
MSCI AC World ex USA Small Cap Index (5.5) 4.9 2.3 - -
GMO International Active Strategy 2002 $954,069,292 (8.1) 1.1 0.1 0.6 -
MSCI EAFE / MSCI ACWI ex US IMI Custom (9.6) 1.7 0.4 1.1 4.1
Hotchkis Large Cap Fundamental Value 2008 $772,741,580 (5.8) 8.1 11.0 - -
Russell 1000 Value 2.9 9.9 11.4 6.1 6.4
Leading Edge Large Cap 2013 $205,111,713 (2.5) 9.4 - - -
Russell 1000 2.9 11.5 11.9 7.5 6.0
Longview Global Equity 2007 $1,509,652,737 (1.1) 12.1 12.4 - -
MSCI World / MSCI ACWI Custom (3.7) 6.0 5.4 3.8 4.4
Mondrian Emerging Markets Equity 2009 $345,325,592 (7.4) (2.9) (2.0) - -
MSCI Emerging Markets (12.1) (1.6) (3.8) 3.5 9.1
Mondrian Focused International Equity 2007 $1,192,661,600 (5.8) 5.0 4.0 - -
MSCI EAFE (10.2) 2.1 1.7 1.6 4.3
Mondrian Int’l SC 2010 $439,297,594 (3.3) 4.4 3.9 - -
MSCI World Ex US Small Cap Index (3.3) 6.3 3.6 3.3 8.2
Numeric Emerging Growth 2007 $323,328,744 (12.0) 6.2 9.8 - -
Russell 2000 Growth (10.8) 7.7 8.5 7.1 5.9
Numeric Small Cap Value 2007 $357,209,876 (3.6) 7.5 10.5 - -
Russell 2000 Value (2.6) 6.4 8.1 5.2 7.7
Returns

NCRS Public Equity Portfolio
June 30, 2016
Fund Inception Market Value 1 Yr 3 Yr 5 Yr 10 Yr 15 Yr
Returns
Old North State Hedge Fund 2015 $2,493,376,809 (0.8) - - - -
Equity Hedge Benchmark (1.3) 1.1 - - -
Piedmont R200 Passive 2015 $3,297,156,391 4.0 - - - -
Russell Top 200 Custom 4.0 - - - -
Piedmont Strategic Core 2002 $461,605,608 (4.1) 9.9 9.6 6.3 -
NC S&P 500/R1000 Custom 2.9 11.5 11.9 7.3 5.7
Sands Large Cap Growth Equity 2006 $486,091,492 (7.6) 9.8 11.1 - -
Russell 1000 Growth 3.0 13.1 12.3 8.8 5.5
TimesSquare Focused Growth Equity 2007 $217,918,989 (2.5) 7.8 12.3 - -
Russell Midcap Growth (2.1) 10.5 10.0 8.1 7.0
TimesSquare MidCap Growth 2007 $486,934,481 (1.7) 9.4 10.6 - -
Russell Midcap Growth (2.1) 10.5 10.0 8.1 7.0
ValueAct Capital 2015 $344,782,059 - - - - -
Russell MidCap Value 3.2 11.0 11.7 7.8 9.5
Walter Scott EAFE / International 2002 $1,384,009,451 3.4 5.1 4.4 5.0 -
MSCI ACWI Ex US (10.2) 1.2 0.1 1.9 5.0
Wasatch Emerging Markets Small Cap 2014 $187,046,219 (9.8) - - - -
MSCI Emerging Markets Small Cap (12.5) 0.3 (2.0) - -
Wellington Diversified International 1987 $988,630,708 (8.5) 3.7 2.3 2.9 5.5
MSCI ACWI Ex US (10.2) 1.2 0.1 1.9 5.0
Wellington Large Cap Value 2011 $692,772,532 3.5 9.9 10.4 - -
Russell 1000 Value 2.9 9.9 11.4 6.1 6.4
Wellington Opportunistic Growth 1999 $1,036,289,538 0.5 12.3 10.4 8.3 6.6
Russell 3000 Growth Custom 1.9 12.6 12.0 8.6 6.0
BlackRock Global Transition N/A $557,359,363 - - - - -
Cash and Liquidating Accounts N/A $6,973,136 - - - - -
Total $37,256,098,008 (3.9) 6.6 6.2 4.6 4.9
Public Equity Benchmark (3.8) 6.1 5.4 4.1 4.2
Methodology and Notes:
-Returns are calculated using a Modified Dietz time weighted rate of return methodology. This method uses the beginning and ending
valuation for the measurement period, and weights each cash flow by the amount of time it is invested. Returns are reported net of fees.
- As of July 2011, the Public Equity Benchmark is the dynamically weighted combination of the MSCI ACWI IMI Net (Long-Only) and a beta
adjusted MSCI ACWI IMI Net (Hedged Equity). Prior to July 2011, the Public Equity Benchmark was a blend of the Domestic Equity
Benchmark and Non-U.S. Equity Benchmark at policy weights.
- Equity portfolio cash and any residual value from closed accounts are aggregated in the line item labeled "Cash and Liquidating
Accounts".
- The Equity Hedge Benchmark is the MSCI ACWI IMI Net beta adjusted to the target beta of the Equity Hedge Portfolio.

NCRS Real Estate Portfolio
June 30, 2016
Fund Vintage Market Value Commitment Unfunded IRR TVPI Distributions DPI Advisory Board
AG Asia Realty Fund II, L.P. 2010 $9,621,130 $25,000,000 $5,591,769 22.16 1.76 $24,631,720 1.27 YES
AG Core Plus Realty Fund I, L.P. 2003 $352,105 $75,000,000 $3,750,000 17.55 1.52 $107,941,956 1.51 YES
AG Core Plus Realty Fund II, L.P. 2006 $6,937,648 $100,000,000 $5,500,000 8.56 1.35 $120,592,379 1.27 YES
AG Net Lease Realty Fund II, L.P. 2010 $97,698,409 $100,000,000 $3,000,000 7.80 1.34 $31,360,000 0.33 YES
AG Net Lease Realty Fund III, L.P. 2014 $35,980,275 $100,000,000 $64,000,000 2.17 1.03 $1,012,862 0.03 YES
American Value Partners Fund I, L.P. 2007 $12,143,658 $50,000,000 $12,530,944 0.88 1.04 $27,001,101 0.72 YES
Benson Elliot Real Estate Partners II, L.P. 2006 $11,977,444 $62,935,000 $9,016,386 (10.74) 0.49 $16,155,305 0.28 YES
Benson Elliot Real Estate Partners III, L.P. 2008 $35,479,146 $69,502,500 $12,626,025 11.34 1.27 $27,305,983 0.55 YES
BlackRock Developed 2016 $341,736,974 $312,445,976 $0 9.37 1.09 $0 - N/A
Blackstone NC Property Partners, L.P. 2014 $192,396,840 $200,000,000 $18,211,922 7.87 1.09 $6,684,879 0.04 YES
Blackstone Property Partners, L.P. 2014 $338,601,117 $300,000,000 $0 11.31 1.12 $0 - YES
Blackstone Real Estate Partners Europe IV, L.P. 2013 $178,083,759 $250,000,000 $76,802,598 3.48 1.05 $9,640,591 0.05 YES
Blackstone Real Estate Partners Europe V, L.P. 2016 $0 $200,000,000 $200,000,000 - - $0 - YES
Blackstone Real Estate Partners V, L.P. 2006 $56,650,550 $100,000,000 $4,061,200 10.41 1.96 $130,957,814 1.37 NO
Blackstone Real Estate Partners VI, L.P. 2007 $115,210,764 $200,000,000 $9,815,800 12.61 1.93 $284,264,258 1.37 YES
Blackstone Real Estate Partners VII, L.P. 2011 $302,791,738 $300,000,000 $53,371,571 20.24 1.65 $125,915,461 0.48 YES
Blackstone Real Estate Partners VIII, L.P. 2015 $77,485,601 $200,000,000 $126,367,908 4.35 1.02 $294,356 0.00 YES
BREP Edens Investment Partners L.P. 2013 $475,561,185 $487,500,000 $62,961,136 7.57 1.18 $34,477,185 0.08 YES
BR Emerging REIT 2016 $54,423,935 $50,000,000 $0 10.55 1.09 $0 - N/A
BR World REIT 2016 $248,163,145 $227,153,161 $0 9.25 1.09 $0 - N/A
Brookfield Real Estate Finance Fund III, L.P. 2011 $21,615,809 $100,000,000 $26,109,134 10.72 1.22 $69,208,498 0.93 YES
CB Richard Ellis Strategic Partners US IV, L.P. 2005 $8,569,544 $150,000,000 $0 (24.61) 0.10 $5,745,573 0.04 YES
CB Richard Ellis Strategic Partners US V, L.P. 2007 $66,694,720 $100,000,000 $6,142,293 5.95 1.37 $61,965,711 0.66 YES
Cherokee Investment Partners III, L.P. 2002 $1,451,987 $50,000,000 $4,620,127 (26.02) 0.30 $12,146,460 0.27 YES
Cherokee Investment Partners IV, L.P. 2005 $15,926,446 $50,357,693 $7,863,731 (11.18) 0.55 $7,376,043 0.17 YES
CIGNA Realty Investors Open-End Fund 1987 $0 $243,938,601 $0 2.57 1.16 $282,716,893 1.16 N/A
CIM Urban REIT, LLC 2006 $122,111,104 $100,000,000 $0 6.60 1.58 $35,984,596 0.36 YES
CrossHarbor Institutional Partners, L.P. 2006 $7,051,004 $50,000,000 $1,405,443 2.15 1.14 $43,305,431 0.98 YES
CrossHarbor Institutional Partners II, L.P. 2010 $59,565,787 $106,000,000 $17,458,824 12.40 1.34 $58,985,882 0.67 YES
Crow Holdings Realty Partners IV, L.P. 2006 $13,372,909 $80,000,000 $6,450,761 1.68 1.10 $71,774,834 0.93 YES
Crow Holdings Realty Partners IV-A, L.P. 2006 $3,267,643 $20,000,000 $1,612,691 1.58 1.10 $17,859,001 0.93 YES
Crow Holdings Realty Partners V, L.P. 2008 $16,099,789 $100,000,000 $7,721,151 15.33 1.50 $135,849,813 1.34 YES
Crow Holdings Realty Partners VI, L.P. 2012 $67,973,938 $85,000,000 $12,952,059 8.20 1.15 $18,984,485 0.25 YES
Crow Holdings Realty Partners VII, L.P. 2015 $42,159,574 $100,000,000 $58,470,486 (3.38) 0.98 $0 - N/A
DB Real Estate Global Opps I-A/I-B, L.P. 2003 $618,275 $156,430,025 $4,369,135 18.37 1.32 $200,140,832 1.32 YES
DLJ Real Estate Capital Partners I, L.P. 1996 $0 $25,000,000 $0 10.67 1.47 $38,278,693 1.47 YES
DLJ Real Estate Capital Partners II, L.P. 2000 $0 $50,000,000 $0 14.22 1.47 $77,480,141 1.47 YES
DLJ Real Estate Capital Partners III, L.P. 2005 $89,089,430 $150,000,000 $8,062,663 (0.37) 0.98 $61,451,606 0.40 YES
DLJ Real Estate Capital Partners IV, L.P. 2007 $81,680,075 $100,000,000 $12,145,906 3.42 1.18 $31,093,081 0.33 YES
DRA Growth & Income Fund III, LLC 2000 $0 $25,000,000 $0 22.98 2.78 $70,008,163 2.78 YES
DRA Growth & Income Fund IV, LLC 2003 $0 $50,000,000 $0 12.13 1.63 $86,985,562 1.63 YES
DRA Growth & Income Fund V, LLC 2005 $28,132,797 $100,000,000 $0 4.51 1.37 $118,055,672 1.11 YES
DRA Growth & Income Fund V Co-Investment, LLC 2005 $392,631 $25,000,000 $72,637 10.28 1.99 $51,675,697 1.97 YES
DRA Growth & Income Fund VI, LLC 2007 $11,636,583 $50,000,000 $799,999 9.94 1.58 $44,959,902 1.26 YES
DRA Growth & Income Fund VII, LLC 2011 $147,228,902 $150,000,000 $8,190,000 16.46 1.51 $82,734,993 0.54 YES
DRA Growth & Income Fund VIII, LLC 2013 $128,118,171 $150,000,000 $22,695,411 7.51 1.05 $7,724,747 0.06 YES
Frogmore Real Estate Partners I, L.P. 2006 $18,800,755 $45,476,700 $35,212 (5.37) 0.65 $10,683,619 0.24 YES
Frogmore Real Estate Partners II, L.P. 2008 $8,917,388 $49,700,000 $2,757,329 13.35 1.37 $41,396,609 1.13 NO
Frogmore Real Estate Partners III, L.P. 2014 $19,126,193 $77,662,875 $38,956,845 (30.58) 0.72 $204,657 0.01 YES
Harrison St. RE Partners III, L.P. 2011 $23,677,093 $60,000,000 $9,805,164 22.74 1.84 $69,516,929 1.37 YES
Harrison St. RE Partners IV, L.P. 2013 $78,116,935 $100,000,000 $27,102,868 11.74 1.27 $14,162,774 0.19 YES
Harrison St. RE Partners V Co-Investment, L.P. 2014 $35,646,072 $50,000,000 $15,625,000 4.56 1.04 $0 - YES
Harrison St. RE Partners V, L.P. 2014 $46,342,713 $100,000,000 $53,176,468 (1.68) 0.99 $0 - YES
Hawkeye (Scout) Fund 1-A, L.P. 2006 $1,548,311 $50,000,000 $0 14.58 1.50 $76,247,361 1.47 YES
Hawkeye (Scout) Fund II, L.P. 2012 -$4,949,645 $100,000,000 $100,000,000 - - $0 - YES
JER Real Estate Partners Fund III, L.P. 2004 $808,544 $100,000,000 $0 4.20 1.17 $85,915,036 1.16 YES
JER Real Estate Partners IV, L.P. 2006 $0 $43,400,508 $0 (4.97) 0.46 $14,008,724 0.46 YES
JP Morgan Strategic Property Fund 1989 $577,188,291 $305,133,108 $0 9.22 2.64 $250,080,058 0.80 N/A
Keystone Industrial Fund I, L.P. 2006 $437,065 $100,000,000 $1,980,199 4.01 1.30 $135,221,675 1.29 YES
Keystone Industrial Fund II, L.P. 2007 $610,335 $150,000,000 $12,065,217 26.96 2.24 $308,409,754 2.24 YES
Keystone Industrial Fund III, L.P. 2012 $207,780 $110,000,000 $63,129,007 40.37 1.60 $74,681,658 1.59 YES
LaSalle Real Estate Debt Strategies II, L.P. 2013 $47,127,364 $102,225,000 $31,602,323 (3.25) 0.96 $12,312,796 0.20 YES
LBA NC Core Industrial, L.P. 2015 $69,306,931 $300,000,000 $230,693,069 - 1.00 $0 - YES
LEM Real Estate Mezzanine Fund II, L.P. 2006 $5,842,178 $50,000,000 $28,943,344 3.75 1.35 $22,769,011 1.07 YES
Lone Star Real Estate Partners II 2011 $62,079,751 $300,000,000 $29,299,221 27.20 1.52 $344,311,600 1.29 YES
M&G Real Estate Debt Fund III 2013 $24,859,945 $41,247,765 $9,366,857 (6.90) 0.93 $1,437,932 0.05 YES
Meadow Core Plus Real Estate Fund 2014 $184,022,076 $270,071,072 $36,678,866 (14.54) 0.88 $1,216,447 0.01 YES
Meadow Real Estate Fund II, L.P. 2012 $39,854,321 $60,000,000 $1,220,548 22.18 1.57 $53,031,415 0.90 YES
Meadow Real Estate Fund III, L.P. 2014 $94,303,888 $100,000,000 $20,342,233 27.31 1.18 $26,248 0.00 YES
Mesa West Real Estate Income Fund III, L.P. 2012 $76,139,950 $100,000,000 $24,300,618 7.53 1.12 $8,997,841 0.12 YES
Morgan Stanley Real Estate Fund V International 2005 $5,306,189 $110,000,000 $491,566 5.12 1.14 $126,953,788 1.10 YES
Morgan Stanley Real Estate Fund VI, L.P. 2006 $58,028,675 $440,000,000 $0 (15.22) 0.31 $82,103,551 0.18 YES
MS Global RE Securities 2007 $66,768 $400,000,000 $0 0.79 1.07 $428,702,218 1.07 N/A
MW North Carolina Debt Fund, LLC 2016 $0 $200,000,000 $200,000,000 - - $0 - YES
NorthCreek Fund, L.P. 2011 $352,706,642 $205,000,000 $0 19.52 2.21 $100,488,217 0.49 YES
NorthRock Core Fund, L.P. 2008 $794,469,273 $600,000,000 $46,776,557 9.33 1.48 $27,906,233 0.05 YES
NorthRock Fund II, L.P. - Non-Core 2012 $418,067,122 $400,000,000 $54,129,310 20.88 1.42 $71,883,297 0.21 YES
NorthRock Fund II, L.P. - Core 2016 $74,671,522 $71,883,297 $0 3.88 1.04 $0 - YES

NCRS Real Estate Portfolio
June 30, 2016
Fund Vintage Market Value Commitment Unfunded IRR TVPI Distributions DPI Advisory Board
NorthRock Fund III, L.P. 2015 $58,912,505 $400,000,000 $339,303,475 (7.64) 0.96 $0 - YES
NorthRock Fund IV, L.P. 2015 $49,751,250 $400,000,000 $350,248,750 - 1.00 $0 - YES
Paladin Latin American Partners III, L.P. 2008 $17,840,092 $50,000,000 $0 (17.69) 0.52 $7,866,047 0.16 YES
Patria Brazil Real Estate Fund II 2011 $22,458,949 $50,000,000 $20,669,865 1.61 1.04 $8,494,178 0.29 YES
Penwood CSIP I, L.P. 2005 $21,162,379 $50,000,000 $0 (6.80) 0.62 $9,625,390 0.19 YES
Penwood PSIP II, L.P. 2007 $31,607,953 $100,000,000 $14,544,906 18.78 1.65 $109,649,016 1.28 YES
Prudential Property Investment Separate Account 2004 $149,086,132 $204,934,563 $0 9.83 1.73 $202,113,169 0.99 YES
RLJ Lodging Fund I, L.P. 2005 $0 $50,000,000 $0 52.87 1.99 $99,305,766 1.99 YES
RLJ Lodging Fund II, L.P. 2007 $0 $50,000,000 $0 3.61 1.25 $62,322,697 1.25 YES
RLJ Real Estate Fund III, L.P. 2007 $0 $50,000,000 $0 9.62 1.41 $57,227,492 1.41 YES
Rockpoint Growth and Income Side Car Fund I, L.P. 2014 $124,976,789 $200,000,000 $85,028,054 6.07 1.08 $0 - YES
Rockpoint Growth and Income Real Estate Fund I, L.P. 2014 $151,044,230 $200,000,000 $60,641,669 9.84 1.08 $1,102,391 0.01 YES
Rockpoint NYC CIP Investors, L.P. 2013 $22,513 $80,278,018 $1,958,000 40.04 1.43 $112,210,774 1.43 YES
Rockpoint Real Estate Fund I, L.P. 2004 $337,765 $100,000,000 $0 12.04 1.25 $119,067,399 1.25 YES
Rockpoint Real Estate Fund II, L.P. 2005 $25,878,742 $150,000,000 $7,106,431 (2.64) 0.86 $99,821,196 0.68 YES
Rockpoint Real Estate Fund III, L.P. 2007 $10,560,185 $100,000,000 $12,124,556 14.25 1.39 $121,997,376 1.28 YES
Rockpoint Real Estate Fund IV, L.P. 2012 $63,146,178 $100,000,000 $32,253,829 23.68 1.38 $37,557,279 0.52 YES
Rockpoint Real Estate Fund V Side Car, L.P. 2014 $0 $100,000,000 $100,000,000 - - $0 - YES
Rockpoint Real Estate Fund V, L.P. 2014 $10,389,580 $100,000,000 $89,463,315 (20.40) 0.94 $471,302 0.04 YES
Rockwood Capital Real Estate Partners Fund VI, L.P 2005 $30,816,927 $90,000,000 $2,720,290 2.05 1.14 $66,273,827 0.78 YES
Rockwood Capital Real Estate Partners Fund VII, L.P. 2006 $61,866,271 $125,000,000 $0 (3.84) 0.74 $30,244,932 0.24 YES
Rockwood Capital Real Estate Partners Fund VIII, L.P. 2008 $10,189,401 $45,754,007 $0 19.57 1.64 $65,793,325 1.42 YES
Rockwood Capital Real Estate Partners Fund IX, L.P. 2012 $36,173,078 $50,000,000 $14,693,292 13.25 1.25 $7,862,929 0.22 YES
Rockwood Capital Real Estate Partners Fund IX CIV, L.P. 2015 $0 $25,000,000 $0 - - $0 - YES
Rockwood Capital Real Estate Partners Fund X Side Car, L.P.2015 $9,010,774 $50,000,000 $40,989,226 (0.01) 1.00 $0 - YES
Rockwood Capital Real Estate Partners X, L.P. 2015 -$461,989 $100,000,000 $100,000,000 - - $0 - YES
RREEF Global Opportunities Fund II, LLC 2005 $2,986,687 $200,000,000 $3 (8.81) 0.55 $107,890,765 0.54 YES
RREEF Global Opportunities Fund II, LLC Senior Nts 2010 $0 $12,366,672 $0 23.62 1.54 $18,888,580 1.54 YES
Security Capital Focus Select 2007 $8 $30,000,000 $0 3.92 1.39 $41,832,707 1.39 N/A
Sentinel Real Estate Fund 1985 $0 $65,000,000 $0 7.08 3.42 $222,130,004 3.42 N/A
Sentinel Realty Partners V 1998 $0 $50,000,000 $0 7.52 1.73 $86,400,652 1.73 N/A
SRI Seven REIT 2004 $10,927,357 $75,000,000 $2,419,481 7.84 1.58 $103,556,663 1.43 YES
SRI Eight REIT 2006 $56,423,613 $100,000,000 $4,650,149 (3.69) 0.78 $18,021,159 0.19 YES
SRI Nine REIT 2007 $11,247,906 $72,272,625 $11,914,351 10.19 1.47 $77,893,941 1.28 YES
SRI Ten REIT 2010 $59,111,153 $100,000,000 $25,373,442 13.54 1.31 $38,707,023 0.52 YES
STAG Investments II, LLC 2005 $5,632,331 $75,000,000 $0 (5.92) 0.82 $55,812,567 0.74 YES
Starwood Opportunity Fund VII, L.P. 2005 $60,297,398 $150,000,000 $0 (2.55) 0.81 $61,316,355 0.41 YES
Starwood SDL/SOF Co-Investment 2005 $12,479,056 $55,000,000 $4,220,930 7.97 1.85 $81,228,433 1.60 YES
Terra Firma Deutsche Annington, L.P. (Core) 2014 $0 $97,170,215 $0 4.26 1.06 $103,009,894 1.06 NO
Terra Firma Deutsche Annington, L.P. (Non-Core) 2005 $0 $68,457,500 $0 8.58 1.73 $103,646,574 1.73 NO
UBS Trumbull Property Fund 1984 $304,048,834 $215,000,000 $0 8.73 2.08 $293,777,176 1.01 YES
UBS Trumbull Property Income Fund 1984 $164,521,611 $120,995,294 $0 8.32 3.09 $205,589,791 1.70 YES
Value Enhancement Fund II 1996 $323,513 $25,000,000 $0 5.09 1.47 $36,542,913 1.46 N/A
Value Enhancement Fund III, LLC 1998 $0 $25,000,000 $0 14.03 1.73 $43,224,893 1.73 N/A
Value Enhancement Fund IV, L.P. 1999 $0 $100,000,000 $0 (0.19) 0.98 $98,187,830 0.98 N/A
Warburg Pincus Real Estate I, L.P. 2006 $52,141,669 $100,000,000 $0 6.99 1.51 $93,080,733 0.97 YES
WCP Real Estate Fund III(A), L.P. 2011 $90,765,720 $100,000,000 $12,040,000 10.57 1.38 $30,728,982 0.35 YES
Westbrook Real Estate Fund I, L.P. 1995 $0 $10,000,000 $0 26.06 2.16 $23,461,789 2.16 YES
Westbrook Real Estate Fund II, L.P. 1997 $0 $50,000,000 $0 12.92 1.48 $79,872,223 1.48 YES
Westbrook Real Estate Fund III, L.P. 1998 $0 $96,372,752 $0 8.18 1.34 $137,467,835 1.34 YES
Westbrook Real Estate Fund IV, L.P. 2000 $0 $100,000,000 $0 20.62 1.66 $157,651,520 1.66 YES
Transition Accounts 2015 $62,880 N/A N/A N/A N/A N/A N/A N/A
Total $8,353,122,405 $16,081,664,927 $3,245,591,545 6.38 1.31 $8,542,325,094 0.66
Methodology and Notes:
- Returns are calculated using the Internal Rate of Return (IRR) methodology. The IRR is the discount rate where the sum of the discounted cash flows and the discounted valuation is
equal to zero. Returns are reported net of fees.
- Total Value to Paid-In (TVPI), also know as the Investment Multiple, is the ratio of cumulative distributions plus the valuation to cumulative paid-in.
- Distributions to Paid-In (DPI), also know as the Realization Multiple, is the ratio of cumulative distributions to cumulative paid-in.
- The advisory board column is an indication of NCRS participation on the Fund's advisory board, N/A indicates that the Fund has no advisory board.

NCRS Private Equity Portfolio
June 30, 2016
Fund Vintage Market Value Commitment Unfunded IRR TVPI Distributions DPI Advisory Board
A.V. Management IV, LLC 2002 $1,230,838 $5,000,000 $0 (2.83) 0.77 $2,609,797 0.52 N/A
Academy Venture Fund, LLC 1999 $0 $5,000,000 $0 (22.26) 0.18 $915,737 0.18 YES
Accel-KKR Capital Partners IV, LP 2012 $5,520,814 $10,000,000 $4,958,354 10.31 1.15 $104,497 0.02 NO
Access Capital L.P. II D 2002 $112,870 $34,253,063 $5,664,345 4.46 1.21 $32,223,965 1.20 NO
AG Private Equity Partners IV (R), L.P. 2008 $34,309,201 $48,809,524 $16,107,143 2.09 1.09 $1,464,286 0.04 N/A
AG Private Equity Partners IV, L.P. 2008 $37,381,901 $48,810,000 $6,101,250 8.46 1.42 $23,550,825 0.55 YES
Ampersand 2006 Limited Partnership 2006 $22,190,619 $30,000,000 $0 13.45 2.02 $38,302,850 1.28 YES
Angeleno Investors II, L.P. 2006 $19,047,384 $31,700,000 $1,710,650 (3.43) 0.83 $7,036,212 0.22 YES
Apollo Investment Fund VI, L.P. 2005 $0 $150,000,000 $0 4.85 1.23 $158,306,822 1.23 NO
Apollo Investment Fund VII, L.P. 2008 $0 $75,000,000 $0 11.43 1.17 $41,318,857 1.17 NO
Apollo Investment Fund VIII, L.P. 2013 $96,064,836 $220,000,000 $126,430,471 2.73 1.03 $3,148 0.00 NO
ARCH Venture Fund VII, L.P. 2007 $86,100,040 $50,000,000 $0 40.42 3.99 $113,430,179 2.27 YES
ARCH Venture Fund VIII, L.P. 2014 $61,111,335 $80,000,000 $22,400,000 68.80 1.49 $0 - YES
ARCH Venture Fund IX 2016 $0 $60,000,000 $60,000,000 - - $0 - YES
Aurora Ventures IV, LLC 2002 $3,123,123 $15,000,000 $0 (2.65) 0.78 $8,705,428 0.58 YES
Aurora Ventures V, LLC 2005 $11,988,365 $15,000,000 $400,517 5.36 1.38 $8,109,914 0.56 YES
Avista Capital Partners I, L.P. 2006 $23,859,430 $50,000,000 $731,879 5.13 1.32 $45,724,362 0.87 YES
Avista Capital Partners II, L.P. 2008 $81,498,275 $100,000,000 $21,574,564 17.23 2.25 $93,055,955 1.19 YES
Avista Capital Partners III, L.P. 2011 $160,930,997 $150,000,000 $14,948,819 8.37 1.20 $551,628 0.00 YES
Burrill Life Sciences Capital Fund III, L.P. 2005 $17,719,188 $50,000,000 $57,580 (13.00) 0.49 $6,847,519 0.14 YES
Burrill Life Sciences Capital Fund, L.P. 2002 $0 $41,727,143 $0 3.93 1.22 $50,772,459 1.22 YES
Carolinas Capital, L.P. 1990 $0 $225,000 $0 7.09 1.54 $347,062 1.54 NO
Carousel Capital Partners III, L.P. 2006 $3,202,271 $20,966,102 $4,750,128 22.98 2.21 $32,699,930 2.01 YES
Carousel Capital Partners IV, L.P. 2012 $21,347,537 $25,000,000 $11,258,259 23.90 1.67 $1,690,405 0.12 YES
Castle Harlan Partners IV, L.P. 2002 $8,945,367 $75,000,000 $7,252,488 14.71 1.48 $97,352,515 1.36 YES
Castle Harlan Partners V, L.P. 2008 $50,823,652 $100,000,000 $38,692,199 19.60 1.48 $50,018,291 0.73 YES
Catterton Growth Partners, L.P. 2008 $33,276,707 $30,000,000 $1,704,649 9.88 1.64 $13,107,633 0.46 NO
Catterton Growth Partners II, L.P. 2013 $87,904,580 $75,000,000 $1,146,554 12.94 1.19 $0 - YES
Catterton Partners VII, L.P. 2013 $91,635,515 $100,000,000 $24,325,965 12.20 1.21 $308,078 0.00 YES
Chapter IV Investors Special Situations Fund, L.P. 2006 $52,656,551 $45,000,000 $533,097 1.93 1.16 $3,997,832 0.08 NO
Charterhouse Capital Partners IX, L.P. 2009 $40,012,045 $137,720,000 $12,144,439 12.68 1.40 $124,542,151 1.07 YES
Charterhouse Capital Partners X, L.P. 2015 $0 $168,735,000 $166,642,500 - - $0 - YES
Coller International Partners IV, L.P. 2002 $3,724,629 $84,729,452 $1,000,000 13.38 1.38 $117,383,304 1.34 YES
Crestview Partners II, L.P. 2008 $68,690,740 $100,000,000 $22,111,655 11.80 1.62 $57,419,584 0.74 YES
Crestview Capital Partners III, L.P. 2013 $32,721,942 $150,000,000 $116,221,337 (3.29) 0.97 $0 - YES
CVC Europe Equity Partners IV, L.P. 2005 $16,568,972 $78,539,500 $8,379,224 16.42 1.92 $133,264,898 1.70 NO
CVC Capital Partners VI, L.P. 2014 $27,434,269 $97,488,750 $53,387,142 (10.97) 0.90 $12,745 0.00 NO
CVE Kauffman Fund I 2007 $58,315,163 $50,000,000 $10,363,723 11.64 1.98 $20,679,147 0.52 YES
DLJ Merchant Banking Partners II, L.P. 1996 $0 $6,896,027 $0 5.98 1.30 $9,903,153 1.30 NO
Elevation Partners, L.P. 2005 $1,708,029 $91,651,866 $1,066,179 12.18 1.59 $145,853,211 1.57 YES
Francisco Partners II, L.P. 2006 $19,074,616 $60,000,000 $4,140,000 10.47 1.55 $72,853,478 1.23 YES
Francisco Partners IV, L.P. 2015 $34,273,164 $100,000,000 $66,000,000 0.90 1.01 $0 - YES
Franklin Fairview I, L.P. 1997 $540,338 $2,500,000 $21,725 (1.06) 0.86 $1,615,789 0.65 NO
GCM Grosvenor - NC Innovation Fund 2010 $152,128,016 $230,000,000 $62,941,369 19.12 1.60 $133,790,959 0.75 N/A
GCM Grosvenor - NC Innovation Fund 2013-1 2013 $12,789,158 $15,000,000 $1,886,068 7.21 1.10 $1,793,441 0.14 N/A
GCM Grosvenor - NC Innovation Fund II 2015 $24,540,663 $247,500,000 $223,948,615 (0.74) 1.00 $0 - N/A
GCM Grosvenor - NC Investment Fund 2006 2006 $118,532,750 $250,000,000 $5,574,021 5.16 1.34 $209,295,088 0.86 N/A
GCM Grosvenor - NC Investment Fund 2008 Series 1 2008 $108,627,829 $250,000,000 $101,694,470 5.42 1.25 $76,983,197 0.52 N/A
GCM Grosvenor - NC Investment Fund 2008 Series 2 2009 $38,970,307 $50,000,000 $12,615,531 0.61 1.02 $392,191 0.01 N/A
Halifax Capital Partners II, L.P. 2005 $5,845,311 $15,000,000 $2,992,063 13.33 1.78 $15,725,464 1.30 YES
Halifax Capital Partners III, L.P. 2012 $21,295,165 $30,000,000 $14,721,060 32.76 1.78 $5,830,799 0.38 YES
HarbourVest Partners III, L.P. 1989 $0 $6,500,000 $0 13.91 2.16 $14,012,101 2.16 NO
Harvest Partners IV, L.P. 2001 $3,380,076 $47,904,069 $1,371,715 35.81 2.24 $100,874,516 2.17 YES
Harvest Partners V, L.P. 2006 $27,080,392 $75,000,000 $6,477,503 18.32 1.77 $94,732,839 1.38 YES
Harvest Partners VI, L.P. 2011 $94,926,587 $100,000,000 $7,140,850 22.32 1.61 $54,458,676 0.59 YES
Harvest Partners VII, L.P. 2016 $0 $100,000,000 $100,000,000 - - $0 - YES
Hatteras Venture Partners III, L.P. 2007 $15,597,987 $16,354,000 $583,882 3.99 1.19 $3,210,783 0.20 YES
Hg Capital 7 2013 $64,348,023 $98,230,194 $25,272,907 (3.54) 0.96 $3,637,394 0.05 YES
Highland Capital Partners VI, L.P. 2001 $802,873 $5,000,000 $0 12.07 1.60 $7,161,140 1.43 NO
Highland Capital Partners VII, L.P. 2006 $7,055,720 $15,000,000 $0 2.82 1.16 $10,350,710 0.69 NO
Highland Consumer Fund I, L.P. 2007 $11,353,608 $25,000,000 $750,000 (4.37) 0.77 $7,358,806 0.30 YES
Horsley Bridge International IV, L.P. 2006 $61,103,084 $65,000,000 $4,176,900 7.81 1.52 $31,336,968 0.52 N/A
Horsley Bridge International V, L.P. 2008 $86,259,898 $75,000,000 $13,994,250 18.39 1.60 $11,211,377 0.18 N/A
Horsley Bridge IX, L.P. 2008 $117,203,469 $85,000,000 $5,470,600 19.95 1.99 $40,786,458 0.51 N/A
Intersouth Partners II, L.P. 1988 $0 $2,000,000 $0 (6.10) 0.73 $1,465,150 0.73 NO
Intersouth Partners III, L.P. 1994 $0 $1,000,000 $0 26.92 2.14 $2,139,655 2.14 NO
Intersouth Partners VI, L.P. 2003 $4,494,023 $7,000,000 $0 3.59 1.26 $4,498,450 0.64 NO
Kitty Hawk Capital III, L.P. 1994 $0 $1,000,000 $0 (5.03) 0.59 $592,419 0.59 NO
KRG Capital Fund II, L.P. 2001 $1,165,021 $20,160,635 $582,839 21.65 1.51 $28,480,930 1.45 YES
KRG Capital Fund III, L.P. 2005 $245,105 $75,000,000 $1,407,846 1.63 1.09 $80,013,203 1.09 YES
KRG Capital Fund IV, L.P. 2007 $70,311,255 $150,000,000 $15,099,485 9.67 1.40 $129,715,914 0.91 YES
L Catterton Growth Partners III, L.P. 2016 -$7,610 $75,000,000 $73,990,385 (100.00) - $0 - YES
Landmark Equity Partners XV, L.P. 2014 $86,455,913 $250,000,000 $130,669,037 11.67 1.10 $44,296,633 0.37 Observer
Levine Leichtman Capital Partners V 2013 $114,105,186 $150,000,000 $44,349,445 10.40 1.14 $6,831,705 0.06 YES
Lexington Middle Market Investors, L.P. 2004 $32,160,190 $100,000,000 $912,319 11.33 1.55 $121,169,087 1.22 YES

NCRS Private Equity Portfolio
June 30, 2016
Fund Vintage Market Value Commitment Unfunded IRR TVPI Distributions DPI Advisory Board
Lexington Middle Market Investors II, L.P. 2008 $62,391,776 $100,000,000 $2,262,579 13.01 1.41 $75,866,607 0.78 YES
Lexington Middle Market Investors III, L.P. 2012 $53,548,941 $150,000,000 $86,821,903 13.54 1.13 $18,644,863 0.29 YES
Lindsay Goldberg II, L.P. 2006 $21,410,048 $100,000,000 $7,088,157 8.11 1.51 $118,678,846 1.28 YES
Lindsay Goldberg III, LP 2008 $57,505,817 $100,000,000 $6,152,136 7.61 1.25 $60,077,322 0.64 YES
Longreach Capital Partners 1, L.P. 2006 $44,399,335 $75,000,000 $2,381,639 (0.01) 1.00 $40,866,266 0.48 YES
Markstone Capital Partners, L.P. 2005 $2,444,909 $50,000,000 $1,429,713 (38.92) 0.35 $16,130,502 0.30 YES
Marlin Equity IV 2013 $20,892,404 $49,000,000 $28,390,529 0.85 1.01 $0 - NO
MatlinPatterson Global Opportunities Partners III 2007 $62,104,524 $100,000,000 $4,336,976 2.91 1.15 $48,183,828 0.50 NO
MHR Institutional Partners IV, L.P. 2015 $20,723,211 $150,000,000 $127,500,000 (8.50) 0.91 $229,048 0.01 YES
Milestone Partners IV, L.P. 2013 $47,526,476 $50,000,000 $6,686,038 6.84 1.16 $696,825 0.02 YES
Mount Kellett Capital Partners II, LP 2011 $25,118,494 $75,000,000 $1,741,328 (2.06) 0.95 $46,207,868 0.61 YES
NCEF Liquidating Trust 1990 $0 $10,010,000 $0 20.21 6.14 $61,500,822 6.14 N/A
NEA 14, L.P. 2012 $56,058,063 $45,000,000 $2,700,000 17.11 1.41 $2,445,349 0.06 NO
NEA 15 Opportunity Fund, L.P. 2015 $18,349,905 $65,000,000 $46,312,500 43.70 1.25 $0 - YES
NEA 15, L.P. 2015 $25,151,883 $67,500,000 $42,525,000 0.87 1.01 $0 - NO
North Carolina Economic Opportunities Fund 2001 $0 $6,561,414 $0 16.27 1.69 $11,078,893 1.69 N/A
Northbound NCRS Fund, L.P. 2015 $16,606,090 $200,000,000 $181,933,515 (16.43) 0.92 $0 - N/A
Novak Biddle Venture Partners III, L.P. 2000 $851,854 $17,000,000 $0 (11.98) 0.58 $9,268,219 0.55 NO
Novak Biddle Venture Partners IV, L.P. 2004 $3,127,922 $10,000,000 $307,451 (5.21) 0.70 $5,240,089 0.54 NO
Novak Biddle Venture Partners V, L.P. 2007 $7,697,185 $10,000,000 $864,779 12.67 1.90 $8,892,941 0.97 NO
Oaktree European Principal Fund III, L.P. 2011 $42,352,252 $50,000,000 $9,715,486 7.56 1.25 $0 - NO
Pappas Life Science Ventures II, L.P. 2000 $109,354 $5,000,000 $75,000 3.51 1.20 $5,892,495 1.18 YES
Pappas Life Science Ventures III, L.P. 2005 $5,524,173 $20,000,000 $100,000 (4.45) 0.77 $9,887,398 0.50 YES
Pappas Life Science Ventures IV, L.P. 2009 $11,134,581 $24,456,530 $2,934,783 31.75 2.17 $35,621,699 1.66 YES
Perseus Market Opportunity Fund, L.P. 2002 $0 $50,000,000 $0 (15.81) 0.48 $26,370,970 0.48 YES
Perseus Partners VII, L.P. 2006 $0 $50,000,000 $0 (38.45) 0.17 $7,998,916 0.17 YES
Quaker BioVentures II, L.P. 2007 $54,833,448 $100,000,000 $12,273,118 6.04 1.27 $56,171,280 0.64 YES
Robeco Clean Tech II 2008 $64,120,926 $75,000,000 $7,751,983 (0.89) 0.95 $26,520 0.00 YES
Robeco Clean Tech II Co-Inv 2008 $26,410,843 $75,000,000 $18,288,676 (12.71) 0.52 $2,814,186 0.05 N/A
Sprout Capital VI, L.P. 1989 $0 $6,500,000 $0 18.54 2.16 $14,030,005 2.16 NO
Sprout Growth II, L.P. 1993 $0 $3,000,000 $0 15.44 1.98 $5,930,853 1.98 NO
Starvest Partners II 2007 $25,490,039 $30,000,000 $270,146 (2.36) 0.90 $1,373,689 0.05 YES
StepStone Pioneer Capital Europe 2006 $80,763,077 $201,395,000 $33,308,309 6.21 1.36 $152,156,048 0.89 YES
StepStone Pioneer Capital I 2004 $54,897,674 $140,275,000 $3,483,281 5.97 1.37 $141,008,076 0.99 YES
StepStone Pioneer Capital II 2006 $100,801,870 $125,000,000 $7,228,989 7.92 1.58 $96,767,085 0.77 YES
StepStone SYN 2006 $23,047,550 $35,000,000 $4,648,521 (1.84) 0.89 $4,711,660 0.15 N/A
Synergy Life Science Partners, L.P. 2006 $21,310,913 $38,000,000 $2,660,000 (5.70) 0.71 $3,631,102 0.10 YES
TCV VI, L.P. 2005 $7,740,375 $30,000,000 $141,000 13.87 1.64 $41,226,485 1.38 NO
TCV VIII, L.P. 2013 $97,415,236 $150,000,000 $52,452,944 6.03 1.07 $7,090,192 0.07 YES
Tenaya Capital Fund V 2007 $45,298,239 $75,000,000 $7,478,361 17.24 1.94 $85,343,413 1.26 YES
Tenaya Capital Fund VI 2011 $60,034,412 $75,000,000 $14,556,296 (0.92) 0.98 $0 - YES
Tenaya Capital Fund VII, L.P. 2015 $18,056,009 $90,000,000 $70,093,510 (12.09) 0.91 $0 - YES
Terra Firma Capital Partners II, LP. 2002 $58,893,387 $98,280,000 $206,905 14.24 1.87 $184,912,971 1.42 YES
Terra Firma Capital Partners III, L.P. 2006 $88,523,588 $178,875,000 $662,805 (9.91) 0.52 $17,435,470 0.08 YES
Thoma Bravo XII 2016 $7,431,158 $150,000,000 $141,702,749 (11.86) 0.88 $0 - YES
TPG Biotechnology Partners II, L.P. 2006 $6,061,920 $18,000,000 $8,413 (0.27) 0.99 $12,057,028 0.67 NO
TPG Biotechnology Partners III, L.P. 2008 $37,400,962 $50,000,000 $3,955,911 7.74 1.35 $27,843,839 0.60 YES
TPG Partners IV, L.P. 2003 $0 $100,000,000 $0 13.94 1.71 $161,089,251 1.71 NO
TPG Partners V, L.P. 2006 $0 $150,000,000 $0 (7.73) 0.72 $90,365,522 0.72 NO
TPG Partners VI, L.P. 2008 $0 $75,000,000 $0 (6.38) 0.88 $29,522,273 0.88 NO
Tudor Ventures III, L.P. 2006 $15,980,899 $30,000,000 $370,094 5.71 1.35 $18,928,315 0.73 YES
Venture First II, L.P. 1988 $0 $3,000,000 $0 (15.61) 0.23 $694,029 0.23 NO
Vista Equity Partners Fund IV, L.P. 2011 $62,212,817 $50,000,000 $7,413,253 21.59 1.87 $17,328,841 0.41 NO
Warburg Pincus Private Equity IX, L.P. 2005 $0 $50,000,000 $0 4.20 1.20 $60,538,258 1.20 NO
Warburg Pincus Private Equity X - 10 2007 $0 $22,800,000 $0 (2.09) 0.95 $21,860,427 0.95 YES
Warburg Pincus Private Equity X - 40 2007 $0 $100,000,000 $0 (2.77) 0.93 $62,168,760 0.93 YES
Warburg Pincus Private Equity X - 50 2007 $0 $125,000,000 $0 (2.44) 0.94 $84,177,133 0.94 YES
Warburg Pincus Private Equity XI, L.P. 2012 $145,525,013 $150,000,000 $19,500,000 11.89 1.22 $15,114,150 0.11 Observer
Warburg Pincus Private Equity XII, L.P. 2015 $9,238,040 $175,000,000 $162,750,000 (46.83) 0.76 $0 - Yes
WLR AGO Co-Inv, L.P. 2008 $0 $7,162,281 $0 5.15 1.29 $9,465,652 1.29 N/A
WLR AHM Co-Inv, L.P. 2007 $0 $28,634,000 $0 11.81 1.65 $47,447,135 1.65 YES
WLR Recovery Fund IV, L.P. 2007 $40,238,940 $200,000,000 $19,131,450 7.95 1.36 $206,352,466 1.14 YES
Stock Distribution 2002 $23,204,986 N/A N/A N/A N/A N/A N/A N/A
Total $4,375,776,820 $10,142,849,550 $2,843,446,221 7.47 1.30 $5,047,591,579 0.70
Methodology and Notes:
- Returns are calculated using the Internal Rate of Return (IRR) methodology. The IRR is the discount rate where the sum of the discounted cash flows and the discounted valuation is
equal to zero. Returns are reported net of fees.
- Total Value to Paid-In (TVPI), also know as the Investment Multiple, is the ratio of cumulative distributions plus the valuation to cumulative paid-in.
- Distributions to Paid-In (DPI), also know as the Realization Multiple, is the ratio of cumulative distributions to cumulative paid-in.
- The advisory board column is an indication of NCRS participation on the Fund's advisory board, N/A indicates that the Fund has no advisory board.

NCRS Opportunistic Fixed Income Portfolio
June 30, 2016
Fund Vintage Market Value Commitment Unfunded IRR TVPI Distributions DPI Advisory Board
AG Capital Recovery Partners V, L.P. 2005 $1,499,909 $25,000,000 $1,625,000 2.59 1.11 $24,527,489 1.05 YES
AG Capital Recovery Partners VI, L.P. 2008 $28,177,844 $200,000,000 $0 7.07 1.38 $256,198,204 1.24 YES
AG Commercial Real Estate Debt Fund, L.P. 2008 $11,082,988 $73,214,286 $0 3.65 1.18 $77,155,298 1.03 YES
AG GECC Public-Private Investment Fund (PPIP) 2010 $0 $180,000,000 $0 20.13 1.54 $278,165,031 1.54 YES
AG Global Debt Strategy Partners, L.P. 2008 $445,215,446 $279,915,359 $0 10.59 1.66 $5,399,364 0.02 N/A
AG Pisgah, L.P. 2016 $309,096,140 $400,000,000 $95,000,000 1.82 1.01 $0 - YES
AG TALF Partners, L.P. 2009 $0 $73,214,286 $0 22.42 1.32 $96,608,014 1.32 N/A
Anchorage Capital Partners 2011 $476,289,967 $350,000,000 $0 6.18 1.36 $0 - N/A
Benefit Street Partners Capital Opportunity Fund, L.P. 2013 $140,241,003 $150,000,000 $2,846,551 1.27 1.02 $9,335,034 0.06 N/A
Brigade LCS Fund 2011 $318,120,083 $330,000,000 $0 (0.71) 0.96 $0 - N/A
Brightwood Capital Fund III, L.P. 2014 $69,094,637 $100,000,000 $25,000,000 2.23 1.03 $9,277,199 0.12 YES
Citadel Residential Mortgage Opportunities Fund, LLC 2011 $0 $119,072,245 $0 (2.37) 0.99 $122,558,072 0.99 N/A
Claren Road Credit Fund, Ltd. 2011 $48,621,831 $260,000,000 $0 (3.42) 0.92 $190,339,999 0.73 N/A
Claren Road Credit Opportunities Partners, L.P. 2013 $89,447,729 $231,840,047 $0 (12.13) 0.76 $88,630,946 0.38 N/A
CVI Credit Value Fund 2011 $116,900,000 $150,000,000 $7,500,000 17.34 1.87 $164,786,995 1.09 YES
CVI Credit Value Fund II 2013 $235,200,000 $200,000,000 $10,000,000 7.78 1.24 $428,690 0.00 YES
CVI Credit Value Fund III 2015 $38,200,000 $100,000,000 $65,000,000 12.59 1.09 $0 - YES
Fortress Credit Opportunities Fund III (A) 2012 $53,431,693 $75,000,000 $13,737,055 10.33 1.27 $25,241,427 0.41 YES
GSO Capital Opportunities Fund 2007 $17,386,507 $133,652,282 $8,394,849 17.31 1.68 $244,186,198 1.57 YES
GSO Capital Opportunities Fund II, L.P. 2011 $52,370,295 $100,000,000 $39,727,864 11.33 1.20 $25,654,685 0.39 YES
GSO Capital Solutions Fund II, L.P. 2013 $27,088,847 $84,667,160 $57,274,765 1.84 1.02 $3,144,489 0.11 YES
Highbridge Irish Specialty Loan Fund III plc 2013 $131,826,038 $150,000,000 $14,389,895 7.16 1.15 $27,690,942 0.20 YES
Magnetar Constellation Fund IV LLC 2013 $104,405,869 $100,000,000 $0 3.95 1.08 $3,828,815 0.04 YES
Marathon Currituck Fund, LP 2014 $404,393,721 $453,000,000 $39,600,000 (1.09) 0.98 $0 - N/A
MCP Private Capital Fund II 2014 $18,560,096 $82,149,000 $45,308,131 (14.42) 0.85 $1,209,299 0.05 YES
Monarch Debt Recovery Fund 2011 $444,300,000 $380,000,000 $0 3.55 1.17 $1,840,187 0.00 N/A
Oaktree Value Opportunities Fund, L.P. 2011 $168,919,000 $190,000,000 $0 1.83 1.08 $38,565,658 0.20 N/A
PAAMCO - Newport Burgundy 2010 $1,061,189,706 $950,000,000 $0 2.99 1.12 $0 - N/A
Providence Debt Fund III, L.P. 2013 $158,228,241 $200,000,000 $38,001,222 4.77 1.06 $14,328,089 0.09 YES
Saba Capital Partners 2011 $0 $150,000,000 $0 (7.05) 0.80 $119,737,014 0.80 N/A
Silverback Arbitrage Fund 2012 $143,593,385 $155,000,000 $0 (1.99) 0.93 $0 - N/A
Varde Fund X 2011 $107,553,500 $100,000,000 $0 11.98 1.64 $54,801,628 0.55 N/A
WLR IV PPIP Co-Invest 2010 $39,070,243 $150,000,000 $4,305,452 16.19 1.40 $166,256,817 1.14 YES
Total $5,259,504,719 $6,675,724,665 $467,710,784 5.16 1.17 $2,049,895,583 0.33
Methodology and Notes:
- Returns are calculated using the Internal Rate of Return (IRR) methodology. The IRR is the discount rate where the sum of the discounted cash flows and the discounted valuation is
equal to zero. Returns are reported net of fees.
- Total Value to Paid-In (TVPI), also know as the Investment Multiple, is the ratio of cumulative distributions plus the valuation to cumulative paid-in.
- Distributions to Paid-In (DPI), also know as the Realization Multiple, is the ratio of cumulative distributions to cumulative paid-in.
- The advisory board column is an indication of NCRS participation on the Fund's advisory board, N/A indicates that the Fund has no advisory board.

NCRS Inflation Protection Portfolio
June 30, 2016
Fund Vintage Market Value Commitment Unfunded IRR TVPI Distribution DPI Advisory Board
ArcLight Energy Partners Fund V, L.P. 2011 $43,468,736 $100,000,000 $14,907,265 (4.75) 0.91 $33,911,946 0.40 YES
ArcLight Shore Co-Investments Holdings II, LLC 2013 $1 $10,000,000 $1,513,040 8.39 1.11 $9,868,585 1.11 N/A
BlackRock TIPS Index 2015 $205,163,292 $500,000,000 $0 1.08 1.01 $300,000,000 0.60 N/A
Blackstone Energy Partners, LP 2012 $103,467,918 $100,000,000 $10,195,816 14.82 1.31 $17,591,825 0.18 YES
Blackstone Energy Partners II, L.P. 2014 $1,356,512 $100,000,000 $97,544,616 (99.57) 0.66 $0 - YES
Blackstone Granite Fund - Class A - Resources Select 2011 $305,174,854 $500,000,000 $0 (9.39) 0.61 $0 - N/A
Blackstone Granite Fund - Class B - Commodity Pod 2014 $189,876,172 $200,000,000 $0 (2.79) 0.95 $0 - N/A
Blackstone Granite Fund - Class C - Opportunistic Commodity 2014 $36,792,637 $100,000,000 $61,820,801 (7.38) 0.96 $0 - N/A
Blackstone Granite Fund - Class D - Bayview 2014 $185,766,916 $400,000,000 $215,338,904 0.37 1.00 $0 - N/A
Blackstone SP NCRASMA 2014 $156,572,623 $400,000,000 $278,146,450 30.86 1.35 $8,226,484 0.07 N/A
Blackstone SP NCRASMA (Overage) 2015 $48,088,488 $100,000,000 $55,982,919 11.48 1.09 $26,926 0.00 N/A
Brookfield Infrastructure Fund II-B, L.P. 2013 $161,136,122 $200,000,000 $45,515,102 7.84 1.12 $12,472,189 0.08 YES
Campbell Timber Fund III, LLC 2006 $455,148,437 $537,000,000 $0 (1.89) 0.85 $0 - YES
Capital Dynamics US Solar Energy, LP 2012 $1,151,244 $25,000,000 $2,579,396 10.33 1.23 $26,960,094 1.18 YES
Credit Suisse Enhanced 2011 $32,744 $500,000,000 $0 (13.72) 0.53 $263,514,277 0.53 N/A
Denham Commodity Partners Fund VI LP 2012 $32,278,024 $75,000,000 $25,843,669 4.47 1.08 $20,737,611 0.42 NO
DCPF VI Oil and Gas Co-Inv Fund 2013 $36,853,010 $50,000,000 $16,347,576 9.84 1.10 $0 - YES
DL Blue Diamond Fund 2016 $300,307,465 $300,000,000 $0 0.10 1.00 $0 - N/A
EIF United States Power Fund IV, L.P. 2011 $61,528,750 $75,000,000 $22,795,201 10.65 1.30 $6,206,467 0.12 YES
EIG Energy Fund XVI, L.P. 2013 $77,397,044 $250,000,000 $148,805,636 (13.00) 0.84 $3,158,287 0.03 YES
EnCap Energy Capital Fund VIII Co-Investors, L.P. 2011 $9,204,675 $29,814,882 $1,198,486 (20.96) 0.62 $2,376,086 0.08 N/A
EnCap Energy Capital Fund VIII, LP 2011 $18,163,436 $50,000,000 $7,988,399 (6.87) 0.84 $12,010,001 0.28 NO
EnCap Energy Capital Fund X, L.P. 2015 $23,126,400 $123,000,000 $96,793,539 (22.71) 0.91 $0 - YES
Energy Capital Partners II (Summit Co-Invest), LP 2011 $23,430,109 $28,220,824 $1,343,241 5.96 1.21 $8,960,301 0.33 N/A
Energy Capital Partners II, LP 2010 $18,918,720 $50,000,000 $16,012,020 9.27 1.37 $28,943,818 0.83 YES
Energy Capital Partners III, LP 2014 $24,354,251 $100,000,000 $72,780,014 (7.23) 0.89 $0 - YES
Gresham TAP Flex 2010 $367,178,148 $800,000,000 $0 (10.69) 0.56 $100,000,000 0.13 N/A
GSO Bakken Holdings I LP 2013 $12,904,675 $15,000,000 $2,983,088 6.57 1.17 $1,505,704 0.12 N/A
GSO Energy Partners - B LP 2013 $24,315,899 $100,000,000 $64,584,046 (20.43) 0.69 $0 - N/A
GSO Foreland Resources Co-Invest LP 2012 $0 $15,000,000 $0 27.95 1.31 $15,645,719 1.32 N/A
IFM Global Infrastructure Fund, L.P. 2013 $318,085,116 $300,000,000 $0 7.65 1.09 $3,991,747 0.01 YES
Intervale Capital II, LP 2012 $10,918,634 $40,000,000 $2,833,814 (43.01) 0.31 $789,234 0.02 YES
Intervale Capital III, LP 2014 $13,899,592 $60,000,000 $35,012,657 (40.52) 0.56 $0 - YES
Jade Real Assets Fund, L.P. 2014 $64,351,422 $150,000,000 $86,771,897 6.57 1.11 $5,713,182 0.09 N/A
Landmark Real Asset SMA, L.P. 2014 $30,168,725 $250,000,000 $216,483,550 (12.69) 0.96 $2,096,145 0.06 N/A
Landmark Real Estate Partners VII, L.P. 2014 $52,200,460 $100,000,000 $45,387,135 27.73 1.16 $11,386,848 0.21 NO
Lindsay Goldberg III - Formation Energy L.P. 2013 $3,013,258 $10,000,000 $4,562,076 (20.52) 0.55 $0 - N/A
MTP Energy Fund LP 2013 $231,266,643 $250,000,000 $0 (2.30) 0.94 $0 - N/A
MTP Energy Opportunities Fund LP 2013 $36,063,042 $75,000,000 $23,147,891 (8.81) 0.84 $7,239,089 0.14 YES
MTP Energy Opportunities Fund II LLC 2015 $70,844,523 $250,000,000 $170,361,438 4.16 1.03 $1,497,964 0.02 YES
North Star Investment Co-Invest 2013 $154,602,751 $200,000,000 $50,738,046 5.39 1.11 $12,013,683 0.08 N/A
North Star Investment Holdings LLC 2012 $179,691,937 $200,000,000 $16,562,554 3.14 1.07 $16,287,796 0.09 N/A
Perella Weinberg Partners ABV Opportunity Fund III LP 2011 $146,663,957 $150,000,000 $3,619,405 9.06 1.30 $48,417,770 0.32 YES
Quintana Energy I Co-Investment 2007 $194,366 $75,000,000 $52,884,689 12.99 1.64 $36,048,376 1.63 YES
Quintana Energy I, L.P. 2006 $31,858,046 $100,000,000 $802,752 (1.86) 0.91 $57,095,245 0.58 YES
Quintana Energy II Co-Invest 2008 $0 $75,000,000 $0 - - $0 - N/A
Quintana Energy Partners II, L.P. 2008 $14,267,704 $86,208,333 $1,749,324 (2.25) 0.97 $67,299,609 0.80 YES
Orion Mine Finance Fund I 2012 $64,524,148 $75,000,000 $6,782,239 1.01 1.02 $5,084,996 0.07 YES
Orion Mine Finance Fund I-A 2014 $111,145,551 $125,000,000 $18,401,550 5.35 1.05 $778,575 0.01 YES
RMK Emerging Growth Timberland Fund 1993 $0 $15,000,000 $0 9.38 2.92 $44,071,503 2.92 N/A
Sheridan Production Partners I, L.P. 2007 $42,636,000 $100,000,000 $0 5.43 1.25 $82,750,000 0.83 YES
Sheridan Production Partners II, L.P. 2010 $39,638,000 $165,000,000 $0 (32.47) 0.31 $11,550,000 0.07 YES
Timber Investment Resources (Nahele, LLC) Separate 2006 $261,549,868 $200,000,000 $0 3.23 1.34 $11,970,074 0.06 YES
Varde Fund XI, L.P. 2015 $391,716,090 $350,000,000 $0 8.07 1.13 $0 - YES
Vermillion Celadon 2011 $0 $300,000,000 $0 (13.42) 0.76 $228,351,957 0.76 N/A
Total $5,192,457,132 $9,534,244,039 $1,997,120,241 (3.34) 0.90 $1,526,550,113 0.20
Methodology and Notes:
- Returns are calculated using the Internal Rate of Return (IRR) methodology. The IRR is the discount rate where the sum of the discounted cash flows and the discounted valuation is equal to
zero. Returns are reported net of fees.
- Total Value to Paid-In (TVPI), also know as the Investment Multiple, is the ratio of cumulative distributions plus the valuation to cumulative paid-in.
- Distributions to Paid-In (DPI), also know as the Realization Multiple, is the ratio of cumulative distributions to cumulative paid-in.
- The advisory board column is an indication of NCRS participation on the Fund's advisory board, N/A indicates that the Fund has no advisory board.

Multi-Strategy Portfolio
June 30, 2016
Fund Inception Market Value 1 Yr 3 Yr 5 Yr 10 Yr 15 Yr
AG Cataloochee, L.P. 2016 $95,280,995 - - - - -
BlackRock - Cars 2002 $1,385,077 (2.5) (11.5) (10.1) (5.2) -
Broyhill Fund 2002 $746,310 (71.4) (37.0) (39.1) (24.0) -
GCM/NC Invest Fund 2011 Series 2011 $126,023 (24.9) (35.0) (27.5) - -
Gladius Aconcagua 2011 $1,398,614,970 (0.8) 7.0 - - -
Franklin Street Partners 2002 $120,003,499 (7.5) 0.1 0.9 1.8 -
SCS Instl Global Series I 2008 $1,166,577 (7.7) 2.6 0.8 - -
Multi-Strategy Composite $1,617,323,452 (1.5) 5.9 8.5 5.0 -
Benchmark (3.3) 4.7 6.6 5.7 -
Methodology and Notes:
Returns
-Returns are calculated using a Modified Dietz time weighted rate of return methodology. This method uses the beginning and ending
valuation for the measurement period, and weights each cash flow by the amount of time it is invested. Returns are reported net of fees.
- The Multi-Strategy Benchmark is comprised of a dynamically weighted combination of the HFRX ED: Multi-Strategy Index, net of fees, and
the market value weighted benchmarks for any other total fund strategies within the Portfolio.

Section 2 – Fee Supplement

Management Fees Incentive Fees Total Portfolio MVPublic Equity 83,697,806$ -$ 83,697,806$ 37,256,098,008$ Private Equity 59,567,017$ 44,525,168$ 104,092,185$ 4,375,776,820$ Real Estate 78,563,876$ 43,819,017$ 122,382,893$ 8,353,122,405$ Multi-Strategy 3,462,253$ 181,115$ 3,643,368$ 1,617,323,452$ Opportunistic Fixed Income 53,409,769$ 11,115,765$ 64,525,533$ 5,259,504,719$ Inflation 47,587,522$ 832,395$ 48,419,917$ 5,192,457,132$
Total 326,288,243$ 100,473,460$ 426,761,703$ 62,054,282,535$
June 2016 Pension MV 87,570,082,682$
Fees as % of plan 0.373% 0.115% 0.487%
Notes:
Total External Fees Paid Fiscal Year 2016
- Total management fees and incentive fees may differ between previous reports due to accrual and data collection timing issues related to the State of North Carolina's financial reporting deadlines. This may include accruals of management fees owed but not paid at year end or
the timing difference between the actual charge and the booking of actual costs that occurs in certain other investments.
- Consistent with industry convention, cost figures do not include the fees and expenses of investment managers that are held within fund-of-fund vehicles. Such fees and expenses have been deducted from all reported investment returns.
- Fees reported for private equity, real estate, hedge funds, credit, and inflation were aggregated using information provided by each external investment manager. Each manager was requested to provide management fee and incentive compensation collected from NCRS on a cash
accounting basis, however some managers provide fee information only on an accrual basis.

Public EquityFY 2015 - 2016
FIS Group 157,942,982$ 1,006,224$ -$ 1,006,224$ Franklin Templeton Int'l Small Cap 461,410,247$ 3,031,874$ -$ 3,031,874$ GMO International 954,069,292$ 4,139,523$ -$ 4,139,523$ Mondrian Int'l Small Cap 439,297,594$ 2,951,925$ -$ 2,951,925$ Walter Scott International 1,384,009,451$ 4,702,604$ -$ 4,702,604$ Wellingtion International 988,630,708$ 2,531,716$ -$ 2,531,716$
18,363,866$ BlackRock MSCI ACWI ex US IMI 5,676,848,785$ 1,486,933$ -$ 1,486,933$ BlackRock MSCI ACWI ex US SC Index -$ -$ -$
1,486,933$ Baillie Gifford EAFE 1,390,805,716$ 4,291,716$ -$ 4,291,716$ Mondrian EAFE Value 1,192,661,600$ 2,896,187$ -$ 2,896,187$ Oechsle EAFE Growth 2,571,874$ 707,044$ -$ 707,044$
7,894,947$ BlackRock EAFE LC Growth 659,307,591$ 13,906$ -$ 13,906$
13,906$ Baillie Gifford Emerging 465,996,293$ 2,789,378$ -$ 2,789,378$ BlackRock Frontier Markets 180,306,585$ 1,310,936$ -$ 1,310,936$ BlackRock Emerging Markets 529,844,399$ 2,988,592$ -$ 2,988,592$ Mondrian Emerging 345,325,592$ 2,241,836$ -$ 2,241,836$ Wasatch EM SC 187,046,219$ 1,846,838$ -$ 1,846,838$
11,177,580$ Brandes Global Equity 929,737,160$ 3,554,058$ -$ 3,554,058$ Longview Global Equity 1,509,652,737$ 6,904,812$ -$ 6,904,812$
10,458,870$ ECM Feeder Fund 2 125,220,397$ 883,424$ -$ 883,424$ Old North State Hedge Fund 2,493,376,809$ 2,975,166$ -$ 2,975,166$
3,858,590$ Hotchkis & Wiley Large Cap Value 772,741,580$ 4,051,449$ -$ 4,051,449$ Leading Edge 205,111,713$ 1,162,491$ -$ 1,162,491$ Piedmont Strategic Core 461,605,608$ 983,936$ -$ 983,936$ Relational Investors 3,754,742$ 1,384,680$ -$ 1,384,680$
Fund Name Incentive Fees Market Value Total FeesManagement Fees

Public EquityFY 2015 - 2016
Sands Large Cap Growth 486,091,492$ 2,844,017$ -$ 2,844,017$ Wellingtion Large Cap Value 692,772,532$ 1,920,355$ -$ 1,920,355$ Wellington Opportunistic Growth 1,036,289,538$ 3,568,783$ -$ 3,568,783$
15,915,711$ BlackRock Russell 1000 6,991,566,238$ 459,913$ -$ 459,913$ Piedmont R200 3,297,156,391$ 317,285$ -$ 317,285$ RhumbLine R200 -$ -$ -$ -$
777,198$ ValueAct Capital 344,782,059$ 872,919$ -$ 872,919$
872,919$ BlackRock Midcap 321,908,170$ 29,906$ -$ 29,906$
29,906$ TimesSquare Mid Cap Focused 217,918,989$ 1,806,538$ -$ 1,806,538$ TimesSquare Mid Cap Growth 486,934,481$ 2,600,587$ -$ 2,600,587$ Wellington Mid Cap Opportunities 45,956$ 520,931$ -$ 520,931$
4,928,057$ Brown Advisory Small Cap Growth 227,129,919$ 1,225,618$ -$ 1,225,618$ Earnest Small Cap 397,728,022$ 2,011,204$ -$ 2,011,204$ Numeric Small Cap Growth 323,328,744$ 2,282,055$ -$ 2,282,055$ Numeric Small Cap Value 357,209,876$ 2,400,446$ -$ 2,400,446$
7,919,323$ BlackRock Global Transition 557,359,363$ Cash and Liquidating Accounts 506,309$ Total 37,256,003,752$ 83,697,806$ -$ 83,697,806$

Private EquityFY 2015 - 2016
A.M. Pappas Life Science Ventures II, L.P. 109,354$ -$ -$ -$ A.M. Pappas Life Science Ventures III, L.P. 5,524,173$ 13,208$ -$ 13,208$ A.M. Pappas Life Science Ventures IV, L.P. 11,134,581$ 489,131$ 1,124,201$ 1,613,332$ A.V. Management IV, LLC 1,230,838$ -$ -$ -$ Accel-KKR Capital Partners IV, LP 5,520,814$ 17,234$ -$ 17,234$ Access Capital L.P. II D 112,870$ 75,312$ -$ 75,312$ AG Private Equity Partners IV (R), L.P. 34,309,201$ 300,939$ -$ 300,939$ AG Private Equity Partners IV, L.P. 37,381,901$ 461,337$ -$ 461,337$ Ampersand 2006 Limited Partnership 22,190,619$ 213,690$ 1,393,187$ 1,606,877$ Angeleno Investors II, L.P. 19,047,384$ 526,891$ -$ 526,891$ Apollo Investment Fund VIII, L.P. 96,064,836$ 1,301,595$ -$ 1,301,595$ ARCH Venture Fund IX, L.P. -$ -$ ARCH Venture Fund VII, L.P. 86,100,040$ 392,962$ 5,588,035$ 5,980,997$ ARCH Venture Fund VIII, L.P. 61,111,335$ 1,571,200$ -$ 1,571,200$ Aurora Ventures IV, LLC 3,123,123$ -$ -$ -$ Aurora Ventures V, LLC 11,988,365$ 38,360$ -$ 38,360$ Avista Capital Partners II, L.P. 81,498,275$ -$ 4,547,781$ 4,547,781$ Avista Capital Partners III, L.P. 160,930,997$ -$ -$ -$ Avista Capital Partners I, L.P. 23,859,430$ 119,843$ (104,265)$ 15,578$ Burrill Life Sciences Capital Fund III, L.P. 17,719,188$ 355,999$ -$ 355,999$ Burrill Life Sciences Capital Fund, L.P. $0 -$ -$ -$ Carousel Capital Partners III, L.P. 3,202,271$ -$ 512,916$ 512,916$ Carousel Capital Partners IV, L.P. 21,347,537$ 263,721$ -$ 263,721$ Castle Harlan Partners IV, L.P. 8,945,367$ -$ -$ -$ Castle Harlan Partners V, L.P. 50,823,652$ -$ -$ -$ Catterton Growth Partners II, L.P. 87,904,580$ 1,194,877$ -$ 1,194,877$ Catterton Growth Partners, L.P. 33,276,707$ 335,808$ -$ 335,808$ Catterton Partners VII, L.P. 91,635,515$ 1,756,797$ -$ 1,756,797$ Chapter IV Investors Special Situations Fund, L.P. 52,656,551$ 273,568$ -$ 273,568$ Charterhouse Capital Partners IX, L.P. 40,012,045$ 642,411$ -$ 642,411$ Charterhouse Capital Partners X, L.P. 1,156,402$ -$ 1,156,402$ Coller International Partners IV, L.P. 3,724,629$ -$ 269,378$ 269,378$ Crestview Partners II, L.P. 68,690,740$ 490,952$ 623,735$ 1,114,687$ Crestview Capital Partners III, L.P. 32,721,942$ (160,070)$ -$ (160,070)$ CVC Capital Partners VI, L.P. 27,434,269$ 1,098,444$ -$ 1,098,444$
Total FeesNet Management Fees Incentive FeeFund Name Market Value

Private EquityFY 2015 - 2016
CVC Europe Equity Partners IV, L.P. 16,568,972$ -$ 126,443$ 126,443$ CVE Kauffman Fund I 58,315,163$ 386,712$ -$ 386,712$ DLJ Merchant Banking Partners II, L.P. -$ -$ -$ -$ Elevation Partners, L.P. 1,708,029$ 14,495$ 235,762$ 250,257$ Francisco Partners II, L.P. 19,074,616$ 302,847$ 533,878$ 836,725$ Francisco Partners IV, L.P. 34,273,164$ 1,003,953$ -$ 1,003,953$ Franklin Fairview I, L.P. 540,338$ -$ -$ -$ GCM Grosvenor - NC Innovation Fund 2010 152,128,016$ 583,570$ 4,763,249$ 5,346,819$ GCM Grosvenor - NC Innovation Fund 2013-1 12,789,158$ 37,500$ -$ 37,500$ GCM Grosvenor - NC Investment Fund 2006 118,532,750$ 1,066,338$ -$ 1,066,338$ GCM Grosvenor - NC Investment Fund 2008 Series 1 108,627,829$ 934,863$ -$ 934,863$ GCM Grosvenor - NC Investment Fund 2008 Series 2 38,970,307$ 933,881$ -$ 933,881$ GCM Grosvenor - NC Innovation Fund II 24,540,663$ 1,856,250$ -$ 1,856,250$ Halifax Capital Partners II, L.P. 5,845,311$ -$ 326,913$ 326,913$ Halifax Capital Partners III, L.P. 21,295,165$ 526,530$ 884,331$ 1,410,861$ Harvest Partners IV, L.P. 3,380,076$ -$ -$ -$ Harvest Partners V, L.P. 27,080,392$ -$ 47,072$ 47,072$ Harvest Partners VI, L.P. 94,926,587$ -$ 2,550,470$ 2,550,470$ Harvest Partners VII, L.P. -$ 148,162$ -$ 148,162$ Hatteras Venture Partners III, L.P. 15,597,987$ 107,468$ -$ 107,468$ Hg Capital 7 64,348,023$ 1,623,212$ -$ 1,623,212$ Highland Capital Partners VI, L.P. 802,873$ -$ -$ -$ Highland Capital Partners VII, L.P. 7,055,720$ 252,541$ -$ 252,541$ Highland Consumer Fund I, L.P. 11,353,608$ 442,998$ -$ 442,998$ Horsley Bridge International IV, L.P. 61,103,084$ 512,500$ -$ 512,500$ Horsley Bridge International V, L.P. 86,259,898$ 562,500$ -$ 562,500$ Horsley Bridge IX, L.P. 117,203,469$ 612,500$ -$ 612,500$ Intersouth Partners III, L.P. -$ -$ -$ -$ Intersouth Partners VI, L.P. 4,494,023$ 8,183$ -$ 8,183$ KRG Capital Fund II, L.P. 1,165,021$ 13,186$ -$ 13,186$ KRG Capital Fund III, L.P. 245,105$ (9,985)$ -$ (9,985)$ KRG Capital Fund IV, L.P. 70,311,255$ 883,093$ 3,746,868$ 4,629,962$ L Catterton Growth Partners III, L.P. (7,610)$ 634,615$ -$ 634,615$ Landmark XV 86,455,913$ 1,950,000$ -$ 1,950,000$ Levine Leichtman Capital Partners V 114,105,186$ 1,934,079$ -$ 1,934,079$ Lexington Middle Market Investors II, L.P. 62,391,776$ 464,637$ 234,192$ 698,829$ Lexington Middle Market Investors III, L.P. 53,548,941$ 1,215,685$ -$ 1,215,685$ Lexington Middle Market Investors, L.P. 32,160,190$ 255,858$ 1,413,846$ 1,669,704$ Lindsay Goldberg II, L.P. 21,410,048$ 287,023$ -$ 287,023$

Private EquityFY 2015 - 2016
Lindsay Goldberg III, LP 57,505,817$ 484,509$ -$ 484,509$ Longreach Capital Partners 1, L.P. 44,399,335$ -$ -$ -$ Markstone Capital Partners, L.P. 2,444,909$ -$ -$ -$ Marlin Equity IV 20,892,404$ 504,397$ -$ 504,397$ MatlinPatterson Global Opportunities Partners III, 62,104,524$ 645,981$ -$ 645,981$ MHR Institutional Partners IV LP 20,723,211$ 3,649,627$ -$ 3,649,627$ Milestone Partners IV, L.P. 47,526,476$ 551,807$ -$ 551,807$ Mount Kellett Capital Partners II, LP 25,118,494$ 696,917$ -$ 696,917$ NEA 15 Opportunity Fund, LP 18,349,905$ -$ -$ -$ NEA 14, L.P. 56,058,063$ 332,111$ -$ 332,111$ NEA 15, L.P. 25,151,883$ 645,027$ -$ 645,027$ North Carolina Economic Opportunities Fund -$ -$ -$ -$ Northbound NCRS Fund L.P. 16,606,090$ 911,095$ -$ 911,095$ Novak Biddle Venture Partners III, L.P. 851,854$ -$ -$ -$ Novak Biddle Venture Partners IV, L.P. 3,127,922$ 26,628$ -$ 26,628$ Novak Biddle Venture Partners V, L.P. 7,697,185$ 88,395$ -$ 88,395$ Oaktree European Principal Fund III, L.P. 42,352,252$ 625,490$ 714,384$ 1,339,875$ Quaker BioVentures II, L.P. 54,833,448$ 988,574$ -$ 988,574$ Robeco Clean Tech II Co-Inv 26,410,843$ 901,056$ -$ 901,056$ Robeco Clean Tech II 64,120,926$ 647,500$ -$ 647,500$ Starvest Partners II 25,490,039$ 238,130$ -$ 238,130$ StepStone Pioneer Capital Europe 80,763,077$ 363,830$ 399,479$ 763,308$ StepStone Pioneer Capital I 54,897,674$ 270,435$ -$ 270,435$ StepStone Pioneer Capital II 100,801,870$ 394,762$ 447,835$ 842,597$ StepStone SYN 23,047,550$ 147,176$ -$ 147,176$ Synergy Life Science Partners, L.P. 21,310,913$ 349,463$ -$ 349,463$ TCV VIII, L.P. 97,415,236$ 2,163,750$ 30,375$ 2,194,125$ TCV VI, L.P. 7,740,375$ 37,026$ 278,572$ 315,598$ Tenaya Capital Fund V 45,298,239$ 861,590$ 522,588$ 1,384,178$ Tenaya Capital Fund VI 60,034,412$ 1,500,000$ -$ 1,500,000$ Tenaya Capital Fund VII 18,056,009$ 1,760,000$ -$ 1,760,000$ Terra Firma Capital Partners II, LP. 58,893,387$ -$ 11,356,934$ 11,356,934$ Terra Firma Capital Partners III, L.P. 88,523,588$ 2,223,905$ -$ 2,223,905$ Thoma Bravo XII, L.P. 7,431,158$ 735,577$ -$ 735,577$ TPG Biotechnology Partners II, L.P. 6,061,920$ 17,531$ -$ 17,531$ TPG Biotechnology Partners III, L.P. 37,400,962$ 307,183$ 980,581$ 1,287,764$ Tudor Ventures III, L.P. 15,980,899$ 265,723$ -$ 265,723$ Vista Equity Partners Fund IV, L.P. 62,212,817$ 732,697$ -$ 732,697$ Warburg Pincus Private Equity XI, L.P. 145,525,013$ 1,321,007$ 120,000$ 1,441,007$

Private EquityFY 2015 - 2016
Warburg Pincus Private Equity XII, L.P. 9,238,040$ 1,330,719$ -$ 1,330,719$ WLR AHM Co-Inv, L.P. -$ -$ -$ -$ WLR Recovery Fund IV, L.P. 40,238,940$ 371,595$ 856,428$ 1,228,023$ Stock Distribution 23,204,986$ Total 4,375,776,820$ 59,567,017$ 44,525,168$ 104,092,185$

Real EstateFY 2015 - 2016
BR Emerging REIT $54,423,934.53 $52,221 $0 $52,221BlackRock World REIT $248,163,144.64 $244,427 $0 $244,427BlackRock Developed REIT $341,736,974.46 $37,855 $0 $37,855AG Asia Realty Fund II, L.P. $9,621,130.00 $205,690 $0 $205,690AG Core Plus Realty Fund II, L.P. $6,937,648.00 $125,705 $1,588,778 $1,714,483AG Core Plus Realty Fund I, L.P. $352,105.00 $0 $0 $0AG Net Lease Realty Fund II, L.P. $97,698,409.00 $2,010,783 $0 $2,010,783AG Net Lease Realty Fund III, L.P. $35,980,275.00 $660,355 $0 $660,355American Value Partners Fund I, L.P. $12,143,658.00 $333,888 $0 $333,888Benson Elliot Real Estate Partners II, L.P. $11,977,444.13 $138,849 $0 $138,849Benson Elliot Real Estate Partners III, L.P. $35,479,145.89 $696,555 $418,144 $1,114,699Blackstone NC Property Partners L.P. $192,396,840.00 $856,304 $0 $856,304Blackstone Property Partners L.P. $338,601,117.00 $2,087,958 $0 $2,087,958Blackstone Real Estate Partners Europe IV, L.P. $178,083,759.29 $3,319,267 $1,178,408 $4,497,676Blackstone Real Estate Partners Europe V, L.P. $0 $0 $0Blackstone Real Estate Partners V, L.P. $56,650,550.00 $0 $3,758,826 $3,758,826Blackstone Real Estate Partners VI, L.P. $115,210,764.00 $1,028,665 $3,905,000 $4,933,665Blackstone Real Estate Partners VII, L.P. $302,791,738.00 $2,807,549 $4,335,677 $7,143,226Blackstone Real Estate Partners VIII, L.P. $77,485,601.00 $1,500,000 $9,392 $1,509,392BREP Edens Investment Partners L.P. $475,561,185.00 $3,184,040 $0 $3,184,040Brookfield Real Estate Finance Fund III, L.P. $21,615,809.00 $294,736 $0 $294,736CB Richard Ellis Strategic Partners US IV, L.P. $8,569,543.73 $0 $0 $0CB Richard Ellis Strategic Partners US V, L.P. $66,694,720.07 $578,649 $0 $578,649Cherokee Investment Partners III, L.P. $1,451,987.00 $0 $0 $0Cherokee Investment Partners IV, L.P. $15,926,446.00 $238,699 $0 $238,699CIGNA Realty Investors Open-End Fund $0.00 $0 $0 $0CIM Urban REIT, LLC $122,111,104.00 $0 $0 $0CrossHarbor Institutional Partners II, L.P. $59,565,787.35 $794,886 $4,043,230 $4,838,116CrossHarbor Institutional Partners, L.P. $7,051,004.01 $228,645 $0 $228,645Crow Holdings Realty Partners IV, L.P. $13,372,909.00 $293,575 $0 $293,575Crow Holdings Realty Partners IV-A, L.P. $3,267,643.00 $73,393 $0 $73,393Crow Holdings Realty Partners V, L.P. $16,099,789.00 $365,251 $0 $365,251Crow Holdings Realty Partners VI, L.P. $67,973,938.00 $837,769 $0 $837,769Crow Holdings Realty Partners VII, L.P. $42,159,574.00 $1,793,750 $0 $1,793,750DB Real Estate Global Opps I-A/I-B, L.P. $618,275.00 $0 $30,948 $30,948DLJ Real Estate Capital Partners II, L.P. $0.00 $0 $0 $0DLJ Real Estate Capital Partners III, L.P. $89,089,430.00 $836,279 $0 $836,279DLJ Real Estate Capital Partners IV, L.P. $81,680,075.00 $841,636 $0 $841,636DRA Growth & Income Fund IV, LLC $0 $0 $3,063 $3,063DRA Growth & Income Fund V, LLC $28,132,797.00 $629,033 $0 $629,033
Net Management FeesFund Name Incentive Fees Total Fees Market Value

Real EstateFY 2015 - 2016
Net Management FeesFund Name Incentive Fees Total Fees Market Value
DRA Growth & Income Fund V Co-Investment, LLC $392,631.00 $0 $35,352 $35,352DRA Growth & Income Fund VI, LLC $11,636,583.00 $197,136 $0 $197,136DRA Growth & Income Fund VII, LLC $147,228,902.00 $2,438,835 $0 $2,438,835DRA Growth & Income Fund VIII, LLC $128,118,171.00 $2,071,053 $0 $2,071,053Frogmore Real Estate Partners II, L.P. $8,917,387.82 $166,259 $0 $166,259Frogmore Real Estate Partners I, L.P. $18,800,755.20 $147,903 $0 $147,903Frogmore Real Estate Partners III, L.P. $19,126,193.26 $1,078,846 $0 $1,078,846Harrison St. RE Partners III, L.P. $23,677,093.00 $383,417 $1,031,140 $1,414,557Harrison St. RE Partners IV, L.P. $78,116,935.00 $1,261,391 $0 $1,261,391Harrison St. RE Partners V, L.P. $46,342,713.00 $1,500,000 $0 $1,500,000HSREP V Co-Investment, L.P. $35,646,072.00 $217,210 $0 $217,210JER Real Estate Partners Fund III, L.P. $808,544.00 $0 $0 $0JER Real Estate Partners IV, L.P. $0 $0 $0 $0JP Morgan Strategic Property Fund $577,188,291.10 $4,865,201 $0 $4,865,201Keystone Industrial Fund I, L.P. $437,065.00 $0 $0 $0Keystone Industrial Fund II, L.P. $610,335.00 $0 $396,224 $396,224Keystone Industrial Fund III, L.P. $207,780.00 $0 $350,884 $350,884LaSalle Real Estate Debt Strategies II, L.P. $47,127,363.74 $596,119 $0 $596,119LBA NC Core Industrial L.P. $69,306,930.69 $750,000 $0 $750,000LEM Real Estate Mezzanine Fund II, L.P. $5,842,177.95 $111,766 $0 $111,766Lone Star Real Estate Partners II $62,079,751.29 $162,628 $6,415,368 $6,577,996M&G Real Estate Debt Fund III $24,859,945.03 $210,684 $0 $210,684Meadow Core Plus Real Estate Fund $184,022,076.07 $1,595,717 $0 $1,595,717Meadow Real Estate Fund II, L.P. $39,854,321.16 $425,617 $0 $425,617Meadow Real Estate Fund III, L.P. $94,303,887.52 $1,250,000 $0 $1,250,000Mesa West Real Estate Income Fund III, L.P. $76,139,950.00 $1,221,023 $0 $1,221,023MS Global RE Securities $66,767.99 $1,554,107 $0 $1,554,107Morgan Stanley Real Estate Fund V International $5,306,189.00 $53,678 $0 $53,678Morgan Stanley Real Estate Fund VI, L.P. $58,028,675.00 $265,423 $0 $265,423NorthCreek Fund, L.P. $352,706,641.63 $512,500 $0 $512,500NorthRock Core Fund, L.P. $794,469,272.91 $5,576,650 $0 $5,576,650NorthRock Fund II, L.P. $492,738,643.94 $1,800,000 $0 $1,800,000NorthRock Fund III, L.P. $58,912,505.09 $1,800,000 $0 $1,800,000NorthRock Fund IV, L.P. $49,751,250.00 $56,831 $0 $56,831Paladin Latin American Partners III, L.P. $17,840,092.00 $614,944 $0 $614,944Patria Brazil Real Estate Fund II $22,458,948.65 $267,714 $0 $267,714Penwood CSIP I, L.P. $21,162,379.00 $0 $0 $0Penwood PSIP II, L.P. $31,607,953.00 $230,111 $1,194,389 $1,424,500Prudential Property Investment Separate Account $149,086,131.84 $997,292 $315,124 $1,312,416Rockpoint Core Plus Real Estate Fund I, L.P. $151,044,230.00 $1,392,898 $0 $1,392,898

Real EstateFY 2015 - 2016
Net Management FeesFund Name Incentive Fees Total Fees Market Value
Rockpoint Core Plus Fund I Co-Invest , L.P. $124,976,789.00 $740,921 $0 $740,921Rockpoint Real Estate Fund I, L.P. $337,765.00 $0 $0 $0Rockpoint Real Estate Fund II, L.P. $25,878,742.00 $161,351 $0 $161,351Rockpoint Real Estate Fund III, L.P. $10,560,185.00 $215,311 $1,278,709 $1,494,020Rockpoint Real Estate Fund IV, L.P. $63,146,178.00 $721,711 $1,144,293 $1,866,004Rockpoint Real Estate Fund V, L.P. $10,389,580.00 $902,904 $0 $902,904Rockwood Capital Fund X Side Car $9,010,773.75 $21,080 $0 $21,080Rockwood Capital Real Estate Partners Fund IX CIV, L.P. $0 $0 $0Rockwood Capital Real Estate Partners Fund VI, L.P $30,816,926.92 $772,714 $0 $772,714Rockwood Capital Real Estate Partners Fund VII, L.P. $61,866,271.47 $1,497,500 $0 $1,497,500Rockwood Capital Real Estate Partners Fund VIII, L.P. $10,189,400.60 $460,673 $4,978,684 $5,439,357Rockwood Capital Real Estate Partners Fund X, L.P. -$461,989.49 $630,253 $0 $630,253Rockwood Capital Real Estate Partners Fund IX, L.P. $36,173,077.51 $685,000 $0 $685,000Rockpoint NYC CIP Investors, L.P. $22,513.00 $0 $238,652 $238,652RREEF Global Opportunities Fund II, LLC $2,986,687.00 $0 $0 $0Hawkeye (Scout) Fund 1-A, L.P. $1,548,310.92 $65,850 $1,204,186 $1,270,036Hawkeye (Scout) Fund II, L.P. -$4,949,645.00 $750,000 $0 $750,000Starwood SDL/SOF Co-Investment $12,479,056.00 $11,819 $0 $11,819Security Capital Focus Select $0.00 $166,334 $0 $166,334SRI Seven REIT $10,927,357.00 $191,840 $0 $191,840SRI Eight REIT $56,423,613.00 $887,848 $0 $887,848SRI Nine REIT $11,247,906.00 $317,898 $3,596,805 $3,914,703SRI Ten REIT $59,111,153.00 $860,215 $1,623,368 $2,483,583STAG Investments II, LLC $5,632,331.00 $192,720 $0 $192,720Starwood Opportunity Fund VII, L.P. $60,297,398.00 $818,369 $0 $818,369Terra Firma Deutsche Annington, L.P. (Non-Core) $0.00 $0 $0 $0UBS Trumbull Property Fund $304,048,833.90 $1,989,371 $744,373 $2,733,744UBS Trumbull Property Income Fund $164,521,611.49 $1,258,511 $0 $1,258,511Value Enhancement Fund II $323,512.94 $0 $0 $0Value Enhancement Fund IV, L.P. $0 $0 $0Warburg Pincus Real Estate I, L.P. $52,141,669.00 $179,166 $0 $179,166WCP Real Estate Fund III(A), L.P. $90,765,720.30 $1,195,156 $0 $1,195,156Westbrook Real Estate Fund IV, L.P. $0 $0 $0 $0BlackRock REIT Transition $62,879.87Total $8,353,122,396.16 $78,563,875.67 $43,819,017.15 $122,382,892.83

Multi-StrategyFY 2015 - 2016
AG Cataloochee (Great Balsam Series B) 95,280,995$ 157,438$ -$ 157,438$ Blackrock CARS 1,385,077$ -$ 73,941$ 73,941$ Broyhill All-Weather Fund 746,310$ 5,647$ -$ 5,647$ CS/NC Inv Fund Series 2011 126,023$ 25,000$ -$ 25,000$ Gladius Aconcagua 1,398,614,970$ 1,930,331$ -$ 1,930,331$ Franklin Street Multi-Strategy Fund 120,003,499$ 1,324,717$ 107,175$ 1,431,892$ SCS 1,166,577$ 19,120$ -$ 19,120$ Total 1,617,323,452$ 3,462,253$ 181,115$ 3,643,368$
Fund Name Market Value Incentive Fee Total FeesNet Management Fees

Opportunistic Fixed IncomeFY 2015 - 2016
AG Capital Recovery Partners V, L.P. 1,499,909$ -$ -$ -$ AG Capital Recovery Partners VI, L.P. 28,177,844$ 558,153$ -$ 558,153$ AG Commercial Real Estate Debt Fund, L.P. 11,082,988$ 103,845$ -$ 103,845$ AG Global Debt Strategy Partners, L.P. 445,215,446$ 1,526,108$ -$ 1,526,108$ AG Pisgah (Great Balsam - A) 309,096,140$ 460,134$ -$ 460,134$ Anchorage Capital Partners 476,289,967$ 6,643,685$ -$ 6,643,685$ Benefit Street Partners Capital Opportunity Fund, L.P. 140,241,003$ 560,898$ -$ 560,898$ Brigade LCS Fund 318,120,083$ 3,758,543$ -$ 3,758,543$ Brightwood Capital fund III, LP 69,094,637$ -$ -$ -$ Claren Road Credit Fund, Ltd. 48,621,831$ 1,243,928$ -$ 1,243,928$ Claren Road Credit Opportunities Partners, L.P. 89,447,729$ 2,611,573$ -$ 2,611,573$ CVI Credit Value Fund II 235,200,000$ 2,280,000$ 1,242,398$ 3,522,398$ CVI Credit Value Fund III 38,200,000$ 276,814$ 89,908$ 366,722$ CVI Credit Value Fund 116,900,000$ 1,781,249$ 2,500,023$ 4,281,272$ Fortress Credit Opportunities Fund III (A) 53,431,693$ 730,859$ -$ 730,859$ GSO Capital Opportunities Fund II, L.P. 52,370,295$ 898,865$ -$ 898,865$ GSO Capital Opportunities Fund 17,386,507$ 213,423$ 1,215,732$ 1,429,155$ GSO Capital Solutions Fund II, L.P. 27,088,847$ 500,262$ -$ 500,262$ Highbridge Irish Specialty Loan Fund III plc 131,826,038$ 2,052,069$ 897,522$ 2,949,591$ Magnetar Constellation Fund IV LLC 104,405,869$ 1,014,611$ -$ 1,014,611$ Marathon Currituck Fund, LP 404,393,721$ 3,209,378$ 42,012$ 3,251,390$ MCP Private Capital Fund II 18,560,096$ 997,150$ 524,650$ 1,521,801$ Monarch Debt Recovery Fund 444,300,000$ 6,713,040$ (1,475,536)$ 5,237,504$ PAAMCO - Newport Burgundy 1,061,189,706$ 7,971,718$ (212,401)$ 7,759,317$ Oaktree Value Opportunities Fund, L.P. 168,919,000$ 2,812,993$ -$ 2,812,993$ Providence Debt Fund III, L.P. 158,228,241$ 705,547$ -$ 705,547$ Silverback Arbitrage Fund 143,593,385$ 2,153,727$ -$ 2,153,727$ Varde Fund X 107,553,500$ 1,378,938$ 3,263,629$ 4,642,567$ WLR IV PPIP Co-Invest 39,070,243$ 252,259$ 3,027,827$ 3,280,086$ Total 5,259,504,719$ 53,409,769$ 11,115,765$ 64,525,533$
Net Management FeesFund Name Incentive Fee Total Fees Market Value
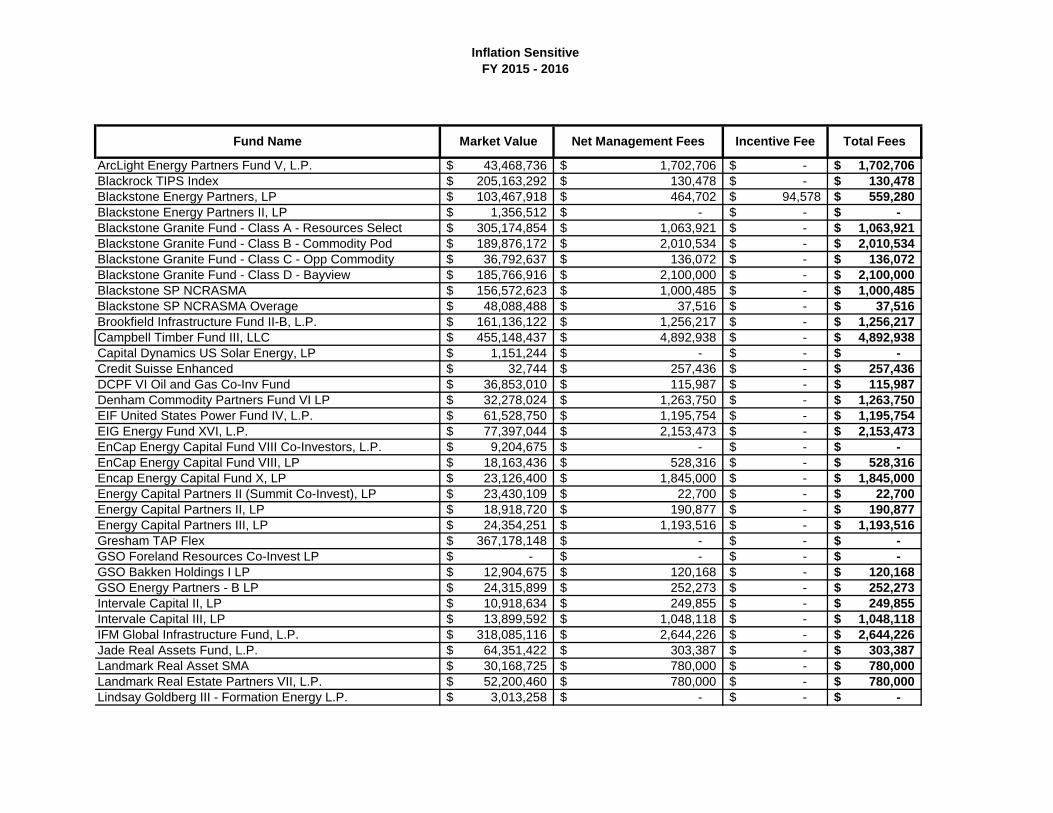
Inflation SensitiveFY 2015 - 2016
ArcLight Energy Partners Fund V, L.P. 43,468,736$ 1,702,706$ -$ 1,702,706$ Blackrock TIPS Index 205,163,292$ 130,478$ -$ 130,478$ Blackstone Energy Partners, LP 103,467,918$ 464,702$ 94,578$ 559,280$ Blackstone Energy Partners II, LP 1,356,512$ -$ -$ -$ Blackstone Granite Fund - Class A - Resources Select 305,174,854$ 1,063,921$ -$ 1,063,921$ Blackstone Granite Fund - Class B - Commodity Pod 189,876,172$ 2,010,534$ -$ 2,010,534$ Blackstone Granite Fund - Class C - Opp Commodity 36,792,637$ 136,072$ -$ 136,072$ Blackstone Granite Fund - Class D - Bayview 185,766,916$ 2,100,000$ -$ 2,100,000$ Blackstone SP NCRASMA 156,572,623$ 1,000,485$ -$ 1,000,485$ Blackstone SP NCRASMA Overage 48,088,488$ 37,516$ -$ 37,516$ Brookfield Infrastructure Fund II-B, L.P. 161,136,122$ 1,256,217$ -$ 1,256,217$ Campbell Timber Fund III, LLC 455,148,437$ 4,892,938$ -$ 4,892,938$ Capital Dynamics US Solar Energy, LP 1,151,244$ -$ -$ -$ Credit Suisse Enhanced 32,744$ 257,436$ -$ 257,436$ DCPF VI Oil and Gas Co-Inv Fund 36,853,010$ 115,987$ -$ 115,987$ Denham Commodity Partners Fund VI LP 32,278,024$ 1,263,750$ -$ 1,263,750$ EIF United States Power Fund IV, L.P. 61,528,750$ 1,195,754$ -$ 1,195,754$ EIG Energy Fund XVI, L.P. 77,397,044$ 2,153,473$ -$ 2,153,473$ EnCap Energy Capital Fund VIII Co-Investors, L.P. 9,204,675$ -$ -$ -$ EnCap Energy Capital Fund VIII, LP 18,163,436$ 528,316$ -$ 528,316$ Encap Energy Capital Fund X, LP 23,126,400$ 1,845,000$ -$ 1,845,000$ Energy Capital Partners II (Summit Co-Invest), LP 23,430,109$ 22,700$ -$ 22,700$ Energy Capital Partners II, LP 18,918,720$ 190,877$ -$ 190,877$ Energy Capital Partners III, LP 24,354,251$ 1,193,516$ -$ 1,193,516$ Gresham TAP Flex 367,178,148$ -$ -$ -$ GSO Foreland Resources Co-Invest LP -$ -$ -$ -$ GSO Bakken Holdings I LP 12,904,675$ 120,168$ -$ 120,168$ GSO Energy Partners - B LP 24,315,899$ 252,273$ -$ 252,273$ Intervale Capital II, LP 10,918,634$ 249,855$ -$ 249,855$ Intervale Capital III, LP 13,899,592$ 1,048,118$ -$ 1,048,118$ IFM Global Infrastructure Fund, L.P. 318,085,116$ 2,644,226$ -$ 2,644,226$ Jade Real Assets Fund, L.P. 64,351,422$ 303,387$ -$ 303,387$ Landmark Real Asset SMA 30,168,725$ 780,000$ -$ 780,000$ Landmark Real Estate Partners VII, L.P. 52,200,460$ 780,000$ -$ 780,000$ Lindsay Goldberg III - Formation Energy L.P. 3,013,258$ -$ -$ -$
Net Management FeesFund Name Incentive Fee Total Fees Market Value

Inflation SensitiveFY 2015 - 2016
MTP Energy Fund LP 231,266,643$ 2,824,071$ -$ 2,824,071$ MTP Energy Opportunities Fund LP 36,063,042$ -$ -$ -$ MTP Energy Opportunities Fund II LP 70,844,523$ -$ -$ -$ North Star Investment Holdings LLC 179,691,937$ 2,420,057$ -$ 2,420,057$ North Star Investment Co-Invest 154,602,751$ 378,032$ -$ 378,032$ Orion Mine Finance Fund I 64,524,148$ 969,956$ -$ 969,956$ Orion Mine Finance Fund I-A 111,145,551$ -$ -$ -$ Perella Weinberg Partners ABV Opportunity Fund III LP 146,663,957$ 1,687,652$ -$ 1,687,652$ Quintana Energy I Co-Investment 194,366$ -$ -$ -$ Quintana Energy Partners II, L.P. 14,267,704$ 395,406$ -$ 395,406$ Quintana Energy I, L.P. 31,858,046$ 1,112,927$ -$ 1,112,927$ Sheridan Production Partners I, L.P. 42,636,000$ 1,250,024$ -$ 1,250,024$ Sheridan Production Partners II, L.P. 39,638,000$ 829,019$ -$ 829,019$ Varde Fund XI, L.P. 391,716,090$ 3,751,132$ 737,817$ 4,488,949$ Timber Investment Resources (Nahele, LLC) Separate 261,549,868$ 2,146,750$ -$ 2,146,750$ DoubleLine Blue Diamond 300,307,465$ 82,090$ -$ 82,090$ Total 5,192,457,131$ 47,587,522$ 832,395$ 48,419,917$

Section 3 – Additional Information Requested by G.S. 147-69.12(b)
Portfolio Name Commitment amount Statutory classification Inception year Investment manager Management &
incentive fees
Fixed Income Portfolio
See Section 1 of this report
None N.C.G.S. §§ 147-69.1(c) and 147-69.2(b)(1)-(6b)
1941 Managed internally by staff of the State Treasurer
No management fees or incentive fees
Public Equity Portfolio
See Section 1 of this report
Fixed commitment amounts only for the following funds: ECM Feeder Fund 2 LP: $125 million. ValueAct Capital: $750 million. For all other funds, none.
N.C.G.S § 147-69.2(b)(8) for long-only public equity investments; N.C.G.S. § 147-69.2(b)(8)(b.) for the public equity limited liability investment vehicles Old North State Hedged Equity, ECM Feeder Fund 2 LP, and ValueAct Capital
See Section 1 of this report
Externally managed by firms listed in Section 1 of this report
See Section 2 of this report
Real Estate Portfolio
See Section 1 of this report
See Section 1 of this report
N.C.G.S. § 147-69.2(b)(7) See Section 1 of this report
Externally managed by firms listed in Section 1 of this report
See Section 2 of this report
Private Equity Portfolio
See Section 1 of this report
See Section 1 of this report
N.C.G.S. § 147-69.2(b)(9) See Section 1 of this report
Externally managed by firms listed in Section 1 of this report
See Section 2 of this report
Opportunistic Fixed Income Portfolio
See Section 1 of this report
See Section 1 of this report
N.C.G.S. § 147-69.2(b)(6c) See Section 1 of this report
Externally managed by firms listed in Section 1 of this report
See Section 2 of this report
Inflation Protection Portfolio
See Section 1 of this report
See Section 1 of this report
N.C.G.S. § 147-69.2(b)(9a) See Section 1 of this report
Externally managed by firms listed in Section 1 of this report
See Section 2 of this report
Multi-Strategy Portfolio
See Section 1 of this report
See Section 1 of this report
N.C.G.S. § 147-69.2(b)(9)(ii) See Section 1 of this report
Externally managed by firms listed in Section 1 of this report
See Section 2 of this report
We are not aware of any placement agent fees relating to any Retirement Systems investment that were directly or indirectly borne by the State Treasurer or Retirement Systems.