annual management report 2004 bristol bay area · fishery management report no. 05-41 annual...
TRANSCRIPT

Fishery Management Report No. 05-41
Annual Management Report 2004 Bristol Bay Area
by
Charlotte Westing,
Slim Morstad,
Keith A. Weiland,
Tim Sands,
Lowell Fair,
Fred West,
and
Chuck Brazil
June 2005
Alaska Department of Fish and Game Divisions of Sport Fish and Commercial Fisheries

Symbols and Abbreviations The following symbols and abbreviations, and others approved for the Système International d'Unités (SI), are used without definition in the following reports by the Divisions of Sport Fish and of Commercial Fisheries: Fishery Manuscripts, Fishery Data Series Reports, Fishery Management Reports, and Special Publications. All others, including deviations from definitions listed below, are noted in the text at first mention, as well as in the titles or footnotes of tables, and in figure or figure captions. Weights and measures (metric) centimeter cm deciliter dL gram g hectare ha kilogram kg kilometer km liter L meter m milliliter mL millimeter mm Weights and measures (English) cubic feet per second ft3/s foot ft gallon gal inch in mile mi nautical mile nmi ounce oz pound lb quart qt yard yd Time and temperature day d degrees Celsius °C degrees Fahrenheit °F degrees kelvin K hour h minute min second s Physics and chemistry all atomic symbols alternating current AC ampere A calorie cal direct current DC hertz Hz horsepower hp hydrogen ion activity pH (negative log of) parts per million ppm parts per thousand ppt, ‰ volts V watts W
General Alaska Administrative Code AAC all commonly accepted abbreviations e.g., Mr., Mrs.,
AM, PM, etc. all commonly accepted professional titles e.g., Dr., Ph.D., R.N., etc. at @ compass directions:
east E north N south S west W
copyright corporate suffixes:
Company Co. Corporation Corp. Incorporated Inc. Limited Ltd.
District of Columbia D.C. et alii (and others) et al. et cetera (and so forth) etc. exempli gratia (for example) e.g. Federal Information Code FIC id est (that is) i.e. latitude or longitude lat. or long. monetary symbols (U.S.) $, ¢ months (tables and figures): first three letters Jan,...,Dec registered trademark trademark United States (adjective) U.S. United States of America (noun) USA U.S.C. United States
Code U.S. state use two-letter
abbreviations (e.g., AK, WA)
Measures (fisheries) fork length FL mideye-to-fork MEF mideye-to-tail-fork METF standard length SL total length TL Mathematics, statistics all standard mathematical signs, symbols and abbreviations alternate hypothesis HA base of natural logarithm e catch per unit effort CPUE coefficient of variation CV common test statistics (F, t, χ2, etc.) confidence interval CI correlation coefficient (multiple) R correlation coefficient (simple) r covariance cov degree (angular ) ° degrees of freedom df expected value E greater than > greater than or equal to ≥ harvest per unit effort HPUE less than < less than or equal to ≤ logarithm (natural) ln logarithm (base 10) log logarithm (specify base) log2, etc. minute (angular) ' not significant NS null hypothesis HO percent % probability P probability of a type I error (rejection of the null hypothesis when true) α probability of a type II error (acceptance of the null hypothesis when false) β second (angular) " standard deviation SD standard error SE variance population Var sample var

FISHERY MANAGEMENT REPORT NO. 05-41
ANNUAL MANAGEMENT REPORT 2004 BRISTOL BAY AREA
By Charlotte Westing
Alaska Department of Fish and Game, Division of Commercial Fisheries, Dillingham
Slim Morstad, Alaska Department of Fish and Game, Division of Commercial Fisheries, King Salmon
Keith A. Weiland,
Alaska Department of Fish and Game, Division of Commercial Fisheries, Anchorage
Tim Sands Alaska Department of Fish and Game, Division of Commercial Fisheries, Dillingham
Lowell Fair,
Alaska Department of Fish and Game, Division of Commercial Fisheries, Anchorage
Fred West Alaska Department of Fish and Game, Division of Commercial Fisheries, Anchorage
and
Chuck Brazil
Alaska Department of Fish and Game, Division of Commercial Fisheries, Anchorage
Alaska Department of Fish and Game Division of Sport Fish, Research and Technical Services 333 Raspberry Road, Anchorage, Alaska, 99518-1599
5
June 200
The Division of Sport Fish Fishery Management Reports series was established in 1989 for the publication of an overview of Division of Sport Fish management activities and goals in a specific geographic area. Since 2004, the Division of Commercial Fisheries has also used the Fishery Management Report series. Fishery Management Reports are intended for fishery and other technical professionals, as well as lay persons. Fishery Management Reports are available through the Alaska State Library and on the Internet: http://www.sf.adfg.state.ak.us/statewide/divreports/html/intersearch.cfm. This publication has undergone regional peer review.
Charlotte Westing, Alaska Department of Fish and Game, Division of Commercial Fisheries,
546 Kenny Wren Road, P.O. Box 230, Dillingham, AK 99576-0230 Slim Morstad,
Alaska Department of Fish and Game, Division of Commercial Fisheries, Main Street, P.O. Box 37, King Salmon, AK 99613-0037
Keith A. Weiland, Alaska Department of Fish and Game, Division of Commercial Fisheries,
333 Raspberry Road, Anchorage, AK, 99518-1565 USA Tim Sands,
Alaska Department of Fish and Game, Division of Commercial Fisheries, 546 Kenny Wren Road, P.O. Box 230, Dillingham, AK 99576-0230
Lowell Fair, Alaska Department of Fish and Game, Division of Commercial Fisheries,
333 Raspberry Road, Anchorage, AK, 99518-1565 USA Fred West,
Alaska Department of Fish and Game, Division of Commercial Fisheries, 333 Raspberry Road, Anchorage, AK, 99518-1565 USA
and Chuck Brazil
Alaska Department of Fish and Game, Division of Commercial Fisheries 333 Raspberry Road, Anchorage, AK, 99518-1565 USA
This document should be cited as: Westing C., S. Morstad, K. A. Weiland, T. Sands, L. Fair, F. West, and C. Brazil. 2005. Annual Management
Report 2004 Bristol Bay Area. Alaska Department of Fish and Game, Fishery Management Report No. 05-41, Anchorage.
The Alaska Department of Fish and Game administers all programs and activities free from discrimination based on race, color, national origin, age, sex, religion, marital status, pregnancy, parenthood, or disability. The department administers all programs and activities in compliance with Title VI of the Civil Rights Act of 1964, Section 504 of the Rehabilitation Act of 1973, Title II of the Americans with Disabilities Act of 1990, the Age Discrimination Act of 1975, and Title IX of the Education Amendments of 1972. If you believe you have been discriminated against in any program, activity, or facility, or if you desire further information please write to ADF&G, P.O. Box 25526, Juneau, AK 99802-5526; U.S. Fish and Wildlife Service, 4040 N. Fairfax Drive, Suite 300 Webb, Arlington, VA 22203 or O.E.O., U.S. Department of the Interior, Washington DC 20240. For information on alternative formats for this and other department publications, please contact the department ADA Coordinator at (voice) 907-465-6077, (TDD) 907-465-3646, or (FAX) 907-465-6078.

i
TABLE OF CONTENTS Page
LIST OF TABLES........................................................................................................................................................iii LIST OF FIGURES......................................................................................................................................................iv LIST OF APPENDICES ..............................................................................................................................................iv ABSTRACT ..................................................................................................................................................................1 INTRODUCTION.........................................................................................................................................................1 Management Area Description ......................................................................................................................................1 Overview of the Bristol Bay Salmon Fisheries..............................................................................................................2 2004 COMMERCIAL SALMON FISHERY................................................................................................................2 Run Strength Indicators .................................................................................................................................................2 Preseason Forecasts .......................................................................................................................................................2 South Unimak/Shumagin Island Fishery .......................................................................................................................3 Port Moller Test Fishery................................................................................................................................................4 Economics and Market Production................................................................................................................................4 Run and Harvest Performance by Species .....................................................................................................................4
Sockeye Salmon........................................................................................................................................................4 Chinook Salmon .......................................................................................................................................................4 Chum Salmon ...........................................................................................................................................................4 Pink Salmon..............................................................................................................................................................5 Coho Salmon ............................................................................................................................................................5
Season Summary by District .........................................................................................................................................5 General District.........................................................................................................................................................5 Naknek/Kvichak District ..........................................................................................................................................6 Egegik District ........................................................................................................................................................10 Ugashik District ......................................................................................................................................................13 Nushagak District ...................................................................................................................................................15 Togiak District ........................................................................................................................................................20
2004 SUBSISTENCE SALMON FISHERY...............................................................................................................23 Regulations ..................................................................................................................................................................23 Inseason Management .................................................................................................................................................24 Permit System..............................................................................................................................................................25 Harvest.........................................................................................................................................................................26 2004 BRISTOL BAY HERRING FISHERY..............................................................................................................28 Stock Assessment ........................................................................................................................................................29 Sac Roe Herring Fishery Overview.............................................................................................................................30
Fishing and Industry Participation ..........................................................................................................................30 Gear Specifications.................................................................................................................................................30 Harvest and Management Performance ..................................................................................................................31
Spawn-on-Kelp Fishery Overview ..............................................................................................................................33 2004 Season Summary ................................................................................................................................................34
Biomass Estimation ................................................................................................................................................34 Age Composition ....................................................................................................................................................35

ii
TABLE OF CONTENTS (Continued) Page
Fishery Overview....................................................................................................................................................35 Purse Seine ....................................................................................................................................................36 Gillnet............................................................................................................................................................38 Spawn on Kelp ..............................................................................................................................................39
EXPLOITATION ........................................................................................................................................................39 EXVESSEL VALUE...................................................................................................................................................39 ACKNOWLEDGEMENTS.........................................................................................................................................40 REFERENCES CITED ...............................................................................................................................................40 TABLES......................................................................................................................................................................41 APPENDIX A. SALMON...........................................................................................................................................88 APPENDIX B. HERRING ........................................................................................................................................123

iii
LIST OF TABLES Table Page 1. Comparison of inshore sockeye salmon forecast versus actual run, escapement goals versus actual
escapements, and projected versus actual commercial catch, by river system and district, in thousands of fish, Bristol Bay, 2004. .............................................................................................................................42
2. Inshore forecast of sockeye salmon returns by age class, river system and district, in thousands of fish, Bristol Bay, 2004...........................................................................................................................................43
3. Inshore run of sockeye salmon by age class, river system and district, in thousands of fish, Bristol Bay, 2004...............................................................................................................................................................44
4. Inshore commercial catch and escapement of sockeye salmon, in numbers of fish, Bristol Bay, 2004........45 5. Summary of sockeye salmon test fishing indices in the Naknek/Kvichak District, by index area and
date, Bristol Bay, 2004. .................................................................................................................................46 6. Summary of sockeye salmon test fishing indices in the Ugashik District, by index area and date, Bristol
Bay, 2004. .....................................................................................................................................................46 7. Summary of sockeye salmon test fishing indices in the Nushagak District, by index area and date,
Bristol Bay, 2004...........................................................................................................................................47 8. Commercial fishing emergency orders, by district and stat area, Bristol Bay, 2004.....................................48 9. Daily district registration of drift gillnet permit holders by district, Bristol Bay, 2004. ...............................54 10. Commercial salmon catch by date and species, in numbers of fish, Naknek-Kvichak District, Bristol
Bay, 2004. .....................................................................................................................................................55 11. Commercial salmon catch by date and species, in numbers of fish, Egegik District, Bristol Bay, 2004. .....57 12. Commercial salmon catch by date and species, in numbers of fish, Ugashik District, Bristol Bay, 2004. ...58 13. Commercial salmon catch by date and species, in numbers of fish, Nushagak District, Bristol Bay,
2004...............................................................................................................................................................59 14. Commercial sockeye salmon fishing time and setnet harvest numbers by date and statistical area,
Nushagak District, Bristol Bay, 2004............................................................................................................61 15. Commercial salmon catch by date and species, in numbers of fish, Togiak District, Bristol Bay, 2004. .....63 16. Commercial salmon catch by date and species, in numbers of fish, Togiak Section, Bristol Bay, 2004. .....65 17. Commercial salmon catch by date and species, in numbers of fish, Kulukak Section, Bristol Bay, 2004. ...66 18. Commercial salmon catch by date and species, in numbers of fish, Matogak Section, Bristol Bay, 2004. ..66 19. Commercial salmon catch by date and species, in numbers of fish, Osviak Section, Bristol Bay, 2004. .....66 20. Commercial salmon catch by district and species, in number of fish, Bristol Bay, 2004..............................67 21. Commercial sockeye salmon catch by date and sub-district, in numbers of fish, General District,
Bristol Bay, 2004...........................................................................................................................................68 22. Daily sockeye salmon escapement tower counts by river system, eastside Bristol Bay, 2004......................69 23. Daily sockeye salmon escapement tower counts by river system,westside Bristol Bay, 2004......................71 24. Final daily and cumulative escapement estimates by species, Nushagak River sonar project, Bristol
Bay, 2004. .....................................................................................................................................................73 25. Comparison of daily sockeye salmon escapement estimates by tower count, aerial survey and river test
fishing enumeration methods, Kvichak River, Bristol Bay, 2004. ................................................................76 26. Comparison of daily sockeye salmon escapement estimates by tower count, aerial survey and river test
fishing enumeration methods, Egegik River, Bristol Bay, 2004. ..................................................................77 27. Comparison of daily sockeye salmon escapement estimates by tower count, aerial survey and river test
fishing enumeration methods, Ugashik River, Bristol Bay, 2004. ................................................................78 28. Commercial salmon processors and buyers operating in Bristol Bay, 2004. ................................................79 29. Mean round weight, price per pound, and total exvessel value of the commercial salmon catch, Bristol
Bay, 2004. .....................................................................................................................................................80 30. Subsistence salmon harvest by species, in numbers of fish, by district and location fished, Bristol Bay, 2004. ........ 81 31. Daily observed estimates (tons) of herring by index area, Togiak District, 2004. ........................................82 32. Emergency order (EO) commercial fishing periods for herring sac roe and spawn-on-kelp, Togiak
District, 2004.................................................................................................................................................83 33. Commercial herring harvest (tons) by fishing section, gear type, and date Togiak District, Bristol
Bay, 2004......................................................................................................................................................85 34. Herring total run and commercial catch by year class, Togiak District, 2004. .............................................87 35. Commercial herring sac roe and spawn-on-kelp buyers in Togiak District, 2004. .......................................87

iv
LIST OF FIGURES Figure Page 1. Bristol Bay area commercial fisheries salmon management districts. ............................................................1 2. Togiak Herring District, Bristol Bay. ............................................................................................................28 3. Spawn-on-kelp management areas (K-1 through K11), Togiak District, Bristol Bay...................................34
LIST OF APPENDICES Appendix Page A1. Escapement goals and actual counts of sockeye salmon by river system, in thousands of fish, Bristol
Bay, 1984–2004. ...........................................................................................................................................89 A2. Salmon entry permit registration by gear and residency, Bristol Bay, 1984–2004. ......................................91 A3. Sockeye salmon commercial catch by district, in numbers of fish, Bristol Bay, 1984–2004........................92 A4. Chinook salmon commercial catch by district, in numbers of fish, Bristol Bay, 1984–2004........................93 A5. Chum salmon commercial catch by district, in numbers of fish, Bristol Bay, 1984–2004. ..........................94 A6. Pink salmon commercial catch by district, in numbers of fish, Bristol Bay, 1984–2004..............................95 A7. Coho salmon commercial catch by district, in numbers of fish, Bristol Bay, 1984–2004.............................96 A8. Total salmon commercial catch by district, in numbers of fish, Bristol Bay, 1984-2004. ............................97 A9. Commercial sockeye salmon catch, in percent, by gear type and district, Bristol Bay, 1984–2004. ............98 A10. Sockeye salmon escapement by district, in numbers of fish, Bristol Bay, 1984–2004. ................................99 A11. Inshore commercial catch and escapement of sockeye salmon in the Naknek-Kvichak District by river
system, in numbers of fish, Bristol Bay, 1984–2004...................................................................................100 A12. Inshore sockeye salmon total run by river system Naknek-Kvichak District, in thousands of fish,
Bristol Bay, 1984–2004...............................................................................................................................101 A13. Inshore commercial catch and escapement of sockeye salmon in the Egegik District by river system,
1984–2004...................................................................................................................................................102 A14. Inshore commercial catch and escapement of sockeye salmon in the Ugashik District, by river system,
1984–2004...................................................................................................................................................103 A15. Inshore commercial catch and escapement of sockeye salmon in the Nushagak District by river system,
in numbers of fish, Bristol Bay, 1984–2004................................................................................................104 A16. Inshore sockeye salmon total run by river system, in thousands of fish, Nushagak District, 1984–2004. ..105 A17. Inshore commercial catch and escapement of sockeye salmon in the Togiak District by river system, in
numbers of fish, Bristol Bay, 1984–2004....................................................................................................106 A18. Inshore total run of sockeye salmon by district, in numbers of fish, Bristol Bay, 1984–2004. ...................107 A19. Chinook salmon harvest, escapement and total runs in the Nushagak District, in numbers of fish,
Bristol Bay, 1984–2004...............................................................................................................................108 A20. Chinook salmon harvest, escapement and total runs in the Togiak District, in numbers of fish, Bristol
Bay, 1984–2004. .........................................................................................................................................109 A21. Inshore commercial catch and escapement of chum salmon in the Nushagak and Togiak Districts, in
numbers of fish, 1984–2004. .......................................................................................................................110 A22. Inshore commercial catch and escapement of pink salmon in the Nushagak District by river system, in
numbers of fish, Bristol Bay, 1964–2004, even years only.........................................................................111 A23. Coho salmon harvest, escapement and total runs in the Nushagak Drainage, in numbers of fish, Bristol
Bay, 1984–2004. ..........................................................................................................................................112 A24. Coho salmon harvest by fishery, escapement and total runs for the Togiak River, in numbers of fish,
Bristol Bay, 1984–2004...............................................................................................................................113 A25. Average round weight (lbs.) of the commercial salmon catch by species, Bristol Bay, 1984–2004...........114 A26. Average price paid in dollars per pound for salmon, by species, Bristol Bay, 1984–2004. ........................115 A27. Estimated exvessel value of the commercial salmon catch by species paid to fishermen, in thousands of
dollars, Bristol Bay, 1984–2004. Derived from price per pound times commercial catch. .........................116 A28. South Unimak and Shumigan Island preseason sockeye allocation, actual sockeye and chum harvest in
thousands of fish, Alaska Peninsula, 1984–2004. .......................................................................................117 A29. Subsistence salmon harvest, by district and species, Bristol Bay, 1984–2004............................................118

v
LIST OF APPENDICES (Continued) Appendix Page A30. Subsistence harvest of sockeye salmon by community, in numbers of fish, Kvichak River drainage,
Bristol Bay, 1984–04...................................................................................................................................121 A31. Subsistence salmon harvest by community, Nushagak District, Bristol Bay, 1984–2004. .........................122 B1. Sac roe herring industry participation, fishing effort and harvest, Togiak District, 1984–2004. ............124 B2. Exploitation of Togiak herring stock, 1984–2004.......................................................................................125 B3. Age composition of inshore herring, Togiak District, 1984–2004. .............................................................126 B4. Herring spawn-on-kelp industry participation, fishing effort, area and harvest, Togiak District, 1984–
2004.............................................................................................................................................................127 B5. Aerial survey estimates of herring biomass and spawn deposition, Togiak District, 1984–2004. ..............128 B6. Exvessel value of the commercial herring and spawn-on-kelp harvest, in thousands of dollars, Togiak
District, 1984–2004. ....................................................................................................................................129 B7. Guideline and actual harvests of sac roe herring (tons) and spawn-on-kelp (lbs), Togiak District, 1984–
2004.............................................................................................................................................................130

vi

1
ABSTRACT The 2004 Bristol Bay Management Report is the forty-third consecutive annual volume reporting on management activities of the Division of Commercial Fisheries staff in Bristol Bay. The report emphasizes a descriptive account of the information, decisions, and rationale used to manage the Bristol Bay commercial salmon and herring fisheries, and outlines basic management objectives and procedures. We have included all information deemed necessary to fully explain the rationale behind management decisions formulated in 2004. All narrative and data tabulations in this volume are combined in two sections, salmon followed by herring, to aid in the use of this document as a reference source. The extensive set of tables has been updated to record previously unlisted data for easy reference. Fisheries data in this report supersedes information in previous reports. Corrections or comments should be directed to the Dillingham office. Attention: Editor. Charlotte Westing, Togiak Area Management Biologist, P.O. Box 230, Dillingham, AK 99576. Key Words: Bristol Bay Management, commercial fisheries, herring, sockeye salmon, Chinook salmon, chum salmon,
coho salmon, pink salmon, Naknek, Kvichak, Egegik, Ugashik, Wood, Nushagak, Igushik, Togiak.
INTRODUCTION MANAGEMENT AREA DESCRIPTION The Bristol Bay management area includes all coastal waters and inland waters east of a line from Cape Newenham to Cape Menshikof (Figure 1). The area includes eight major river systems: Naknek, Kvichak, Egegik, Ugashik, Wood, Nushagak, Igushik, and Togiak. Collectively, these rivers are home to the largest commercial sockeye salmon fishery in the world. Sockeye salmon are by far the most abundant salmon species that return to Bristol Bay each year, but Chinook, chum, coho, and (in even-years) pink salmon returns are important to the fisheries as well. The Bristol Bay area is divided into five management districts (Naknek-Kvichak, Egegik, Ugashik, Nushagak, and Togiak) that correspond to the major river drainages. The management objective for each river is to achieve desired escapement goals for the major salmon species while harvesting all fish in excess of the escapement requirement through orderly fisheries. In addition, regulatory management plans have been adopted for individual species in certain districts.
Alaska Department of Fish and GameDivision of Commercial Fisheries
Bristol Bay Area Commercial Salmon Fishery Management Districts
N
0 30 Kilometers
CapeMenshikof
Cape Newenham
CapeConstantine
UgashikDistrict
Togiak Bay
Egegik District
Togiak District
Nushagak District
Naknek-Kvichak District
Figure 1.–Bristol Bay area commercial fisheries salmon management districts.

2
OVERVIEW OF THE BRISTOL BAY SALMON FISHERIES The five species of pacific salmon found in Bristol Bay are the focus of major commercial, subsistence, and sport fisheries. Annual commercial catches (1984–2003) average nearly 24 million sockeye salmon, 69,000 Chinook, 971,000 chum, 133,000 coho, and 593,000 (even-years only) pink salmon (Appendices A3–A7). Since 1984, the value of the commercial salmon harvest in Bristol Bay has averaged $121 million, with sockeye salmon being the most valuable, worth an average $118 million (Appendix A27). Subsistence catches average approximately 154,000 salmon and comprised primarily of sockeye salmon (Appendix A29). Sport fisheries harvest all species of salmon, with most effort directed toward Chinook and coho stocks. Approximately 40,000 salmon are harvested annually by sportfishermen in Bristol Bay.
Management of the commercial fishery in Bristol Bay is focused on discrete stocks with harvests directed at terminal areas around the mouths of major river systems. Each stock is managed to achieve a spawning escapement goal based on maximum sustained yield. Escapement goals are achieved by regulating fishing time and area by emergency order and/or adjusting weekly fishing schedules. Legal gear for the commercial salmon fishery includes both drift (150 fathoms) and set (50 fathoms) gillnets. However, the Board of Fish passed a regulation in 2003 allowing for two permit holders to concurrently fish from the same vessel and jointly operate up to 200 fathoms of drift gillnet gear. This regulation does not apply in special harvest areas. Drift gillnet permits are the most numerous at 1,860 in Bristol Bay (Area T), of those 1,426 fished in 2004. There are a total of 989 setnet permits in Bristol Bay, of those 761 made deliveries in 2004 (Appendix A2).
2004 COMMERCIAL SALMON FISHERY RUN STRENGTH INDICATORS Fishery managers in Bristol Bay have several early indicators of sockeye run size, including: the preseason forecast, the False Pass fishery, the Port Moller test boat, the district test program, and the early performance of the commercial fishery. Evaluated individually, each of these pieces of information may not give a correct assessment of run size. Collectively, they form patterns such as missing year classes, discrepancies with the forecast, or differences in run timing that can be important to the successful management of the commercial fishery.
PRESEASON FORECASTS Total inshore sockeye salmon production for Bristol Bay in 2004 was forecasted to be slightly more than 46.6 million (Table 1). The bay sockeye harvest was predicted to reach approximately 34.7 million fish. Runs were expected to exceed spawning escapement goals for all river systems in Bristol Bay.
The forecast for the sockeye salmon run to Bristol Bay in 2004 is the sum of individual predictions for nine river systems (Kvichak, Alagnak, Naknek, Egegik, Ugashik, Wood, Igushik, Nushagak-Mulchatna, and Togiak) and four age classes (ages 1.2, 1.3, 2.2, and 2.3, plus ages 0.3 and 1.4 for Nushagak) (Table 2). Adult escapement and return data from brood years 1973–2000 were used in the analyses.
Predictions for each age class returning to a river system were calculated from models based on the relationship between adult returns and spawners or siblings from previous years. Also, models based on the relationship between returns and smolt were examined for Ugashik River.

3
Tested models included simple linear regression, multiple regression, and 5-year averages. In addition, univariate and multivariate time series analysis models were examined. The models chosen were those with statistically significant parameters having the greatest past reliability (accuracy and precision) based on mean absolute deviation, mean absolute percent error, and mean percent error between forecasts and actual returns for the years 2001 through 2003.
SOUTH UNIMAK/SHUMAGIN ISLAND FISHERY These fisheries were managed under a guideline harvest (quota) specified in 5 AAC 09.365, the South Unimak/Shumagin Islands June Fishery Management Plan initially adopted in 1974 by the Alaska Board of Fisheries. The original intent of the Alaska Board of Fisheries was to prevent overharvest of sockeye runs bound for individual river systems in Bristol Bay. In 2001 the Board of Fisheries reviewed the management plan and concluded that because the fishery was based on the interception of stocks bound for Bristol Bay and the Arctic-Yukon-Kuskokwim region, it should be restricted to window periods of fishing time. These window periods were as follows: from June 10 to June 24 such that: “commercial fishing periods may occur only from 6:00 a.m. to 10:00 p.m. and may not be open for more than (A) three days in any seven-day period. (B) 16-hours per day; (C) 48-hours in any seven-day period; (D) two consecutive 16-hour fishing periods in any seven-day period.” The Board removed the previous regulations that were based on a chum cap and a percentage of the Bristol Bay preseason sockeye salmon forecast.
The management plan was again brought before the Board for review in January 2003. At that time, the Board restructured the management plan. 5AAC. 09.365, the South Unimak/Shumagin Island June Fishery Management Plan states: (a) “The South Unimak and Shumagin Islands June fishery harvest both sockeye and chum salmon in a mixed stock fishery during the month of June. The sockeye salmon are predominantly Bristol Bay and Alaska Peninsula origin. The chum salmon are bound for a number of areas, including Japan, Russia, the Arctic-Yukon-Kuskokwim, Bristol Bay, the Alaska Peninsula, and south central Alaska. These salmon stocks have historically been harvested along the south Alaska Peninsula during the month of June. This management plan is intended to be consistent with the Policy for the Management of Sustainable Salmon Fisheries (5AAC 39.222) and the Policy for the Mixed Stock Salmon Fisheries (5AAC 39.220)”. The Board removed references to interception of Bristol Bay and Arctic-Yukon-Kuskokwim stocks and liberalized the fishing schedule: (d) Beginning June 7, the commissioner may open, by emergency order, commercial fishing periods for purse seine, drift gillnet, and set gillnet gear in the South Unimak and Shumagin Islands fisheries as follows: (1) commercial fishing periods will begin at 6:00 a.m. and run 88 hours, until 10:00 p.m. three days later; commercial fishing will be closed for 32 hours and reopen at 6:00 a.m. two days later (2) notwithstanding (1) of this subsection, the final commercial fishing period will end at 10:00 p.m. on June 29.
Preliminary catch information for 2004 indicates that the Shumagin Island fishery landed 816,000 sockeye, and the South Unimak fishery landed 532,000 sockeye (Appendix A28). The South Unimak sockeye catch was 65% of the 10-year average and the chum catch was 62% of the 10-year average. However, in the Shumagin Island fishery sockeye catch was 2.4 times higher than the 10-year average and the chum catch was 2.5 times higher than the 10-year average. Therefore, the overall sockeye catch was 17% higher than the 10-year average and the chum catch was 39% higher than the 10-year average.

4
PORT MOLLER TEST FISHERY
From 1967–1985 the Department of Fish and Game operated a test fish program out of the community of Port Moller. A large vessel fished specific coordinates on transect lines perpendicular to the migration path of sockeye salmon returning to Bristol Bay. Collected data was used to estimate strength, timing, age, and size composition of the run. Although the forecasting performance of the project was often inaccurate, the project was very popular with salmon processors because it gave an additional indication of run size, which influenced production capacity and the price paid to fishermen. The project did not operate in 1986, but through voluntary funding from the industry and support from the Department of Fish and Game and the Fisheries Research Institute (FRI), the Port Moller test fish project operated from 1987 through 2003. In 2004, the FRI contribution to the project was replaced by the Bristol Bay Science and Research Institute (BBSRI) performed the bulk of the daily inseason analysis.
ECONOMICS AND MARKET PRODUCTION In 2004, the exvessel value of the commercial salmon inshore harvest was estimated at $70.2 million. The 1994 to 2003 average exvessel value of Bristol Bay commercial salmon fisheries is about $120.9 million (Appendix A27).
During the 2004 season, 8 companies canned, 29 companies froze and 3 companies cured salmon in Bristol Bay. In addition, 15 companies exported fresh fish by air (Table 28). A total of 35 processors/buyers reported catches from Bristol Bay in 2004.
RUN AND HARVEST PERFORMANCE BY SPECIES The combined commercial salmon harvest in Bristol Bay totaled 25.5 million fish in 2004. This was just below the 20-year average of 25.1 million salmon (Appendix A8) for Bristol Bay.
Sockeye Salmon The 2004 inshore sockeye run of 41.7 million fish was slightly below the preseason forecast of 46.6 million (Table 1). Actual runs were below forecast in all but the Branch, Wood, and Nushagak Rivers.
Sockeye salmon dominated the inshore commercial harvest, and totaled 24.6 million fish (Tables 1 and 4). Sockeye escapement goals were met or exceeded in all systems where spawning requirements have been defined with the exception of the Kvichak and Igushik Rivers. The most spectacular return in 2004 was the Alagnak River where nearly 5.4 million sockeye passed the tower, shattering the previous records set in 1960 and 2003 with escapements of 1.24 million sockeye and 3.7 million sockeye respectively.
Chinook Salmon Chinook salmon harvests in 2004 were below the recent 20-year averages in all districts except the Nushagak where the harvest of over 93,000 salmon was nearly double the 20 year average (Appendix A4). The 2004 bay-wide commercial harvest of 106,000 Chinook was well above the 20-year average of 69,000.
Chum Salmon In 2004, the inshore commercial harvest of 730,000 chum salmon, just below the 10-year average of 674,000 but well below the 20-year average of 971,000 (Appendix A5). Chum salmon catches were below average in all districts but the Nushagak District.

5
Pink Salmon Bristol Bay has a dominant even-year pink salmon cycle. The 2004 fishing season resulted in the incidental harvest of 52,000 pink salmon (Appendix A6). The harvest was far less than the 20-year average of 593,000 but was slightly higher than the 10-year average of 42,000 salmon.
Coho Salmon The 2004 bay-wide commercial harvest of coho salmon totaled 73,000, which was just below the 10-year average of 74,000 (Appendix A7). Effort for coho salmon was low, resulting in a small harvest. However, all indications suggest an average to above average return in 2004 for all districts.
SEASON SUMMARY BY DISTRICT General District The 2004 projected harvest of 35 million fish led to the creation, by the Board of Fisheries, of a general district. The general district was created, similar to the general districts of 1970 and 1980, with the intent of allowing the fleet to fish the salmon run earlier essentially lessening the compression of the run and increasing seasonal processing capacity. Processors felt that reduced run compression would allow for fish to be processed more carefully, thus, increasing their value.
The General District Management Plan, adopted by the Board, opened an area from the tip of Cape Constantine to the latitude of Cape Menshikof within the state’s 3-mile jurisdictional limit. The General District is defined as all waters of the Bristol Bay Area north and east of a line from a point on Cape Constantine at 58° 26.14' N. lat., 158° 45.91' W. long. to a point at 58° 27.22' N. lat., 158° 36.21' W. long., to a point at 58° 32.30' N. lat., 158° 13.26' W. long., then following the territorial sea boundary line around Etolin Point and continuing along the territorial sea boundary line to the latitude of Cape Menshikof at 57° 28.34' N. lat., except those waters within, and those waters draining into, the regular districts described in 5 AAC 06.200. Drift gillnets with mesh size of 5 ½” or less and 150 fathoms in length were allowed. A vessel with two permit holders legal to fish in the General District on board was allowed to fish 200 fathoms of drift gear as specified in 5 AAC 06.385. The General District could potentially be opened by emergency order from June 7 through June 25 for the harvest of up to 10% of the preseason forecast for the Bristol Bay Area.
On Monday, June 7 at 9:00 a.m., the first period in the General District began. This period ended on Friday, June 11 at 9:00 p.m. with a weekly harvest of only 16,300 sockeye (See Table 21). Effort in the district was low with 119 deliveries.
The second week of fishing in the General District began on June 14 at 9:00 a.m., ended on June 18 at 11:00 p.m. and resulted in the harvest of 631,000 sockeye. Cumulative catch by June 18 was 647,000 sockeye. Effort in the district also increased for this second week with 2,000 deliveries.
After the second week of fishing in the General District, information on Kvichak sockeye salmon run strength, including age composition information from the South Unimak/Shumagin Islands June fishery and the Port Moller test fishery in conjunction with genetic samples taken from the Port Moller test fishery was available. The Age 2.2 component was the predominant age class in most sampling, and was believed to show some early support for the forecasted run strengths to

6
most rivers. Early run timing was also indicated in most systems, which could potentially expose more of the Kvichak sockeye salmon stock to harvest in the General District than with normal run timing. With Kvichak sockeye salmon being a stock of management concern, the decision was made to reduce the weekly fishing schedule in the General District.
The General District opened 9:00 a.m., Monday, June 21 and closed 9:00 p.m., Tuesday, June 22. Catch for this two-day period was 1,022,500 sockeye. Effort in the General District also increased dramatically during this two-day period with 1,681deliveries.
Total catch for the General District was 1,669,800 sockeye, 4,600 Chinook salmon, and 30,000 chum salmon. Approximately 46% of the total sockeye catch in the General District was taken in the Central Sub-district. It is important to note that the proportion of Kvichak sockeye in the General District is unknown. The General District’s focus on mixed stocks has posed a challenge for apportioning catch among districts and could make future data sleuthing inaccurate. Because of these challenges, the General District catch is reported in an individual table (Table 21) but is not included in the totals for the terminal fishing districts, which represent inshore return only.
Naknek/Kvichak District The 2004 forecast for the Naknek/Kvichak District projected a total run of 22.3 million sockeye, 7.9 million for escapement and 14.4-million to harvest (Table 1). The forecast by river system was 13.23 million to the Kvichak River, 4.4 million expected to return to the Alagnak River and 4.66 million for the Naknek River. The escapement goals for these river systems are: minimum 6.0 million for the Kvichak River, 185,000 for the Alagnak River and a range of 800,000 to 1.4 million for the Naknek River. The actual total inshore return for 2004 was slightly less than 18.0 million sockeye salmon, nearly 20% below the preseason forecast. The commercial catch of just over 4.7-million sockeye occurred almost entirely in the Naknek Section and Naknek River Special Harvest Area (NRSHA). The contribution of catch from the Kvichak and Alagnak Rivers was minimal due to the steps taken at the beginning of the season. No forecasts are made for Chinook, chum, or coho salmon in the Naknek/Kvichak District. The commercial harvest of Chinook salmon has remained relatively insignificant in recent years. This is a result of the current mesh size restrictions that have been implemented since the early 1990s and how the NRSHA is managed. Mesh restrictions are set by “Emergency Order” (E.O.) each year and prohibit gillnets with mesh size larger than 5.5 inches until July 21 (Table 8). The NRSHA is managed by pulsing commercial periods through part of the flood and ebb tide.
During the December BOF meeting in Anchorage, several regulation changes were adopted concerning the Naknek/Kvichak District. The Kvichak sockeye salmon stock was elevated from a “stock of yield concern” to a “stock of management concern”, due to the recent chronic inability to meet escapement goals. With this action came the stipulation that if the Kvichak River run is forecasted to be less than 30% above the minimum biological escapement goal (BEG), fishing will begin in the special harvest areas of Naknek, Egegik and Ugashik Rivers (5 AAC 06.360 (h)). In addition to stock status, the BOF also changed the allocation plan for the Naknek/Kvichak District; when fishing in the NRSHA, the allocation of fish will be split 84 percent drift 16 percent set gillnet (5 AAC 06.360 (c)).
As described above, the 2004 total run forecast for the Kvichak River was twice the minimum escapement goal of 6.0 million sockeye salmon for the pre-peak year. With a projected return to the Kvichak that would exceed escapement goal needs, the department would take a more aggressive approach than in the past several years. The department would however; monitor the
7
Kvichak River escapement closely to assure the 2004 escapement goal would be met. As described in the overview section, the BOF created the General District (GD) for the 2004 season, due to the large Bristol Bay forecast. The Kvichak River has been over-forecasted seven of the last nine years. With the additional fishing pressure outside the Naknek/Kvichak District and the Kvichak failing since 1999, a somewhat cautious approach was needed early in the season. The Naknek Section was open to both drift and set gillnet gear beginning 9:00 a.m. Tuesday, June 1 and the Kvichak Section was open to set gillnet gear only beginning 9:00 a.m. Tuesday, June 1.
Early run strength indicators, prior to catch information in Bristol Bay, come from the South Peninsula commercial and the Port Moller test fishery; both begin around June 10. The Port Moller test fishery program projects run entry to Bristol Bay and the age composition of the run; this is then compared to the preseason forecast. In 2004, the South Peninsula fishery fished the same schedule as in 2003, based on the changes at the BOF in 2001 with 16-hour periods and 36-hour period breaks between the fishing periods. There was little age composition information collected from the commercial harvest. Catch information from the South Peninsula fishery provided no information for local Bristol Bay systems. However, the early scale information collected from the Port Moller test fishery indicated the 2-ocean component in the samples was the dominant age class. This was very early in the project and no conclusive evidence on run size was possible through June 23.
The escapement monitoring projects, i.e., towers for the Naknek, Kvichak, and Alagnak Rivers were operational by June 25. The Naknek tower was operational at 12:00 midnight, June 19, the Kvichak tower at 12:00 midnight, June 23 and the Alagnak River 12:00 midnight, June 25 (Table 22). Throughout the course of the season, escapements into all systems were on track to finish as or better than expected. With the GD open, most drift boats were outside of the district; catch information through June 23 for Naknek/Kvichak District was predominately set net effort. With set gillnet gear the dominant gear type in the district, escapements were at a rate above the projected for the Naknek and Alagnak while the Kvichak was within the one day spread. The district remained on the 4-day a week schedule through 9:00 a.m. June 23.
In recent years, district test fishing began earlier in June due to the restricted fishing in the Naknek/Kvichak District. This season with the Kvichak forecast allowing for a greater than 30% exploitation rate and the GD opening, the district was open for the most part, with limited opportunity in the Kvichak Section. The first day of test fishing occurred on June 26. What transpired prior to June 26 were two short fishing periods on June 24 and June 25 for 8 hours in the Naknek Section only for drift and nine hours for set nets in both sections. As stated earlier, little catch information was available due to the limited fishing inside the district. The GD fishing provided no information on relative abundance due to the limited historical perspective of how the run was developing, hopefully these two periods would shed some light on early run strength. The escapement through June 23 in the Naknek River was 103,000 (Table 22) sockeye the projected for the same time period was 61,000. In the Kvichak, with only two days of counting, 1,100 sockeye had passed the tower and the inriver estimate was 30,000. The catch from the June 24 period was only 83,500 sockeye and for the June 25 period was only 43,600.
The district test boat fished the Naknek Section the morning of June 26. Fishing was marginal, no sockeye were caught near the Naknek River entrance or at Ships Anchorage. Most of the fish harvested were near the Johnson Hill line. No sets indicated a large volume of fish in the area (Table 5). The catch rates from Kvichak inriver test were decreasing from the 50,000–inriver

8
estimate seen on June 24 to only 10,000 on June 26 (Table 25). The total escapement through June 26 on the Kvichak River was 24,000 sockeye, 120,000 for Naknek River and 8,300 Alagnak River. The expected count, based on historical curves, would be 49,000 for the Kvichak and 72,000 for the Naknek River. This is only the fourth year a tower has been on the Alagnak since 1976 so no projected curves have been developed. The district test boat fished in the Naknek Section on the a.m. tide on June 27; indices improved over the day before but were not outstanding. The district had been closed for the past five tides. Escapement into the Naknek River was more than two days ahead of the historic curve yet the Kvichak remained below the curve slightly. With surplus escapement in the Naknek River and escapement slightly behind schedule in the Kvichak River, a short four-hour period was allowed in the Naknek Section only beginning at 8:30 p.m. Sunday, June 27. The harvest from the four-hour period was 151,500 sockeye.
Following the short period on June 27, Naknek River escapement continued to increase with 145,000 on June 28 and 122,600 on June 29. The Kvichak River escapement saw only meager improvement, 5,000 on June 28 and 28,000 on June 29. However, inriver test for the Kvichak River observed a substantial change in movement on June 28 with an estimated 115,000 sockeye. On June 29, it increased to 400,000 sockeye and by June 30 the estimated inriver estimate jumped 1.2 million sockeye. The Naknek Section only opened for two short periods June 29 to both set and drift gillnet gear. Later that day, the second period was extended to set gillnet gear an additional 25 hours, and remained open until the evening of July 4. The Kvichak District opened to set gillnet fishing only at 9:00 a.m. June 30 for 7.5 hours and again the morning of July 1 where it was then extended daily until July 4. The drift gillnet fleet fished a portion of each tide from the morning of June 29 until the morning of July 6.
The cumulative escapement for the Naknek River through July 3 was slightly more than 715,000 sockeye; the projected escapement through July 3 was 420,000, four days a head of schedule. The Kvichak however, was not as far ahead of schedule; the cumulative escapement through midnight July 3 was nearly 1.1 million. The projected escapement for that date was 950,000 sockeye. The gap between the actual and expected was narrowing. The harvest allocation through July 3 was 76% drift 13% Naknek set and 11% Kvichak set. With the set gillnet fleet ahead in allocation, the next two periods were drift gillnet gear only in the Naknek Section. The Kvichak Section remained closed.
The test boat explored the Kvichak Section on the morning tide of July 3 finding indices ranging from 8 to 541 for an average index of 170. A total of eight drifts harvested 700 sockeye. These indices were made near peak run timing and to date, no drift gillnet fishing in the Kvichak Section had occurred. If the run was as forecast, it was expected that more evidence would have been seen in the district. Based on this, the industry was notified that if the Kvichak escapement did not improve significantly, the NRSHA would open as early as 4:30 p.m. Tuesday, July 6.
The cumulative escapement for the Naknek River through July 4 was nearly 785,000 sockeye; the projected cumulative escapement through July 4 was 530,000, still four days a head of schedule. The daily escapement past the Kvichak tower on July 4 was 230,000 sockeye, considerably less than the 390,000 sockeye needed. The actual cumulative escapement of 1.3 million sockeye was tracking the historical curve of 1.3 million. However, this alignment occurred with no drift gillnet fishing in the Kvichak Section and only marginal fishing with set gillnet gear. Therefore, one would expect a wider spread between the actual and the anticipated curves when considering total run information. To keep on track with the historical curve, the

9
escapement for the next two days would need to be 900,000 sockeye. The inriver estimate from the test fishery at Levelock projected only 200,000 sockeye inriver. Therefore, escapement was falling further behind and there was an increased likelihood of being more than one day behind the cumulative escapement goal curve. The Naknek/Kvichak District closed at 9:30 p.m. Tuesday, July 6.
To protect the quality of escapement for sockeye and other salmon species when the NRSHA is open, the BOF opted for an optimal escapement goal (OEG) of 800,000 to 2.0 million sockeye for the Naknek River. This would enable the department to pulse (multiple short periods) the fishery. The short periods would allow escapement of salmon without encountering fishing gear and minimize fishing during the low tides. To accomplish this, the drift gillnet fleet began fishing near the 15-foot flood stage and ended at or near the 15-foot ebb stage of the tide. For the set gillnet fleet, the fishery was centered on the 10-foot tides during both the flood and ebb. When runs to the Naknek were at a magnitude of 4 to 6 million, the upper OEG would come into effect. However, when runs to the Naknek are less than 3 million, escapements can be held to less than 1.4 million sockeye and yet continue with the pulse style fishery.
As discussed earlier, the BOF changed the way fish would be distributed in the NRSHA. Prior to 2004, the gear groups fished separately and alternated the periods. During the winter BOF meeting, the BOF applied the allocation percentages to the NRSHA so the harvest is to be divided 84 /16 with drift gear getting the 84%. The allocation as of July 4 was 75% drift 25 % set gillnet. To distribute the fish to the gear groups the drift fleet fished the four tides. The set gillnet users fished the evening tide on Thursday July 8 and again on July 10. While in the NRSHA, set gillnet users fished seven tides, the drift gillnet fleet fished 18 tides. The sockeye harvest for drift gillnet gear was 900,000 sockeye, set gillnet gear caught 122,000. The allocation percentage in the NRSHA was 88% drift, and for the season including GD harvest and Naknek/Kvichak District was 81% drift harvest.
The NRSHA remained open until the morning of July 19 when the Naknek Section of the Naknek Kvichak District opened to both drift and set gillnet gear on the fall schedule of 9:00 a.m. Monday to 9:00 a.m. Friday until September 30. With little effort and few sockeye in the catch, the entire Naknek/Kvichak District opened on August 2 to commercial fishing on the fall schedule. There were 68 deliveries between August 2 and September 30 with the last reported delivery on September 3. The sockeye harvest during that time period was only 470.
The sockeye return to the Alagnak River was record-breaking in 2004, far exceeding the 2003 record of 3.7 million with a total of 5,396,592 sockeye. Aerial surveys of the spawning systems were conducted weekly in 2004 from July 18 to September 14. An estimated 2.9 million sockeye were observed from the air over that time period. The department will continue a counting program on the Alagnak to monitor the effects of these large escapements.
The sockeye salmon harvest totaled just over 4.7 million (Appendix A3). The reported commercial harvest of 1,274 Chinook was below of the recent 10-year average harvest of 2,534 (Appendix A4). The chum salmon harvest totaled 28,895 fish, less then the 10-year average of 107,000 (Appendix A5). There was a reported commercial harvest of only 2,138 coho salmon in the Naknek/Kvichak District (Appendix A7). Subsistence harvests may be found in Table 30.

10
Egegik District The 2004 sockeye salmon run to the Egegik District of 11.5 million fish was the largest run recorded since 1996, and it was approximately 5% below the forecast of 12.1 million sockeye. Sockeye salmon runs to the Egegik District during the past four comparable cycle years, dating back to 1984, have ranged from 6.4 to 12.7 million fish with an average of 9.7 million. The 2004 run was 19% above the average for the recent cycle years (Appendix A13). The harvest of 10.2 million sockeye salmon was the seventh largest commercial harvest in the 110 year history of the fishery. An escapement of approximately 1.3 million fish was achieved, which was slightly over the mid-range of the Biological Escapement Goal (BEG) of 800,000 to 1.4 million (Table 1).
The Alaska Department of Fish and Game (ADF&G) forecasted a Bristol Bay run of 46.6 million sockeye salmon in 2004, and a harvest of approximately 34.7 million. The projected Egegik District harvest of 11 million sockeye was 32% of the predicted Bay’s harvest (Table 1). With a third of the Bay’s predicted harvest, there was a fair amount of interest in fishing the Egegik District this season, and by June 17 most of the drift gillnet effort, 440 vessels, had registered to fish in Egegik. Bay-wide, there were approximately 900 vessels registered to fish on June 17. This early show of effort was due to the creation of the general fishing district outside and between the Bay’s terminal fishing districts from June 7 until June 22.
Commercial salmon fishing was opened in the Egegik District on June 1, but no landings occurred until June 7 (Table 11). Through June 16, the total catch of approximately 96,000 was well above the 20-year average of 16,000. In fact, it was the highest cumulative catch on record through this date. The fishery was allowed to close as scheduled at 9:00 a.m. on June 16, but was reopened for 8-hour periods on June 17 and 18. It did not make sense to allow commercial fishing in a General District just outside the terminal Egegik District and not allow some fishing time inside the terminal district.
Daily inriver test fishing, which provides estimates of sockeye salmon passage into the lower portions of Egegik River, began on June 14 at the usual sites just upstream of Wolverine Creek (Table 26). The Egegik River counting towers began operation on June 17 (Table 22), and provided daily estimates of sockeye salmon passage into Becharof Lake. Initial inriver test fishing catches were fair and results through June 18 indicated that approximately 70,000 sockeye salmon were in the river and above the commercial fishing district (Table 26). The tower count was 31,000 through June 18 and two to three days ahead of the expected level.
The June 17 and 18 catch totaled over 100,000 sockeye salmon and was one of the better harvests for these dates. The catch per delivery (CPD) was better inside the Egegik District than it was in the General District just outside of it. The tower escapement count continued to increase and totaled 41,000 sockeye salmon through June 19, and was still two to three days ahead of the expected level. Another brief commercial fishing period was allowed on June 20.
For the 8-hour fishing period on June 20, the catch was approximately 225,000 sockeye salmon. This was the fifth largest catch and the third best CPD on record for this date. Egegik District fishing continued with 8-hour daily fishing periods through June 25.
The June 21 to June 25 daily harvests ranged from 162,000 to over 435,000 sockeye salmon while the escapement count increased to 150,000. With the set gillnet harvest allocation at about 10%, the next fishing period, an 8-hour period on June 26, was for set gillnet fishers only.

11
The June 26 catch was approximately 85,000 and averaged about 330 fish per delivery. This was the highest CPD for this date and an indication of a strong push of fish into the district. Indeed, the inriver test fishing results shot up to their highest daily index for the season and one day later the cumulative tower count doubled to 325,000 sockeye salmon. Fishing periods for both tides were scheduled on June 27.
The catch of approximately 895,000 sockeye salmon was the third largest harvest on record for this date and brought the cumulative harvest to about 2.5 million or the fifth largest catch for this date. Inriver test fishing had another good day on June 27 and results indicated an estimate of 180,000 additional fish up the river. Fishing on June 28 was also scheduled for two tides, and resulted in a harvest of over 700,000 sockeye salmon. The daily tower count was over 200,000 on June 28, bringing the cumulative escapement up to 525,000. This level of escapement was two days ahead of the expected level with early run timing or seven days ahead with normal run timing. Inriver test fishing results dropped off on June 28 and stayed low for the next six days. Commercial fishing was cut back to one tide per day for drift gillnet fishers, but some extra time was scheduled for set gillnet fishers to make up some ground on their harvest allocation. From June 29 to July 4, daily catches were fairly steady and averaged 676,000 sockeye salmon and ranged from 633,000 to 765,000. The cumulative harvest was now approximately 7.2 million, however; the tower escapement slowed down to a cumulative count of 718,000 on July 4. A longer closure was needed to allow more fish up the Egegik River, and the Egegik District was closed on July 5.
Meanwhile, the struggling Kvichak River escapement prompted the closure of the district and the opening of the Naknek River Special Harvest Area (NRSHA). The opening of the NRSHA triggers the reduction of the Egegik District to the Egegik Special Harvest Area (ERSHA). Inriver test results improved on July 5 and a brief fishing period in the ERSHA was scheduled for July 6.
The July 6 fishing period resulted in a harvest of about 430,000 sockeye salmon of which 139,000 were harvested by set gillnet fishers. This was the second largest single day harvest in Egegik set gillnet history and was indicative of a substantial Egegik run. Set gillnet harvests averaged over 100,000 for the next three days and peaked with a catch of 166,000 on July 8. The 2004 Egegik set gillnet fishery has four of the top five largest single day catches in its history. From July 6 through July 9 the total harvest averaged 470,000 sockeye salmon per day and ranged from 393,000 to 607,000 bringing the cumulative catch up to approximately 9.1 million. Sockeye escapement went to 1.2 million fish by July 10.
Sockeye salmon landings in the district continued until the end of July (Table 11), reaching a seasonal cumulative total catch of approximately 10.2 million fish. The counting towers ceased operation on July 15 and the final escapement count totaled 1.3 million sockeye salmon. This was approximately 18% over the midrange of the BEG range. The escapement sex ratio was approximately 45% males to 55% females.
12
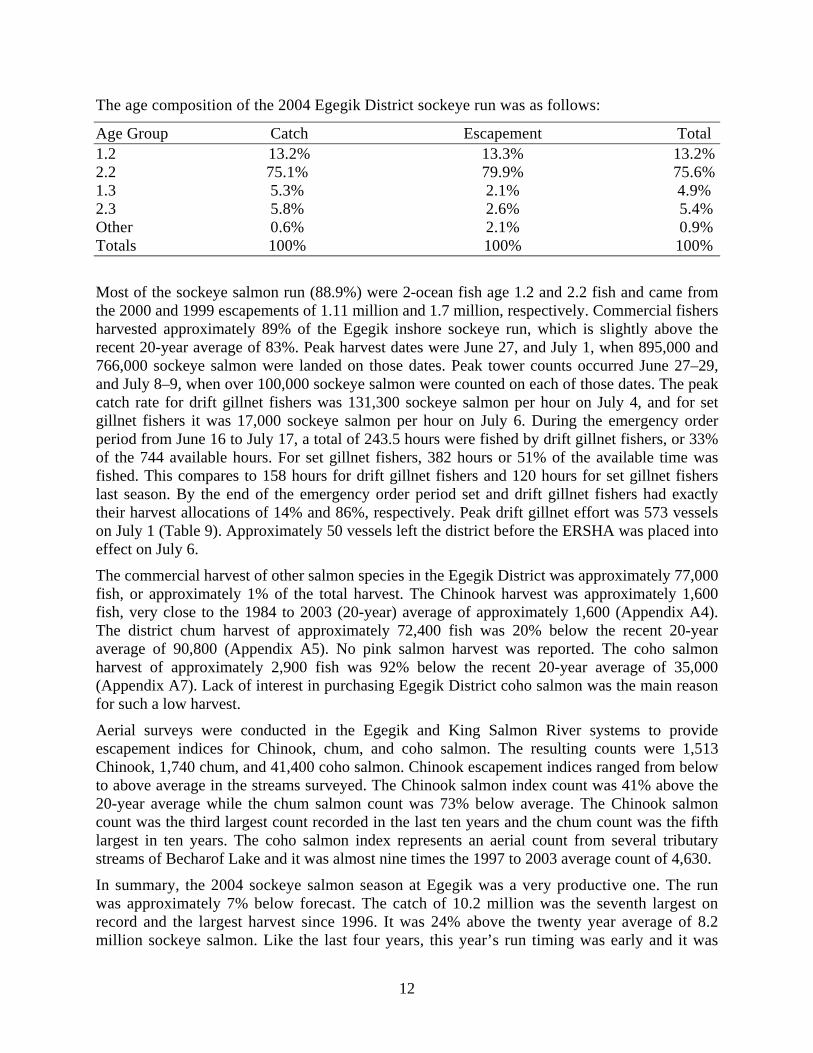
The age composition of the 2004 Egegik District sockeye run was as follows:
Age Group Catch Escapement Total 1.2 13.2% 13.3% 13.2% 2.2 75.1% 79.9% 75.6% 1.3 5.3% 2.1% 4.9% 2.3 5.8% 2.6% 5.4% Other 0.6% 2.1% 0.9% Totals 100% 100% 100%
Most of the sockeye salmon run (88.9%) were 2-ocean fish age 1.2 and 2.2 fish and came from the 2000 and 1999 escapements of 1.11 million and 1.7 million, respectively. Commercial fishers harvested approximately 89% of the Egegik inshore sockeye run, which is slightly above the recent 20-year average of 83%. Peak harvest dates were June 27, and July 1, when 895,000 and 766,000 sockeye salmon were landed on those dates. Peak tower counts occurred June 27–29, and July 8–9, when over 100,000 sockeye salmon were counted on each of those dates. The peak catch rate for drift gillnet fishers was 131,300 sockeye salmon per hour on July 4, and for set gillnet fishers it was 17,000 sockeye salmon per hour on July 6. During the emergency order period from June 16 to July 17, a total of 243.5 hours were fished by drift gillnet fishers, or 33% of the 744 available hours. For set gillnet fishers, 382 hours or 51% of the available time was fished. This compares to 158 hours for drift gillnet fishers and 120 hours for set gillnet fishers last season. By the end of the emergency order period set and drift gillnet fishers had exactly their harvest allocations of 14% and 86%, respectively. Peak drift gillnet effort was 573 vessels on July 1 (Table 9). Approximately 50 vessels left the district before the ERSHA was placed into effect on July 6.
The commercial harvest of other salmon species in the Egegik District was approximately 77,000 fish, or approximately 1% of the total harvest. The Chinook harvest was approximately 1,600 fish, very close to the 1984 to 2003 (20-year) average of approximately 1,600 (Appendix A4). The district chum harvest of approximately 72,400 fish was 20% below the recent 20-year average of 90,800 (Appendix A5). No pink salmon harvest was reported. The coho salmon harvest of approximately 2,900 fish was 92% below the recent 20-year average of 35,000 (Appendix A7). Lack of interest in purchasing Egegik District coho salmon was the main reason for such a low harvest.
Aerial surveys were conducted in the Egegik and King Salmon River systems to provide escapement indices for Chinook, chum, and coho salmon. The resulting counts were 1,513 Chinook, 1,740 chum, and 41,400 coho salmon. Chinook escapement indices ranged from below to above average in the streams surveyed. The Chinook salmon index count was 41% above the 20-year average while the chum salmon count was 73% below average. The Chinook salmon count was the third largest count recorded in the last ten years and the chum count was the fifth largest in ten years. The coho salmon index represents an aerial count from several tributary streams of Becharof Lake and it was almost nine times the 1997 to 2003 average count of 4,630.
In summary, the 2004 sockeye salmon season at Egegik was a very productive one. The run was approximately 7% below forecast. The catch of 10.2 million was the seventh largest on record and the largest harvest since 1996. It was 24% above the twenty year average of 8.2 million sockeye salmon. Like the last four years, this year’s run timing was early and it was

13
approximately four days ahead of normal run timing. There were 16 processors that purchased fish in the Egegik District this season. Bay-wide processing capacity became an issue in early July, and for a few days most of the commercial fishers had some sort of catch limit placed on them. Harvest for Egegik set gillnet fishers was actually suspended for a tide or two.
Ugashik District The 2004 inshore sockeye salmon run to the Ugashik District was approximately 3.9 million fish, or 5% less than the forecast of 4.1 million (Table 1). The Ugashik District run was the largest run in eight years. The commercial sockeye salmon catch of approximately 3.1 million fish was also the largest harvest in eight years. The sockeye salmon escapement to the Ugashik River was approximately 776,000 fish, or 9% under the middle of the BEG range of 500,000 to 1.2 million. Comparable inshore returns over the last four cycles, dating back to 1984, have ranged from 3.9 million to 5.4 million fish with an average of 4.5 million, making the 2004 run of 3.9 million 13% below the average for the last four cycle years. (Appendix A14).
Even though there was a 4-day weekly fishing schedule established from June 1 through June 23, initial landings didn’t occurred in the district until June 14 (Table 12) when only a few sockeye and Chinook salmon were landed. The harvest through June 23 was minimal with only 14,400 sockeye salmon harvested. This compares to the 20-year (1984–2003) average cumulative harvest, through June 23, of 65,200. The cumulative catch through June 23 was one fifth of what might have been expected, especially with the earlier run timing observed in Bristol Bay stocks for the last four years.
The preseason forecast for the Ugashik District suggested a harvest of 3.2 million sockeye salmon, which would have been the largest harvest in eight years. Accordingly, commercial fishers were advised that fishing time after June 23 would depend on inriver test fishing results, fishery performance, and tower escapement levels. With this advisory, 23 drift vessels registered for Ugashik on June 24 (Table 9).
Inriver test fishing, which operates about three miles upstream of Ugashik Village, started on June 22 and provided a daily estimate of sockeye salmon passage into the lower part of the Ugashik River. The counting tower project, operating about 24 miles upstream of Ugashik Village, started counting on June 26 or seven days earlier than usual. After the first six days, inriver test fishing results estimated approximately 20,000 fish up the Ugashik River which, when counted at the tower, would place escapement ahead of schedule. The first tower count on June 26 was a partial day’s count and totaled approximately 1,500 fish (Table 22). With a small fleet and anticipated escapement ahead of expected levels, brief fishing periods were scheduled from June 24 to June 26.
The total harvest of approximately 63,000 was recorded over these three days bringing the cumulative harvest to approximately 78,000 which was slightly below the 20-year average of 80,000. Inriver test fishing results were falling off and indicated few fish moving up the Ugashik River. The fishery was rested for two days and then another brief fishing period, 4 hours for drift gillnet fishers and 8 hours for set gillnet fishers, was scheduled on June 29 to check the abundance of fish within the Ugashik District.
The June 29 catch was only about 15,000 sockeye salmon for 43 drift gillnet deliveries and 19 set gillnet deliveries, However the small fleet size enable brief fishing periods to be used over the next few days and a set gillnet only period on July 3 to assess run strength within the Ugashik

14
District. Inriver test fishing was still slow and after fishing a 3-hour drift gillnet period and 6-hour set gillnet period on July 4, the fishery was closed and district test fishing was scheduled. District test fishing results are listed in Table 6. On July 5, there was a good indication of fish between Pilot Point and the inner district marker at Muddy Point, but few fish were observed in the river above the district. This picture changed considerably on July 6 when indices average over 1,000 points above the district (Table 6). A 9-hour fishing period was scheduled for July 7.
The July 7 opening harvested approximately 97,000 sockeye salmon. The catch per drift gillnet delivery was over 2,200 sockeye salmon and was the highest on record for this date. Inriver test fishing also picked up on July 7 and averaged 2,400 index points (Table 27). Inriver test fishing continued to show a good number of fish moving up the river over the next seven days and fishing periods were scheduled accordingly. The Ugashik tower count was improving as well and went from 45,000 on July 8 to 619,000 on July 14. From July 8 through July 14 the daily commercial harvest ranged from 170,000 to 681,000 sockeye salmon and averaged approximately 342,000 fish per day. The cumulative harvest totaled approximately 2.8 million, or 86% of the preseason forecast.
Fishing periods were scheduled through 9:00 a.m. July 17 when the fishery reverted to the fall fishing schedule of 9:00 a.m. Mondays to 9:00 a.m. Fridays. By July 17 the cumulative catch was approximately 3 million sockeye salmon, while the escapement tower count reached 659,000 fish.
Sockeye landings continued through July and into August with the final catch totaling approximately 3.1 million. The final Ugashik River sockeye escapement count was 776,000 fish when the project ended on July 24. Additionally, about 39,000 sockeye were counted during aerial surveys of the Dog Salmon and King Salmon rivers (Appendix A14).
By the end of emergency order period, setnetters had caught approximately 12% of the sockeye harvest and drift gillnet fishers took 88%. This breakdown is a 2% discrepancy from the allocation. To achieve the established allocations, approximately 53,000 fish in the set gillnet catch should have gone to the drift gillnet harvest. Between June 23 and July 17, setnetters fished a total of 214 hours, or 62 hours more fishing time they had last year, while drift gillnetters fished a total of 151 hours, or 14 hours less fishing time than they had last year.
The peak escapement counts at the counting towers occurred July 9 though July 13 when over 73,000 sockeye salmon were counted on each of those days. The 2004 escapement appeared to be more like the typical Ugashik escapement pattern with most of the escapement occurring over a few days. The escapement sex ratio was approximately 53% males to 47% females.
The age composition of the 2004 Ugashik District sockeye salmon run was as follows:
Age Group Catch Escapement Total 1.2 40.4% 47.6% 41.9% 2.2 35.9% 28.5% 34.4% 1.3 17.6% 19.3% 18.0% 2.3 5.8% 4.0% 5.4% Other 0.3% 0.6% 0.3% Totals 100% 100% 100%
The commercial harvest of other salmon species totaled approximately 70,000 fish or 2% of the district’s total harvest. The harvest of 868 Chinook salmon was 59% below the 20-year

15
(1984-2003) average of 2,133 (Appendix A4). Ugashik Chinook salmon escapement indices were above average in the Dog Salmon and Ugashik Rivers, but below average in the King Salmon River. The Ugashik index count of 5,092 Chinook salmon was 9% above the 1984 to 2003 average of 4,670. The chum salmon harvest of approximately 64,000 fish was 11% below the average (Appendix A5). The chum salmon escapement index count of 33,500 was 10% above the 1984 to 2003 average count of 30,550. The coho salmon harvest of approximately 4,700 fish was well below the 20-year average of 22,000, but there was very little commercial effort for Ugashik coho salmon again this year (Appendix A7). The coho salmon escapement index count of 5,280 for the Upper and Lower Ugashik Lakes was slightly above the 1996 to 2003 average count of 5,035, but it was the second highest index count recorded for the lakes during this time. The timing of this survey was good with most coho salmon still schooled up below creek mouths. Pink salmon harvest in the Ugashik District was 120 fish this season (Appendix A6).
The Ugashik District fishery harvested approximately 79% of the sockeye return to the district, which is slightly above the 20-year (1984–2003) average removal rate of 69%. Peak catch per hour occurred on July 10 for drift gillnet fishers, when approximately 580,000 sockeye salmon were landed in 12 hours, or 48,300 fish per hour. For set gillnet fishers, their peak catch occurred on July 7 when approximately 49,000 sockeye salmon were landed in 9 hours, or 5,500 fish per hour. Peak catch per landing occurred on July 7 for drift gillnet fishers and on July 9 for set gillnet fishers when approximately 2,200 and 477 sockeye salmon, respectively, were taken per delivery.
A total of 15 buyers operated in the district during the season (Table 28), or three more than last year. Nearly all of the catch was tendered to other districts for processing. For a few days in early July, there were some delivery limits placed on Ugashik commercial fishers by some of the processors, and one processor quit buying fish from set gillnet fishers at Ugashik Village on July 10 because of the poor condition of the fish.
Nushagak District The 2004 Nushagak District total inshore sockeye salmon run was approximately 8.2 million fish, 9% over the preseason forecast of 7.3 million fish (Table 1). Commercial sockeye harvest, in the Nushagak District, reached 6.1 million, 13% above the preseason projected harvest of 5.4 million sockeye. Total sockeye escapement in the district’s three major river systems was 2.15 million or 14% over the combined mid-range escapement goal of 1.88 million. However, escapement into the Igushik River failed to reach the 150,000 lower end of the escapement goal range for the second time in three years.
In December 2003, the Alaska Board of Fisheries convened in Anchorage to consider proposed regulatory changes for the Bristol Bay salmon and Togiak herring fisheries. Changes for the Nushagak District included an expanded area for harvesting Chinook salmon during directed Chinook openings, a mechanism for shutting down either gear type if the harvest of sockeye in a directed Chinook opening exceeded a 2:1 sockeye to Chinook ratio, as well as new regulations about towing and fishing while grounded.
Peak Chinook salmon production in the early 1980’s resulted in record commercial harvests and growth of the sport fishery. Declining run sizes and the question of how to share the burden of conservation among users precipitated the development of a management plan for Nushagak Chinook salmon. Since the plan was adopted in 1992, the Nushagak-Mulchatna Chinook Salmon

16
Management Plan (NMCSMP) has governed management of the Nushagak Chinook salmon fisheries (5 AAC 06.361). The plan was amended in 1995, 1997, and 2003.
The purpose of this management plan is to ensure an adequate spawning escapement of Chinook salmon into the Nushagak River system. The plan directs the department to manage the commercial fishery for an inriver goal of 75,000 Chinook salmon past the sonar site at Portage Creek. The inriver goal provides: (1) a biological escapement goal of 65,000 spawners, (2) a reasonable opportunity for inriver subsistence harvest and (3) a guideline sport harvest of 5,000 fish. The plan addresses poor run scenarios by specifying management actions to be taken in commercial, sport, and subsistence fisheries, depending on the severity of the conservation concern. Management decisions are heavily dependent upon the estimates of inriver Chinook salmon escapement provided by sonar counters located at Portage Creek on the lower Nushagak River.
Trends in age composition of Chinook spawning escapements in 1995 and 1996 raised concerns about the quality of Chinook escapements in the Nushagak River. The proportion of large (age-5 through age-7) fish was less than desired, and the age composition of the escapement during the first half of the run differed substantially from the escapement during the second half of the run. In the early portion of the run, male Chinook salmon of the younger age classes comprised the majority of the escapement, while the older age classes became prevalent in the latter portion of the escapement. Differences in age composition between escapement and total run, and between early- and late-season escapement, result from size-selective harvests. To address this concern, the department adopted a strategy of allowing unfished pulses of Chinook into the Nushagak River before opening a commercial period. Allowing untargeted fish into the river was intended to lessen the effects of selectivity in the commercial fishery while allowing fish with a natural age distribution to enter the river. In November 1997, additional language, directing the department to allow pulses of Chinook salmon into the Nushagak River that were not exposed to commercial fishing gear, was added to the NMCSMP.
The department adjusts commercial fishing time and area to harvest Chinook salmon surplus to the inriver goal. Management decisions are based on the preseason forecast and inseason indicators of run strength, including commercial harvest performance, subsistence harvest rates and inriver passage rates by the sonar. During the last two years, managers have used directed Chinook openings early in June to harvest fish when a surplus appears to be available. Because these openings occur usually during the first third of the run, it allows for the harvest of more parts of the return at a lower level but also has the potential for complicating management if the second half of the return is significantly weaker than the first half. When a surplus is forecasted, early commercial openings provide for more time between openings allowing unfished pulses of fish to move through the district, better quality of fish in the harvest, and harvest spread over a larger portion of the return.
The 2004 Nushagak District Chinook salmon forecast was 145,000 fish. With an inriver goal of 75,000 fish, and average sport and subsistence harvest of 6,000 fish below the counting station, 64,000 Chinook would theoretically be available for commercial harvest. In 2003, a new strategy was adopted to address concerns about incidental Nushagak sockeye catch in directed Chinook openings. This strategy focused on having directed Chinook openings as early and as often as escapement and the management plan would allow. For both 2003 and 2004, there were two directed Chinook openings but the early return of sockeye forced managers to switch to sockeye management by June 20. In 2004, the unexpected abundance of Chinook allowed managers to

17
relax mesh restrictions and let permit holders target Chinook or sockeye for the remainder of the season.
The sonar station at Portage Creek was operational on June 8. The daily Chinook counts started off above expectations and continued to be high for the first seven days of counts. Based on this escapement, the first commercial opening was announced for June 14. This directed Chinook opening was for five hours and resulted in a harvest of approximately 7,500 Chinook from 56 deliveries (Table 13). Chinook escapement past the sonar counter was slow for the next two days but based on the high catch per unit effort and some subsistence information, another directed Chinook opening was announced for June 17. The second opening was for four hours and resulted in a harvest of approximately 14,000 Chinook and 5,000 sockeye from 149 deliveries.
Although the harvest of 15,000 Chinook in one four hour period was higher than expected, the escapement past the sonar counters continued at a steady pace on the 17th and 18th of June before virtually doubling on June 19th when the daily escapement exceeded 20,000 Chinook. The escapement of sockeye also began to increase. On the morning of June 20, the fleet was advised they were on short notice and that the earliest possible opening was June 21 at 3:30 a.m. Chinook escapement continued to be strong during the day of the 20th, and an opening was announced for 3:30 a.m. on June 21. Since sockeye escapement had also increased, the focus now was on sockeye management, but no mesh restriction was imposed for any further opening in 2004.
Chinook escapement and harvest continued at a surprisingly steady pace; the peak escapement was on June 19 when 20,395 Chinook were counted and there were two other days when escapement exceeded 10,000 Chinook. The total Chinook escapement for 2004 was 116,400; the total commercial harvest was 93,414. Although subsistence and sport harvest numbers are not yet available, it is safe to assume that the total Chinook run to the Nushagak District exceeded 215,000 fish and was 48% above the preseason forecast.
From 1986 to 1998, the Nushagak District sockeye fishery was managed to achieve a biological escapement goal range of 340,000 to 760,000 spawners in the Nushagak River and a range of between 700,000 to 1.2 million spawners in the Wood River. The Alaska Board of Fisheries modified the Wood River Special Harvest Area Management Plan in March of 1999 to include language that directed the department to manage the Nushagak River for an OEG of no less than 235,000 sockeye when the ratio of Wood River to Nushagak River sockeye was projected to be greater than 3:1. This OEG was adopted by the Board of Fisheries for the 1999 and 2000 seasons to give “economic relief” to the Nushagak District permit holders by allowing a higher exploitation rate on the stronger Wood River sockeye stock in the district. The plan was modified again in January 2001 to allow for a “variable” escapement goal for the Nushagak River and for a change in the Wood River escapement goal range to .7 to 1.5 million with a mid-range goal of 1.1 million. This mandated that managers use the 340,000 minimum goal when the preseason forecast for the Nushagak River was greater than 1 million sockeye and use the 235,000 OEG minimum when the preseason forecast was less than 1 million sockeye. The department was required to reevaluate the Nushagak return during the first week of July and adjust the escapement goal accordingly if the projection changed from the preseason forecast. The 2004 preseason forecast for the Nushagak River was 1.8 million sockeye, therefore, the Nushagak River would be managed for the BEG range of 340,000 – 760,000 spawners at least until the run was reassessed in early July.

18
The preseason forecast for the inshore sockeye run to the Nushagak District totaled 7.3 million fish (Table 1), which was 24% higher than the 20-year average actual run of 5.9 million sockeye (Appendix A15). Strength of the forecasted Wood River run (4.5 million) was 30% above the 1984–2003 average actual return, while the Nushagak River sockeye run (1.8 million) was expected to be 20% greater than the 20-year average actual return. The forecasted return to Igushik River (1.08 million) was virtually the same as the 1984–2003 average return of 1.06 million (Appendix A16).
There are no tools available to manage Nushagak and Wood River stocks independently in the commercial district because run timing and migratory routes overlap considerably. The Wood River Special Harvest Area Management Plan was adopted in 1996 as a means to conserve coho salmon in the district while continuing to harvest surplus sockeye salmon in the Wood River. The regulatory framework of the WRSHA plan was used by the department in an emergency regulation during the 1997 season for sockeye management due to a large disparity in run strengths between Wood and Nushagak River sockeye salmon stocks. The Board then formally modified the plan in November 1997 to provide a stock specific management tool to target Wood River sockeye salmon. The plan allows managers to open the Wood River Special Harvest Area for the conservation of Nushagak River sockeye salmon. The Nushagak River sockeye escapement peaks slightly earlier than escapement in Wood River. If stock proportions in the escapement represent stock abundance in the district and harvests are not stock selective, delaying the sockeye openings should help to conserve the Nushagak stocks. However, without an additional stock-specific means to exploit Wood River sockeye, surplus Wood River sockeye cannot be harvested without sacrificing the Nushagak River escapement goal particularly when the Wood River run is on the order of three (or greater) times as large as the Nushagak River run.
For at least the last sockeye life cycle, Wood River runs have been more than three times larger than Nushagak River runs due to high production in the Wood River system and decreased production in the Nushagak River system. Throughout these years, the department has attempted, relatively unsuccessfully, to keep sockeye escapement in the Wood River from exceeding the upper end of the escapement goal range, while simultaneously attempting to achieve at least the lower end of the BEG range in the Nushagak River. A ratio of 2.5:1 (Wood River to Nushagak River sockeye) was forecast for 2004. To conserve Nushagak stocks, the department plan was to limit commercial fishing time early in the sockeye run. In accordance with the “variable” escapement goal for the Nushagak River and based on the preseason forecast, the department was managing for the BEG range of 340,000 – 760,000 sockeye in the Nushagak River while attempting to keep the Wood River sockeye escapement below 1.5 million, the recently adopted upper end of its BEG range.
The sonar project for the Nushagak River was operational on June 8, and the counting project on the Wood River was in operation on June 17. On June 19, there was an apparent push of fish beginning past the Wood River counting towers. In response to this increase in escapement the drift fleet was placed on short notice and the set net fleet was given a 6-hour opening on June 20. A second set net only opening was announced for the early morning of June 21 and a 4-hour drift opening was also announced. The idea was to have a short drift opening to see if fish were building up in the district. The apparent push of fish from June 19 and June 20 quickly diminished and the harvest from the drift and set net openings was not indicative of a large buildup of fish in the district.

19
Based on constraints in the management plan there are only two times a day that a set net fishery can start. One of these times occurs during the 13-hour period between the last announcement time at 8:00 p.m. and the next announcement at 9:00 a.m. the following morning. The status of escapements and fish movement in general can change quite rapidly in 13 hours, especially early in the season. In 2004, managers used set net only openings in the morning as a tool to get information on fish movement but also to be ready to respond to such movement. This gave managers a window of time in the morning to gather information on catch and escapement from the previous day and maximum flexibility to respond to any developments in fish movement that occurred overnight, with a set net extension and or a drift opening if necessary. Set net only openings on June 22 and June 23 harvested relatively few fish but escapement increased a bit on the June 23 so a drift opening was announced for June 24. With the strong forecast, the prospect of limits later in the season, and information from genetics samples in the Port Moller test fishery indicating a strong return to the Wood and Nushagak Rivers, managers were more aggressive than escapement would otherwise have warranted.
Between June 25 and June 29, set net fishing was extended in 25-hour blocks and drift fishing was allowed everyday for 3–6 hours. The daily escapement past the Wood River towers on June 29 was 101,000 sockeye bringing the cumulative total to 354,000. It appeared the salmon were now arriving in large numbers and managers began fishing the drift fleet two periods a day for 5 to 10 hours at a time; the set net fleet was extended until further notice. At this point, managers were trying to control escapement and distribute fish throughout the district so the set net fleet would have harvest opportunity. This was done by giving the set net fleet more fishing time than the drift fleet and by fishing with the drift fleet mostly on the ebb.
Fishing continued on this schedule until the end of the allocation period on July 17. The only exception to the schedule was when several processors announced they would be placing their fleets on limits. This prompted managers to extend the drift opening in progress for 18 hours with the intent of maximizing fishing opportunity for the fleet while they were on limits. After one 18-hour extension, managers returned to the two openings per day schedule until July 17. On July 17, both drift and set gillnets were extended until further notice and fishing did not officially close until September 30. Fishing effort did slow considerably in August and was sporadic until the last delivery in early September.
Set gillnet only fishing in the Igushik section began on June 16 and was opened until further notice. With a forecast of over a million fish for the Igushik River, and the set net fleet limited by processor requirements to deliver fish offshore, it was expected that the set net fleet would not be able to harvest all of the fish surplus to escapement needs in the Igushik River. Managers decided to use the set net fleet as a test fishery and anticipated putting the drift fleet in the Igushik section as indicated by increased set net harvest and escapement. Unfortunately, the escapement never warranted a drift opening in the Igushik section and by early July, the set net opening was changed from “open until further notice” status to 6-hour openings from July 5–7 to complete closure on July 8. The failure of the Igushik return is confusing and a cause for concern. The Igushik River escapement has failed to reach the mid-range for three consecutive years and has failed to reach the lower end of the escapement goal range in two of the last three years.
The final harvest percentages in the Nushagak District were 84% drift, 15% Nushagak Section set, and 1% Igushik Section set (Appendix A9). The sockeye salmon escapement into the Igushik River was 109,000, less than half of the mid-range goal of 225,000. The Nushagak sockeye salmon escapement was 490,000 or 89% of the mid-range goal of 550,000. The Wood River

20
sockeye salmon escapement was 1.54 million, 40% more than the mid-range goal of 1.1 million. The total sockeye salmon harvest in the Nushagak District was 6.1 million.
The Nushagak Coho Salmon Management Plan (5 AAC 06.368) established spawning and inriver escapement goals and provides guidance to the department in managing sport, subsistence, and commercial fisheries that harvest coho salmon. The plan directs the department to manage the commercial fishery in the Nushagak District to achieve an inriver run goal of 100,000 coho salmon in the Nushagak River. The inriver run goal provides for a biological escapement goal of 90,000 spawners and 10,000 additional fish for upriver sport and subsistence harvests. Based on parent year escapement of approximately 210,000 spawners in 2000 and recent production trends, the 2004 coho return was expected to be strong. The coho plan directs the department to close “the directed coho salmon commercial fishery” by July 23 when the total inriver run in the Nushagak River is projected to be less than 100,000 but at least 60,000 coho. In 2004 the sonar project on the Nushagak River ceased operation on August 17. The count never fell significantly behind the 100,000 fish escapement curve and commercial fishing remained open continuously. Effort in the commercial fishery was limited and sporadic. The coho escapement past the sonar station was 152,613, well above the 100,000 goal. Final reported commercial harvest of coho salmon was approximately 50,000 fish (Table 13, Appendix A23).
Togiak District The 2004 inshore sockeye run of 593,334 fish was the thirteenth largest run returning to the Togiak District in the last 20 years (Appendix A17) and represented 61% of the preseason forecast. District sockeye harvest was 438,643 salmon, the tenth largest since 1984. Escapement into Togiak Lake was 129,462, within the range (100,000–200,000) of the Biological Escapement Goal (BEG).
The Togiak District is managed differently than other districts in Bristol Bay. This district uses a fixed fishing schedule of three days per week in the Kulukak Section, four days per week in Togiak River Section, and five days per week in the Osviak, Matogak and Cape Peirce Sections. The Togiak District Salmon Management Plan (TDSMP) adopted by the Alaska Board of Fisheries in January 1996 added 36 hours to the weekly schedule for the Togiak River Section between July 1 and July 16. This schedule is adjusted by emergency order, as necessary, to achieve desired escapement objectives. In addition, the TDSMP restricts the transfer into the Togiak District by prohibiting permit holders that fished in any other district from fishing in the Togiak District until July 24. Conversely, it prohibits permit holders that have fished in the Togiak District from fishing in any other Bristol Bay district until July 24.
The 2004 inshore run to the Togiak River was forecasted at 812,000 sockeye salmon (Table 1), of which 81% were projected to be 3-ocean fish, the remaining 19% were predicted to be 2-ocean fish (Table 2). With a midpoint escapement goal of 150,000 sockeye for Togiak Lake, approximately 662,000 sockeye would potentially be available for harvest in the Togiak River Section. A harvest of this size would have been 150% of the 20-year average. Smaller sockeye runs to other drainages in the district (primarily the Kulukak River) occur, but these are not included in the preseason forecast because age composition and escapement data are not complete. Unofficially, a contribution of 58,000 sockeye to the district harvest was projected from drainages other than the Togiak River.
As for Chinook salmon in the Togiak District, no formal forecast is issued. Recently, Chinook run strengths district-wide have declined from a high of almost 62,000 in 1983, to a low of less

21
than 18,000 in 2002 (Appendix A20). Chinook escapements in the Togiak River drainage fell short of the regulatory escapement goal (10,000) from 1986 through 1992. The Chinook escapement goal was reached from 1993 to 1995 with extensive commercial fishing closures and mesh size restrictions. In 1996, with only minor reductions in the weekly fishing schedule, Chinook escapement again fell short of the goal. The Chinook escapement goal in the Togiak River has been achieved regularly since that time. Reducing the weekly schedule to 48 hours per week in late June seems to provide a good balance between commercial fishing time and closures that allow Chinook escapement to be achieved.
Management strategy for Chinook salmon the last seven years has been to reduce the weekly fishing schedule in sections of the Togiak District during the last two weeks of June. The Kulukak Section was reduced to 48 hours of fishing time and was aimed at decreasing the exploitation of Chinook salmon. In the Togiak River Section, the regularly scheduled periods were reduced by 24 hours. The western sections, Cape Peirce, Osviak, and Matogak, remained open for the regularly scheduled periods.
Commercial fishing opened in the district with a regular weekly schedule on June 1. However, the first landings of the 2004 season were made on June 14 (Table 15). For that week, 282 Chinook salmon were caught. The following week was the first of the season to which the reduced schedule was applied. The commercial harvest and effort for this week was below average with 2,154 Chinook salmon, but represented the strongest mean daily catch of the season. The largest daily catch occurred on June 22, when 1,237 Chinook were harvested.
The fishery reopened on June 28 and was reduced with a split schedule. The season’s cumulative catch after the last delivery on Wednesday, June 30 was 4,293 Chinook salmon. Although this is lower than average, it is the largest catch for this time period in the last five years. The close of fishing on the 30th of June marked the end of active management for Chinook salmon. Fishing reopened Friday, July 2 with the focus on sockeye salmon management.
The total Chinook harvest for the Togiak River Section was 7,707 fish (Table 16), with an additional 1,642 caught in the remainder of the Togiak District (Table 17, 18, 19). The total number of Chinook salmon caught in the Togiak District was 7% higher than the 10-year average. Escapement for the Togiak River and tributaries was above the aerial survey goal of 10,000 sockeye with a survey count of 12,324. An estimated 1,188 Chinook migrated into the Kulukak River and an additional 2,478 fish were estimated in the Quigmy, Osviak, Matogak, Slug, Negukthlik and Ungalikthluk Rivers. Commercial exploitation of the Togiak River stock was 63%; the district-wide commercial exploitation rate was 37%. Figures are not yet available for sport or subsistence harvests so the preliminary exploitation rates do not include those numbers. District-wide escapement was 15,990, 15% higher than the 20-year average (Appendix A20.) Total run size was 25,919, which is 101% of the 10-year average and 88% of the 20-year average.
Commercial fishing for sockeye opened with the regularly scheduled fishing periods on June 1. Fishing effort remained below average during the following week. The first deliveries of the season occurred on June 14.
As mentioned above, the last two weekly fishing periods in June for the Togiak River and Kulukak sections were reduced for Chinook conservation. After July 1, regularly scheduled fishing periods in the Kulukak Section were reduced to 48 hours for conservation of Kulukak River sockeye. This reduction has become common practice in recent years due to a shift in

22
effort to the Kulukak Section and conservation concerns for the Kulukak River sockeye stock. By the end of June, the District sockeye harvest was 22,000 fish, which was average but about half of the expected level.
Operation of the Togiak counting towers began on July 3. Commercial fishing reopened on the July 5 as scheduled. The Kulukak Section remained on a reduced schedule for the conservation of Kulukak river sockeye salmon. Permit holders were advised to listen early in a week for potential changes in the fishing schedule for the Togiak Section. Although both catch and escapement were behind the expected levels, the escapement was building normally. Additionally, the escapement was only off by one day, which could be accounted for by run timing. Therefore, the Togiak fleet fished the normal schedule closing on July 10. By July 10, the cumulative escapement past the towers was over 15,800 sockeye (Table 23). The total harvest by the July 10 was 122,000 with the majority caught in the preceding week. There was some fishing effort in the Osviak and Matogak sections during two weeks of July. A total of 420 sockeye salmon, were reported (Tables 18 and 19).
As with the previous week, when fishing commenced on Monday July 12, the Kulukak Section was reduced to 48 hours and the Togiak Section was on “stand-by”. By the afternoon of July 14, escapement past the towers on the Togiak River was over 22,290 sockeye and catch was reported to be nearly 200,000. On July 16 the fishing schedule changes, by regulation, to close at 9 a.m. Friday for the remainder of the season unless otherwise adjusted. Therefore, the Togiak River Section closed on Friday, July 16.
For the week of July 19, the Kulukak Section was reduced to 48 hours and the Togiak Section was once again on “stand-by”. On July 21, there was a pulse of escapement past the counting towers with a daily total of almost 11,000 fish. This brought the total escapement to over 53,000 sockeye. Catch in the district was strong with over 300,000 fish. Although catch and escapement were behind schedule, the escapement was on track to fall within the range of the BEG. Therefore, the district closed as scheduled Friday, July 23. The last deliveries from the Kulukak Section were made July 21 because it was the last day of tender service in the area. The season total for the Kulukak Section was 80,204 sockeye (Table 17).
The Togiak District opened to all permit holders on July 24; however, the district was not open to fishing until Monday, July 26. Although there seemed to be a lot of interest in fishing there, deliveries did not increase. There are no requirements for registration after July 24 so increased effort is difficult to assess.
Fishing reopened on July 26 in all sections however, the Togiak Section was once again placed on “stand-by”. By Wednesday, July 28, the escapement past the Togiak counting tower was over 89,190. Escapement remained on track to finish well within the range of the BEG. Total catch in the district was over 390,000 sockeye. The fishing schedule in all sections closed as scheduled.
The district opened for fishing Monday, August 2 following the same strategy as the previous weeks. By Wednesday, August 4, the cumulative escapement was over 117,000 sockeye, within the range of the BEG. Total catch for the district was over 420,000 sockeye. The Togiak River Section closed as scheduled Friday, August 6. The counting towers ceased operations August 7 after counting a season total of 129,462 sockeye.
On Monday, August 9, the district opened on the fall schedule that would dictate the remainder of the season. All but one processor had withdrawn from buying by this time and the focus of the

23
fishery was on coho salmon. The 2004 sockeye harvest in the Togiak District was 438,700, 66% of the expected amount available for harvest.
This year’s directed coho fishery was the first since 1998. Parent year escapement in 2000 was based on incomplete aerial survey data. Final operations reports from processors indicated that there were 15,467 coho salmon caught by the last day of fishing, September 7 (Table 15). Due to poor survey conditions and flight availability problems, the Togiak District was not surveyed to assess coho escapement in 2004.
The 2004 sockeye harvest in the Togiak District was 438,700, the tenth highest in the past 20 years (Appendix A3); the total sockeye salmon run also ranked 13th among the last 20 years (Appendix A18). Commercial Chinook harvest was 98% of the 10-year average, while harvest of chum and coho were 66% and 73% respectively of the 10-year averages (Appendices 20, 21, 24). Although aerial surveys to assess escapement on most of the Togiak River could not be performed due to weather, 25,219 sockeye were observed in addition to the 129,462 sockeye that were counted at the towers below Togiak Lake. Therefore, total escapement in the Togiak District was 154,681 which is sufficient escapement. No sockeye surveys were conducted for the Kulukak River. Aerial spawning ground surveys for Chinook salmon exceeded the Togiak River drainage goal of 10,000 with a count of 12,324. No Coho salmon escapement surveys were conducted in 2004 due to weather.
2004 SUBSISTENCE SALMON FISHERY In spite of numerous social, economic, and technological changes, Bristol Bay residents continue to depend on salmon and other fish species as an important source of food. Residents have relied on fish to provide nourishment and sustenance for thousands of years. Subsistence harvests still provide important nutritional, economic, social, and cultural benefits to most Bristol Bay households. All five species of salmon are utilized for subsistence purposes in Bristol Bay, but the most popular are sockeye, Chinook, and coho. Many residents continue to preserve large quantities of fish through traditional methods such as drying and smoking, and fish are also frozen, canned, salted, pickled, fermented, and eaten fresh.
REGULATIONS Permits are required to harvest salmon for subsistence purposes in Bristol Bay. Since 1990, under state regulations, all Alaska State residents have been eligible to participate in subsistence salmon fishing in all Bristol Bay drainages (but see below). In 2004, with two exceptions, only gillnets were recognized as legal subsistence gear. In the Togiak District, spear fishing was also allowed. In 1998, the Board of Fisheries adopted new regulations for the taking of “redfish” (spawned sockeye salmon) in portions of the Naknek District. Gillnets, spears, and dipnets may be used along a 100 yard length of the west shore of Naknek Lake near the outlet to the Naknek River from August 20 through September 30; at Johnny’s Lake from August 15 through September 25; and at the mouth of the Brooks River from October 1 through November 15. In the Bristol Bay Area in 2004, gillnet lengths were limited to 10 fathoms in the Naknek, Egegik, and Ugashik rivers, Dillingham beaches, and within the Nushagak commercial district during emergency openings. Up to 25 fathoms could be used in the remaining areas, except that nets were limited to 5 fathoms in the special “redfish” harvest areas in the Naknek District.
In Dillingham and the Naknek, Egegik, and Ugashik rivers, subsistence fishing was limited to several fishing periods per week during the peak of the sockeye run. All commercial districts

24
were open for subsistence fishing during commercial openings. In addition, all commercial districts were open for subsistence fishing in May and September, from Monday to Friday. In recent years, declining Chinook and coho stocks resulted in longer commercial closures and some residents had an increasingly difficult time obtaining fish for home use. The Nushagak commercial district, starting in 1988, has been opened for subsistence fishing by emergency order during extended commercial closures.
On May 21, 2001, Deborah Liggett, the superintendent of Lake Clark National Park and Preserve, announced that the National Park Service (NPS) was prohibiting subsistence fishing with nets in the park and preserve, including all of Lake Clark, except by federally qualified local rural residents. This prohibition was a new enforcement action of a NPS regulation and applied to anyone who was not a permanent resident of Iliamna, Lime Village, Newhalen, Nondalton, Pedro Bay, or Port Alsworth, or who did not have a Section 13.44 subsistence use permit issued by the park superintendent.
The Alaska Department of Fish and Game has continues to issue Bristol Bay subsistence salmon permits to any Alaska resident who requests one. However, the department informs permit applicants that unless they live in one of the above-named communities or have a 13.44 permit, they need to take this NPS closure into account when they subsistence fish in waters of the park and preserve. The department also informs permittees that waters outside of national park and preserve boundaries remain open for subsistence salmon fishing to all permit holders.
INSEASON MANAGEMENT Due to extended closures to the commercial fishery in the Nushagak commercial fishing district, an emergency order opened the Nushagak commercial fishing district to subsistence salmon harvesting on 12:01 a.m. June 1, 2004. The commercial district was closed by emergency order to subsistence salmon fishing, except during commercial openings, effective 11:00 p.m. June 13. The commercial district was reopened to subsistence fishing effective 8:00 p.m. June 14. The Igushik Section was closed, except during open commercial fishing periods, by emergency order effective 11 p.m. June 15. The Nushagak Section was closed, except during commercial openings, 11 p.m. June 16, and reopened until further notice on June 17 at 8:00 p.m. The Nushagak Section was again closed to subsistence fishing, except during commercial openings, at 8:00 a.m. June 20. Commercial openings occurred everyday from June 20 until the end of September; therefore, no further emergency subsistence fishing openings were necessary.
Due to an extended closure to the commercial salmon fishery in the Togiak District, the commercial fishing district was opened to subsistence fishing by emergency order from 3:00 p.m. June 25 until 9:00 p.m. June 27, 2004. Subsistence fishing opportunities were available in correspondence with commercial fishing openings in the district for the remainder of the season.
An emergency order opened the Naknek River to subsistence fishing for three 24-hour periods per week, from 9 a.m. Saturdays until 9 a.m. Sundays, from 9 a.m. Tuesdays to 9 a.m. Wednesdays, and from 9 a.m. Thursdays until 9 a.m. Fridays, effective 9 a.m. Thursday, July 1, 2004. An additional 24-hour period was justified because the minimum escapement goal of 800,000 sockeye was nearly assured. An emergency order opened the Naknek/Kvichak commercial fishing district to subsistence fishing for a 48-hour period from 3:00 p.m. Tuesday July 6 until 3:00 Thursday July 8. This was to allow subsistence fishing opportunity when the Naknek/Kvichak District was closed to commercial fishing and commercial fishing was occurring in the Naknek River Special Harvest Area (NRSHA). Additional emergency orders

25
extended this opening to 6:00 p.m. Sunday, July 18. No further commercial fishing occurred in the NRSHA after that date.
In the Egegik District, an additional subsistence fishing period was opened by emergency order when the commercial fishery was closed, from 10 a.m. Friday June 11 until 7:00 a.m. Monday June 14. The department had been informed that some Egegik residents were having difficulty obtaining subsistence fishing locations within the district when the commercial fishery was open. The emergency order provided subsistence fishing time during a commercial closure. Additional subsistence openings in the Egegik District were established by emergency orders from 11:00 a.m. Wednesday, June 16 until 7:00 a.m. Thursday June 17; from 11:30 a.m. June 17 to 7:30 p.m. June 17; from 12:00 noon June 18 to 8:00 p.m. June 18; from 8:30 a.m. Saturday June 19 until 11:30 p.m. June 19; and from 9:30 a.m. to 11:30 p.m. on Thursday June 24.
There were no emergency orders issued for the Ugashik District in 2004.
PERMIT SYSTEM A permit system was gradually introduced throughout the Bristol Bay region in the late 1960s to document the harvest of salmon for subsistence. Much of the increase in the number of permits issued during these years reflects: 1) a greater compliance with the permitting and reporting requirements, 2) an increased level of effort expended by the department in making permits available (including a local system of vendors), contacting individuals, and reminding them to return the harvest forms, and 3) a growing regional population. Most fishermen are obtaining permits and reporting their catches, and overall permit returns have averaged between 85% and 90%. However, fish removed for home use from commercial catches are not included in most reported subsistence harvest totals. Also, fish caught later in the season, such as coho and spawning salmon are probably not documented as consistently as Chinook and sockeye.
In 2004, a total of 1,100 permits were issued for the Bristol Bay Management Area, and of these, 940 (85.5%) were returned to the Department with harvest data (Table 30). The largest number of permits were issued for the Nushagak (511 permits) and Naknek/Kvichak (481 permits) districts. For the Nushagak District slightly more permits were issued in 2004 than the long-term 20-year average (490), due in part to permits being available to all state residents since 1990. Compared to the previous five years and the recent 10-year average, however, the number of permits issued was down for the Nushagak District (recent ten-year average of 528 permits). Fewer permits were issued in the Naknek/Kvichak district in 2002 (471), 2003 (489), and 2004 (481) than in any year since 1990, likely reflecting the National Park Service prohibition against non-drainage residents’ subsistence fishing in the waters of Lake Clark National Park. About the same number of permits were issued for the Egegik District in 2004 (46) compared to the average for the past 10 years (48), while the number issued in the Ugashik District (21) was lower than the recent ten-year average (26). The number of permits issued for the Togiak District in 2004 was 46, similar to recent averages (49 permits on average for 1994–2003) (Appendix A30). However, the number of permits issued in Togiak was lower in 2004 than either 2001 or 2003 (92 permits were issued in both years) when permit data for the Togiak District were supplemented by post-season household surveys conducted by the Division of Subsistence. These surveys were not conducted for 2004 due to lack of funds. Of all Bristol Bay Area subsistence permits issued in 2004, 932 (84.7%) were issued to residents of Bristol Bay communities, and 168 (15.3%) were issued to other Alaska residents.

26
HARVEST The estimated total Bristol Bay subsistence salmon harvest in 2004 was 126,865 fish (Table 30). This number was down slightly from the estimate of 131,667 salmon for 2003 but was higher than the 109,587 salmon estimated for 2002. The 2004 harvest was 6.2% below the recent 10-year average of 134,766 salmon and about 21.7% below the recent 20-year average of 154,454 salmon.
The area-wide Chinook harvest of 18,012 salmon in 2004 was down from the record harvest of 21,231 Chinook estimated for 2003, but was higher than any other estimate since 1997 and exceeded both the recent 10-year average (16,026 Chinook) and 20-year average (14,934 Chinook). The area-wide harvest of 93,819 sockeye salmon was down slightly from the 2003 estimate of 95,690 but higher than the 2002 estimate of 81,088 sockeye (which was the lowest estimated harvest since 1973). The 2004 sockeye harvest was 11.6% below the recent 10-year average of 104,699 sockeyes. Compared to recent 10-year averages, subsistence harvests of pink salmon were up in 2004 (returns of pink salmon to Bristol Bay are higher in even-numbered years than in odd-numbered years). The estimated harvest of chum salmon in 2004 (5,141 salmon) was above the recent 10 year average (4,832 salmon) but the coho harvest of 6,667 salmon was slightly lower than the 10-year average (7,586 salmon) (Appendix A29).
In 2004, the Bristol Bay subsistence salmon harvest was composed of 74.0% sockeye, 14.2% Chinook, 4.1% chum, 2.5% pink, and 5.3% coho salmon. Of the entire Bristol Bay Area subsistence salmon harvest in 2004, residents of Bristol Bay communities harvested 118,936 salmon (93.8%), and other Alaska residents harvested 7,929 salmon (6.2%).
In 2004 as over the last several decades, most of the Bristol Bay Area subsistence harvest was taken in the Naknek/Kvichak (58.6%) and the Nushagak (34.0%) districts. The Naknek/Kvichak total harvest of 74,300 salmon was up from 2003, when the harvest was 63,934 salmon. However, the 2004 subsistence salmon harvest in this district was 3.9% below the recent 10-year average of 77,219 fish and 18.6% below the recent 20-year average of 88,130 salmon (Appendix A29).
In 2004, Kvichak drainage residents, and other permit holders fishing in the Kvichak drainage portion of the Naknek/Kvichak District, harvested an estimated 53,225 sockeye salmon, compared to a recent 10-year average of 48,607 sockeyes and a 20-year average of 62,157 sockeyes. The 2004 subsistence harvest of sockeye salmon in the Kvichak drainage was up notably from 2000 through 2003 but was still below historic levels (the 10-year average harvest from 1984 through 1993 was 75,706 sockeyes). Of Kvichak drainage communities, estimated sockeye harvests were substantially lower at Levelock, Igiugig, and Nondalton compared to recent 10-year averages, and somewhat lower at Port Alsworth (Appendix A30). The number of permits issued to households with Port Alsworth addresses was 25 in 2004 (and 22 in 2002 and 23 in 2003), down from 30 in 2001 and 37 in 2000. This may be the result of seasonal Port Alsworth residents not obtaining permits because of the NPS prohibition against subsistence fishing in Lake Clark by non-local residents (see above). Sockeye salmon harvests by Port Alsworth subsistence permit holders in 2004 totaled 2,455 fish, compared to a recent 10-year average of 2,627 sockeyes, although the 2004 harvest was the highest since 2000. The number of permits issued to households with non-Kvichak drainage addresses was 25 in 2004 (and 24 in 2003), compared to 33 in 2002, 37 in 2001, and 48 in 2000, and the sockeye salmon harvest by these permittees fell to 1,631 (and 1,591 fish in 2003) compared to a recent 10-year average of

27
2,758 sockeye salmon (Appendix A30). The NPS closure is likely at least partly responsible for this change as well.
In the Nushagak District, the total estimated subsistence harvest in 2004 was 43,154 salmon, the third lowest total on record (the total salmon harvest estimate was 38,500 in 1972 and 40,600 in 1966), and the lowest over the last 20 years. It was down substantially from the 2003 estimate of 55,076 fish. The recent 10-year average is 47,968 salmon. The Nushagak Chinook harvest in 2003 of 15,610 exceeded the recent 10-year average of 13,396 Chinook, but was down from the 2003 estimate of 18,686 Chinook, the highest estimate on record. The sockeye harvest in the Nushagak District of 17,491 in 2004 was, by far, the lowest estimate for the district since at least 1964 (the previous low was 22,777 sockeyes in 2002) (Appendix A29). In 2004, subsistence salmon harvests in most Nushagak District communities were lower compared to recent 20-year averages. The 2004 subsistence salmon harvests in the three Nushagak River villages of Ekwok, New Stuyahok, and Koliganek were all down substantially from 2003 (Appendix A31).
The estimated total subsistence salmon harvest for the Togiak District in 2004 of 3,584 fish was lower than both the recent 10-year average (4,400) and the 20-year average (5,260), and was the lowest estimated subsistence salmon harvest for this district since 1997. This likely reflects at least in part the absence of post-season household surveys in Togiak and Twin Hills for 2004, which had increased participation in the harvest assessment program in 2001 and 2003. The estimated subsistence harvest in the Ugashik District in 2004 was 1,116, much lower than the 10-year average of 2,032, and the lowest estimate since 1985. In the Egegik District, the estimated subsistence salmon harvest of 4,711 was the second highest since 1984 and was much higher than the recent ten-year average of 3,133 salmon. The Egegik District had a record-high subsistence harvest of coho salmon in 2004, at 1,423 fish (compared to a recent 10-year average of 590 coho) (Appendix A29).

28
2004 BRISTOL BAY HERRING FISHERY This report reviews stock assessment activities, provides an overview of the Togiak District herring fishery from 1978 to 2003 and summarizes the 2004 season.
The Bristol Bay area includes all waters south of a line, extending west from Cape Newenham, east of the International Date Line in the Bering Sea and north of a line extending west from Cape Menshikof. The Bristol Bay area is divided into three herring fishing districts. The Bay District; including all waters east of the longitude of Cape Constantine, the Togiak District; including all waters between the longitude of Cape Newenham and the longitude of Cape Constantine, and the General District; including all waters west of the longitude of Cape Newenham. Togiak District spans approximately 192 km (Figure 2). Togiak village lies at the center of the district, 108 km west of Dillingham.
Cape Grieg
Alaska Department of Fish and Game
Togiak Herring Fishing District
Cap
eN
ewen
ham
Sect
ion
Pyri
tePo
int
Sect
ion
Hag
emei
ster
Sect
ion
Togi
akSe
ctio
n
Nun
avac
hak
Sect
ion
Kul
ukak
Sect
ion
N
0 30Kilometers
CapeMenshikof
CapeNewenham
CapeConstantine
NushagakBay Kvichak Bay
UgashikBay
TogiakBay
HagemeisterIsland
EgegikBay
For illustration purposes only
Right Hand Pt.Tongue Pt.
Asigyukpak Spit
Cape Peirce
Figure 2.–Togiak Herring District, Bristol Bay.
Pacific herring (Clupea pallasii) have been documented throughout Bristol Bay, but the major concentration returns to the Togiak area each spring to spawn and is the focus of herring sac roe and spawn-on-kelp fisheries. In the Togiak District, herring are commercially harvested for sac roe using gillnets and purse seines while herring spawn on rockweed kelp (Fucus spp.) is harvested by hand.
The herring sac roe fishery began in the Togiak District in 1967, followed by the first fishery for spawn on kelp in 1968. Effort and harvest levels remained low for the first 10 years of the fishery. Increased interest, favorable market conditions, and additional incentives provided by

29
the Fishery Conservation and Management Act of 1976 (the 200 mile limit) resulted in a rapid expansion of the Togiak herring fishery in 1977.
The Togiak herring fishery is the largest in Alaska. From 1984 to 2003, sac roe harvests averaged approximately 20,000 tons, worth an average of $7.7 million annually. Spawn-on-kelp harvests, which have occurred in only 5 of the last 10 years, have averaged 307,000 lbs., worth about $284,000 to permit holders (Appendices B2 and B3). In 2004, sac roe harvests brought $2.5 million to permit holders, the third highest value since 2000. No spawn-on-kelp fishery occurred in 2004.
STOCK ASSESSMENT Since 1978, the department has conducted aerial surveys throughout the herring spawning migration to estimate abundance, timing and distribution of Pacific herring in the Togiak District. Surveys are conducted regularly from mid-April through May each year. Once herring are observed, surveys are conducted daily, weather permitting, until commercial fishing is completed.
Aerial survey techniques used in Togiak have remained largely unchanged since 1978 and are described in Lebida and Whitmore (1985). Herring school surface area is estimated through a handheld tube with a measured grid and a known focal length from a known altitude. Standard conversion factors of 1.52 tons (water depths of 16 ft or less), 2.58 tons (water depths between 16 and 26 ft), and 2.83 tons (water depths greater than 26 ft) per 538 ft2 of surface area are applied to herring school surface areas to estimate the total biomass observed during each flight.
Volunteer test fisheries, originally implemented by the department to estimate roe quality, provide samples for age, size, and sex composition analysis. Samples are also collected from commercial harvest for age composition and size analysis. After the season, results are sometimes used to revise biomass estimates.
The status of the Togiak herring population is considered to be relatively stable. Annual biomass estimates range from 83,000 tons in 1991 to 193,800 tons estimated in 1993 (Appendix B5). Abundance was estimated to be high in the late 1970's, declined in mid 1980's and remained relatively low and stable through 1991. Biomass levels from 1992 to 1994 increased to levels between 150,000 and 200,000 tons and estimates since 1995 range from 121,000 to 146,000 tons estimated after the 2003 season.
From 1984 to 2004, herring were generally first observed in the district in early May, but were observed entering near shore areas as early as April 19 and as late as June 3. Biomass typically increases rapidly and peaks within 1 to 7 days of the first observation. In recent years, it has been difficult to get good surveys during the peak of the harvest; in 2002, the peak survey occurred after the fishery was completed. The herring run appears to be more protracted with lower peak biomass estimates but more herring around for a longer period of time. Except for three years, spawn was first observed any time within 3 days of the first herring observation. Spawning trends differ slightly from those observed for biomass, spawning in all but 2 years accelerated rapidly, peaked from 1 to 4 days after the first occurrence of spawn, spawning continued for a month generally but in less intense spot spawns. Small “spot” spawns have been observed as late as June 14.
Herring ages 2 through 20 have been observed in the Togiak District but herring generally recruit into the fishery at age 5. Herring abundance is related to year class survival. Two major
30
recruitment events have occurred since the State began monitoring the biomass in 1978. The 1977 and 1978 year classes recruited into the fishery in 1982 and 1983 and comprised a substantial component of the biomass until the early 1990’s. Other lesser recruitment events have occurred since that time with the most recent being in 1993 appearing as age-10 herring in the 2004 season.
SAC ROE HERRING FISHERY OVERVIEW Fishing and Industry Participation Unlike most herring fisheries in Alaska, the Togiak sac roe fishery is not a limited entry fishery. Gillnets, purse seines and hand purse seines are legal gear. Since fishing effort is not limited, effort levels can vary substantially each year. Herring market conditions are one of the leading factors influencing effort in a given year, but other factors also influence fleet size. Since the majority of herring permit holders in Togiak participate in other fisheries like Bristol Bay salmon, the health of the salmon market and markets for other fish indirectly affect effort in the herring fishery. Herring prices paid to permit holders the prior year and run timing also affect effort. In the last four years processors have developed cooperative fleets for the purse seine fishery. Processors in conjunction with the coop members exclude entrants into the fishery. This is beginning to happen in the gillnet fleet as well.
Fishing effort in the sac roe fishery increased through the late 1980’s, decreased early in the 1990’s, then increased again to a peak in 1996 and has declined since 1997 (Appendix B1). Gillnet effort increased to 300 vessels in 1989, declined to a low of 75 vessels in 1993, and then peaked in 1996 with 461 vessels and has since declined to a low in 2004 of 54. Purse seine effort increased steadily from 1978 through 1989, when 310 vessels were observed. From 1990 to 1997, the purse seine fleet has fluctuated between 200 and 300 vessels, and has declined to less than 100 vessels since 1998. In 2004, the total number of purse seines was 31, an all-time low.
Reduction in fleet size has led to the development of cooperative seine fisheries that focus on fish with high quality roe rather than on quantity. Reduced fleet size has led to changes in the way the fishery is managed; because fishing is less aggressive, managers can allow 12 hour openings leading to increased selectivity and smaller sets.
Industry participation in the fishery peaked between 1979 and 1982, when 33 processors participated in the herring fishery. From 1987 through 1997, 16 to 22 companies have purchased herring or spawn-on-kelp in Togiak. Over the past 6 years, industry participation has steadily declined to a low in 2004 of 6 companies. Processing capacity on the grounds has also declined from a high of 4,850 tons per day in 1996 to a low in 2003 of 1,920 tons per day.
Gear Specifications The Alaska Board of Fisheries has reduced gear to limit harvesting capacity and control problems with waste. Prior to 1989, gillnet length was restricted to 150 fathoms. Each permit holder was restricted to the use of one legal limit of gear, but up to 300 fathoms could be operated from a fishing vessel. Under these gear allowances, lost and abandoned nets accounted for substantial amounts of waste during some years. In 1989, the Board reduced the legal compliment of gillnet gear to a maximum of 100 fathoms in length per permit holder, restricted the operation from one vessel to 100 fathoms, and granted the department the authority to reduce length to 50 fathoms inseason. The Board transposed this regulation in 1992 when it restricted herring gillnet length to 50 fathoms but granted the department the ability to allow up to 100

31
fathoms of gear by emergency order. This change enabled the department to maintain an orderly fishery, helping ensure roe quality and minimizing potential waste. Gillnet depth remains unrestricted.
In October of 1989, the Board reduced purse seines to 100 fathoms in length and 16 fathoms in depth. In 1995, the Board further restricted purse seine depth to 625 meshes, of which 600 could be no larger than one and one-half inches. Depth was reduced in 1995 to control harvesting capacity. Adjustments in allowable gear have appeared to control waste and preserve order in the fishery without a substantial reduction in harvesting capacity.
Harvest and Management Performance The commercial sac roe and spawn-on-kelp harvests in the Togiak District have been regulated by emergency order since 1981. From 1981 through 1987, informal policies directed the department to ensure that minimum threshold biomass levels were observed before opening the herring fishery, and to manage the fishery so that exploitation did not exceed 20%. In 1988, the Board incorporated the threshold and exploitation rate policies into the Bering Sea Herring Fishery Management Plan (5 AAC 27.060) for Togiak and other Bering Sea fisheries. Herring biomass in Togiak has been estimated at levels well above threshold requirements since 1981.
The average annual exploitation rate for the last 20 years slightly exceeded 20% but for the last 10 years has been 18.8% (Appendix B2). Annual exploitation ranged from 32% to 13.5% and hasn’t exceeded 20% since 1998. Although the sac roe, spawn-on-kelp and Dutch Harbor food and bait fisheries take Togiak herring, only the sac roe harvests were used in calculating exploitation rates from 1981 to 1983. Estimates of herring biomass equivalent to spawn-on-kelp harvests and harvests in the Dutch Harbor fishery were not included when calculating exploitation rates until 1984 and 1988.
Herring purse seine and gillnet sac roe harvests are managed for allocation guidelines set forth in the Bristol Bay Herring Management Plan (BBHMP) (5 AAC 27.865). This plan states that, before opening the sac roe fishery, 1,500 short tons must be set aside for the spawn-on-kelp fishery, and 7% of the remaining available harvest is allocated to the Dutch Harbor food and bait fishery. After the spawn-on-kelp and the Dutch Harbor harvests are subtracted, the remaining harvestable surplus is allocated to the Togiak sac roe fishery: 30% of the harvestable surplus to the gillnet fleet, and 70% to the purse seine fleet. From 1988 through 2000, these percentages were set at 25% gillnet, 75% purse seine. The Board modified these allocation percentages to the current ratio in 2001. To achieve gillnet and purse seine ratios, the Department adjusts fishing time and area for each gear type.
The management plan was modified again slightly by the Board of Fish in December 2003. The Board allowed for the inseason allocation management to be uncoupled after each gear type had harvested 80% of its allocation. The other change allowed up to 50% of the spawn-on-kelp allocation to be reallocated to the sac roe fishery if it was not harvested in a spawn-on-kelp fishery.
The Board of Fisheries and the industry have directed the Department to give product quality and fishery value an equal priority with exploitation objectives. Management Guidelines for Commercial Herring Sac Roe Fisheries (5 AAC 27.059) state the department may manage sac roe fisheries to enhance product value by opening areas in which sampling has demonstrated high herring roe content and large herring size, and to minimize harvest of recruit size herring.

32
The BBHMP also states that the primary objective in the sac roe fishery is to prosecute an orderly, manageable fishery while striving for the highest level of product quality and a minimum of waste. Given these regulations and comments from industry, the department considers maximizing quality and value primary objectives in the Togiak fishery.
The department has used volunteer test fishing as a means to maximize roe harvest quality since 1982. Test fishing procedures developed and became more organized and systematic from 1982 to 1989. By 1990, the department had established standard test fishing areas and sample sizes, coordinated test fishing start times between areas, coordinated and assisted in transporting samples to roe technicians and established criteria required for opening an area. Since then, the department has opened to commercial fishing only areas that have documented high quality roe.
Development of test fishing procedure sped the availability of results, reduced time required between test fishing and opening an area to commercial fishing, and helped ensure high roe quality in harvests. Average mature roe percentage increased from a 10-year average of 9.45% (1984–1993) to 10.04% (1994–2003). However, average mature roe for the last three years declined to 9.96%. There is some indication the recent downturn in roe percentage of purse seine caught herring is due to increased post-season scrutiny. The inseason roe percentages have been much higher, but final percentages have been much lower.
As an indirect result of test fishing procedures, gillnet harvest area was gradually reduced in the late 1980’s and early 1990’s due to lack of successful test fishing or poor quality results in some areas of the district. From 1994 through 1997, gillnet fishing was opened almost exclusively in the area between Right Hand Point and Kulukak Bay. This reduction in area heightened competition among the gillnet fleet, especially during 1996 and 1997, when fishing effort was high. Since 1997, attempts have been made by management staff to spread gillnet harvest out to include areas west of Right Hand Point. However, it has proven difficult to dislodge the gillnet fleet from the protected anchorage of Metervik Bay not only to participate in test fisheries but even to fish in a commercial gillnet period.
Although average mature roe for gillnets has increased from 8.57% (1984–1993) to 11.4% (1994–2003), purse seine average mature roe has decreased from 9.69% (1984–1993) to 9.5% (1994–2003). Gillnet-caught herring quality rose sharply in 1993 and has remained high since 1993. Although some of this difference may be attributed to management efforts, most is due to an apparent shift to larger gillnet mesh sizes. Prior to 1993, gillnets with mesh sizes smaller than three inches (stretched) were common. Gillnets with 3-inch mesh and larger have since become standard gear. This shift to large-mesh gillnets appears to have increased the percentage of female herring caught by herring gillnets from 46.3% (1984–1993) to 58.5% (1994–2003).
In 1992, over 20,000 tons of herring were harvested by purse seines in one 20-minute period. This magnitude of harvest from a single opening, combined with a limited processing capacity, resulted in holding times up to seven days, and large-scale deterioration of flesh and roe quality. The poor product quality resulting from the 1992 harvest and increasing market demands for high quality roe, compelled the department to recognize quality problems associated with extended holding times of 3 days or longer. Limiting individual harvests not to exceed 3 days of processing capabilities became a management objective after 1992.
From 1992 until 2000 the department limited harvests by carefully controlling the open area and duration of each purse seine opening. Since 2000, the fishery has become much more self- regulating in that processors have smaller fleets and are much more restrictive about how long

33
they will hold herring before processing. The reduced processing capacity makes it impossible for the whole quota to be processed in less than ten days.
Although controlling harvest used to be the major concern for managers, the last 3 years have been quite different from the derby style openings of the early 1990’s. The seine fleet is now divided into processor controlled cooperative fleets that harvest just enough herring to keep the processing lines full from day to day. This has allowed managers to open large areas of the district for up to 14 hours at a time without the concern of having more fish harvested than processing capacity can handle in a short time. This is true for most of the fishery, but as the quota is approached managers do have to guard against a large grab.
The cooperative seine fleets allow the participants to maximize the value of the fishery by reducing operating costs and allowing processors to control harvest, enforce a maximum set size and be highly selective in the fish they choose to harvest. This has led to higher inseason estimates of roe quality; postseason estimates have not necessarily increased however.
SPAWN-ON-KELP FISHERY OVERVIEW Similar to the sac roe fishery, the spawn-on-kelp harvest in the Togiak District has been regulated by emergency order since 1981. Since 1984, the spawn-on-kelp fishery was managed under guidelines provided in the Togiak District Herring Spawn on Kelp Management Plan (5 AAC 27.834). The plan essentially provides for an allocation of 350,000 lbs. of product, equivalent to 1,500 tons of herring, to this fishery. The plan also directs the department to 1) rotate harvest areas (Figure 3) on a 2 to 3 year basis; 2) ensure product quality; and 3) include the herring equivalent to the spawn-on-kelp harvest when calculating exploitation.
Fishing effort in the spawn-on-kelp fishery increased steadily since its inception, and peaked at 532 participants in 1991 (Appendix B4). The fishery became limited to interim use and permanent permit holders in 1990. Following the 1991 season, the Board limited the role of non-permit holders in the spawn-on-kelp fishery to assisting with transporting kelp after the period closure. By 1993, most permits issued for this fishery became permanent, stabilizing the number of permits at approximately 300.
From 1984 to 2004, the fishery was opened for all years except 1985, 1997, 1998, 2000, 2001 and 2004. Actual harvests exceeded the 350,000 lb. guideline harvest level by more than 10% in six years and fell short by more than 10% in four (Appendix B7). For the other years in which a fishery occurred, actual harvests were within 10% of the guideline. The 2 to 3 year rotation schedule for kelp harvest areas was adhered to in all years except 1987. In 1987, area K 9 was opened after harvest in area K 10 fell short of the harvest guideline. The western half of area K 9 was opened the previous year.

34
KulukukBay
KulukakBay
TogiakBay
NunavachakBay
UngalikthlukBay
MetervikBay
K-1
K-2K-3
K-4
K-5K-6
K-7K-8
K-9
K-10
SummitIsland
Alaska Department of Fish and GameDivision of Commercial Fisheries Management and Development
(For Illustration Purposes Only - BBHERKLP.PPT. Revised 10/14/97)
Bristol Bay TogiakHerring Commercial
Spawn-On-KelpManagement Areas
N
K-11 RightHand Point
BayPoint
RockyPoint
AnchorPoint
MiddlePoint
0 5Kilometers
NunavachakPoint
Figure 3.–Spawn-on-kelp management areas (K-1 through K11), Togiak District, Bristol Bay.
To ensure product quality the department, industry representatives and permit holders collect spawn-on-kelp samples to display at a public meeting each season, usually after the peak of herring spawning has occurred. Management decisions are based on comments from industry and users regarding sample quality.
2004 SEASON SUMMARY Biomass Estimation Aerial surveys of the Togiak District began April 15, 2004. Herring were first documented in the district on the afternoon of April 22, when approximately 10 tons of herring were observed on the east side of Tongue Point. On April 23 approximately 25 small schools of herring were observed between Togiak Reef and Tongue Point and along the east side of Hagemeister Island. Surveys on April 24 and 25 documented a steady increase in herring biomass. The April 25 survey resulted in a biomass estimate of 20,000 tons of herring with large concentrations in Togiak and Kulukak Bays.
The peak biomass survey was 34,000 tons of herring on May 3. A second end-to-end survey two days later only documented 10,000 tons of herring. Poor weather conditions hampered most of the survey efforts throughout the season and drastically reduced the post-season surveys. Wind and heavy surf limited the duration spawn was visible. Whether herring spawned less, spawned deeper, or spawn was just mixed in turbid water is unclear, but 36 linear miles of spawn were observed this season, much less than the recent 10 year average of 54 miles.

35
Age Composition Approximately 6,400 herring were sampled for age, size, and sex information from April 29 to May 9, 2004. Samples were collected from the commercial purse seine fishery, commercial gillnet fishery, and test purse seine sets. Length frequency analysis, based on the last three years of age at length information, was used to differentiate between age classes.
A sample of 4,026 herring was collected from the commercial purse seine fishery. Age 4 herring comprised less than 1% of the sample, age 5–6 herring comprised 15% of the sample, age 7–8 comprised 42% of the sample and age 9+ fish comprised 43% of the sample. Samples collected from the commercial purse seine fishery averaged 359g. Sex composition was 49.13% male and 50.87% female.
A total of 1,163 herring were sampled from the commercial gillnet fishery. Age 5–6 herring comprised 1% of the sample, age 7–8 comprised 19% of the sample and age 9+ herring comprised 80% of the sample. Samples collected from the commercial gillnet fishery averaged 425g. Sex composition was divided 48.5% male and 51.5% female.
A sample of 1,211 herring was collected from the purse seine test fishery. Age 4 herring comprised less than 1% of the sample, age 5–6 herring comprised 14% of the sample, age 7–8 comprised 49% of the sample and age 9+ fish comprised 36% of the sample. Samples collected from test purse seine sets averaged 351g. The sex ratio was 48.55% male and 51.45% female.
As the season progressed, age composition of herring shifted from age 9+ to age 7 and 8. In the Hagemeister and Nunavachak Sections, age composition of herring harvested in the commercial purse seine fishery exhibited a substantial shift from older to younger fish on May 2. During the final commercial purse seine openings on May 8 and 9, age 7–8 fish were the predominant age classes.
Fishery Overview For the 2004 season, management staff again planned to allow long-duration seine openings over a large area of the district and to let the processors limit harvest for their individual fleets based on processing capacity. Input from the fleet and industry indicated that this would slow the “race for fish” and allow for improved quality and value.
During the winter of 2003–2004, climatic conditions were marginally warmer than usual; there was a moderate amount of snowfall in southwestern Alaska and the ground still had significant amounts of snow on it at the time of the first herring survey on April 15. The Bering Sea ice pack had receded north of Cape Newenham by mid-March, and there were large areas of 4° C. water in the Bering Sea. A cold snap from the end of March to early April cooled water temperatures and created some ice in the near shore waters. By mid-April, the temperature had increased again and there was no ice observed during the first herring survey. These factors indicated there could be an early arrival of herring in the Togiak District, but managers were unsure how early the arrival might be. To predict spawning timing for Togiak herring the department used a temperature model based on April mean air temperatures from Cape Newenham. The model projected the first spawn of one mile or greater would occur on April 27.
Department staff polled processing companies preseason to assess processing capacity for the 2004 season and to inquire about additional concerns or issues. The poll indicated that one less company would be participating in the 2004 Togiak herring fishery but processing capacity was

36
estimated to be 2,220 tons per day, an increase of more than 200 tons from 2003. Although there were no major concerns preseason, department staff held a teleconference on April 1 to discuss the upcoming season with processing companies and permit holders. The greatest concern expressed by stakeholders regarded what would happen if the gillnet fleet was unable to keep up with the seine fleet in harvesting their allocation. During the preseason teleconference and in other individual conversations companies and permit holders were informed that the department was bound by the allocation plan as described in the Togiak Herring Management Plan.
Company registration for processors intending to buy herring and/or spawn-on-kelp product in the Togiak District began on April 15 by fax. All six companies registered by fax this year and only one company had any difficulties. All six companies that registered for the sac roe fishery planned to buy both seine and gillnet fish. Given the large harvestable surplus available, (25,226 tons) the daily processing capacity, of 2,200 tons was a factor in trying to maintain product quality while enabling the fishery to harvest the quota for each gear group.
Purse Seine Test fishing with gillnets and purse seines began on the afternoon of April 27; none of the testfish samples indicated the presence of marketable quality roe. Test fishing continued until April 29, when the purse seine test fishery yielded samples with commercial quality roe content. Department staff were not able to document the threshold biomass of 35,000 tons via aerial survey, however, threshold biomass was stipulated to based on the previously documented biomass (20,000 tons on April 25), poor survey conditions that limited visibility, and the number of days that herring were known to be present on the grounds. Commercial openings were therefore warranted.
The first purse seine opening was a 6-hour opening on April 29 in the area from Right Hand Point to Asigyukpak (Oosik) Spit with the exception of Togiak Bay. The period resulted in 30 deliveries and a harvest of 2,322 tons of herring with an average mature roe percentage of 9.9%. The second seine opening was announced for 4:00 p.m. on April 30. Early in the season, it seemed reasonable to continue with seine openings while the gillnet fleet caught up on their harvest percentage. The second seine opening resulted in a harvest of 963 tons of herring from 20 deliveries with an average mature roe content of 10.6%.
Over the past several years, the seine fishery has turned into a relatively self-regulating fishery. Processing companies manage their cooperative fleets such that they harvest enough fish to keep the processing lines running at full capacity after the daily gillnet harvest has been accounted for. For 2004, the processing capacity was estimated at 2,200 tons per day, so daily harvest was expected to correlate closely with the daily processing capacity.
After the first two openings, fishing progressed in an orderly fashion and the seine fleet was given 10–12 hour periods each day for the next 5 days. This allowed the fleet to harvest fish throughout the day and find quality fish without necessarily setting on every school to test it. This also allowed processors to reduce holding time by waiting until late in the day to have fish harvested, adjust the amount they needed to buy based on gillnet harvest, be selective about the quality of herring bought and reduce the size of sets bought to improve quality.
The four seine openings from May 1 until May 4 went well; the seine fleet harvested fish at a rate that did not overwhelm processing capacity and the gillnet fleet was steadily gaining ground on balancing the harvest percentages. The May 5 opening was another 12 hour period and as

37
reports came in from the gillnet grounds of low harvest rates, processors decided to maximize purchases of seine caught fish. The total seine harvest for this period was 2,904 tons, bringing the season harvest to 12,731 tons, 72% of the preseason quota.
Based on the allocation plan, and the gillnet fleet having difficulty catching fish, there was no purse seine opening announced for May 6. Gillnet fishing continued to be poor despite continuous fishing. On May 7, area and regional staff conferred with headquarters staff and the decision was made to allow some additional purse seine fishing time while mature, high quality herring were available to the fleet.
At 1:00 p.m. it was announced that there would be a purse seine opening that evening. We asked for test fish information to determine the area with the best quality fish. A long opening was not justified due to the available tendering capacity, and it was thought that the fleet would attempt to harvest as much herring as possible, which could easily exceed 3,000 tons. Department staff surveyed the area being considered for an opening and estimated 1,500 to 2,000 tons of herring were present. In conversations with two separate spotter pilots, additional estimates of up to 3,000 tons were heard for the same area.
In a 6:30 p.m. announcement, the general area being considered was reduced to avoid fishing in the shallow areas behind Tongue Point and Oosik Spit because of the extremely low evening tide (–3.5), which would expose eelgrass beds to potential damage from seine gear. The final area and period duration were to be announced at 7:45 after staff conducted an additional survey beginning at 6:45 p.m. Unfortunately, the weather had deteriorated since our original survey at 3:30 p.m. and flying conditions were extremely poor. Due to these conditions, the opening was announced for the entire area under consideration from Osviak Point to the 161° West Longitude line and duration was set at 30 minutes. This period resulted in a harvest of 93 tons from 6 deliveries and 10.7% mature roe. One radio comment monitored theorized that the fish had been present until shortly before the opening, but all the boats jockeying for position and driving over the schools dispersed them and drove them into deeper water.
On Saturday, May 8, our strategy was to harvest enough fish to maximize daily processing capacity. We started with a 30-minute opening at 2:00 p.m. between Tongue Point and Cape Peirce. Weather conditions still appeared to be hampering fishing effort, but it was also apparent that there was not many herring in the area. Additionally, there were several sets made on spawned out fish that were released; a total of 11 released sets were reported but anecdotal information indicated this was only a fraction of the actual number. Only one delivery was made for a harvest of 9 tons.
A second opening was announced on May 8 at 5:30 p.m. with both time and area increased. This was a one-hour opening from Cape Newenham to Togiak Reef, the entire western half of the Togiak District. This opening resulted in a harvest of 184 tons of herring from 10 deliveries with 6 additional released sets reported. The difficulties the fleet was having harvesting herring, as well as the number of sets being released because of spawned out fish, was indicative of the end of the herring run.
The third opening on May 8 was a two-hour opening that included the entire western half of the district as well as from Rocky Point to Anchor Point in the eastern portion of the district. Although the period harvest was better with 723 tons from 17 deliveries, there were still 6 sets reportedly released mainly due to the presence of spawned out fish. Fish from the eastern portion

38
of the district and between Togiak Reef and Tongue Point were heavily mixed with spawn outs and almost all fish harvested were from the area around Oosik Spit.
On Sunday, May 9, we announced the final opening for the 2004 Togiak purse seine fishery. The announcement was for a five-hour period from Tongue Point to Cape Newenham. This period resulted in a harvest of 41 tons from 3 deliveries.
The decision to close the fishery was based on the large number of spawned out fish that were wrapped and released, the lack of new fish entering the district, the length of time fish had been on the grounds and the lack of spawn that had been documented. Managers felt that based on the preseason forecast, the run was not as strong as expected, and it was time to stop stressing fish that had spawned and were trying to recover.
Gillnet Gillnet test fishing began April 27, collecting information on roe quality in the area between Metervik Bay and Right Hand Point. The test fishery samples obtained averaged 6.4% mature roe. On April 28, no gillnet test fish samples were obtained due to poor weather. Deteriorating weather conditions continued to hamper test fish efforts on April 29, and only one sample was reported late in the evening. The sample had 10.9% mature roe, but the volume of fish was small and the weather was expected to be poor again the next day. Finally on April 30, samples of commercial quality were harvested in the Nunavachak Bay area. Additional samples were obtained from Rocky Bay, but were only 7.5% mature roe.
The first gillnet opening was a 12-hour period that began at noon on May 30. The harvest was 798 tons from 93 deliveries with an average mature roe content of 10.3%. Although the area from Egg Island, in Kulukak Bay, to the east side of Ungalikthluk Bay was open, most of the harvest occurred in Nunavachak Bay and along Gravel Beach. The weather was too rough for effective fishing east of Right Hand Point. This was the first time in eight years that the gillnet fleet moved west of Right Hand Point.
The gillnet fleet continued to fish west of Right Hand Point for the second opening, a 13 hour period. Severe weather again hampered fishing and the harvest was much smaller than the previous period with only 330 tons in 13 hours of fishing. Weather conditions improved on May 2 and allowed the gillnet fleet to fish in the more traditional area along the Kulukak Bluffs. The third opening resulted in a harvest of 1,275 tons in 14 hours of fishing. The large harvest from period three helped equalize the imbalance between actual harvest percentages and allocation percentages.
On May 3, there was another 14-hour period and the good fishing continued. The harvest of 924 tons continued to close the gap between the actual harvest percentage and the allocated percentage of 30%. The harvest percentage was 28.4% after all fishing was completed on May 3 and 44% of the gillnet quota had been harvested. Staff anticipated that another similar period or two would have the harvest balanced at 70/30 with close to 70% of the quota harvested.
Gillnet period 5 began at 6:00 a.m. on May 4 in the same area as the previous opening. The weather was good; however fishing for period 5 was poor. The period resulted in a harvest of only 186 tons. This combined with a large seine harvest dropped the gillnet harvest percentage to 26%. Reports from the grounds indicated that fishing improved toward the end of the period. Period 6 began at 7:00 a.m. on May 5 and was extended repeatedly until 8:00 a.m. on May 7. The harvest through 8:00 p.m. on May 6 was 648 tons and an additional 563 tons were harvested

39
between 8:00 p.m. May 6 and 8:00 a.m. May 7. Reports from the grounds indicated that harvest rates improved dramatically during nighttime hours. The next period was from 12:00 noon May 7, until 8:00 a.m. May 8 and 343 tons of herring were harvested.
Reports from the grounds were mixed, but there seemed to be only a few schools of herring in the Kulukak area and indications that spawned out fish were present. At least one company reported only bait quality fish were being harvested. The harvest rate continued to drop. Gillnet period 9, a 16-hour period, resulted in a harvest of 88 tons of herring. Although roe quality improved slightly to 10.21%, up from 10%, it was still less than what was expected for the gillnet fleet.
On the morning of May 9 the decision was made to close the 2004 Togiak herring fishery based on the lack of new fish showing up in the district, the poor quality of fish being harvested and the indications that permit holders were switching to smaller mesh gear. The last opening was a 6-hour period from 9:00 a.m. until 3:00 p.m. on Sunday, May 9. The period resulted in a harvest of 17 tons from 16 deliveries. The total gillnet harvest for 2004 was 5,172 tons harvested over 10 days in 162 hours of fishing. The average mature roe content was 10.3%. There were 757 deliveries reported and the peak vessel count was 54.
Spawn on Kelp No companies registered to buy herring spawn-on-kelp in 2004, therefore there were no openings and no commercial harvest.
EXPLOITATION The 2004 herring fisheries were managed for a maximum exploitation rate of 20% of the preseason forecast. Combining the sac roe harvest (18,953 tons with an average weight of 391 grams and an average roe percentage of 10.4%), and test fish harvest (617 tons) resulted in an exploitation of 19,570 tons. The Dutch Harbor food and bait fishery has not occurred at this time. If the Dutch Harbor fishery harvest were equal to the quota of 1,899 tons, then the total harvest for 2004 would be 21,469. Based on the preseason forecasted biomass of 143,124 tons, the 2004 exploitation would be calculated at approximately 15.00%.
EXVESSEL VALUE The projected exvessel value of the 2004 Togiak herring fishery is approximately $2.1 million. This is based on grounds price estimate of $138 per ton and does not include any post-season adjustments. A value of $2.5 million is higher than the 2002 value but only 57% of the five-year average of $3.7 million.

40
ACKNOWLEDGEMENTS
The authors gratefully acknowledge the Commercial and Subsistence Fisheries staff of the Dillingham, King Salmon and Anchorage offices of the Alaska Department of Fish and Game for their contributions to this report.
Permanent Employees with the Commercial Fisheries Division West Side: Tim Sands, Nushagak Biologist; Charlotte Westing, Togiak Biologist; Arthur Reynolds,
Maintenance Worker; Karen Brito, Program Technician East Side: Steve Morstad, Naknek/Kvichak Biologist; Carol Klutsch, Program Technician Anchorage: Anica Estes, Information Officer; Tim Baker, Research Analyst; Lowell Fair, Research
Project Leader; Keith Weiland, Egegik/Ugashik Biologist; Chuck Brazil, Research Biologist; Fredrick West, Research Biologist
Seasonal Employees with the Commercial Fisheries Division West Side: Katie Sechrist, Seafood Industry Coordinator (Herring and Salmon), Brad Palach,
Technical Consultant (Herring and Salmon); Eric Barnhill, Herring; Alana Shaw, Herring, Wood River Tower; Simon Prennace, Field Camp Coordinator; Jonathan Barton, Supply Technician; Alasha Robertson, Night Office Staff; Brian Fritze, BBEDC Intern; Joe Winter, Wood River Tower; Dean Meili, Wood River Tower; Jim Maconochie, Igushik River Tower; Phillip Carscallen, Igushik River Tower; Dylan Hooper, Igushik River Tower; Shelley Schroeder, Togiak River Tower; Beth McLain, Togiak River Tower; Loulare Moore, Togiak River Tower; Ester Edwards, Nuyakuk River Tower (BBSRI); Shelly Woods, Nuyakuk River Tower (BBSRI); Jessica Bartman, Nuyakuk River Tower (BBSRI); Konrad Mittelstadt, Nushagak River Sonar; Zachary Browning, Nushagak River Sonar; Jeanette LeClair, Nushagak River Sonar; Chris Cavanaugh, Nushagak River Sonar; Lucas Hegg, Nushagak River Sonar; Matt McLaren, Nushagak District Test Fish
East Side: Mary Emery, Seafood Industry Coordinator/Office Manager; Marna McMurry, Night Office Staff; Fred Tilly, Kvichak Smolt/ Field Camp Coordinator ; Karen Saunders, Fish Ticket Editor; Cathy Tilly, Scale Reader ; Sally Hamm, District Test Fish; Susan McNeil, Herring/KvichakSmolt/Field Camp Supply; Susan Klock, Kvichak Smolt/Naknek Tower; Chris Clark, Kvichak River Test Fish; Charles Lochner, Kvichak River Test Fish;; Brad Russell, Egegik River Test Fish; Dirk Middleton, Egegik River Test Fish; Frank Komarek, Ugashik River Test Fish; Tor Christopherson, Ugashik River Test Fish; Casey Jacobs, Kvichak River Tower; Rob Regnart, Kvichak River Tower; Tod Bogan, Kvichak River Tower; Ryan Bill, Naknek River Tower; Kiana Putman, Naknek River Tower/Herring; Robert Boyce, Egegik Tower; Cody Tharldson, Egegik Tower; Rune Christopherson, Egegik Tower; Ian Chang, Ugashik Tower; Haley Ohms, Ugashik Tower; Will Hinckley, Ugashik Tower; Kelsey Romig, Cost Recovery Test Fish; Vitoon Towata, Cost Recovery Test Fish; Corrie Whitmore, Cost Recovery Test Fish
Permanent Employees with the Subsistence Division
James Fall, Subsistence Resource Program Manager; Ted Krieg, Subsistence Resource Specialist; Molly Chythlook, Fish & Wildlife Technician; Eunice Dyasuk, Program Technician; Dave Caylor Analyst/Programmer
REFERENCES CITED
Lebida, R.C. and D.C. Whitmore. 1985. Bering Sea Herring Aerial Survey Manual. Alaska Department of Fish and Game, CFMD, Bristol Bay Data Report 85-2, Anchorage.

41
TABLES

42
Table 1.–Comparison of inshore sockeye salmon forecast versus actual run, escapement goals versus actual escapements, and projected versus actual commercial catch, by river system and district, in thousands of fish, Bristol Bay, 2004.
Inshore Run Escapement Inshore Catch
District and River System a Forecast Actual Percent
Deviationb Range Actual Projected Harvest Actual
Percent Deviationb
NAKNEK-KVICHAK DISTRICT Kvichak River 13,231 7,332 0.80 2,000–10,000 5,500 6,616 1,832 2.61 Branch River 4,402 6,510 –0.32 170–200 5,397 4,217 1,113 2.79 Naknek River 4,664 3,721 0.25 800–1,400 1,939 3,564 1,782 1.00 Total 22,297 17,563 0.27 6,970–11,600 12,836 14,397 4,727 2.05
EGEGIK DISTRICT 12,095 11,488 0.05 800–1,400 1,290 10,995 10,198 0.08 UGASHIK DISTRICT 4,085 3,943 0.04 500–1,200 815 3,235 3,128 0.03 NUSHAGAK DISTRICT Wood River 4,445 5,376 –0.17 700–1,500 1,543 3,345 3,832 –0.13 Igushik River 1,081 564 0.92 150–300 110 856 454 0.89 Nushagak-Mulchatna 1,791 2,293 –0.22 340–760 492 1,241 1,801 –0.31 Total 7,317 8,233 –0.11 1,190–2,560 2,145 5,442 6,088 –0.11
TOGIAK DISTRICT 812 493 0.65 100–200 136 662 357 0.85 TOTAL BRISTOL BAY 46,606 41,720 0.12 9,560–16,960 17,222 34,731 24,498 0.42
a The Bristol Bay inshore forecast does not include several minor river systems, including the Snake River drainage in Nushagak District, and the Kulukak, Osviak, Matogak and Slug River system in Togiak District. Catches, escapements, and total runs for these smaller systems are not included in this table so that forecast efficacy may be gauged. Totals may not equal column sums due to rounding and do not include General District information.
b Percent deviation = (forecast - actual)/actual.

43
Table 2.–Inshore forecast of sockeye salmon returns by age class, river system and district, in thousands of fish, Bristol Bay, 2004.
District and 2-Ocean 3-Ocean Other River System 1.2 (2000) 2.2 (1999) Total 1.3 (1999) 2.3 (1998) Total TotalNAKNEK-KVICHAK DISTRICT Kvichak River 388 11,997 12,385 813 33 846 - 13,231 Branch River 2,590 1,134 3,724 607 71 678 - 4,402 Naknek River 723 747 1,470 2,002 1,192 3,194 - 4,664 Total 3,701 13,878 17,579 3,422 1,296 4,718 - 22,297EGEGIK DISTRICT 550 10,011 10,561 627 907 1,534 - 12,095UGASHIK DISTRICT 693 2,041 2,734 758 593 1,351 - 4,085NUSHAGAK DISTRICT Wood River 2,277 281 2,558 1,810 77 1,887 - 4,445 Igushik River 198 98 296 753 32 785 - 1,081 Nushagak River 165 10 175 1,372 62 1,434 182 1,791 Total 2,640 389 3,029 3,935 171 4,106 182 7,317TOGIAK DISTRICT 137 18 155 619 38 657 812TOTAL BRISTOL BAYa Number 7,721 26,337 34,058 9,361 3,005 12,366 182 46,606 Percent 17 57 73 20 6 27 0 100
a Sockeye salmon of several minor age classes are expected to contribute an additional 1–2% to the total return.

44
Table 3.–Inshore run of sockeye salmon by age class, river system and district, in thousands of fish, Bristol Bay, 2004.
District and River System a 1.2 2.2 2-Ocean 1.3 2.3 3-Ocean 1.4 Total NAKNEK-KVICHAK DISTRICT Kvichak River Number 1,668 5,378 7,046 213 52 265 5 7,332 Percent 22.7 73.3 96.1 2.9 0.7 3.6 0.1 99.7 Branch River Number 4,149 844 4,993 1,299 188 1,487 11 6,510 Percent 63.7 13.0 76.7 20.0 2.9 22.8 0.2 99.5 Naknek River Number 1,131 675 1,806 1,253 646 1,899 10 3,721 Percent 30.4 18.1 48.5 33.7 17.4 51.0 0.3 99.6 Total Number 6,948 6,897 13,845 2,765 886 3,651 26 17,563 Percent 39.6 39.3 78.8 15.7 5.0 20.8 0.1 99.8 EGEGIK DISTRICT Number 1,521 8,690 10,211 568 619 1,187 1 11,488 Percent 13.2 75.6 88.9 4.9 5.4 10.3 0.0 99.2 UGASHIK DISTRICT Number 1,653 1,355 3,008 709 213 922 3 3,943 Percent 41.9 34.4 76.3 18.0 5.4 23.4 0.1 99.7 NUSHAGAK DISTRICT Wood River Number 3,086 384 3,470 1,804 91 1,895 5 5,376 Percent 57.4 7.1 64.5 33.6 1.7 35.2 0.1 99.8 Igushik River Number 99 65 164 357 35 392 7 564 Percent 17.6 11.5 29.1 63.3 6.2 69.5 1.2 98.6 Nush-Mulchatna River Number 222 23 245 1,687 77 1,764 180 2,293 Percent 9.7 1.0 10.7 73.6 3.4 76.9 7.8 87.6 Total Number 3,407 472 3,879 3,848 203 4,051 192 8,233 Percent 41.4 5.7 47.1 46.7 2.5 49.2 2.3 96.3 TOGIAK DISTRICTb Number 85 28 113 281 89 370 5 493 Percent 17.2 5.7 22.9 57.0 18.1 75.1 1.0 98.0 TOTAL BRISTOL BAYc Number 13,614 17,442 31,056 8,171 2,010 10,181 227 41,720 Percent 32.6 41.8 74.4 19.6 4.8 24.4 0.5 98.8
a The inshore run data does not include the South Peninsula or General District catch of Bristol Bay sockeye or immature high seas by-catch.
b Does not include rivers other than Togiak River. c Totals include minor age classes not listed in this table however, minor rivers and creeks are not included. d Totals may not equal column sums due to rounding.

45
Table 4.–Inshore commercial catch and escapement of sockeye salmon, in numbers of fish, Bristol Bay, 2004.
District and River System Catch Escapement Total Run NAKNEK-KVICHAK DISTRICT Kvichak River 1,832,101 5,500,134 7,332,235
Alagnak River 1,113,282 5,396,592 6,509,874 Naknek River 1,781,804 1,939,374 3,721,178
Total 4,727,187 12,836,100 17,563,287
EGEGIK DISTRICT 10,198,236 1,290,144 11,488,380
UGASHIK DISTRICT 3,127,549 815,104 a 3,942,653 NUSHAGAK DISTRICT Wood River 3,832,231 1,543,342 5,375,573 Igushik River 454,392 109,650 564,042 Nushagak-Mulchatna 1,801,153 491,698 2,292,851
Total 6,087,776 2,144,690 8,232,466 TOGIAK DISTRICT Togiak Lake 129,462 129,462 Togiak River/Tributaries 357,354 6,175 363,529 Kulukak System 80,204 80,204
Other Systems b 1,095 19,044 20,139 Total 438,653 154,681 593,334
TOTAL BRISTOL BAY 24,579,401 17,240,719 41,820,120 a Includes Ugashik River Tower and aerial survey estimates from King Salmon and Dog Salmon rivers. b "Other Systems" escapement includes Negukthlik,Ungalikthluk, Osviak, Matogak, Quigmy, and Slug Rivers.

46
Table 5.– Summary of sockeye salmon test fishing indices in the Naknek/Kvichak District, by index area and date, Bristol Bay, 2004.
Naknek Pederson Cutbank & Half Middle Johnston Division Ships
Date R. Mouth\a Point a Graveyard a Moon Baya Naknek a Hill a Buoy a Anchoragea
6/26 0 614 54 428 0
6/27 195 391 490 316
6/28 180 412 428 263 228
6/29 818
7/01 611
7/03 223 181
7/12 349 305 263 8 96 140 262
7/14 128 218 574 34 a All indices expressed in numbers of fish/100 fathoms/hour to the nearest index point.
Table 6.–Summary of sockeye salmon test fishing indices in the Ugashik District, by index area and date, Bristol Bay, 2004.
Index Area a July 5 July 6 Cape Grieg (Nearshore) Four Miles North of Smoky Point (Nearshore) Two Miles North of Smoky Point (Outer line) Smoky Point Bar North Side (Inshore) Smoky Point Entrance Three Miles South of South Spit (Nearshore) 1.5 miles south of South Spit South Spit (Mid Channel) Dago Creek Mouth 147 Pilot Point 248 1,843 Between Pilot Point and Muddy Point 1,548 South Spit Inner South Channel Below inner district boundary line west side Below inner district boundary line east side 387 1,176 Above inner district boundary line east side Between Dog Salmon and King Salmon Rivers 58 1,263 b Mouth of Dog Salmon River 47 1,172 b
a All indices expressed in number of fish/100 fathom hours to the nearest full index point. b Average of two or more drifts.

47
Table 7.–Summary of sockeye salmon test fishing indices in the Nushagak District, by index area and date, Bristol Bay, 2004.
Hanson Across Tule Picnic Grassy Nushagak Pile Coffee Kanakanak Date Point a Hanson Pt.a Pointa Pointa Islanda Pointa Drivera Pointa Bluffa 6/18 0 0 0 0
0 0 6/19 5,217 1,875 1,680 0 762 1,985 3,923
3,904 486 6/20 1,024 1,524 590 0 0 594 197
912 968 6/20 0 549 3,669 1,208 0 360
787 1,292 6/21 373 186 2,281 0 0
943 0 6/21 183 734 1,132 0 0
734 2,049 6/22 1,125 0 186 0 180
189 529 6/23 3,596 2,286 9,500
6,269 779 6/24 1,250 2,276 1,895 0 0
1,895 2,281 6/24 1,143 3,333 5,454 377 0
1,342 2,109 6/25 1,791 1,313 2,338 0 0 0
4,762 2,348 0 6/26 0 2,557 390 0 0 0
0 1,486 6/27 0 571 0 0 0
380 923 6/28 189 372 188 0 381
545 0 6/29 2,509
a All indices expressed in number of fish/100 fathoms-hours to the nearest full index point. Indicies listed first for each station were recorded using 5 1/8 inch mesh gear, second with 4 3/4 inch gear.

48
Table 8.–Commercial fishing emergency orders, by district and stat area, Bristol Bay, 2004.
Numbera Start Date Start Time End Date End Time Effective time General District Drift Net
DLG.02 June 07 9:00 a.m. to June 11 11:00 p.m. 110 hours b DLG.02 June 14 9:00 a.m. to June 18 11:00 p.m. 110 hours b DLG.14 June 21 9:00 a.m. to June 22 9:00 p.m. 36 hours b
Naknek/Kvichak District Drift Net
AKN.81 August 2 9:00 a.m. to Sept. 30 9:00 a.m. weekly schedule b,d Set Net
AKN.03 June 01 9:00 a.m. to July 23 9:00 a.m. weekly schedule b,d AKN.14 June 24 5:00 a.m. to June 24 2:00 p.m. 9.0-hours AKN.18 June 25 5:30 a.m. to June 25 2:30 p.m. 9.0-hours AKN.19 June 26 5:30 a.m. to June 26 2:30 p.m. 9.0-hours AKN.20 June 27 5:30 a.m. to June 27 2:30 p.m. 9.0-hours AKN.21 June 28 5:30 a.m. to June 28 2:30 p.m. 9.0-hours AKN.36 July 01 5:30 p.m. to July 02 6:00 p.m. 24.5-hours AKN.37 July 02 6:30 p.m. to July 03 7:30 p.m. 25.0-hours AKN.40 July 03 7:30 p.m. to July 04 8:00 p.m. 24.5-hours AKN.80 July 19 9:00 a.m. to Sept. 30 9:00 a.m. weekly schedule d
Naknek Section Drift Net
AKN.03 June 01 9:00 a.m. to July 23 9:00 a.m. weekly schedule b,d AKN.14 June 24 6:00 a.m. to June 24 2:00 p.m. 8.0-hours AKN.18 June 25 6:30 a.m. to June 25 2:30 p.m. 8.0-hours AKN.23 June 27 8:30 p.m. to June 28 12:30 a.m. 4.0-hours AKN.26 June29 8:00 a.m. to June 29 1:00 p.m. 5.0-hours AKN.27 June 29 10:30 p.m. to June 30 3:30 a.m. 5.0-hours AKN.27 June 30 9:00 a.m. to June 30 4:30 p.m. 7.5-hours AKN.29 June 30 11:00 p.m. to July 01 7:00 a.m. 8.0-hours AKN.29 July 01 10:00 a.m. to July 01 5:30 p.m. 7.5-hours AKN.36 July 02 12:30 a.m. to July 02 9:30 a.m. 9.0-hours AKN.36 July 02 11:30 a.m. to July 02 6:30 p.m. 7.0-hours AKN.37 July 03 1:00 a.m. to July 03 10:00 a.m. 9.0-hours AKN.37 July 03 12:30 p.m. to July 03 7:30 p.m. 7.0-hours AKN.40 July 04 2:00 a.m. to July 04 10:30 a.m. 8.5-hours AKN.40 July 04 1:30 p.m. to July 04 8:00 p.m. 6.5-hours AKN.43 July 05 3:00 a.m. to July 05 10:00 a.m. 7.0-hours AKN.43 July 05 3:00 p.m. to July 05 9:00 p.m. 6.0-hours AKN.44 July 06 4:00 a.m. to July 06 9:30 a.m. 5.5-hours AKN.80 July 19 9:00 a.m. to Sept. 9:30 a.m. d
Set Net AKN.23 June 27 8:30 p.m. to June 28 12:30 a.m. 4.0-hours AKN.26 June29 8:00 a.m. to June 29 1:00 p.m. 5.0-hours AKN.27 June 29 10:30 p.m. to June 30 4:30 p.m. 18.0-hours AKN.29 June 30 4:30 p.m. to July 01 5:30 p.m. 25.0-hours
-continued-

49
Table 8.–Page 2 of 6.
Numbera Start Date Start Time End Date End Time Effective time Naknek River Special Harvest District Drift Net
AKN.44 July 6 4:30 p.m. to July 6 10:00 p.m. 5.5-hours AKN.45 July 6 10:00 p.m. to July 6 11:30 p.m. 1.5-hours AKN.45 July 7 5:00 a.m. to July 7 1:00 p.m. 8.0-hours AKN.45 July 7 5:30 p.m. to July 8 1:00 a.m. 7.5-hours AKN.51 July 8 5:00 a.m. to July 8 2:00 p.m. 9.0-hours AKN.54 July 9 6:00 a.m. to July 9 2:30 p.m. 8.5-hours AKN.54 July 9 7:00 p.m. to July 10 3:30 a.m. 8.5-hours AKN.58 July 10 8:00 p.m. to July 11 4:30 a.m. 8.5-hours AKN.58 July 11 8:00 a.m. to July 11 4:00 p.m. 8.0-hours AKN.65 July 12 8:00 a.m. to July 12 4:00 p.m. 8.0-hours AKN.67 July 13 9:00 a.m. to July 13 4:30 p.m. 7.5-hours AKN.67 July 13 11:00 p.m. to July 14 7:00 a.m. 8.0-hours AKN.71 July 14 10:00 a.m. to July 14 5:30 p.m. 7.5-hours AKN.75 July 15 10:30 a.m. to July 15 7:00 p.m. 7.5-hours AKN.75 July 16 12:30 a.m. to July 16 9:00 a.m. 8.5-hours AKN.78 July 17 1:00 a.m. to July 17 9:30 a.m. 8.5-hours AKN.78 July 17 12:30 p.m. to July 17 8:00 p.m. 7.5-hours AKN.80 July 18 1:00 p.m. to July 18 9:00 p.m. 8.0-hours AKN.80 July 19 2:00 a.m. to July 19 8:00 a.m. 6.0-hours
Naknek River Special Harvest Area Set Net
AKN.51 July 8 6:00 p.m. to July 9 2:00 a.m. 8.0-hours AKN.54 July 10 6:30 a.m. to July 10 3:30 p.m. 9.0-hours AKN.58 July 11 9:00 p.m. to July 12 6:00 a.m. 9.0-hours AKN.65 July 12 9:30 p.m. to July 13 6:30 a.m. 9.0-hours AKN.71 July 14 11:30 p.m. to July 15 8:30 a.m. 9.0-hours AKN.75 July 16 11:30 a.m. to July 16 7:30 p.m. 8.0-hours AKN.78 July 18 1:30 a.m. to July 18 11:30 a.m. 9.5-hours
Egegik District Drift Net
AKN.01 June 01 12:00 a.m. to June 13 9:00 a.m. weekly schedule c AKN.08 June 17 11:30 a.m. to June 17 7:30 p.m. 8.0-hours AKN.08 June 18 12:00 p.m. to June 18 8:00 p.m. 8.0-hours AKN.10 June 20 1:30 p.m. to June 20 9:30 p.m. 8.0-hours AKN.11 June 21 2:30 p.m. to June 21 10:30 p.m. 8.0-hours AKN.12 June 22 3:00 p.m. to June 22 11:00 p.m. 8.0-hours
Egegik District Drift Net
AKN.13 June 23 4:00 p.m. to June 24 12:00 a.m. 8.0-hours AKN.17 June 25 4:15 a.m. to June 25 12:15 p.m. 8.0-hours AKN.21 June 27 6:00 a.m. to June 27 2:00 p.m. 8.0-hours AKN.22 June 27 7:00 p.m. to June 27 11:30 p.m. 4.5-hours AKN.22 June 28 6:30 a.m. to June 28 2:30 p.m. 8.0-hours
-continued-

50
Table 8.–Page 3 of 6.
Numbera Start Date Start Time End Date End Time Effective time AKN.24 June 28 8:00 p.m. to June 28 11:30 p.m. 3.5-hours AKN.24 June 29 7:30 a.m. to June 29 3:30 p.m. 8.0-hours AKN.28 June 30 8:30 a.m. to June 30 4:30 p.m. 8.0-hours AKN.30 July 01 9:30 a.m. to July 01 5:30 p.m. 8.0-hours AKN.34 July 02 10:30 a.m. to July 02 6:30 p.m. 8.0-hours AKN.38 July 03 11:30 a.m. to July 03 7:30 p.m. 8.0-hours AKN.41 July 04 2:30 p.m. to July 04 6:30 p.m. 4.0-hours
Set Net AKN.01 June 01 12:00 a.m. to June 13 9:00 a.m. weekly schedule c AKN.08 June 17 11:30 a.m. to June 17 7:30 p.m. 8.0-hours AKN.08 June 18 12:00 p.m. to June 18 8:00 p.m. 8.0-hours AKN.10 June 20 1:30 p.m. to June 20 9:30 p.m. 8.0-hours AKN.11 June 21 2:30 p.m. to June 21 10:30 p.m. 8.0-hours AKN.12 June 22 3:00 p.m. to June 22 11:00 p.m. 8.0-hours AKN.13 June 23 4:00 p.m. to June 24 12:00 a.m. 8.0-hours AKN.17 June 25 4:15 a.m. to June 25 12:15 p.m. 8.0-hours AKN.19 June 26 5:00 a.m. to June 26 1:00 p.m. 8.0-hours AKN.21 June 27 6:00 a.m. to June 27 2:00 p.m. 8.0-hours AKN.22 June 27 7:00 p.m. to June 28 2:30 p.m. 19.5-hours AKN.24 June 28 8:00 p.m. to June 29 3:30 p.m. 19.5-hours AKN.28 June 30 8:30 a.m. to June 30 4:30 p.m. 8.0-hours AKN.30 June 30 4:30 p.m. to July 01 5:30 p.m. 25.0-hours AKN.34 July 02 10:30 a.m. to July 02 6:30 p.m. 8.0-hours AKN.38 July 03 11:30 a.m. to July 03 7:30 p.m. 8.0-hours AKN.41 July 04 1:00 p.m. to July 04 9:00 p.m. 8.0-hours
Egegik Special Harvest Area Drift Net
AKN.45 July 06 4:30 p.m. to July 06 11:00 p.m. 6.5-hours AKN.47 July 07 4:30 p.m. to July 07 11:30 p.m. 7.0-hours AKN.52 July 08 5:00 p.m. to July 08 10:00 p.m. 5.0-hours AKN.52 July 09 5:00 a.m. to July 09 10:00 a.m. 5.0-hours AKN.56 July 09 6:30 p.m. to July 09 11:30 p.m. 5.0-hours AKN.56 July 10 6:30 a.m. to July 10 11:30 a.m. 5.0-hours AKN.60 July 10 6:30 p.m. to July 10 11:30 p.m. 5.0-hours AKN.60 July 11 6:30 a.m. to July 11 1:30 p.m. 7.0-hours AKN.63 July 12 7:00 a.m. to July 12 1:00 p.m. 6.0-hours
Egegik Special Harvest Area Drift Net
AKN.63 July 12 8:00 p.m. to July 13 12:00 a.m. 4.0-hours AKN.69 July 13 9:00 p.m. to July 14 1:00 a.m. 4.0-hours AKN.69 July 14 8:30 a.m. to July 14 3:00 p.m. 6.5-hours AKN.73 July 15 10:00 a.m. to July 17 9:00 a.m. 47-hours
Set Net AKN.45 July 06 3:00 p.m. to July 06 11:00 p.m. 8.0-hours AKN.47 July 07 3:30 p.m. to July 08 12:00 p.m. 20.5-hours AKN.52 July 08 12:00 p.m. to July 09 10:00 a.m. 10-hours AKN.56 July 09 6:00 p.m. to July 10 1:30 p.m. 18.5-hours
-continued-

51
Table 8.–Page 4 of 6.
Numbera Start Date Start Time End Date End Time Effective time AKN.60 July 10 1:30 p.m. to July 11 2:30 p.m. 25.0-hours AKN.63 July 12 7:00 a.m. to July 13 4:00 p.m. 33.0-hours AKN.69 July 13 9:00 p.m. to July 14 4:30 p.m. 19.5-hours AKN.73 July 15 10:00 a.m. to July 17 9:00 a.m. 47-hours
Ugashik District Drift Net
AKN.02 June 01 12:00 a.m. to June 13 9:00 a.m. weekly schedule d AKN.16 June 24 3:30 p.m. to June 24 11:30 p.m. 8.0-hours AKN.20 June 26 4:30 a.m. to June 26 12:30 p.m. 8.0-hours AKN.25 June 29 7:00 a.m. to June 29 11:00 a.m. 4.0-hours AKN.31 July 01 9:00 a.m. to July 01 1:00 p.m. 4.0-hours AKN.35 July 02 10:00 a.m. to July 02 6:00 p.m. 8.0-hours AKN.42 July 04 3:00 p.m. to July 04 6:00 p.m. 6.0-hours AKN.48 July 07 2:30 p.m. to July 07 11:30 p.m. 9.0-hours AKN.53 July 08 4:30 p.m. to July 08 10:30 p.m. 6.0-hours AKN.57 July 09 4:30 p.m. to July 09 11:30 p.m. 7.0-hours AKN.57 July 10 7:30 a.m. to July 10 1:30 p.m. 6.0-hours AKN.61 July 10 6:00 p.m. to July 11 12:00 a.m. 6.0-hours AKN.61 July 11 8:30 a.m. to July 11 3:30 p.m. 7.0-hours AKN.64 July 11 8:00 p.m. to July 12 12:00 a.m. 4.0-hours AKN.64 July 12 6:30 a.m. to July 12 2:30 p.m. 8.0-hours AKN.66 July 13 7:30 a.m. to July 13 5:30 p.m. 10.0-hours AKN.70 July 14 8:30 a.m. to July 14 8:30 p.m. 12.0-hours AKN.74 July 15 9:30 a.m. to July 15 7:30 p.m. 10.0-hours AKN.77 July 16 10:00 a.m. to July 17 9:00 a.m. 23.0-hours
Ugashik District Set Net
AKN.02 June 01 12:00 a.m. to June 13 9:00 a.m. weekly schedule d AKN.16 June 24 3:30 p.m. to June 25 4:30 a.m. 13.0-hours AKN.20 June 26 4:30 a.m. to June 26 12:30 p.m. 8.0-hours AKN.25 June 29 7:00 a.m. to June 29 3:00 p.m. 8.0-hours
Ugashik District Set Net
AKN.31 July 01 9:00 a.m. to July 01 5:00 p.m. 8.0-hours AKN.35 July 02 10:00 a.m. to July 02 8:00 p.m. 10.0-hours AKN.39 July 03 11:00 a.m. to July 03 7:00 p.m. 8.0-hours AKN.42 July 04 12:00 p.m. to July 04 6:00 p.m. 6.0-hours AKN.48 July 07 2:30 p.m. to July 07 11:30 p.m. 9.0-hours AKN.53 July 08 3:30 p.m. to July 09 4:30 a.m. 13.0-hours AKN.57 July 09 4:30 p.m. to July 10 2:30 p.m. 22.0-hours AKN.61 July 10 2:30 p.m. to July 11 5:30 p.m. 27.0-hours AKN.64 July 11 5:30 p.m. to July 12 6:30 p.m. 25.0-hours AKN.66 July 13 7:30 a.m. to July 13 5:30 p.m. 10.0-hours AKN.70 July 14 8:30 a.m. to July 14 8:30 p.m. 12.0-hours AKN.74 July 15 9:30 a.m. to July 15 7:30 p.m. 10.0-hours AKN.46 July 08 4:30 a.m. to July 08 4:30 p.m. 12.0-hours AKN.49 July 09 5:30 a.m. to July 09 5:30 p.m. 12.0-hours AKN.52 July 10 6:30 a.m. to July 10 10:30 p.m. 16.0-hours
-continued-

52
Table 8.–Page 5 of 6.
Numbera Start Date Start Time End Date End Time Effective time AKN.55 July 11 7:30 a.m. to July 11 7:30 p.m. 12.0-hours AKN.58 July 12 8:30 a.m. to July 12 8:30 p.m. 12.0-hours AKN.61 July 13 9:30 a.m. to July 13 7:30 p.m. 10.0-hours AKN.64 July 14 10:30 a.m. to July 14 8:30 p.m. 10.0-hours AKN.67 July 15 11:30 a.m. to July 15 9:30 p.m. 10.0-hours AKN.70 July 16 5:30 a.m. to July 16 10:30 p.m. 17.0-hours
Nushagak District Nushagak Section Drift Net
DLG.04 June 14 10:30 a.m. to June 14 3:30 p.m. 5.0-hours f DLG.09 June 17 1:00 p.m. to June 17 5:00 p.m. 4.0-hours f DLG.15 June 21 7:00 a.m. to June 21 11:00 a.m. 4.0-hours DLG.19 June 24 9:00 a.m. to June 24 3:00 p.m. 6.0-hours DLG.24 June 25 10:00 p.m. to June 26 4:00 a.m. 6.0-hours DLG.26 June 27 6:00 a.m. to June 27 2:00 p.m. 8.0-hours DLG.28 June 28 12:00 p.m. to June 28 5:00 p.m. 5.0-hours DLG.30 June 29 2:00 p.m. to June 29 5:00 p.m. 3.0-hours DLG.31 June 30 2:00 a.m. to June 30 8:00 a.m. 6.0-hours DLG.32 June 30 3:00 p.m. to June 30 8:00 p.m. 5.0-hours DLG.33 July 1 6:00 a.m. to July 1 11:00 a.m. 5.0-hours DLG.34 July 1 3:00 p.m. to July 1 11:00 p.m. 8.0-hours DLG.35 July 2 5:00 a.m. to July 2 12:00 p.m. 7.0-hours DLG.36 July 2 6:00 p.m. to July 3 12:00 p.m. 18.0-hours DLG.37 July 3 4:00 p.m. to July 4 2:00 a.m. 10.0-hours DLG.37 July 4 6:00 a.m. to July 4 4:00 p.m. 10.0-hours
Nushagak Section Drift Net
DLG.39 July 4 8:00 p.m. to July 5 6:00 a.m. 10.0-hours DLG.39 July 5 10:00 a.m. to July 5 8:00 p.m. 10.0-hours DLG.40 July 6 8:00 a.m. to July 6 2:00 p.m. 6.0-hours DLG.41 July 6 8:00 p.m. to July 7 2:00 a.m. 6.0-hours DLG.41 July 7 9:00 a.m. to July 7 5:00 p.m. 8.0-hours DLG.43 July 7 9:00 p.m. to July 8 7:00 a.m. 10.0-hours DLG.43 July 8 12:00 p.m. to July 8 10:00 p.m. 10.0-hours DLG.44 July 9 3:00 a.m. to July 9 1:00 p.m. 10.0-hours DLG.44 July 9 6:00 p.m. to July 10 2:00 a.m. 8.0-hours DLG.45 July 10 10:00 a.m. to July 10 8:00 p.m. 10.0-hours DLG.46 July 11 1:00 a.m. to July 11 9:00 a.m. 8.0-hours DLG.46 July 11 1:00 p.m. to July 11 11:00 p.m. 10.0-hours DLG.47 July 12 5:00 a.m. to July 12 5:00 p.m. 12.0-hours DLG.48 July 12 11:00 p.m. to July 13 8:00 a.m. 9.0-hours DLG.48 July 13 12:00 p.m. to July 13 8:00 p.m. 8.0-hours DLG.49 July 14 2:00 a.m. to July 14 10:00 a.m. 8.0-hours DLG.49 July 14 3:00 p.m. to July 14 11:00 p.m. 8.0-hours DLG.50 July 15 5:00 a.m. to July 15 1:00 p.m. 8.0-hours DLG.50 July 15 6:00 p.m. to July 16 2:00 a.m. 8.0-hours DLG.52 July 16 7:00 a.m. to July 16 7:00 p.m. 12.0-hours DLG.53 July 17 3:00 a.m. i
-continued-
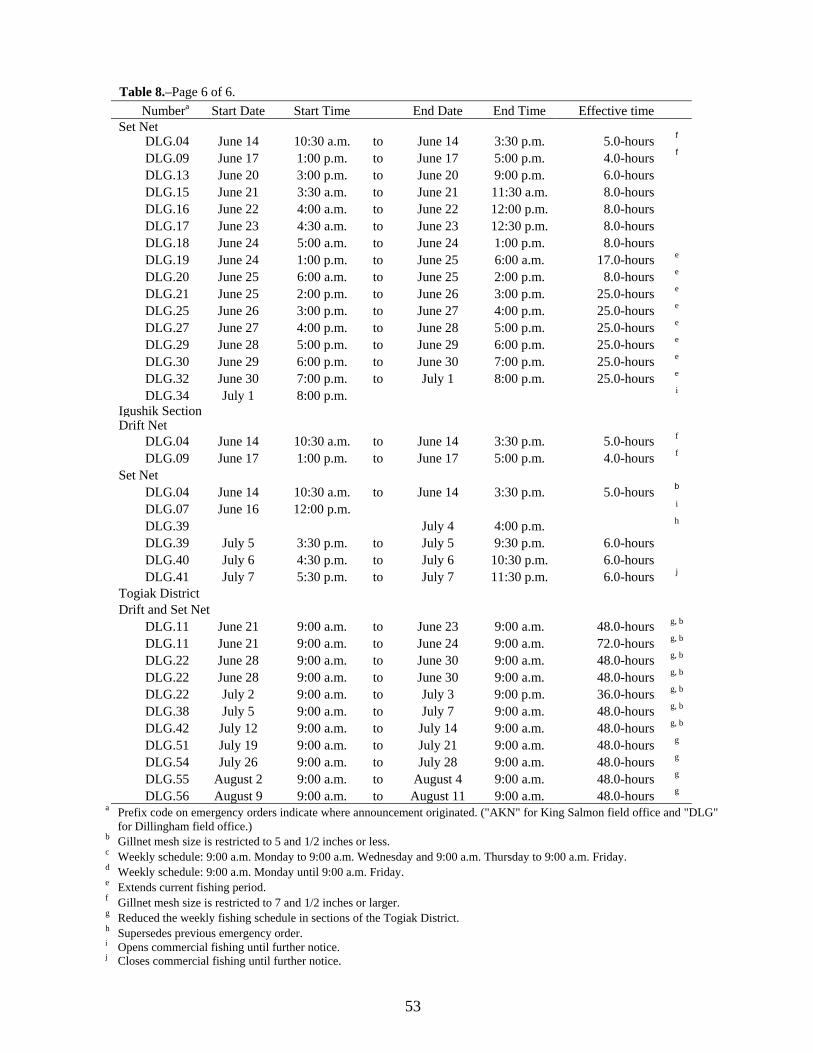
53
Table 8.–Page 6 of 6. Numbera Start Date Start Time End Date End Time Effective time
Set NetDLG.04 June 14 10:30 a.m. to June 14 3:30 p.m. 5.0-hours f DLG.09 June 17 1:00 p.m. to June 17 5:00 p.m. 4.0-hours f DLG.13 June 20 3:00 p.m. to June 20 9:00 p.m. 6.0-hours DLG.15 June 21 3:30 a.m. to June 21 11:30 a.m. 8.0-hours DLG.16 June 22 4:00 a.m. to June 22 12:00 p.m. 8.0-hours DLG.17 June 23 4:30 a.m. to June 23 12:30 p.m. 8.0-hours DLG.18 June 24 5:00 a.m. to June 24 1:00 p.m. 8.0-hours DLG.19 June 24 1:00 p.m. to June 25 6:00 a.m. 17.0-hours e DLG.20 June 25 6:00 a.m. to June 25 2:00 p.m. 8.0-hours e DLG.21 June 25 2:00 p.m. to June 26 3:00 p.m. 25.0-hours e DLG.25 June 26 3:00 p.m. to June 27 4:00 p.m. 25.0-hours e DLG.27 June 27 4:00 p.m. to June 28 5:00 p.m. 25.0-hours e DLG.29 June 28 5:00 p.m. to June 29 6:00 p.m. 25.0-hours e DLG.30 June 29 6:00 p.m. to June 30 7:00 p.m. 25.0-hours e DLG.32 June 30 7:00 p.m. to July 1 8:00 p.m. 25.0-hours e DLG.34 July 1 8:00 p.m. i
Igushik Section Drift Net
DLG.04 June 14 10:30 a.m. to June 14 3:30 p.m. 5.0-hours f DLG.09 June 17 1:00 p.m. to June 17 5:00 p.m. 4.0-hours f
Set Net DLG.04 June 14 10:30 a.m. to June 14 3:30 p.m. 5.0-hours b DLG.07 June 16 12:00 p.m. i DLG.39 July 4 4:00 p.m. h DLG.39 July 5 3:30 p.m. to July 5 9:30 p.m. 6.0-hours DLG.40 July 6 4:30 p.m. to July 6 10:30 p.m. 6.0-hours DLG.41 July 7 5:30 p.m. to July 7 11:30 p.m. 6.0-hours j
Togiak District Drift and Set Net
DLG.11 June 21 9:00 a.m. to June 23 9:00 a.m. 48.0-hours g, b DLG.11 June 21 9:00 a.m. to June 24 9:00 a.m. 72.0-hours g, b DLG.22 June 28 9:00 a.m. to June 30 9:00 a.m. 48.0-hours g, b DLG.22 June 28 9:00 a.m. to June 30 9:00 a.m. 48.0-hours g, b DLG.22 July 2 9:00 a.m. to July 3 9:00 p.m. 36.0-hours g, b DLG.38 July 5 9:00 a.m. to July 7 9:00 a.m. 48.0-hours g, b DLG.42 July 12 9:00 a.m. to July 14 9:00 a.m. 48.0-hours g, b DLG.51 July 19 9:00 a.m. to July 21 9:00 a.m. 48.0-hours g DLG.54 July 26 9:00 a.m. to July 28 9:00 a.m. 48.0-hours g DLG.55 August 2 9:00 a.m. to August 4 9:00 a.m. 48.0-hours g DLG.56 August 9 9:00 a.m. to August 11 9:00 a.m. 48.0-hours g
a Prefix code on emergency orders indicate where announcement originated. ("AKN" for King Salmon field office and "DLG" for Dillingham field office.)
b Gillnet mesh size is restricted to 5 and 1/2 inches or less. c Weekly schedule: 9:00 a.m. Monday to 9:00 a.m. Wednesday and 9:00 a.m. Thursday to 9:00 a.m. Friday. d Weekly schedule: 9:00 a.m. Monday until 9:00 a.m. Friday. e Extends current fishing period. f Gillnet mesh size is restricted to 7 and 1/2 inches or larger. g Reduced the weekly fishing schedule in sections of the Togiak District. h Supersedes previous emergency order. i Opens commercial fishing until further notice. j Closes commercial fishing until further notice.

54
Table 9.–Daily district registration of drift gillnet permit holders by district, Bristol Bay, 2004.
Date Naknek-Kvichak Egegik Ugashik Nushagak Togiak Total 6/20 187 472 27 211 33 930 6/21 250 533 26 304 33 1,146 6/22 269 553 27 337 38 1,224 6/23 271 559 25 349 43 1,247 6/24 297 553 23 360 45 1,278 6/25 307 554 28 374 49 1,312 6/26 312 558 35 384 50 1,339 6/27 318 560 37 374 49 1,338 6/28 343 564 47 384 50 1,388 6/29 348 571 49 387 54 1,409 6/30 349 573 46 387 54 1,409 7/01 352 573 46 389 55 1,415 7/02 352 571 48 390 56 1,417 7/03 354 566 48 391 56 1,415 7/04 366 552 49 391 57 1,415 7/05 368 536 50 391 58 1,403 7/06 387 493 50 395 59 1,384 7/07 377 449 65 394 61 1,346 7/08 361 414 78 399 62 1,314 7/09 349 388 146 377 62 1,322 7/10 345 361 196 370 62 1,334 7/11 336 336 264 349 62 1,347 7/12 337 324 325 346 64 1,396 7/13 346 315 349 343 70 1,423 7/14 354 305 344 339 73 1,415 7/15 377 300 328 342 75 1,422 7/16 403 290 314 336 75 1,418 7/17 415 300 331 345 75 1,466 Average 337 469 121 362 56 1,345

55
Table 10.–Commercial salmon catch by date and species, in numbers of fish, Naknek-Kvichak District, Bristol Bay, 2004.
Hours fished Deliveries Date Drift Set Drift Set Sockeye Chinook Chum Pink Coho Total6/11 a 9 b 9 1 3 0 0 0 0 3 6/14 15 b 15 6 18 1,057 3 73 0 0 1,133 6/15 24 b 24 14 35 1,680 36 97 0 0 1,813 6/16 24 b 24 9 40 1,610 2 97 1 0 1,710 6/17 24 b 24 20 48 3,176 14 124 0 1 3,315 6/18 9 b 9 16 20 1,299 3 37 0 0 1,339 6/19 d b 1 3,162 6/21 15 b 15 40 156 25,013 47 205 0 0 25,265 6/22 24 b 24 63 232 54,324 72 453 0 0 54,849 6/23 d 9 b 9 107 84 59,785 24 406 0 0 60,215 6/24 d 8 b 9 224 134 83,511 17 490 0 0 84,018 6/25 d 8 b 9 143 87 43,623 14 345 0 0 43,982 6/26 d 1 21,113 6/27 d 4/4 b 4/4 b 289 147 151,489 6 686 0 0 152,181 6/29 5 b 5 b 294 162 78,136 15 443 0 0 78,594 6/30 d 5/7.5 b 24/7.5 590 466 312,510 106 1,728 1 0 314,345 7/01 d 8/7.5 b 24 572 497 466,926 76 1,359 0 0 468,361 7/02 d 9/7 b 24 554 545 439,218 124 1,260 0 0 440,602 7/03 d 9/7 b 24 539 502 452,823 32 1,600 0 0 454,455 7/04 d 8.5/6.5 b 20 570 521 615,215 94 1,990 2 0 617,301 7/05 d 7/6 b 609 648,360 7 2,232 0 0 650,599 7/06 d 5.5/7 b,c 603 224,968 18 960 0 0 225,946 7/07 d 8/7.5 c 469 154,674 14 1,289 0 0 155,977 7/08 d 9 c 8 c 296 167 157,719 20 1,183 0 0 158,922 7/09 d 8.5/9 c 397 85 86,384 25 641 0 0 87,050 7/10 d 9 c 9 c 117 180 69,482 2 497 1 0 69,982 7/11 8 c 466 14 220,660 15 2,004 2 0 222,681 7/12 8 c 9 c 216 184 74,584 13 775 3 0 75,375 7/13 8 c 9 c 205 148 93,401 21 1,163 0 0 94,585 7/14 8/7.5 c 332 50,265 46 703 0 0 51,0147/15 8.5 c 9 c 134 108 18,751 26 467 0 0 19,244 7/16 8.5 c 8 c 70 78 15,588 29 371 2 0 15,588 7/17 8/8.5 c 105 13,942 37 355 0 0 14,334 7/18 8 c 10 c 46 26 7,736 17 232 0 0 7,985 7/19 6/15 b,c 15 b 113 39 25,782 35 946 18 0 26,781
-continued-

56
Table 10. Page 2 of 2.
Hours fished Deliveries Date Drift Set Drift Set Sockeye Chinook Chum Pink Coho Total7/20 24 b 24 b 70 73 22,436 61 816 39 1 23,353 7/21 24 b 24 b 52 74 15,541 63 664 65 2 16,335 7/22 24 b 24 b 34 50 8,581 33 386 53 3 9,056 7/23 9 b 9 b 7 13 2,031 23 89 23 0 2,166 7/26 15 b 15 b 4 2 71 16 210 53 13 363 7/27 24 b 24 b 4 25 48 35 952 10 35 1,080 7/28 24 b 24 b 1 7 0 1 106 0 4 111 7/29 24 b 24 b 1 4 5 6 140 0 37 188 7/30 9 b 9 b 2 8/02 15 15 2 5 132 8 86 763 47 1,036 8/03 24 24 3 3 6 2 33 68 57 166 8/04 24 24 1 1 23 1 13 521 22 580 8/05 24 24 2 135 0 4 591 11 741 8/06 9 9 1 2 35 0 10 376 59 480 8/09 15 15 1 7 1 108 19 135 8/10 24 24 3 2 44 2 20 1,337 239 1,642 8/11 24 24 2 6 31 6 27 748 139 951 8/12 24 24 5 4 40 2 17 2,132 241 2,432 8/13 9 9 1 0 0 27 0 16 43 8/16 15 15 1 4 2 172 34 212 8/17 24 24 1 4 0 2 18 0 303 323 8/18 24 24 1 7 11 1 7 302 222 543 8/19 24 24 1 4 2 1 14 319 269 605 8/24 24 24 2 0 0 8 0 79 87 8/25 24 24 1 0 0 3 0 30 33 9/01 24 24 1 0 0 0 0 38 38 9/02 24 24 1 0 0 0 0 185 185 9/03 9 9 1 0 0 0 0 32 32 Total 4,727,187 1,274 28,895 7,710 2,138 4,767,204
a Less than four permit holders fished, harvest confidental. b Fishery was confined to the Naknek Section only. c Fishery was confined to the Naknek River Special Harvest Area. d District test fish and cost recovery.

57
Table 11.–Commercial salmon catch by date and species, in numbers of fish, Egegik District, Bristol Bay, 2004.
Deliveries Date Hours fisheda Drift Set Sockeye Chinook Chum Pink Coho Total 6/07 b 15 127 127 6/08 b 24 167 167 6/09 b 9 49 49 6/10 15 3 8 1,948 2 133 0 0 2,083 6/11 9 1 4 1,228 2 43 0 0 1,273 6/14 15 71 91 41,568 7 2,337 0 0 43,912 6/15 24 73 115 42,225 28 1,974 0 0 44,227 6/16 9 18 32 9,203 17 382 0 0 9,602 6/17 8 76 84 39,427 19 797 0 0 40,243 6/18 8 165 88 62,902 86 1,044 0 0 64,032 6/20 c 8 433 132 238,193 96 2,922 0 0 241,211 6/21 8 234 145 209,046 85 1,665 0 0 210,796 6/22 c 8 281 112 162,559 63 1,531 0 0 164,153 6/23 c 8 551 123 245,214 74 2,513 0 0 247,801 6/25 c 8 491 109 435,989 79 2,738 0 0 438,806 6/26 c 0/8 0 240 85,232 25 116 0 0 85,373 6/27 c 12.5/13 887 301 894,973 190 4,676 0 0 899,839 6/28 c 11.5/18.5 1,008 295 720,118 169 4,092 0 0 724,379 6/29 c 8/15.5 654 205 633,660 100 3,406 0 0 637,166 6/30 c 8/15.5 536 215 712,484 76 4,120 0 0 716,680 7/1 c 8/17.5 526 349 765,921 110 2,913 0 0 768,944 7/2 8 543 138 662,822 48 3,838 0 0 666,708 7/3 c 8 556 178 636,143 54 3,855 0 0 640,052 7/4 c 4/8 499 212 645,881 48 4,203 0 0 650,132 7/5 c 9 0 6,174 0 0 0 0 6,174 7/6 c 6.5/8 397 255 432,260 20 1,772 0 0 434,052 7/7 c 7/8.5 344 233 447,981 7 1,870 0 0 449,858 7/8 c 5/24 403 346 606,665 40 2,396 0 0 609,101 7/9 c 10/19 599 345 392,770 12 2,284 0 0 395,066 7/10 c 10/24 591 240 340,944 27 2,244 0 0 343,215 7/11 c 7/24 316 168 199,500 11 1,810 0 0 201,321 7/12 c 10/24 394 184 173,670 17 2,160 0 0 175,847 7/13 c 9/19 267 210 112,510 6 1,852 0 0 114,368 7/14 8/16.5 283 162 103,285 10 2,272 0 0 105,567 7/15 14 125 89 42,235 8 1,238 0 0 43,481 7/16 24 124 83 37,054 7 1,452 0 0 38,513 7/17 9 15 25 8,334 0 304 0 0 8,638 7/19 15 34 13 15,375 9 573 0 0 15,957 7/20 24 37 15 14,251 2 591 0 0 14,844 7/21 24 25 15 9,558 0 183 0 0 9,741 7/22 24 17 10 4,795 2 98 0 0 4,895 7/23 9 3 1 1,121 0 37 0 0 1,158 7/26 15 4 2 428 0 4 0 1 433 7/27 24 6 5 1,094 0 0 0 0 1,094 7/28 24 2 2 404 0 0 0 0 404 7/29 24 3 3 749 0 0 0 0 749 8/31 b 24 1,164 1,164 9/3 b 24 164 164 9/9 b 24 1,534 1,534 Total 11,600 5,589 10,198,236 1,556 72,437 0 2,863 10,275,092
a For hours fished: first number is drift, second number is set gillnet, one number both gear groups equal time. b Less than four permits, records are confidential. c Test fish and cost recovery fish included.

58
Table 12.–Commercial salmon catch by date and species, in numbers of fish, Ugashik District, Bristol Bay, 2004.
Deliveries
Date Hours fished a Drift Set Sockeye Chinook Chum Pink Coho Total6/14 15 7 0 443 29 0 0 0 472 6/18 b 9 511 0 27 0 0 538 6/21 c 15 1 4 3,033 15 24 0 0 3,072 6/22 24 4 4 3,796 3 60 0 0 3,859 6/23 9 15 0 7,139 1 77 0 0 7,217 6/24 c 8/8.5 18 10 37,259 21 199 0 0 37,479 6/25 b 0/4.5 219 3 1 0 0 223 6/26 8 38 11 25,859 24 546 0 0 26,429 6/29 4/8 43 19 14,892 42 255 0 0 15,189 7/1 4/8 42 31 24,110 34 444 0 0 24,588 7/2 c 8/12 43 35 66,494 45 1,477 0 0 68,016 7/3 8 0 35 7,268 38 52 0 0 7,358 7/4 3/6 44 41 84,795 27 1,466 0 0 86,288 7/5 c 1 0 545 0 0 0 0 545 7/6 c 1 0 1,998 0 0 0 0 1,998 7/7 c 9 35 95 96,879 13 821 0 0 97,713 7/8 c 6/8.5 98 130 268,442 19 3,061 0 0 271,522 7/9 c 7/12 109 101 237,201 27 2,247 0 0 239,475
7/10 c 12/24 384 154 681,136 98 6,957 0 0 688,191 7/11 c 11/24 532 129 526,396 44 6,676 0 0 533,116 7/12 c 8/18.5 366 71 313,813 58 7,208 4 0 321,083 7/13 c 10 291 44 199,057 46 6,383 0 0 205,486 7/14 c 12 261 41 169,518 73 5,939 0 0 175,530 7/15 10 227 33 110,843 52 4,701 0 0 115,596 7/16 14 116 25 60,784 34 2,327 0 0 63,145 7/17 9 79 5 36,761 6 1,406 0 0 38,173 7/19 15 71 23 45,892 41 3,042 0 0 48,975 7/20 24 76 31 45,219 33 3,393 0 2 48,647 7/21 24 43 21 22,128 17 2,351 116 0 24,612 7/22 24 46 15 21,231 18 1,751 0 0 23,000 7/23 9 16 4 7,869 6 580 0 0 8,455 7/26 b 15 500 0 0 0 3 503 7/27 24 4 1 1,347 1 126 0 0 1,474 7/28 24 7 1 2,807 0 422 0 0 3,229 7/29 24 4 1 1,195 0 0 0 0 1,195 7/30 bd 9 1 170 0 0 0 4,739 4,909 Total 3,023 1,142 3,127,549 868 64,019 120 4,744 3,197,300
a For hours fished: first number is drift, second number is set gillnet, one number both gear groups equal time. b Less than four permits, records are confidential. c Test fish and cost recovery fish included. d Weekly fishing schedule was in effect 7/30 to 9/30, last salmon landed was on 9/9.

59
Table 13.–Commercial salmon catch by date and species, in numbers of fish, Nushagak District, Bristol Bay, 2004.
Hours fisheda Deliveries Date Nushagak Igushik Drift Set Sockeye Chinook Chum Pink Coho Total6/14 5 / 5 0 / 0 c 57 9 576 7,494 619 0 0 8689 6/16 0 / 0 b 0 / 12 d 0 2 189 69 0 0 0 258 6/17 4 / 4 0 / 24 96 49 5,408 13,739 759 0 0 19906 6/18 0 / 0 b 0 / 24 d 0 3 719 43 0 0 0 762 6/19 0 / 0 b 0 / 24 0 25 4,236 48 0 0 0 4284 6/20 0 / 6 0 / 24 1 159 22,710 168 683 4 0 23565 6/21 4 / 8 0 / 24 145 117 55,477 2,158 16,995 2 0 74632 6/22 0 / 8 0 / 24 27 124 18,696 606 2,155 3 0 21460 6/23 0 / 8 0 / 24 4 169 22,279 1,198 729 4 0 24210 6/24 6 /19 0 / 24 317 299 150,052 4,647 40,593 11 0 195303 6/25 0 /24 0 / 24 4 193 11,097 316 993 20 0 12426 6/26 2 /24 0 / 24 292 123 71,560 6,763 19,119 12 0 97454 6/27 12 /24 0 / 24 343 125 319,476 3,124 51,150 29 0 373779 6/28 5 /24 0 / 24 365 304 330,341 11,825 43,086 27 1 385280 6/29 3 /24 0 / 24 326 383 243,785 6,789 25,119 34 0 275727 6/30 11 /24 0 / 24 684 483 450,374 8,037 30,751 27 1 489190 7/1 13 /24 0 / 24 621 218 311,887 4,323 28,602 8 0 344820 7/2 13 /24 0 / 24 554 215 291,147 2,751 18,409 7 0 312314 7/3 20 /24 0 / 24 568 322 502,464 3,329 26,389 30 0 532212 7/4 16 /24 0 / 16 552 352 570,788 2,652 34,965 19 0 608424 7/5 16 /24 0 / 6 598 234 618,959 2,640 27,533 20 0 649152 7/6 10 /24 0 / 6 440 387 368,722 958 11,002 28 1 380711 7/7 13 /24 0 / 6 545 251 307,435 1,280 17,216 37 0 325968 7/8 17 /24 0 / 0 c 557 239 292,480 1,690 16,852 54 0 311076 7/9 16 /24 0 / 0 c 393 185 134,134 1,146 10,443 43 1 145767 7/10 12 /24 0 / 0 c 311 154 99,971 1,566 6,471 82 0 108090 7/11 18 /24 0 / 0 c 238 205 259,648 1,170 15,177 95 1 276091 7/12 13 /24 0 / 0 c 281 298 410,508 1,338 12,877 113 15 424851 7/13 16 /24 0 / 0 c 200 69 90,953 684 3,706 61 5 95409 7/14 16 /24 0 / 0 c 161 97 41,309 251 2,058 248 10 43876 7/15 14 /24 0 / 0 c 74 81 16,064 101 1,174 195 19 17553 7/16 14 /24 0 / 0 c 52 37 28,700 147 2,472 124 217 31660 7/17 21 /24 0 / 0 c 10 34 10,069 25 490 185 63 10832 7/18 24 /24 0 / 0 c 15 45 4,810 32 183 422 18 5465 7/19 24 /24 0 / 0 c 14 41 6,425 35 438 1,396 29 8323 7/20 24 /24 0 / 0 c 11 36 5,270 33 293 2,065 79 7740 7/21 24 /24 0 / 0 c 8 34 3,451 40 231 2,126 200 6048 7/22 24 /24 0 / 0 c 5 35 2,777 25 144 3,031 79 6056 7/23 24 /24 0 / 0 c 2 28 1,813 23 177 2,806 186 5005 7/24 24 /24 0 / 0 c 1 7 690 16 155 1,310 391 2562 7/28 24 /24 0 / 0 cd 1 0 0 0 0 0 119 119 7/29 24 /24 0 / 0 cd 1 0 7 1 0 0 5 13 7/31 24 /24 0 / 0 c 4 1 14 3 5 1,966 30 2018
-continued-

60
Table 13. Page 2 of 2.
Hours fisheda Deliveries Date Nushagak Igushik Drift Set Sockeye Chinook Chum Pink Coho Total8/1 24 /24 0 / 0 c 8 5 98 11 3 5,817 377 6306 8/2 24 /24 0 / 0 cd 2 0 0 0 2 380 27 409 8/3 24 /24 0 / 0 cd 2 1 27 5 0 1 197 230 8/4 24 /24 0 / 0 c 6 2 55 12 12 765 909 1753 8/5 24 /24 0 / 0 c 11 2 24 15 7 441 1,470 1957 8/6 24 /24 0 / 0 c 10 3 25 2 2 9 3,530 3568 8/7 24 /24 0 / 0 c 10 7 15 15 0 901 4,089 5020 8/8 24 /24 0 / 0 c 11 5 19 11 2 170 2,432 2634 8/9 24 /24 0 / 0 c 16 5 6 10 2 143 4,235 4396 8/10 24 /24 0 / 0 c 24 8 17 13 3 361 3,861 42558/11 24 /24 0 / 0 c 16 5 4 30 0 215 5,349 5598 8/12 24 /24 0 / 0 c 21 5 0 3 0 37 12,830 12870 8/13 24 /24 0 / 0 c 8 2 0 0 1 2 2,701 2704 8/14 24 /24 0 / 0 c 15 0 0 0 0 0 3,972 3972 8/15 24 /24 0 / 0 c 4 2 16 1 0 0 227 244 8/16 24 /24 0 / 0 cd 0 1 0 3 0 0 44 47 8/17 24 /24 0 / 0 cd 1 0 0 0 1 0 30 31 Total 958 / 1258 0 / 454 9,043 6,225 6,087,776 93,414 470,248 25,886 47,750 6,725,074
a For hours fished: first number is drift, second number is set gillnet. b The Nushagak Section closed. c The Igushik Section closed. d Less than four permits, records are confidential.
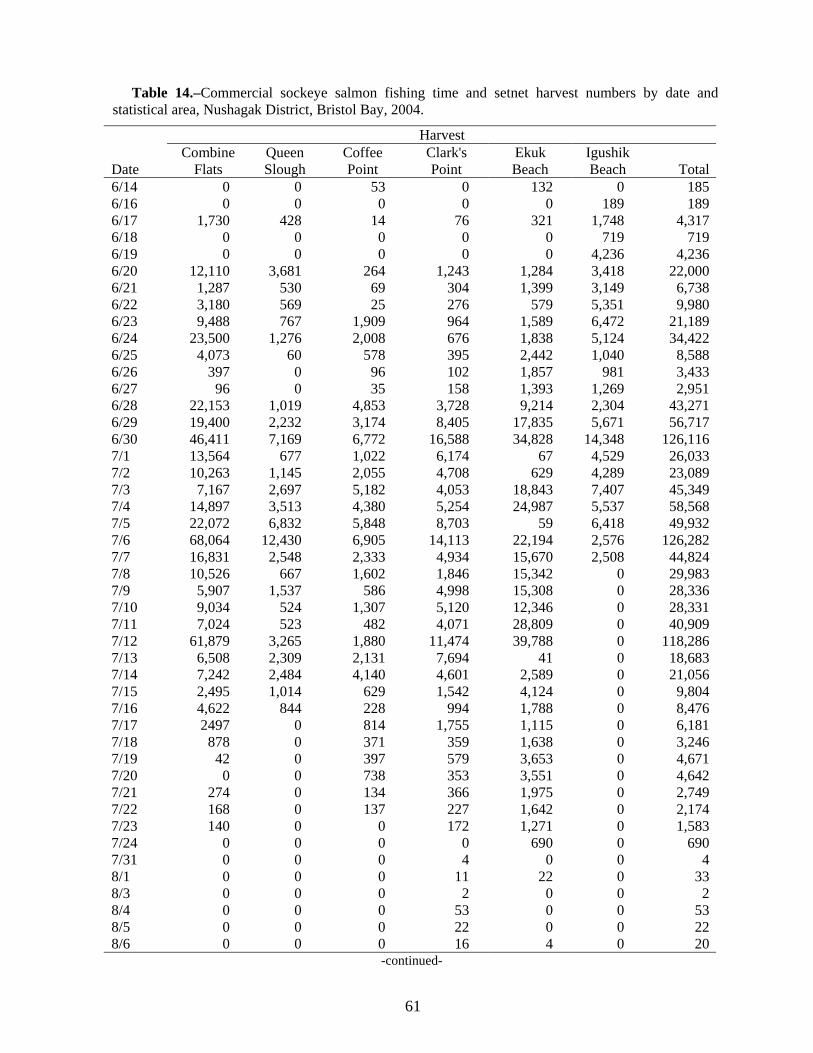
61
Table 14.–Commercial sockeye salmon fishing time and setnet harvest numbers by date and statistical area, Nushagak District, Bristol Bay, 2004.
Harvest Combine Queen Coffee Clark's Ekuk Igushik Date Flats Slough Point Point Beach Beach Total6/14 0 0 53 0 132 0 1856/16 0 0 0 0 0 189 1896/17 1,730 428 14 76 321 1,748 4,3176/18 0 0 0 0 0 719 7196/19 0 0 0 0 0 4,236 4,2366/20 12,110 3,681 264 1,243 1,284 3,418 22,0006/21 1,287 530 69 304 1,399 3,149 6,7386/22 3,180 569 25 276 579 5,351 9,9806/23 9,488 767 1,909 964 1,589 6,472 21,1896/24 23,500 1,276 2,008 676 1,838 5,124 34,4226/25 4,073 60 578 395 2,442 1,040 8,5886/26 397 0 96 102 1,857 981 3,4336/27 96 0 35 158 1,393 1,269 2,9516/28 22,153 1,019 4,853 3,728 9,214 2,304 43,2716/29 19,400 2,232 3,174 8,405 17,835 5,671 56,7176/30 46,411 7,169 6,772 16,588 34,828 14,348 126,1167/1 13,564 677 1,022 6,174 67 4,529 26,0337/2 10,263 1,145 2,055 4,708 629 4,289 23,0897/3 7,167 2,697 5,182 4,053 18,843 7,407 45,3497/4 14,897 3,513 4,380 5,254 24,987 5,537 58,5687/5 22,072 6,832 5,848 8,703 59 6,418 49,9327/6 68,064 12,430 6,905 14,113 22,194 2,576 126,2827/7 16,831 2,548 2,333 4,934 15,670 2,508 44,8247/8 10,526 667 1,602 1,846 15,342 0 29,9837/9 5,907 1,537 586 4,998 15,308 0 28,3367/10 9,034 524 1,307 5,120 12,346 0 28,3317/11 7,024 523 482 4,071 28,809 0 40,9097/12 61,879 3,265 1,880 11,474 39,788 0 118,2867/13 6,508 2,309 2,131 7,694 41 0 18,6837/14 7,242 2,484 4,140 4,601 2,589 0 21,0567/15 2,495 1,014 629 1,542 4,124 0 9,8047/16 4,622 844 228 994 1,788 0 8,4767/17 2497 0 814 1,755 1,115 0 6,1817/18 878 0 371 359 1,638 0 3,2467/19 42 0 397 579 3,653 0 4,6717/20 0 0 738 353 3,551 0 4,6427/21 274 0 134 366 1,975 0 2,7497/22 168 0 137 227 1,642 0 2,1747/23 140 0 0 172 1,271 0 1,5837/24 0 0 0 0 690 0 6907/31 0 0 0 4 0 0 48/1 0 0 0 11 22 0 338/3 0 0 0 2 0 0 28/4 0 0 0 53 0 0 538/5 0 0 0 22 0 0 228/6 0 0 0 16 4 0 20
-continued-

62
Table 14. Page 2 of 2.
Harvest Combine Queen Coffee Clark's Ekuk Igushik Date Flats Slough Point Point Beach Beach Total8/7 0 0 0 14 0 0 148/8 0 0 0 19 0 0 198/9 0 0 0 6 0 0 68/10 0 0 0 17 0 0 178/11 0 0 0 4 0 0 48/15 0 0 0 16 0 0 16Total 415,919 60,740 63,151 127,189 292,856 89,283 1,048,932

63
Table 15.–Commercial salmon catch by date and species, in numbers of fish, Togiak District, Bristol Bay, 2004.
Datea Sockeye Chinook Chum Pink Coho Total6/14 47 8 5 0 0 60 6/15 267 41 57 0 0 365 6/16 213 55 46 0 0 314 6/17 354 110 71 0 0 535 6/18 163 68 25 0 0 256 6/21 2,948 505 836 1 0 4,290 6/22 5,043 1,237 1,520 3 0 7,803 6/23 3,296 393 973 0 0 4,662 6/24 964 19 87 0 0 1,070 6/28 10,324 838 4,419 22 0 15,603 6/29 11,086 756 3,857 5 0 15,704 6/30 6,103 263 1,701 0 0 8,067 7/1 176 5 139 0 0 320 7/2 7,847 438 2,514 1 0 10,800 7/3 8,953 385 2,519 0 0 11,857 7/5 17,571 390 4,123 4 0 22,088 7/6 27,307 498 6,245 11 0 34,061 7/7 23,712 493 5,399 11 0 29,615 7/8 16,304 175 1,295 4 0 17,778 7/9 19,168 262 2,286 38 0 21,754 7/10 12,805 137 1,633 19 0 14,594 7/12 25,630 322 5,489 49 0 31,490 7/13 28,948 347 6,759 71 0 36,125 7/14 25,418 288 5,167 69 0 30,942 7/15 18,676 212 3,253 76 0 22,217 7/16 8,953 122 2,333 31 0 11,439 7/19 17,908 82 2,659 156 1 20,806 7/20 24,448 190 5,312 274 0 30,224 7/21 20,476 204 4,544 322 1 25,547 7/22 21,839 147 3,403 551 0 25,940 7/23 8,565 67 1,060 236 1 9,929 7/24 198 1 91 0 0 290 7/26 11,506 53 3,518 887 2 15,966 7/27 11,899 46 2,799 1,754 5 16,503 7/28 9,951 47 2,742 1,588 5 14,333 7/29 9,491 65 1,495 1,776 3 12,830 7/30 3,776 14 420 1,294 1 5,505 7/31 72 1 28 0 0 101 8/2 3,864 18 894 1,784 23 6,583 8/3 5,070 24 1,370 3,032 62 9,558 8/4 3,290 14 500 1,970 40 5,814 8/5 2,319 4 261 1,635 63 4,282
-continued-

64
Table 15. Page 2 of 2.
Datea Sockeye Chinook Chum Pink Coho Total8/6 787 4 98 648 34 1,571 8/19 165 0 23 0 786 974 8/20 108 1 20 0 887 1,016 8/23 10 0 1 0 126 137 8/24 231 0 18 0 1,992 2,241 8/25 110 0 8 0 981 1,099 8/30 51 0 2 0 2,414 2,467 8/31 86 0 2 0 3,129 3,217 9/2 61 0 6 0 2,239 2,306 9/3 70 0 5 0 1,832 1,907 9/6 0 0 0 0 80 80 9/7 26 0 0 0 760 786 Total 438,653 9,349 94,030 18,322 15,467 575,821
a See Table 8 for inseason adjustments to the regular weekly fishing schedule.

65
Table 16.–Commercial salmon catch by date and species, in numbers of fish, Togiak Section, Bristol Bay, 2004.
Deliveries Date Drift Set Sockeye Chinook Chum Pink Coho Total 6/14 a 2 0 47 8 5 0 0 60 6/15 4 3 267 41 57 0 0 365 6/16 5 2 213 55 46 0 0 314 6/17 5 3 354 110 71 0 0 535 6/18 3 1 163 68 25 0 0 256 6/21 17 23 1,439 318 432 0 0 2,189 6/22 35 25 2,269 887 824 3 0 3,983 6/23 22 24 2,238 250 642 0 0 3,130 6/24 4 11 964 19 87 0 0 1,070 6/28 41 50 7,063 616 2,365 6 0 10,050 6/29 51 55 5,716 523 1,988 5 0 8,232 6/30 14 6 1,850 149 551 0 0 2,550 7/2 51 55 7,847 438 2,514 1 0 10,800 7/3 69 67 8,953 385 2,519 0 0 11,857 7/5 48 61 9,400 290 2,137 0 0 11,827 7/6 68 89 12,544 395 2,325 1 0 15,265 7/7 85 84 15,327 451 4,634 3 0 20,415 7/8 41 92 16,304 175 1,295 4 0 17,778 7/9 53 99 18,924 256 2,210 38 0 21,428 7/10 31 61 12,805 137 1,633 19 0 14,594 7/12 69 92 17,852 274 4,210 36 0 22,372 7/13 76 104 18,820 321 5,464 71 0 24,676 7/14 90 102 22,059 281 4,847 69 0 27,256 7/15 85 91 18,676 212 3,253 76 0 22,217 7/16 48 30 8,953 122 2,333 31 0 11,439 7/19 55 71 15,248 65 2,126 149 1 17,589 7/20 85 109 19,298 167 4,739 274 0 24,478 7/21 84 104 18,891 193 4,404 314 1 23,803 7/22 74 106 21,839 147 3,403 551 0 25,940 7/23 22 44 8,206 64 992 236 1 9,499 7/26 64 69 11,506 53 3,518 887 2 15,966 7/27 66 83 11,853 46 2,793 1,754 5 16,451 7/28 49 69 9,951 47 2,742 1,588 5 14,333 7/29 47 45 9,491 65 1,495 1,776 3 12,830 7/30 17 14 3,776 14 420 1,294 1 5,505 8/2 28 34 3,864 18 894 1,784 23 6,583 8/3 37 46 5,070 24 1,370 3,032 62 9,558 8/4 27 35 3,290 14 500 1,970 40 5,814 8/5 20 27 2,319 4 261 1,635 63 4,282 8/6 7 6 787 4 98 648 34 1,571 8/19 6 2 165 0 23 0 786 974 8/20 6 2 108 1 20 0 887 1,016 8/23 a 2 0 10 0 1 0 126 137 8/24 11 4 231 0 18 0 1,992 2,241 8/25 7 3 110 0 8 0 981 1,099 8/30 7 9 51 0 2 0 2,414 2,467 8/31 11 12 86 0 2 0 3,129 3,217 9/2 12 7 61 0 6 0 2,239 2,306 9/3 8 9 70 0 5 0 1,832 1,907 9/6 a 2 0 0 0 0 0 80 80 9/7 7 1 26 0 0 0 760 786 1,778 2,141 357,354 7,707 76,307 18,255 15,467 475,090
a Less than three permits, records are confidential.

66
Table 17.–Commercial salmon catch by date and species, in numbers of fish, Kulukak Section, Bristol Bay, 2004.
Deliveries Date a Drift Set Sockeye Chinook Chum Pink Coho Total 6/21 2 12 1,509 187 404 1 0 2,101 6/22 2 15 2,774 350 696 0 0 3,820 6/23 0 6 1,058 143 331 0 0 1,532 6/28 12 30 3,261 222 2,054 16 0 5,553 6/29 16 42 5,370 233 1,869 0 0 7,472 6/30 12 13 4,253 114 1,150 0 0 5,517 7/5 20 52 8,171 100 1,986 4 0 10,261 7/6 31 56 14,763 103 3,920 10 0 18,796 7/7 14 23 8,385 42 765 8 0 9,200 7/12 11 41 7,778 48 1,279 13 0 9,118 7/13 16 45 10,128 26 1,295 0 0 11,449 7/14 3 22 3,359 7 320 0 0 3,686 7/19 4 25 2,660 17 533 7 0 3,217 7/20 7 32 5,150 23 573 0 0 5,746 7/21 5 14 1,585 11 140 8 0 1,744 Total 155 428 80,204 1,626 17,315 67 0 99,212
a Kulukak Section is open three days per week. See Table 8 for inseason adjustments to the weekly fishing schedule.
Table 18.–Commercial salmon catch by date and species, in numbers of fish, Matogak Section, Bristol Bay, 2004.
Datea Sockeye Chinook Chum Pink Coho Total 7/9 244 6 76 0 0 326 7/23 359 3 68 0 0 430 7/24 198 1 91 0 0 290 7/27 46 0 6 0 0 52 7/31 72 1 28 0 0 101 Total 919 11 269 0 0 1,199
a Matogak and Osviak Sections open five days per week. See Table 8 for inseason adjustments to the weekly fishing schedule.
Table 19.–Commercial salmon catch by date and species, in numbers of fish, Osviak Section, Bristol Bay, 2004.
Date Sockeye Chinook Chum Pink Coho Total 7/1 176 5 139 0 0 320 Total 176 5 139 0 0 320

67
Table 20.–Commercial salmon catch by district and species, in number of fish, Bristol Bay, 2004.
District and River System Sockeye Chinook Chum Pink Coho Total
NAKNEK-KVICHAK DISTRICT Kvichak River 1,832,101 Branch River 1,113,282 Naknek River 1,781,804 Total 4,727,187 1,274 28,895 7,710 2,138 4,767,204 EGEGIK DISTRICT 10,198,236 1,556 72,437 0 2,863 10,275,092 UGASHIK DISTRICT 3,127,549 868 64,019 120 4,744 3,197,300 NUSHAGAK DISTRICT Wood River 3,832,231 Igushik River 454,392 Nushagak-Mulchatna 1,801,153 Total 6,087,776 93,414 470,248 25,886 47,750 6,725,074 TOGIAK DISTRICT Togiak Section 357,354 7,707 76,307 18,255 15,467 475,090 Kulukak Section 80,204 1,626 17,315 67 0 99,212 Matogak Section 919 11 269 0 0 1,199 Osviak Section 176 5 139 0 0 320 Total 438,653 9,349 94,030 18,322 15,467 575,821 TOTAL BRISTOL BAY 24,579,401 106,461 729,629 52,038 72,962 25,540,491

68
Table 21.–Commercial sockeye salmon catch by date and sub-district, in numbers of fish, General District, Bristol Bay, 2004.
Sub-district
Outer Northern Central Southern Totals Date Deliveries Deliveries Deliveries Deliveries Daily Cumulative 6/7 0 0 0 0 2 183 2 16 199 199 6/8 0 0 1 6 6 432 8 250 688 887 6/9 0 0 1 135 4 743 13 1,138 2,016 2,903
6/10 4 246 3 206 7 812 18 2,578 3,842 6,745 6/11 0 0 3 155 30 6,972 17 2,407 9,534 16,279 6/14 4 249 21 1,727 56 16,787 59 15,131 33,894 50,173 6/15 24 2,256 28 3,155 168 49,159 120 34,811 89,381 139,554 6/16 23 4,991 46 7,044 291 85,710 156 43,018 140,763 280,317 6/17 22 5,470 66 13,494 316 121,586 138 48,770 189,320 469,637 6/18 37 8,965 78 18,858 258 103,705 94 46,088 177,616 647,253 6/21 148 79,414 229 103,257 200 157,752 74 59,388 399,811 1,047,064 6/22 259 95,667 329 177,603 297 220,535 145 128,925 622,730 1,669,794 Total 521 197,258 805 325,640 1,635 764,376 844 382,520 1,669,794

69
Table 22.– Daily sockeye salmon escapement tower counts by river system, eastside Bristol Bay, 2004.
Kvichak River Naknek River Alagnak River Egegik River Ugashik River Date Daily Cumulative Daily Cumulative Daily Cumulative Daily Cumulative Daily Cumulative6/17 14,718 14,718 6/18 16,728 31,446 6/19 7,368 7,368 9,132 40,578 6/20 4,710 12,078 28,968 69,546 6/21 7,776 19,854 55,188 124,734 6/22 8,964 28,818 15,600 140,334 6/23 390 390 22,344 51,162 3,150 143,484 6/24 714 1,104 52,224 103,386 3,084 146,568 6/25 3,570 4,674 8,904 112,290 7,302 7,302 1,962 148,530 6/26 19,290 23,964 6,300 118,590 1,026 8,328 30,156 178,686 1,506 1,506 6/27 23,364 47,328 57,648 176,238 804 9,132 146,256 324,942 822 2,328 6/28 4,992 52,320 145,290 321,528 3,984 13,116 200,346 525,288 600 2,928 6/29 28,038 80,358 122,622 444,150 89,778 102,894 119,562 644,850 198 3,126 6/30 270,870 351,228 83,766 527,916 103,806 206,700 34,458 679,308 450 3,576 7/01 410,034 761,262 65,610 593,526 76,830 283,530 17,784 697,092 480 4,056 7/02 216,042 977,304 62,274 655,800 38,514 322,044 7,710 704,802 234 4,290 7/03 107,070 1,084,374 62,520 718,320 66,960 389,004 3,270 708,072 258 4,548 7/04 230,514 1,314,888 65,634 783,954 87,852 476,856 9,798 717,870 474 5,022 7/05 315,216 1,630,104 116,964 900,918 58,572 535,428 10,560 728,430 264 5,286 7/06 175,680 1,805,784 362,418 1,263,336 356,262 891,690 93,960 822,390 720 6,006 7/07 350,016 2,155,800 87,060 1,350,396 742,620 1,634,310 88,296 910,686 2,964 8,970 7/08 598,722 2,754,522 31,674 1,382,070 482,172 2,116,482 134,364 1,045,050 35,970 44,940 7/09 543,888 3,298,410 78,972 1,461,042 104,934 2,221,416 139,614 1,184,664 120,090 165,030 7/10 393,456 3,691,866 38,382 1,499,424 226,368 2,447,784 32,130 1,216,794 155,706 320,736
-continued-

70
Table 22. Page 2 of 2.
Kvichak River Naknek River Alagnak River Egegik River Ugashik River Date Daily Cumulative Daily Cumulative Daily Cumulative Daily Cumulative Daily Cumulative7/11 291,966 3,983,832 131,394 1,630,818 257,268 2,705,052 11,730 1,228,524 88,740 409,476 7/12 227,874 4,211,706 98,826 1,729,644 705,588 3,410,640 46,578 1,275,102 93,018 502,494 7/13 432,930 4,644,636 59,622 1,789,266 450,450 3,861,090 5,856 1,280,958 73,638 576,132 7/14 349,326 4,993,962 53,958 1,843,224 595,950 4,457,040 4,104 1,285,062 43,140 619,272 7/15 208,080 5,202,042 17,736 1,860,960 390,114 4,847,154 5,082 1,290,144 19,956 639,228 7/16 129,144 5,331,186 16,308 1,877,268 75,618 4,922,772 13,422 652,650 7/17 41,892 5,373,078 49,860 1,927,128 211,182 5,133,954 6,264 658,914 7/18 59,766 5,432,844 12,246 1,939,374 69,972 5,203,926 11,550 670,464 7/19 26,460 5,459,304 23,976 5,227,902 16,944 687,408 7/20 15,252 5,474,556 26,850 5,254,752 23,622 711,030 7/21 10,080 5,484,636 54,972 5,309,724 38,502 749,532 7/22 15,498 5,500,134 86,868 5,396,592 9,096 758,628 7/23 10,056 768,684 7/24 7,680 776,364

71
Table 23.–Daily sockeye salmon escapement tower counts by river system,westside Bristol Bay, 2004.
Wood River Igushik River Nuyakuk River Togiak River Date Daily Cumulative Daily Cumulative Daily Cumulative Daily Cumulative 6/17 3,756 3,756 6/18 2,100 5,856 6/19 38,094 43,950 6/20 23,538 67,488 6/21 8,730 76,218 594 594 6/22 3,240 79,458 918 1,512 6/23 71,934 151,392 264 1,776 6/24 30,414 181,806 2,538 4,314 6/25 40,518 222,324 1,998 6,312 6/26 22,392 244,716 1,728 8,040 384 384 6/27 5,724 250,440 768 8,808 2,532 2,916 6/28 2,316 252,756 144 8,952 3,408 6,324 6/29 101,682 354,438 90 9,042 4,548 10,872 6/30 128,256 482,694 108 9,150 4,056 14,928 7/01 98,574 581,268 84 9,234 3,612 18,540 7/02 39,474 620,742 1,068 10,302 1,926 20,466 7/03 31,518 652,260 4,116 14,418 1,500 21,966 840 840 7/04 65,700 717,960 1,374 15,792 5,262 27,228 912 1,752 7/05 88,020 805,980 720 16,512 9756a 36,984 1,230 2,982 7/06 111,948 917,928 804 17,316 6,000 42,984 1,908 4,890 7/07 133,680 1,051,608 2,568 19,884 5,202 48,186 1,800 6,690 7/08 87,606 1,139,214 2,874 22,758 3,426 51,612 3,534 10,224 7/09 77,472 1,216,686 2,394 25,152 5,124 56,736 2,808 13,032 7/10 51,636 1,268,322 1,554 26,706 4,860 61,596 2,802 15,834 7/11 30,180 1,298,502 996 27,702 5,844 67,440 1,548 17,382 7/12 30,666 1,329,168 3,036 30,738 4,830 72,270 2,418 19,800 7/13 52,728 1,381,896 5,622 36,360 1,968 74,238 1,350 21,150 7/14 82,116 1,464,012 9,930 46,290 1,116 75,354 2,094 23,244 7/15 42,144 1,506,156 13,740 60,030 972 76,326 4,260 27,504 7/16 19,242 1,525,398 11,010 71,040 816 77,142 2,010 29,514 7/17 17,944 1,543,342 12,264 83,304 264a 77,406 1,674 31,188 7/18 11,880 95,184 2,580 33,768 7/19 5,940 101,124 2,388 36,156 7/20 3,750 104,874 6,054 42,210 7/21 3,006 107,880 10,962 53,172 7/22 1,770 109,650 10,758 63,930 7/23 3,438 67,368 7/24 2,358 69,726 7/25 2,970 72,696 7/26 4,164 76,860 7/27 8,802 85,662 7/28 7,476 93,138 7/29 7,086 100,224 7/30 7,692 107,916
-continued-

72
Table 23. Page 2 of 2.
Wood River Igushik River Nuyakuk River Togiak River Date Daily Cumulative Daily Cumulative Daily Date Daily Cumulative 7/31 2,844 110,760 8/01 2,256 113,016 8/02 1,962 114,978 8/03 1,794 116,772 8/04 4,938 121,710 8/05 3,552 125,262 8/06 2,676 127,938 8/07 1,524 129,462
a denotes a partial count

73
Table 24.– Final daily and cumulative escapement estimates by species, Nushagak River sonar project, Bristol Bay, 2004.
Sockeye Chinook Chum Pink Coho Total Date Daily Cum. Daily Cum. Daily Cum. Daily Cum. Daily Cum. Daily Cum. 6/8 0 0 660 660 0 0 0 0 0 0 660 660 6/9 0 0 1,119 1,779 0 0 0 0 0 0 1,119 1,779 6/10 0 0 1,266 3,045 0 0 0 0 0 0 1,266 3,045 6/11 0 0 1,066 4,111 0 0 0 0 0 0 1,066 4,111 6/12 1,186 1,186 3,024 7,135 1,099 1,099 0 0 0 0 5,309 9,420 6/13 821 2,008 4,863 11,998 2,110 3,209 0 0 0 0 7,794 17,214 6/14 145 2,152 2,494 14,492 450 3,659 0 0 0 0 3,089 20,303 6/15 195 2,347 881 15,373 1,011 4,670 0 0 0 0 2,087 22,390 6/16 403 2,750 958 16,331 1,633 6,303 0 0 0 0 2,993 25,383 6/17 2,499 5,249 2,543 18,874 10,674 16,976 0 0 0 0 15,716 41,099 6/18 4,120 9,369 3,516 22,389 5,334 22,311 0 0 0 0 12,970 54,069 6/19 9,550 18,919 20,395 42,784 24,978 47,289 0 0 0 0 54,923 108,992 6/20 29,527 48,445 10,629 53,414 46,225 93,514 0 0 0 0 86,381 195,373 6/21 17,754 66,199 3,004 56,418 16,835 110,349 0 0 0 0 37,593 232,966 6/22 6,146 72,345 2,127 58,544 14,700 125,050 0 0 0 0 22,973 255,939 6/23 8,452 80,796 5,192 63,736 15,504 140,554 0 0 0 0 29,147 285,086 6/24 36,530 117,326 11,428 75,164 16,626 157,179 0 0 0 0 64,584 349,670 6/25 29,831 147,158 2,208 77,373 6,699 163,879 0 0 0 0 38,739 388,409 6/26 14,901 162,059 1,304 78,677 4,997 168,875 0 0 0 0 21,202 409,611 6/27 12,704 174,763 2,536 81,212 12,510 181,386 0 0 0 0 27,750 437,361 6/28 7,114 181,877 724 81,936 6,655 188,040 0 0 0 0 14,493 451,854 6/29 25,240 207,117 1,734 83,670 2,109 190,150 0 0 0 0 29,083 480,937 6/30 37,925 245,042 3,653 87,323 14,556 204,706 0 0 0 0 56,135 537,072 7/1 45,691 290,733 4,584 91,908 12,777 217,483 0 0 0 0 63,052 600,124 7/2 18,282 309,015 2,778 94,685 4,025 221,509 0 0 0 0 25,085 625,209 7/3 9,060 318,075 1,820 96,505 599 222,107 0 0 0 0 11,479 636,688 7/4 12,969 331,045 1,164 97,670 3,344 225,452 0 0 0 0 17,478 654,166 7/5 25,240 356,285 2,824 100,493 2,954 228,406 0 0 0 0 31,018 685,184
-continued-

74
Table 24. Page 2 of 3.
Sockeye Chinook Chum Pink Coho Total Date Daily Cum. Daily Cum. Daily Cum. Daily Cum. Daily Cum. Daily Cum. 7/6 23,859 380,144 1,978 102,471 8,132 236,538 0 0 0 0 33,969 719,153 7/7 37,406 417,550 3,839 106,310 5,364 241,902 0 0 0 0 46,609 765,762 7/8 21,749 439,299 1,359 107,669 4,080 245,982 0 0 0 0 27,189 792,951 7/9 5,448 444,747 639 108,308 2,901 248,883 0 0 0 0 8,987 801,938 7/10 4,788 449,535 240 108,548 547 249,430 0 0 0 0 5,575 807,513 7/11 3,247 452,782 515 109,063 253 249,683 0 0 0 0 4,015 811,528 7/12 1,273 454,054 557 109,620 317 250,000 0 0 0 0 2,147 813,675 7/13 3,575 457,629 312 109,932 512 250,513 0 0 0 0 4,399 818,074 7/14 8,385 466,014 506 110,438 2,385 252,898 0 0 0 0 11,276 829,350 7/15 4,643 470,657 602 111,040 2,195 255,093 0 0 0 0 7,440 836,790 7/16 2,923 473,580 162 111,202 625 255,717 0 0 0 0 3,709 840,499 7/17 3,074 476,654 159 111,361 2,757 258,474 0 0 265 265 6,255 846,754 7/18 1,124 477,778 160 111,521 1,956 260,430 0 0 166 431 3,406 850,160 7/19 729 478,507 243 111,764 754 261,184 0 0 108 539 1,834 851,994 7/20 1,218 479,725 183 111,947 507 261,691 0 0 102 641 2,010 854,004 7/21 998 480,723 592 112,539 153 261,844 0 0 97 738 1,841 855,845 7/22 1,183 481,907 412 112,951 153 261,998 0 0 176 914 1,924 857,769 7/23 1,430 483,337 179 113,130 104 262,102 0 0 630 1,544 2,344 860,113 7/24 1,188 484,525 284 113,414 2,824 264,926 22 22 579 2,123 4,898 865,011 7/25 0 484,525 57 113,471 3,547 268,473 4,480 4,502 4,382 6,505 12,466 877,477 7/26 0 484,525 0 113,471 2,253 270,726 1,472 5,974 13,926 20,432 17,651 895,128 7/27 0 484,525 174 113,646 262 270,987 10,125 16,098 2,294 22,726 12,855 907,983 7/28 879 485,405 26 113,671 1,902 272,890 4,882 20,980 5,479 28,206 13,169 921,152 7/29 809 486,214 659 114,330 1,904 274,794 13,715 34,696 1,890 30,096 18,977 940,129 7/30 0 486,214 1,809 116,139 0 274,794 30,787 65,483 888 30,984 33,485 973,614 7/31 78 486,292 0 116,139 78 274,872 33,406 98,889 2,291 33,275 35,853 1,009,467
-continued-

75
Table 24. Page 3 of 3.
Sockeye Chinook Chum Pink Coho Total Date Daily Cum. Daily Cum. Daily Cum. Daily Cum. Daily Cum. Daily Cum. 8/1 3,036 489,328 0 116,139 740 275,611 54,583 153,472 1,756 35,031 60,115 1,069,582 8/2 1,391 490,720 8 116,147 3,264 278,876 36,260 189,732 661 35,692 41,584 1,111,166 8/3 0 490,720 8 116,155 78 278,954 51,117 240,849 1,727 37,419 52,930 1,164,096 8/4 0 490,720 5 116,159 84 279,038 25,888 266,737 1,366 38,784 27,343 1,191,439 8/5 32 490,751 6 116,165 1,624 280,663 23,074 289,811 1,503 40,287 26,239 1,217,678 8/6 91 490,842 0 116,165 8 280,671 22,282 312,093 935 41,222 23,315 1,240,993 8/7 0 490,842 198 116,364 2,970 283,641 68,645 380,738 6,071 47,293 77,885 1,318,878 8/8 856 491,698 0 116,364 14 283,655 44,805 425,543 7,214 54,507 52,888 1,371,766 8/9 0 491,698 14 116,378 150 283,805 33,096 458,639 3,618 58,125 36,879 1,408,645 8/10 0 491,698 23 116,400 0 283,805 25,346 483,985 7,597 65,722 32,965 1,441,610 8/11 0 491,698 0 116,400 0 283,805 24,546 508,530 10,368 76,090 34,914 1,476,524 8/12 0 491,698 0 116,400 0 283,805 25,191 533,721 1,066 77,156 26,256 1,502,780 8/13 0 491,698 0 116,400 0 283,805 12,306 546,027 23,140 100,296 35,446 1,538,226 8/14 0 491,698 0 116,400 0 283,805 614 546,640 39,240 139,536 39,854 1,578,080 8/15 0 491,698 0 116,400 0 283,805 6,077 552,717 8,537 148,073 14,614 1,592,694 8/16 0 491,698 0 116,400 0 283,805 3,348 556,065 4,540 152,613 7,888 1,600,582

76
Table 25.–Comparison of daily sockeye salmon escapement estimates by tower count, aerial survey and river test fishing enumeration methods, Kvichak River, Bristol Bay, 2004.
Tower Count Aerial Survey River Test Fishing Fish per Index Points Cumulative Estimated
Date Daily Cum. Total Index Pt.a Daily Cum. Escapement River Fish b 6/20 85 48 48 4,080
6/21 85 46 94 7,990 6/22 85 0 94 7,990 6/23 390 390 85 312 406 34,510 6/24 714 1,104 85 178 584 49,640 50,000 6/25 3,570 4,674 50 42 626 31,300 27,000
6/26 19,290 23,964 50 14 640 32,000 10,000 6/27 23,364 47,328 75 45 685 51,375 8,000 6/28 4,992 52,320 76 1,492 2,177 165,452 115,000 6/29 28,038 80,358 76 2,951 5,128 389,728 400,000 6/30 270,870 351,228 150 5,136 10,264 1,539,600 1,200,000
7/01 410,034 761,262 142 2,563 12,827 1,821,434 1,000,000 7/02 216,042 977,304 76 2,000 c 14,827 1,126,852 500,000 7/03 107,070 1,084,374 76 4,654 19,481 1,480,556 500,000 7/04 230,514 1,314,888 54 4,065 23,546 1,271,484 200,000 7/05 315,216 1,630,104 69 9,657 33,203 2,291,007 700,000
7/06 175,680 1,805,784 65 13,160 46,363 3,013,595 1,200,000 7/07 350,016 2,155,800 63 8,376 54,739 3,448,557 900,000 7/08 598,722 2,754,522 54 3,561 58,300 3,148,200 400,000 7/09 543,888 3,298,410 64 6,071 64,371 4,119,744 800,000 7/10 393,456 3,691,866 61 3,762 68,133 4,156,113 500,000
7/11 291,966 3,983,832 62 10,037 78,170 4,846,540 800,000 7/12 227,874 4,211,706 62 5,370 83,540 5,179,480 900,000 7/13 432,930 4,644,636 60 5,025 88,565 5,313,900 600,000 7/14 349,326 4,993,962 58 5,185 93,750 5,437,500 400,000 7/15 208,080 5,202,042 58 757 94,507 5,481,406 250,000
7/16 129,144 5,331,186 58 2,232 96,739 5,610,862 130,000 7/17 41,892 5,373,078 7/18 59,766 5,432,844 7/19 26,460 5,459,304 7/20 15,252 5,474,556
7/21 10,080 5,484,636 7/22 15,498 5,500,134
a The preseason FPI of 85 was based on the season ending FPI in 1999. 2004 had a similar run projection of an inshore return and age composition as that which occurred in 1999. The preseason FPI of 85 was used through June 24. Thereafter, FPI's were based on lag-time relationships.
b Estimated river fish (ERF) was based on the river test fish cumulative escapement estimate less the cumulative tower count. On occasion, staff adjusted the ERF based on aerial surveys, catchability, etc.
c The daily index originally calculated as 6,818 was believed to be high and downgraded to 2,000 on July 5.

77
Table 26.–Comparison of daily sockeye salmon escapement estimates by tower count, aerial survey and river test fishing enumeration methods, Egegik River, Bristol Bay, 2004.
Tower Count Aerial Survey River Test Fishing Estimated Fish per Index Points Cumulative Estimated
Date Daily Cum. Total Index Pta Daily Cum. Escapement River Fishb 6/12 1,600 6/14 81 119 119 9,639 6/15 81 34 153 12,393 6/16 81 160 313 25,353 25,000 6/17 14,718 14,718 9,550 81 406 719 58,239 45,000 6/18 16,728 31,446 81 147 866 70,146 40,000 6/19 9,132 40,578 81 60 926 75,006 35,000 6/20 28,968 69,546 14,400 89 875 1,801 160,289 90,000 6/21 55,188 124,734 100 194 1,995 199,500 75,000 6/22 15,600 140,334 92 184 2,179 200,468 60,000 6/23 3,150 143,484 77 55 2,234 172,018 30,000 6/24 3,084 146,568 66 58 2,292 151,272 4,000 6/25 1,962 148,530 65 32 2,324 151,060 2,000 6/26 30,156 178,686 73 3,015 5,339 389,747 210,000 6/27 146,256 324,942 65 2,473 7,812 507,780 180,000 6/28 200,346 525,288 67 286 8,098 542,566 20,000 6/29 119,562 644,850 82 207 8,305 681,010 60,000 6/30 34,458 679,308 82 461 8,766 718,812 40,000 7/01 17,784 697,092 82 367 9,133 748,906 50,000 7/02 7,710 704,802 78 120 9,253 721,734 15,000 7/03 3,270 708,072 77 249 9,502 731,654 15,000 7/04 9,798 717,870 77 111 9,613 740,201 15,000 7/05 10,560 728,430 76 1,111 10,724 815,024 90,000 7/06 93,960 822,390 17,500 80 1,554 12,278 982,240 140,000 7/07 88,296 910,686 78 1,032 13,310 1,038,180 120,000 7/08 134,364 1,045,050 81 359 13,669 1,107,189 80,000 7/09 139,614 1,184,664 88 325 13,994 1,231,472 50,000 7/10 32,130 1,216,794 88 310 14,304 1,258,752 35,000 7/11 11,730 1,228,524 86 376 14,680 1,262,480 30,000 7/12 46,578 1,275,102 87 213 14,893 1,295,691 20,000 7/13 5,856 1,280,958 86 144 15,037 1,293,182 10,000 7/14 4,104 1,285,062 7/15 5,082 1,290,144 7/19 5,900
a A six-year mean FPI of 81, based on season ending FPI's of large inshore runs with a high 2 ocean age component, was used through June 19. Thereafter, FPI's were based on lag-time relationships.
b Estimated river fish (ERF) was based on the river test fish cumulative escapement estimate less the cumulative tower count. On occasion, staff adjusted the ERF based on aerial surveys, catchability, etc.

78
Table 27.–Comparison of daily sockeye salmon escapement estimates by tower count, aerial survey and river test fishing enumeration methods, Ugashik River, Bristol Bay, 2004.
Tower Count Aerial Survey River Test Fishing Estimated Fish per Index Points Cumulative Estimated Date Daily Cum. Total Index Pt.a Daily Cum. Escapement RiverFishb
6/22 65 252 252 16,380 6/23 65 90 342 22,230 22,000 6/24 65 126 468 30,420 30,000 6/25 65 39 507 32,955 30,000 6/26 1,506 1,506 315 65 48 555 36,075 25,000 6/27 822 2,328 65 36 591 38,415 20,000 6/28 600 2,928 0 65 30 621 40,365 15,000 6/29 198 3,126 65 33 654 42,510 10,000 6/30 450 3,576 65 35 689 44,785 10,000 7/01 480 4,056 65 19 708 46,020 5,000 7/02 234 4,290 65 14 722 46,930 1,000 7/03 258 4,548 65 29 751 48,815 1,000 7/04 474 5,022 65 29 780 50,700 1,000 7/05 264 5,286 65 87 867 56,355 1,000 7/06 720 6,006 17,500 65 173 1,040 67,600 10,000 7/07 2,964 8,970 65 2,395 3,435 223,275 160,000 7/08 35,970 44,940 52 3,135 6,570 341,640 280,000 7/09 120,090 165,030 36,000 51 4,634 11,204 571,404 400,000 7/10 155,706 320,736 45 2,699 13,903 625,635 300,000 7/11 88,740 409,476 1,000 34 2,624 16,527 561,918 150,000 7/12 93,018 502,494 33 1,869 18,396 607,068 100,000 7/13 73,638 576,132 33 1,603 19,999 659,967 70,000 7/14 43,140 619,272 31 1,174 21,173 656,363 35,000 7/15 19,956 639,228 31 540 21,713 673,103 15,000 7/16 13,422 652,650 7/17 6,264 658,914 7/18 11,550 670,464 7/19 16,944 687,408 1,000 7/20 23,622 711,030 7/21 38,502 749,532 7/22 9,096 758,628 7/23 10,056 768,684 7/24 7,680 776,364
a A two-year mean FPI of 65 was used through July 7. This value was based on season ending FPI's of recent year inshore runs (1999 and 2002) that contained a high 2 ocean age component. Thereafter, FPI's were based on lag-time relationships.
b Estimated river fish (ERF) was based on the river test fish cumulative escapement estimate less the cumulative tower count. On occasion, staff adjusted the ERF based on aerial surveys, catchability, etc.

79
Table 28.–Commercial salmon processors and buyers operating in Bristol Bay, 2004.
Name of Operator/Buyer a Base of Operations Districtb Methodc Export1 Alaska Family Seafoods Dillingham, AK N EF,F AIR 2 Alaska General Seafoods Kenmore, WA GD,K,E,U C,EF,F AIR 3 Aleutian Maid Processors, LLC Egegik, AK E F SEA,AIR4 Alpine Cove, LLC Kodiak, AK E,N,U F SEA 5 Alyce C. Todd Montello, WI N,U F SEA,AIR6 Anthony Wood King Salmon, AK K F SEA 7 Banacon Inc. Dillingham, AK N EF AIR 8 Barbara J.Hill Naknek, AK K EF N/A 9 Baywatch Seafoods, LLC Woodinville, WA K,E,U,N,T EF,F SEA,AIR10 Coffee Point Seafoods of WA, LLC S. Seattle, WA E F SEA 11 CSP Seafoods Wasilla, AK T d d 12 Dancing Salmon Company, LLC Dillingham, AK N F,S AIR 13 Diamond Lodge King Salmon, AK K EF,F,S AIR 14 Fisherman's Express, LLC Anchorage, AK N F AIR 15 Friedman Family Fisheries, Inc. Baltimore, MD N F SEA,AIR16 Great Ruby Fish Company Anchorage, AK K EF,F AIR 17 Icicle Seafoods, Inc. Seattle, WA GD,K,E,U,N C,F SEA 18 Interior Alaska Fish Processors, Inc. Fairbanks, AK N EF AIR 19 Kim J. Hubert Eagle River, AK T EF N/A 20 Lady Marion Seafoods Anchorage, AK GD,E EF,F AIR 21 Libby Bro. Wild Alaskan Harvest Anchorage, AK N EF,F AIR 22 Leader Creek Fisheries, LLC Seattle, WA GD,K,E,U,N EF,F SEA,AIR23 NorQuest Seafoods, Inc. Seattle, WA GD,K,E,U,N F SEA 24 Ocean Beauty Seafoods, Inc. Seattle, WA GD,K,E,U,N C,EF,F SEA,AIR25 Pacman Fisheries/Bristol Gold, LLC Naknek, AK K S,F AIR 26 Pederson Point Seattle, WA K,E,U F SEA 27 Peter Pan Seafoods, Inc. Seattle, WA GD,K,E,U,N C,EF,F SEA,AIR28 Snopac Products, Inc. Seattle, WA GD,K,E,U F SEA 29 Togiak Fisheries Seattle, WA T F SEA 30 Trident Seafoods Seattle, WA GD,K,E,U,N C,F SEA,AIR31 Ugashik Wild Salmon Ugashik, AK U C,EF AIR 32 Westwind Seafoods, LLC Seattle,WA N,T F SEA 33 Wild Alaskan Seafood Co., LLC Spokane, WA N F SEA 34 Woodbine Alaska Fish Company Rio Vista, CA E,U,T C,F AIR 35 Yard Arm Knot Fisheries, LLC Seattle, WA GD,K,E,U C,F SEA Canning=8; Freezing= 29; Fresh=15; Curing=3; Air Export=21; Sea Export=19
a Indicates operators with a processing facility in a district or operators from other areas buying fish and/or providing support service for fishers in districts away from the facility.
b GD=General District; K=Naknek-Kvichak; E=Egegik; U=Ugashik; N=Nushagak; T=Togiak. c Type of processing: C=canned; EF=export fresh; F=frozen; S=cured. d Registered but did not operate.

80
Table 29.–Mean round weight, price per pound, and total exvessel value of the commercial salmon catch, Bristol Bay, 2004.
Species Total Catch (lbs.) Mean Weighta (lbs.) Mean Price ($/lb.) Exvessel Value ($) Sockeye 148,394,331 5.77 0.50 74,197,166 Chinook 1,707,696 15.35 0.38 648,924 Chum 4,932,731 6.57 0.09 443,946 Pink 212,527 4.07 0.05 10,626 Coho 473,380 6.84 0.34 160,949 Total 155,720,665 75,461,611 aWeighted Average

81
Table 30.–Subsistence salmon harvest by species, in numbers of fish, by district and location fished, Bristol Bay, 2004.
Permits Estimated Number of Salmon Harvested a
Area and River System Issued b Sockeye Chinook Chum Pink Coho Total NAKNEK-KVICHAK DISTRICT 481 71,110 1,075 469 1,080 566 74,300 Naknek River 277 17,488 949 419 1,033 493 20,381 Kvichak River/Iliamna Lake: 206 53,225 99 10 43 39 53,416 Alagnak (Branch) River 2 91 0 3 0 0 94 Igiugig 2 773 2 0 0 0 775 Iliamna (community) 3 43 0 0 0 0 43 Iliamna Lake 41 10,060 0 0 0 0 10,060 Kijik 2 135 0 0 0 0 135 Kokhanok 24 11,533 16 6 43 12 11,610 Kvichak River 10 650 0 0 0 0 650 Lake Clark: General 26 2,917 0 0 0 0 2,917 Levelock 3 1,000 81 1 0 27 1,108 Newhalen River 37 12,062 0 0 0 0 12,062 Nondalton Village 14 2,910 0 0 0 0 2,910 Pedro Bay 23 4,712 0 0 0 0 4,712 Pile Bay 1 183 0 0 0 0 183 Port Alsworth 9 733 0 0 0 0 733 Six Mile Lake 27 5,424 0 0 0 0 5,424 Naknek-Kvichak Unspecified 6 397 27 40 4 35 503 EGEGIK DISTRICT 46 2,618 169 410 91 1,423 4,711 UGASHIK DISTRICT 21 804 64 9 4 234 1,116 NUSHAGAK DISTRICT 511 17,491 15,610 3,869 1,944 4,240 43,154 Wood River 120 4,094 2,449 562 148 648 7,901 Lower Nushagak River 32 692 1,418 213 123 291 2,738 Upper Nushagak River 87 2,938 4,423 1,793 398 865 10,416 Dillingham Beaches 236 6,875 6,413 1,173 1,087 1,815 17,363 Nushagak Bay Commercial 45 913 440 65 174 323 1,915 Igushik/Snake River 27 1,919 314 41 12 266 2,552 Nushagak, Site Unspecified 3 60 153 23 2 32 270 TOGIAK DISTRICT 46 1,795 1,094 383 108 204 3,584 TOTAL BRISTOL BAY 1,100 93,819 18,012 5,141 3,225 6,667 126,865
a Harvests are extrapolated for all permits issued, based on those returned and on the area fished as recorded on the permit. Due to rounding, the sum of columns and rows may not equal the estimated total. Of 1,100 permits issued for the management area, 940 were returned (85.5%).
b Sum of sites may exceed district totals, and sum of districts may exceed area total, because permittees may use more than one site.

82
Table 31.– Daily observed estimates (tons) of herring by index area, Togiak District, 2004.
Estimated Biomass by Index Area b Date Start
Time Survey Ratinga
Miles of Spawn
NUS KUK MET NVK UGL TOG TNG MTG OSK PYR CPN HAG WAL Daily Total
4/15 08:30 4.1 4/18 16:30 3.7 4/21 11:30 3.3
4/22 12:00 2.5 11 3 13 4/23 10:15 2.7 26 8 34 4/24 02:15 1.3 687 3,132 268 300 1,969 358 1,144 9,142 4/25 14:10 1.5 6,958 6,016 523 55 12 1,119 2,693 10 3,109 20,494 4/28 14:40 3.5 5.7 8 1,657 13 441 797 1,920 1,920 119 4,180 229 248 11,532 4/29 c 05:00 5.0 3.0 4/30 c 12:00 4.0 10.3 5/02 10:50 3.7 0.7 9 460 420 868 624 2,381 5/03 12:00 2.7 2.9 3,908 7,210 2,064 703 4,285 9,413 1,303 3,158 1,514 859 173 18 34,607 5/05 12:00 2.9 7.1 76 550 1,210 90 3,557 1,983 583 1,168 150 88 437 9,891 5/07 14:00 3.5 4.0 1,360 346 42 1,749 5/20 16:40 3.8 2.5 422 130 32 587 3 1,173 5/26 10:45 3.7 0.2 149 6 154
Total linear miles of spawn 36.4 Peak biomass estimate d 34,607 a Average survey rating for all sections surveyed: 1= Excellent, 2 = Good, 3 = Fair, 4 = Poor, 5 = Unsatisfactory b Index areas: NUS - Nushagak Peninsula; KUK - Kulukak; MET - Metervik; NUK - Nunavachak; UGL - Ungalikthluk/Togiak; TOG - Togiak; TNG - Tongue Pt;
MTG - Matogak; HAG - Hagemeister;OSK - Osvisak; PYT - Pyrite Point; CPN - Cape Newenham. c Vessel count and spawn survey only. d The 2004 Togiak District Pacific herring total run biomass could not be estimated from aerial survey information because of poor survey conditions.

83
Table 32.– Emergency order (EO) commercial fishing periods for herring sac roe and spawn-on-kelp, Togiak District, 2004. EO # Areaa Date and Time Duration Herring Sac Roe Gillnet DLG-02 East Ungalikthluk to Egg Island 4/30 12:00 p.m. to 4/30 6:00 p.m. 6 hrs. DLG-04 East Ungalikthluk to Egg Island extension 4/30 6:00 p.m. to 5/1 12:00 a.m. 6 hrs. DLG-06 East Ungalikthluk to Egg Island 5/1 11:00 a.m. to 5/1 5:00 p.m. 6 hrs. DLG-07 East Ungalikthluk to Egg Island extension 5/1 5:00 p.m. to 5/2 12:00 a.m. 7 hrs. DLG-08 East Ungalikthluk to Egg Island 5/2 6:00 a.m. to 5/2 12:00 p.m. 6 hrs. DLG-10 Right Hand Pt. to Egg Island extension 5/2 12:00 p.m. to 5/2 8:00 p.m. 8 hrs. DLG-12 Right Hand Pt. to Egg Island 5/3 9:00 a.m. to 5/3 3:00 p.m. 6 hrs. DLG-13 Right Hand Pt. to Egg Island extension 5/3 3:00 p.m. to 5/3 7:00 p.m. 4 hrs. DLG-14 Right Hand Pt. to Egg Island extension 5/3 7:00 p.m. to 5/3 11:00 p.m. 4 hrs. DLG-16 Right Hand Pt. to Egg Island 5/4 7:00 a.m. to 5/4 1:00 p.m. 6 hrs. DLG-17 Right Hand Pt. to Egg Island extension 5/4 1:00 p.m. to 5/4 8:00 p.m. 7 hrs. DLG-18 Right Hand Pt. to Egg Island extension 5/4 8:00 p.m. to 5/5 12:00 a.m. 4 hrs. DLG-20 Right Hand Pt. to Egg Island 5/5 7:00 a.m. to 5/5 1:00 p.m. 6 hrs. DLG-21 Right Hand Pt. to Egg Island extension 5/5 1:00 p.m. to 5/5 8:00 p.m. 7 hrs. DLG-22 Right Hand Pt. to Egg Island extension 5/5 8:00 p.m. to 5/6 9:00 a.m. 13 hrs. DLG-23 Right Hand Pt. to Egg Island extension 5/6 9:00 a.m. to 5/6 8:00 p.m. 11 hrs. DLG-24 Right Hand Pt. to Egg Island extension 5/6 8:00 p.m. to 5/7 8:00 a.m. 12 hrs. DLG-25 Right Hand Pt. to Egg Island 5/7 12:00 p.m. to 5/7 8:00 p.m. 8 hrs. DLG-26 Right Hand Pt. to Egg Island extension 5/7 8:00 p.m. to 5/8 8:00 a.m. 12 hrs. DLG-27 Right Hand Pt. to Egg Island extension 5/8 8:00 a.m. to 5/8 2:00 p.m. 6 hrs. DLG-30 Right Hand Pt. to Egg Island extension 5/8 2:00 p.m. to 5/8 8:00 p.m. 6 hrs. DLG-32 Right Hand Pt. to Egg Island extension 5/8 8:00 p.m. to 5/9 12:00 a.m. 4 hrs. DLG-33 Right Hand Pt. to Egg Island 5/9 9:00 a.m. to 5/9 3:00 p.m. 6 hrs. Herring Sac Roe Purse Seine DLG-01 Oosik to Togiak Reef, Right Hand Pt. (RHP) to Anchor Pt. 4/29 4:00 p.m. to 4/29 10:00 p.m. 6 hrs. DLG-03 Oosik to Togiak Reef, Rocky Pt. to Anchor Pt. 4/30 4:00 p.m. to 4/30 10:00 p.m. 6 hrs. DLG-05 Cape Newenham to Togiak Reef, Rocky Point to Anchor Pt. 5/1 11:00 a.m. to 5/1 10:00 p.m. 11 hrs. DLG-09 Cape Newenham to Togiak Reef, RHP to Anchor Pt. 5/2 12:00 p.m. to 5/2 10:00 p.m. 10 hrs. DLG-11 Cape Newenham to Togiak Reef, RHP to Anchor Pt. 5/3 8:00 a.m. to 5/3 8:00 p.m. 12 hrs. DLG-15 Cape Newenham to Togiak Reef, RHP to Anchor Pt. 5/4 8:00 a.m. to 5/4 8:00 p.m. 12 hrs. DLG-19 Cape Newenham to Togiak Reef 5/5 8:00 a.m. to 5/5 8:00 p.m. 12 hrs. DLG-28 161 degrees to Osviak Point 5/7 8:30 p.m. to 5/7 9:00 p.m. 30 min. DLG-29 Cape Peirce to Tongue Pt. 5/8 2:00 p.m. to 5/8 2:30 p.m. 30 min. DLG-31 Cape Newenham to Togiak Reef 5/8 5:30 p.m. to 5/8 6:30 p.m. 1 hrs.
-continued-

84
Table 32. Page 2 of 2.
EO # Areaa Date and Time Duration DLG-34 Cape Newenham to Togiak Reef, Rocky Pt. to Anchor Pt. 5/8 9:30 p.m. to 5/8 11:30 p.m. 2 hrs. DLG-35 Cape Newenham to Tongue Pt. 5/9 10:00 a.m. to 5/9 3:00 p.m. 5 hrs. Herring Spawn on Kelpb
a Area descriptions are approximate. Precise boundaries are described in Emergency Orders. b There was no market for spawn on kelp therefore, a fishery did not occur.

85
Table 33.– Commercial herring harvest (tons) by fishing section, gear type, and date Togiak District, Bristol Bay, 2004.
Kulukak Nunavachak Togiak Hagemeister Pyrite Point Cape Newenham Total Date Duration Periods Tons Roe % Tons Roe % Tons Roe % Tons Roe % Tons Roe % Tons Roe % Total Roe %
Purse Seine 29-Apr 6:00 1 0 0.0 302.6 9.3 a 2,160.6 8.7 a 0.0 0.0 0 0.0 0 0.0 2,463 8.830-Apr 6:00 2 0 0.0 0 0.0 667.7 9.3 161.6 10.1 0 0.0 0 0.0 829 9.51-May 11:00 3 0 0.0 0 0.0 257.3 9.4 1,022.0 9.6 113.0 10.2 0 0.0 1,392 9.62-May 10:00 4 0 0.0 142.1 9.0 46.9 10.5 1,756.9 9.0 262.1 10.5 0 0.0 2,208 9.23-May 12:00 5 0 0.0 52.9 8.3 0 0.0 992.4 9.4 b 205.9 9.3 0 0.0 1,251 9.34-May 12:00 6 0 0.0 259.9 7.8 0 0.0 1,587.5 9.7 28.2 12.2 0 0.0 1,876 9.55-May 12:00 7 0 0.0 0 0.0 171.6 11.7 1,775.1 9.6 432.0 10.7 0 0.0 2,379 10.06-May 0 0.0 0 0.0 0 0.0 205.2 9.6 a 0 0.0 0 0.0 205 9.67-May 0:30 8 0 0.0 0 0.0 0 0.0 120.3 9.2 c 0 0.0 0 0.0 120 9.28-May 0:30 9 0 0.0 31.9 9.9 a 0 0.0 9.6 10.2 0 0.0 0 0.0 41 10.08-May 1:00 10 0 0.0 0 0.0 0 0.0 173.3 10.6 135.0 10.5 0 0.0 308 10.68-May 2:00 11 0 0.0 0 0.0 0 0.0 547.5 10.6 41.1 10.9 0 0.0 589 10.69-May 5:00 12 0 0.0 0 0.0 0 0.0 30.7 9.5 0 0.0 0 0.0 31 9.510-May 0 0.0 0 0.0 0 0.0 195.2 10.8 a 0 0.0 0 0.0 195 10.8Subtotal 78:00:00 0.0 0.0 789.4 8.7 a 3,304.1 9.1 a 8,577.3 9.6 a,b,c 12,17.3 10.4 0 0.0 13,888 9.5Gillnet 30-Apr 12:00 1 17.5 12.8 775.1 10.5 0 0.0 0 0.0 0 0.0 0 0.0 793 10.61-May 13:00 2 0.0 0 276.1 10.4 0 0.0 0 0.0 0 0.0 0 0.0 276 10.42-May 14:00 3 1,257.3 10.4 0 0.0 0 0.0 0 0.0 0 0.0 0 0.0 1,257 10.43-May 14:00 4 920.6 10.7 0 0.0 0 0.0 0 0.0 0 0.0 0 0.0 921 10.74-May 18:00 5 188.2 10.5 0 0.0 0 0.0 0 0.0 0 0.0 0 0.0 188 10.55,6-May 37:00 6 681.7 10.2 0 0.0 0 0.0 0 0.0 0 0.0 0 0.0 682 10.26,7-May 12:00 7 506.8 9.9 0 0.0 0 0.0 0 0.0 0 0.0 0 0.0 507 9.97,8-May 20:00 8 249.8 10.3 0 0.0 0 0.0 0 0.0 0 0.0 0 0.0 250 10.38-May 16:00 9 92.8 10.4 0 0.0 0 0.0 0 0.0 0 0.0 0 0.0 93 10.49-May 6:00 10 14.4 10.9 0 0.0 0 0.0 0 0.0 0 0.0 0 0.0 14 10.9Subtotal 162:00:00 3,929.1 10.4 1,051.2 10.5 0 0.0 0 0.0 0 0.0 0 0.0 4,980 10.4
-continued-

86
Table 33. Page 2 of 2.
Kulukak Nunavachak Togiak Hagemeister Pyrite Point Cape Newenham Total Date Duration Periods Tons Roe % Tons Roe % Tons Roe % Tons Roe % Tons Roe % Tons Roe % Total Roe%
Combined 29-Apr 0.0 0.0 302.7 9.4 a 2,160.6 8.7 a 0.0 0.0 0 0.0 0 0.0 2,463 8.830-Apr 17.5 12.8 775.1 10.5 667.7 9.3 161.6 10.1 0 0.0 0 0.0 1,622 10.01-May 0.0 0.0 276.1 10.4 257.3 9.4 918.6 9.6 113.0 10.2 0 0.0 1,565 9.82-May 1,257.3 10.4 142.1 9 46.9 10.5 1,860.3 9.0 262.1 10.5 0 0.0 3,569 9.63-May 920.6 10.7 52.9 8.3 0.0 0 1,070.5 9.5 b 205.9 9.3 0 0.0 2,250 9.94-May 188.2 10.5 259.9 7.8 0.0 0 1,405.0 9.7 28.2 12.2 0 0.0 1,881 9.65-May 460.3 10.1 0.0 0 171.6 11.7 1,879.4 9.5 432.0 10.7 0 0.0 2,943 9.96-May 574.7 10.1 0.0 0 0.0 0 205.2 9.6 a 0 0.0 0 0.0 780 10.07-May 365.0 10.3 0.0 0 0.0 0 120.3 9.2 c 0 0.0 0 0.0 485 10.08-May 133.0 10.3 31.9 9.9 a 0.0 0 730.4 10.6 0 0.0 0 0.0 895 10.59-May 12.5 11 0.0 0 0.0 0 30.7 9.5 176.2 10.6 0 0.0 219 10.510-May 0.0 0 0.0 0 0.0 0 195.2 10.8 a 0 0.0 0 0.0 195 10.8Total 3,929.1 10.4 1,840.7 9.7 a 3304.1 9.1 a 8,577.2 9.6 a,b,c 1217.4 10.4 0.0 0.0 18,868 9.7
a Includes test fish harvest which is conducted during closed commercial periods. b Includes 60.5 tons documented waste. c Includes 42 tons documented waste.

87
Table 34.–Herring total run and commercial catch by year class, Togiak District, 2004.
Year Total Run Harvest a Escapement Class Age (tons) % (tons) % (tons) % 1984 20 0 0.0% 0 0% 0 0.0% 1985 19 0 0.0% 0 0% 0 0.0% 1986 18 0 0.0% 0 0% 0 0.0% 1987 17 286 0.2% 28 0% 258 0.2% 1988 16 1,288 0.9% 82 1% 1,206 0.9% 1989 15 3,469 2.4% 289 2% 3,180 2.4% 1990 14 4,591 3.2% 403 3% 4,188 3.2% 1991 13 4,376 3.1% 380 3% 3,996 3.1% 1992 12 8,902 6.2% 820 6% 8,082 6.2% 1993 11 13,410 9.4% 1,214 9% 12,197 9.4% 1994 10 9,551 6.7% 807 7% 8,743 6.7% 1995 9 5,676 4.0% 543 4% 5,133 4.0% 1996 8 34,354 24.0% 3,408 24% 30,946 24.0% 1997 7 52,719 36.8% 5,402 37% 47,316 36.8% 1998 6 4,165 2.9% 481 3% 3,684 2.9% 1999 5 256 0.2% 23 0% 233 0.2% 2000 4 80 0.1% 7 0% 73 0.1% 2001 3 0 0.0% 0 0% 0 0.0% 2002 2 0 0.0% 0 0% 0 0.0%
Total 143,124 b 100% 13,888 100% 129,236 b 100% a Does not include harvest in the Dutch Harbor food and bait fishery, but does include harvest from test fishery. b Total run and escapement estimates not available. Seasons aerial assessment was hampered by poor weather
preventing adequate biomass assessment to calculate season's biomass estimate. Preseason forcast was used to estimate Total Run and Escapement.
Table 35.–Commercial herring sac roe and spawn-on-kelp buyers in Togiak District, 2004.
Product Purchased Sac Roe Purse Spawn- Operator/Buyer a Base of Operation Gillnet Seine on-Kelp
1 Snopac Products Inc. P/V Snopac X X 2 Y.A.K. Inc. S/P Red Salmon Cannery X X 3 Trident Seafoods S/P Naknek, P/V Alaska Packer X X 4 Leader Creek Fisheries S/P Naknek X X 5 Norquest Seafoods, Inc. P/V Aleutian Falcon/Pribilof X X 6 Icicle Seafoods P/V Arctic Star, Bering Star, Discovery
Star X X
a Operators that registered in the Togiak District.


88
APPENDIX A. SALMON

89
Appendix A1.–Escapement goals and actual counts of sockeye salmon by river system, in thousands of fish, Bristol Bay, 1984–2004. Kvichak River Naknek Rivera Range Range Year Lower Upper Actual Lower Upper Actual 1984 8,000 12,000 10,491 800 1,400 1,242 1985 8,000 12,000 7,211 800 1,400 1,850 1986 4,000 6,000 1,179 800 1,400 1,978 1987 4,000 6,000 6,066 800 1,400 1,062 1988 4,000 6,000 4,065 800 1,400 1,038 1989 6,000 10,000 8,318 800 1,400 1,612 1990 6,000 10,000 6,970 800 1,400 2,093 1991 4,000 8,000 4,223 800 1,400 3,579 1992 4,000 8,000 4,726 800 1,400 1,607 1993 4,000 8,000 4,025 800 1,400 1,536 1994 6,000 10,000 8,338 800 1,400 991 1995 6,000 10,000 10,039 800 1,400 1,111 1996 4,000 6,000 1,451 1,078 1997 4,000 6,000 1,504 800 1,400 1,026 1998 2,000 10,000 2,296 800 1,400 1,202 1999 6,000 10,000 6,197 800 1,400 1,625 2000 6,000 10,000 1,828 800 1,400 1,375 2001 2,000 10,000 1,095 800 2,000 1,830 2002 2,000 10,000 704 800 2,000 1,264 2003 2,000 10,000 1,687 800 2,000 1,831 20-Year Average 4,600 8,900 4,621 800 1,495 1,547 1984–1993 Average 5,200 8,600 5,727 800 1,400 1,760 1994–2003 Average 4,000 9,200 3,514 800 1,600 1,333 2004 2,000 10,000 5,500 800 2,000 1,939 Egegik River Ugashik River Range Range Year Lower Upper Actual Lower Upper Actual 1984 800 1,200 1,165 500 900 1,241 1985 800 1,200 1,095 500 900 998 1986 800 1,200 1,151 500 900 1,001 1987 800 1,200 1,273 500 900 669 1988 800 1,200 1,599 500 900 643 1989 800 1,200 1,610 500 900 1,681 1990 800 1,200 2,191 500 900 730 1991 800 1,200 2,787 500 900 2,457 1992 800 1,200 1,945 500 900 2,174 1993 800 1,200 1,517 500 900 1,390 1994 800 1,200 1,897 500 900 1,081 1995 800 1,400 1,282 500 1,200 1,304 1996 800 1,400 1,076 500 1,200 668 1997 800 1,400 1,104 500 1,200 618 1998 800 1,400 1,111 500 1,200 891 1999 800 1,400 1,728 500 1,200 1,652 2000 800 1,400 1,032 500 1,200 620 2001 800 1,400 969 500 1,200 834 2002 800 1,400 1,036 500 1,200 892 2003 800 1400 1,152 500 1,200 759 20-Year Average 800 1,290 1,436 500 1,035 1,115 1984–1993 Average 800 1,200 1,633 500 900 1,298 1994–2003 Average 800 1,380 1,239 500 1,170 932 2004 800 1,400 1,290 500 1,200 776

90
Appendix A1. Page 2 of 2. Wood River Igushik River Range Range Year Lower Upper Actual Lower Upper Actual1984 700 1,200 1,003 150 250 185 1985 700 1,200 939 150 250 212 1986 700 1,200 819 150 250 309 1987 800 1,200 1,337 140 250 169 1988 800 1,200 867 140 250 170 1989 800 1,200 1,186 150 250 462 1990 700 1,200 1,069 150 250 366 1991 700 1,200 1,160 150 250 756 1992 700 1,200 1,286 150 250 305 1993 700 1,200 1,176 150 250 406 1994 700 1,200 1,472 150 250 446 1995 700 1,200 1,475 150 250 473 1996 700 1,200 1,650 150 250 401 1997 700 1,200 1,512 150 250 128 1998 700 1,200 1,756 150 250 216 1999 700 1,200 1,512 150 250 446 2000 700 1,200 1,300 150 250 413 2001 700 1,500 1,459 150 300 410 2002 700 1,500 1,284 150 300 123 2003 700 1,500 1,460 150 300 194 20-Year Average 715 1,245 1,286 149 258 330 1984–1993 Average 730 1,200 1,084 148 250 334 1994–2003 Average 700 1,290 1,488 150 265 325 2004 700 1,500 1,543 150 300 110 Nushagak River b Togiak River Range Range Year Lower c Upper Actual Lower Upper Actual1984 300 700 473 140 250 95 1985 300 700 429 140 250 137 1986 300 700 822 140 250 168 1987 300 700 163 100 200 250 1988 300 700 483 100 200 277 1989 300 700 513 100 200 84 1990 340 760 680 140 250 142 1991 340 760 493 140 250 255 1992 340 760 695 140 250 199 1993 340 760 715 140 250 177 1994 340 760 509 140 250 155 1995 340 760 281 140 250 186 1996 340 760 504 140 250 157 1997 340 760 373 100 200 132 1998 340 760 459 100 200 154 1999 235 760 393 100 200 156 2000 340 760 404 100 200 312 2001 340 760 804 100 200 297 2002 340 760 316 100 200 162 2003 340 760 581 100 200 232 20-Year Average 323 742 505 120 225 186 1984–1993 Average 316 724 547 128 235 178 1994–2003 Average 330 760 462 112 215 194 2004 340 760 492 100 200 129
a An Optimal escapement goal of up to 2.0 million sockeye set by the BOF in 2001, when fishing in the Naknek River Special Harvest Area.
b Actual escapement through 1988 is Nuyakuk River tower count, from 1989–present is based on sonar count at Portage Creek. c The "Optimal Escapement Goal" of 235,000 sockeye set by the BOF in 1999.

91
Appendix A2.–Salmon entry permit registration by gear and residency, Bristol Bay, 1984–2004.
Drift Netb Set Netb
Year a Resident Non-
Resident Drift Total
Permits Fished
% Fished
Interim Use Resident
Non- Resident
Set Total
Permits Fished
% Fished
Interim Use
Total Drift/Set
1984 1,047 771 1,818 1,804 99% 89 743 219 962 869 90% 31 2,687 1985 1,062 772 1,834 1,815 99% 96 741 218 959 872 91% 28 2,706 1986 1,060 778 1,838 1,823 99% 95 739 223 962 869 90% 22 2,707 1987 1,044 793 1,837 1,824 99% 91 736 224 960 899 94% 18 2,736 1988 1,033 806 1,839 1,837 100% 90 731 227 958 922 96% 17 2,761 1989 1,036 831 1,867 1,855 99% 91 785 240 1,025 971 95% 18 2,838 1990 1,039 839 1,878 1,869 100% 93 783 243 1,026 971 95% 15 2,849 1991 1,019 862 1,881 1,873 100% 88 771 253 1,024 950 93% 12 2,831 1992 997 886 1,883 1,879 100% 86 774 251 1,025 968 94% 8 2,851 1993 982 904 1,886 1,875 99% 81 763 259 1,022 965 94% 8 2,851 1994 970 917 1,887 1,865 99% 77 760 259 1,019 939 92% 7 2,826 1995 967 921 1,888 1,882 100% 75 762 257 1,019 967 95% 8 2,855 1996 966 925 1,891 1,884 100% 70 760 257 1,017 941 93% 6 2,832 1997 959 940 1,899 1,875 99% 67 757 262 1,019 921 90% 7 2,820 1998 954 945 1,899 1,858 98% 55 756 259 1,015 901 89% 6 2,800 1999 937 961 1,898 1,847 97% 52 748 266 1,014 925 91% 6 2,823 2000 945 945 1,890 1,823 96% 38 735 277 1,012 921 91% 6 2,811 2001 958 925 1,883 1,566 83% 24 729 281 1,010 834 83% 2 2,717 2002 945 933 1,878 1,183 63% 16 717 289 1,006 680 68% 2 2,558 2003 923 944 1,867 1,389 74% 7 713 288 1,001 714 71% 1 2,581 20 Year Ave. 992 880 1,872 1,781 95% 69 750 253 1,003 900 90% 11 2,772 1984–1993 Ave. 1,032 824 1,856 1,845 99% 90 757 236 992 926 93% 18 2,782 1994–2003 Ave. 952 936 1,888 1,717 91% 48 744 270 1,013 874 86% 5 2,762 2004 912 948 1,860 1,426 77% 3 703 286 989 761 77% 1 2,849
a Limited Entry went into effect in 1974. Interim-use permits are included in the totals. b Allowable gear per license/permit is measured in fathoms, 150 for drift and 50 for set.

92
Appendix A3.–Sockeye salmon commercial catch by district, in numbers of fish, Bristol Bay, 1984–2004.
Year Naknek-Kvichak Egegik Ugashik Nushagak Togiak Total
1984 14,546,710 5,190,413 2,658,376 1,992,681 322,126 24,710,306
1985 8,179,093 7,537,273 6,468,862 1,307,889 209,766 23,702,883
1986 2,892,171 4,852,935 5,002,949 2,719,313 308,688 15,776,056
1987 4,986,002 5,356,669 2,128,652 3,254,720 342,732 16,068,775
1988 3,480,836 6,456,598 1,523,520 1,706,716 822,087 13,989,757
1989 13,809,956 8,901,994 3,146,239 2,788,185 88,932 28,735,306
1990 17,272,224 10,371,762 2,149,009 3,532,543 197,589 33,523,127
1991 10,475,206 6,797,166 2,945,742 5,053,845 549,221 25,821,180
1992 9,395,948 15,646,575 3,320,966 2,789,741 726,446 31,879,676
1993 8,907,876 21,600,858 4,176,900 5,236,557 539,933 40,462,124
1994 16,327,858 10,750,213 4,352,797 3,393,143 400,039 35,224,050
1995 20,279,581 14,425,979 4,509,446 4,445,883 605,328 44,266,217
1996 8,211,983 10,809,115 4,411,055 5,693,523 462,621 29,588,297
1997 589,311 7,517,389 1,402,690 2,506,818 142,569 12,158,777
1998 2,595,439 3,528,845 730,247 2,990,597 190,446 10,035,574
1999 9,452,972 7,388,080 2,256,007 6,175,419 385,411 25,657,889
2000 4,727,061 7,029,397 1,538,790 6,367,208 794,996 20,457,452
2001 5,280,538 2,872,662 480,509 4,734,800 810,096 14,178,605
2002 1,418,938 4,610,374 1,573,234 2,840,031 233,743 10,676,320
2003 3,348,453 2,291,502 1,748,934 6,665,918 706,008 14,760,815
20-Year Ave. 8,308,908 8,196,790 2,826,246 3,809,777 441,939 23,583,659
1984–1993 Ave. 9,394,602 9,271,224 3,352,122 3,038,219 410,752 25,466,919
1994–2003 Ave. 7,223,213 7,122,356 2,300,371 4,581,334 473,126 21,700,400
2004 4,727,187 10,198,236 3,127,549 6,087,776 438,653 24,579,401

93
Appendix A4.–Chinook salmon commercial catch by district, in numbers of fish, Bristol Bay, 1984–2004.
Year Naknek-Kvichak Egegik Ugashik Nushagak Togiak Total
1984 8,972 4,680 4,767 61,378 22,179 101,976 1985 5,697 4,015 5,840 67,783 37,106 120,441 1986 3,188 1,883 2,982 65,783 19,880 93,716 1987 5,175 2,959 4,065 45,983 17,217 75,399 1988 6,538 3,103 3,444 16,648 15,606 45,339 1989 6,611 2,034 2,112 17,637 11,366 39,760 1990 5,068 1,146 1,840 14,812 11,130 33,996 1991 3,584 510 589 19,718 6,039 30,440 1992 5,724 694 2,146 47,563 12,640 68,767 1993 7,477 1,478 3,075 62,976 10,851 85,857 1994 6,016 1,243 3,685 119,480 10,486 140,910 1995 5,084 760 1,551 79,942 11,981 99,318 1996 4,195 980 588 72,011 8,602 86,376 1997 2,839 2,047 1,084 64,294 6,114 76,378 1998 2,444 760 346 108,486 14,131 126,167 1999 1,295 712 1,638 10,893 11,919 26,457 2000 1,027 1,061 893 12,055 7,858 22,894 2001 904 950 989 11,568 9,937 24,348 2002 969 268 612 39,473 2,801 44,123 2003 567 131 409 42,615 3,231 46,953 20-Year Average 4,169 1,571 2,133 49,055 12,554 69,481 1984–1993 Average 5,803 2,250 3,086 42,028 16,401 69,569 1994–2003 Average 2,534 891 1,180 56,082 8,706 69,392 2004 1,274 1,556 868 93,414 9,349 106,461

94
Appendix A5.–Chum salmon commercial catch by district, in numbers of fish, Bristol Bay, 1984–2004.
Year Naknek-Kvichak Egegik Ugashik Nushagak Togiak Total
1984 447,259 178,096 210,611 850,114 336,660 2,022,740 1985 210,107 126,736 131,576 396,740 203,302 1,068,461 1986 262,925 94,666 111,112 488,375 270,057 1,227,135 1987 446,908 145,259 101,074 416,476 419,425 1,529,142 1988 295,571 237,888 94,545 371,196 470,132 1,469,332 1989 310,869 136,185 84,673 523,903 203,178 1,258,808 1990 422,276 123,087 32,013 378,223 102,861 1,058,460 1991 443,189 75,892 60,299 463,780 246,589 1,289,749 1992 167,168 121,472 57,170 398,691 176,123 920,624 1993 43,684 70,628 73,402 505,799 144,869 838,382 1994 219,118 62,961 52,127 328,267 232,559 895,032 1995 236,472 68,325 62,801 390,158 221,126 978,882 1996 124,137 85,151 103,392 324,261 207,094 844,035 1997 8,719 53,139 16,379 185,620 47,459 311,316 1998 82,281 29,405 8,088 208,551 67,595 395,920 1999 259,922 74,890 68,004 170,795 111,677 685,288 2000 68,218 38,857 36,349 114,454 140,175 398,053 2001 16,472 33,579 43,394 526,602 211,701 831,748 2002 19,180 23,516 35,792 276,845 112,987 468,320 2003 34,481 37,116 52,908 740,311 68,154 932,970 20-Year Average 205,948 90,842 71,785 402,958 199,686 971,220 1984–1993 Average 304,996 130,991 95,648 479,330 257,320 1,268,283 1994–2003 Average 106,900 50,694 47,923 326,586 142,053 674,156 2004 28,895 72,437 64,019 470,248 94,030 729,629

95
Appendix A6.–Pink salmon commercial catch by district, in numbers of fish, Bristol Bay, 1984–2004.
Year Naknek-Kvichak Egegik Ugashik Nushagak Togiak Total
1984 211,306 5,759 2,387 3,127,153 19,468 3,366,073
1985 39 51 3 48 316 457
1986 106,919 2,749 98 267,117 24,404 401,287
1987 5 0 30 2 20 57
1988 648,569 4,485 218 243,890 58,084 955,246
1989 75 6 29 156 172 438
1990 421,690 11,593 361 54,127 8,746 496,517
1991 102 15 2 69 117 305
1992 214,228 694 525 190,102 93,989 499,538
1993 86 2 2 83 240 413
1994 11,537 145 21 8,562 69,552 89,817
1995 55 1 1 120 294 471
1996 4,590 22 21 2,681 30,308 37,622
1997 39 2 0 50 27 118
1998 11,317 674 247 6,787 6,406 25,431
1999 11 0 3 52 2 68
2000 19,659 32 4 38,309 695 58,699
2001 23 0 0 308 97 428
2002 10 1 1 204 311 527
2003 24 0 0 188 32 244
20-Year Average a 164,983 2,615 388 393,893 31,196 593,076
1984–1993 Average a 320,542 5,056 718 776,478 40,938 1,143,732
1994–2003 Average a 9,423 175 59 11,309 21,454 42,419
2004 7,710 0 120 25,886 18,322 52,038 a Includes even numbered years only.

96
Appendix A7.–Coho salmon commercial catch by district, in numbers of fish, Bristol Bay, 1984–2004.
Year Naknek-Kvichak Egegik
Ugashik
Nushagak Togiak Total
1984 3,209 66,589 68,451 260,310 176,053 574,612
1985 10,474 32,667 60,815 20,230 38,636 162,822
1986 5,824 33,607 25,770 68,568 48,306 182,075
1987 5,274 30,789 14,785 13,263 1,292 65,403
1988 29,988 48,981 52,355 52,698 18,468 202,490
1989 22,668 49,175 33,942 77,077 56,972 239,834
1990 16,091 43,897 32,906 7,733 2,690 103,317
1991 17,527 47,486 42,622 5,574 4,531 117,740
1992 18,553 47,780 35,794 84,077 5,328 191,532
1993 1,779 41,603 2,387 14,345 12,615 72,729
1994 5,877 48,436 19,250 5,615 96,062 175,240
1995 981 21,772 13,800 4,896 8,917 50,366
1996 3,601 38,156 13,163 11,401 58,978 125,299
1997 718 35,470 7,156 4,110 2,970 50,424
1998 1,587 29,856 13,007 22,703 52,630 119,783
1999 303 11,464 2,289 2,836 2,653 19,545
2000 952 13,166 1,269 112,819 2,758 130,964
2001 3 12,603 976 3,218 284 17,084
2002 0 7,099 464 93 754 8,410
2003 42 40,577 994 583 1,047 43,243
20-Year Average 7,273 35,059 22,110 38,607 29,597 132,646
1984–1993 Average 13,139 44,257 36,983 60,388 36,489 191,255
1993–2002 Average 1,406 25,860 7,237 16,827 22,705 74,036
2004 2,138 2,863 4,744 47,750 15,467 72,962

97
Appendix A8.–Total salmon commercial catch by district, in numbers of fish, Bristol Bay, 1984-2004.
Year Naknek-Kvichak Egegik Ugashik Nushagak Togiak Total
1984 15,217,456 5,445,537 2,944,592 6,291,636 876,486 30,775,707
1985 8,405,410 7,700,742 6,667,096 1,792,690 489,126 25,055,064
1986 3,271,027 4,985,840 5,142,911 3,609,156 671,335 17,680,269
1987 5,443,364 5,535,676 2,248,606 3,730,444 780,686 17,738,776
1988 4,461,502 6,751,055 1,674,082 2,391,148 1,384,377 16,662,164
1989 14,150,179 9,089,394 3,266,995 3,406,958 360,620 30,274,146
1990 18,137,349 10,551,485 2,216,129 3,987,438 323,016 35,215,417
1991 10,939,608 6,921,069 3,049,254 5,542,986 806,497 27,259,414
1992 9,801,621 15,817,215 3,416,601 3,510,174 1,014,526 33,560,137
1993 8,960,902 21,714,569 4,255,766 5,819,760 708,508 41,459,505
1994 16,570,406 10,862,998 4,427,880 3,855,157 808,698 36,525,139
1995 20,522,297 14,516,875 4,587,276 4,920,284 847,600 45,394,332
1996 8,322,312 10,900,288 4,530,995 6,111,030 724,023 30,588,648
1997 616,084 7,626,863 1,432,200 2,866,890 200,676 12,742,713
1998 2,693,068 3,589,540 751,962 3,345,717 336,995 10,717,282
1999 9,714,503 7,475,146 2,327,941 6,359,995 511,662 26,389,247
2000 4,816,917 7,082,513 1,577,305 6,644,845 946,482 21,068,062
2001 5,297,940 2,919,794 525,868 5,276,496 1,032,115 15,052,213
2002 1,439,097 4,641,258 1,610,103 3,156,646 350,596 11,197,700
2003 3,383,567 2,369,326 1,803,245 7,449,615 778,472 15,784,225
20-Year Average 8,608,230 8,324,859 2,922,840 4,503,453 697,625 25,057,008
1984–1993 Average 9,878,842 9,451,258 3,488,203 4,008,239 741,518 27,568,060
1994–2003 Average 7,337,619 7,198,460 2,357,478 4,998,668 653,732 22,545,956 2004 4,767,204 10,275,092 3,197,300 6,725,074 575,821 25,540,491

98
Appendix A9.–Commercial sockeye salmon catch, in percent, by gear type and district, Bristol Bay, 1984–2004. Naknek-Kvichak Nushagak
Drift Setnet Sec. NRSHA d Egegik Ugashik Drift Setnet Sec. WRSHA a Togiak Total Year Nak. Kvi. Drift Set Drift Set Drift Set Nush. Igushik Drift Set Drift Set Drift Set 1984 89 11 92 8 92 8 83 17 77 23 87 13 1985 87 13 93 7 96 4 65 35 75 25 90 10 1986 70 30 89 11 94 6 76 24 68 32 90 10 1987 86 14 91 9 93 7 80 20 66 34 90 10 1988 86 14 90 10 91 9 75 25 64 36 85 15 1989 89 11 90 10 87 13 58 42 55 45 87 13 1990 88 12 91 9 91 9 67 33 67 33 86 14 1991 89 11 91 9 89 11 76 24 64 36 86 14 1992 89 11 91 9 90 10 65 35 62 38 87 13 1993 84 16 93 7 90 10 72 28 54 46 86 14 1994 90 10 92 8 94 6 68 32 52 48 88 12 1995 89 11 90 10 95 5 68 32 52 48 87 13 1996 83 17 90 10 95 5 81 19 52 55 88 12 1997 73 27 87 13 88 12 70 30 37 63 87 13 1998 84 8 8 86 14 85 15 72 24 4 76 24 43 57 86 14 1999 85 8 7 85 15 89 11 70 24 6 78 22 53 47 82 18 2000 84 11 5 84 16 87 13 77 17 6 68 32 57 43 80 20 2001 82 16 2 74 b 26 b 86 14 80 20 77 18 5 66 34 80 20 2002 64b 36 b 85 15 88 12 77 22 1 67 33 62 38 79 21 2003 91 9 0 65 b 35 b 81 19 89 11 83 15 2 63 37 79 21
20-Year Ave. 85 14 89 11 90 10 73 26 59 41 86 15 1984–1993 Ave. 86 14 91 9 91 9 72 28 65 35 87 13 1994–2003 Ave. 85 13 4 68 b 32 b 87 13 89 11 74 23 4 72 26 54 47 84 16 2004 79 11 10 88 12 86 14 88 12 84 15 1 55 45 79 21 Allocation c 84 8 8 84 16 86 14 90 10 74 20 6 74 26 n.a. n.a. n.a. n.a. a Wood River Special Harvest Area (WRSHA), Nushagak District. b Naknek River Special Harvest Area (NRSHA) prior to allocation plan, fishing periods were alternated between gear types. c BOF enacted allocation plan in 1998, reviewed in December 2003. Historical data prior to 1998 is based on post-season numbers. Inseason numbers are
presented for 1998–present, as they were used to make management decisions regarding allocation. d NRSHA allocation plan enacted in December 2003.

99
Appendix A10.–Sockeye salmon escapement by district, in numbers of fish, Bristol Bay, 1984–2004.
Year Naknek- Kvichaka Egegikb Ugashikc Nushagakd Togiake Total
1984 11,948,514 1,165,345 1,270,318 1,814,686 200,778 16,399,641 1985 9,179,014 1,095,204 1,006,407 1,684,760 190,082 13,155,467 1986 3,387,147 1,151,750 1,015,582 2,134,490 271,184 7,960,153 1987 7,281,896 1,273,553 686,894 1,895,961 316,076 11,454,380 1988 5,297,708 1,599,161 654,412 1,524,704 340,712 9,416,697 1989 9,676,244 1,611,566 1,713,281 2,189,501 125,080 15,315,672 1990 9,231,358 2,191,582 749,478 2,144,444 278,202 14,595,064 1991 8,078,885 2,786,925 2,482,001 2,419,488 320,713 16,088,012 1992 6,557,157 1,945,632 2,194,927 2,286,278 266,956 13,250,950 1993 5,908,799 1,517,000 1,413,454 2,296,789 242,475 11,378,517 1994 9,571,245 1,894,977 1,095,068 2,449,616 233,632 15,244,538 1995 11,365,573 1,282,508 1,321,108 2,254,231 240,266 16,463,686 1996 2,835,426 1,075,596 692,167 2,553,995 f 212,524 7,369,708 1997 2,747,511 1,104,004 656,641 2,021,529 171,373 6,701,058 1998 3,750,246 1,110,932 924,853 2,441,666 214,626 8,442,323 1999 8,303,878 1,727,772 1,662,042 2,269,861 f 231,196 14,194,749 2000 3,654,568 1,032,138 638,420 2,116,842 f 390,080 7,832,048 2001 3,194,708 968,872 866,368 2,679,432 f 338,616 g 9,016,868 2002 2,303,463 1,036,092 905,584 1,722,519 f 199,507 6,167,165 2003 5,627,974 1,152,030 758,532 2,241,556 f 261,851 g 10,041,943 20-Year Average 6,495,066 1,436,132 1,135,377 2,157,117 252,296 11,524,432 1984–1993 Average 7,654,672 1,633,772 1,318,675 2,039,110 255,226 12,901,455 1994–2003 Average 5,335,459 1,238,492 952,078 2,275,125 249,367 10,147,409 2004 12,836,100 1,290,144 815,104 2,144,690 f 154,681 g 17,240,719
a Includes counts from Kvichak tower, Branch aerial survey and Naknek tower. b Includes Egegik River. May include King Salmon River and Shosky Creek; see table 14 for specific counts. c Includes Ugashik River. Also includes Mother Goose River and Dog Salmon River system in 1984–2004. d Includes Wood, Igushik, Nuyakuk, Nushagak-Mulchatna and Snake Rivers. e Includes Togiak River, Lake tributaries, Kulukak system and other miscellaneous river systems. f Snake River not surveyed. g Only partial and late survey of Togiak streams in 2001, 2003, and 2004.

100
Appendix A11.–Inshore commercial catch and escapement of sockeye salmon in the Naknek-Kvichak District by river system, in numbers of fish, Bristol Bay, 1984–2004.
Escapement
Year Catch Kvichaka Alagnak b Nakneka Total Total Run
1984 14,546,710 10,490,670 215,370 1,242,474 11,948,514 26,495,224
1985 8,179,093 7,211,046 118,030 1,849,938 9,179,014 17,358,107
1986 2,892,171 1,179,322 230,180 1,977,645 3,387,147 6,279,318
1987 4,986,002 6,065,880 154,210 1,061,806 7,281,896 12,267,898
1988 3,480,836 4,065,216 194,630 1,037,862 5,297,708 8,778,544
1989 13,809,956 8,317,500 196,760 1,161,984 9,676,244 23,486,200
1990 17,272,224 6,970,020 168,760 2,092,578 9,231,358 26,503,582
1991 10,475,206 4,222,788 277,589 3,578,508 8,078,885 18,554,091
1992 9,395,948 4,725,864 224,643 1,606,650 6,557,157 15,953,105
1993 8,907,876 4,025,166 347,975 1,535,658 5,908,799 14,816,675
1994 16,327,858 8,337,840 242,595 990,810 9,571,245 25,899,103
1995 20,279,581 10,038,720 215,713 1,111,140 11,365,573 31,645,154
1996 8,211,983 1,450,578 306,750 1,078,098 2,835,426 11,047,409
1997 589,311 1,503,732 218,115 1,025,664 2,747,511 3,336,822
1998 2,595,439 2,296,074 252,200 1,202,172 3,750,446 6,345,885
1999 9,452,972 6,196,914 481,600 1,625,364 8,303,878 17,756,850
2000 4,727,061 1,827,780 451,300 1,375,488 3,654,568 8,381,629
2001 5,280,538 1,095,348 267,000 1,830,360 3,192,708 8,473,246
2002 1,418,938 703,884 335,661 1,263,918 2,303,463 3,722,401
2003 c 3,348,453 1,686,804 2,110,000 1,831,170 5,627,974 8,976,427 20 Year Average 8,308,908 4,774,965 257,846 1,507,796 6,540,607 15,110,592 1984–1993 Average 9,394,602 5,916,478 197,797 1,734,383 7,848,658 17,297,341 1994–2003 Average 7,223,213 3,513,767 488,093 1,333,418 5,335,279 12,558,493 2004 c 4,727,187 5,500,134 2,911,600 1,939,374 10,351,108 15,078,295
a Tower count b Aerial survey estimates c Tower counts for the Alagnak River in 2003 and 2004 were 3,676,146 and 5,396,592, respectively.

101
Appendix A12.–Inshore sockeye salmon total run by river system Naknek-Kvichak District, in thousands of fish, Bristol Bay, 1984–2004.
Kvichak Alagnak b Naknek
Year Number % Number % Number % Total Runa
1984 23,014 87 555 2 2,926 11 26,495 1985 13,394 77 264 2 3,699 21 17,357 1986 1,966 31 399 6 3,913 62 6,278 1987 9,593 78 297 2 2,378 19 12,268 1988 6,720 77 320 4 1,739 20 8,779 1989 19,774 84 534 2 3,179 14 23,487 1990 17,521 66 555 2 8,427 32 26,503 1991 8,032 43 604 3 9,918 53 18,554 1992 10,445 65 487 3 5,021 31 15,953 1993 9,313 63 817 6 4,687 32 14,817 1994 22,232 86 634 2 3,033 12 25,899 1995 27,431 87 651 2 3,564 11 31,646 1996 3,458 31 706 6 6,860 62 11,024 1997 1,683 50 244 7 1,409 42 3,336 1998 3,412 54 388 6 2,546 40 6,346 1999 12,947 73 1,070 6 3,740 21 17,757 2000 2,862 34 731 9 4,789 57 8,382 2001 1,426 17 409 5 6,639 78 8,474 2002 704 19 336 9 2,671 72 3,711 2003 1,721 19 2,110 24 5,096 57 8,927 20 Year Average 9,882 57 606 5 4,312 37 14,800 1984–1993Average 11,977 67 483 3 4,589 30 17,049 1994–2003 Average 7,788 47 728 8 4,035 45 12,550 2004 7,332 42 6,510 37 3,721 21 17,563
a Due to rounding of river system total runs, district total run may not equal the sum of the rows. b Total run is based on aerial survey estimate, not tower counts.

102
Appendix A13.–Inshore commercial catch and escapement of sockeye salmon in the Egegik District by river system, 1984–2004.
Escapement
Year Catch Egegika Shosky Cr.b King Salmonb River Total Run 1984 5,190,413 1,165,320 25 6,355,758 1985 7,537,273 1,095,204 8,632,477 1986 4,852,935 1,151,320 430 6,004,685 1987 5,356,669 1,272,978 575 6,630,222 1988 6,456,598 1,599,096 65 8,055,759 1989 8,901,994 1,610,916 50 600 10,513,560 1990 10,371,762 2,191,362 220 12,563,344 1991 6,797,166 2,786,880 45 9,584,091 1992 15,646,575 1,945,332 300 17,592,207 1993 21,600,858 1,516,980 20 23,117,858 1994 10,750,213 1,894,932 15 30 12,645,190 1995 14,425,979 1,281,678 830 15,708,487 1996 10,809,115 1,075,596 11,884,711 1997 7,517,389 1,103,964 40 8,621,393 1998 3,528,845 1,110,882 50 4,639,777 1999 7,388,080 1,727,772 625 9,116,477 2000 7,050,899 1,032,138 8,083,037 2001 2,872,662 968,862 10 3,841,534 2002 4,610,374 1,036,092 5,646,466 2003 2,291,502 1,152,030 90 3,443,622 20-Year Average 8,197,865 1,435,967 32 297 9,634,033 1984–1993Average 9,271,224 1,633,539 45 314 10,904,996 1994–2003 Average 7,124,506 1,238,395 13 278 8,363,069 2004 10,198,236 1,290,144 11,488,380
a Tower count. b Aerial survey index count.

103
Appendix A14.–Inshore commercial catch and escapement of sockeye salmon in the Ugashik District, by river system, 1984–2004.
Escapement
Year Catch Ugashika
River King Salmonb
River Dog Salmonb
River Total Run 1984 2,658,376 1,241,418 17,100 11,800 3,928,694 1985 6,468,862 998,232 7,400 775 7,475,269 1986 5,002,949 1,001,492 4,310 9,780 6,018,531 1987 2,128,652 668,964 15,855 2,075 2,815,546 1988 1,523,520 642,972 8,360 3,080 2,177,932 1989 3,146,239 1,681,296 25,480 6,505 4,859,520 1990 2,149,009 730,038 11,340 8,100 2,898,487 1991 2,945,742 2,457,306 12,195 12,500 5,427,743 1992 3,320,966 2,173,692 13,425 7,810 5,515,893 1993 4,176,900 1,389,534 22,570 1,350 5,590,354 1994 4,352,797 1,080,858 8,885 5,325 5,447,865 1995 4,509,446 1,304,058 7,650 9,400 5,830,554 1996 4,411,055 667,518 7,230 17,419 5,103,222 1997 1,402,690 618,396 27,645 10,600 2,059,331 1998 730,274 890,508 27,425 6,920 1,655,127 1999 2,256,007 1,651,572 6,350 4,120 3,918,049 2000 1,538,790 620,040 12,900 5,480 2,177,210 2001 480,509 833,628 22,940 9,800 1,346,877 2002 1,573,234 892,104 11,460 2,020 2,478,818 2003 1,748,934 758,532 27,620 4,000 2,539,086 20-Year Average 2,826,248 1,115,108 14,907 6,943 3,963,205 1984–1993Average 3,352,122 1,298,494 13,804 6,378 4,670,797 1994–2003 Average 2,300,374 931,721 16,011 7,508 3,255,614 2004 3,127,549 776,364 22,850 15,890 3,942,653
a Tower count. b Aerial survey.

104
Appendix A15.–Inshore commercial catch and escapement of sockeye salmon in the Nushagak District by river system, in numbers of fish, Bristol Bay, 1984–2004.
Escapement Year Catch Wood a Igushik a Nuyakuk a Nush/Mul b Nushagak c Snake d Total Total Run 1984 1,992,681 1,002,792 184,872 472,596 120,586 593,182 33,840 1,814,686 3,807,367 1985 1,307,889 939,000 212,454 429,162 69,300 34,880 1,186,334 2,494,223 1986 2,719,313 818,652 307,728 821,898 168,340 16,780 1,143,160 3,862,473 1987 3,254,720 1,337,172 169,236 163,000 225,034 388,034 1,520 1,895,962 5,150,682 1988 1,706,716 866,778 170,454 319,992 163,208 483,200 4,320 1,524,752 3,231,468 1989 2,788,185 1,186,410 461,610 513,421 28,060 2,189,501 4,977,686 1990 3,532,543 1,069,440 365,802 680,368 28,840 2,144,450 5,676,993 1991 5,053,845 1,159,920 756,126 492,522 10,920 2,419,488 7,473,333 1992 2,789,741 1,286,250 304,920 695,108 2,286,278 5,076,019 1993 5,236,557 1,176,126 405,564 715,099 2,296,789 7,533,346 1994 3,393,143 1,471,890 445,920 509,326 22,480 2,449,616 5,842,759 1995 4,445,883 1,482,162 473,382 69,702 211,605 281,307 17,380 2,254,231 6,700,114 1996 5,693,523 1,649,598 400,746 250,692 252,959 503,651 2,553,995 8,247,518 1997 2,506,818 1,512,396 127,704 272,982 100,053 373,035 8,394 2,021,529 4,528,347 1998 2,990,597 1,755,768 215,904 146,250 312,624 458,874 11,120 2,441,666 5,432,263 1999 6,175,419 1,512,426 445,536 81,006 230,893 311,899 e 2,269,861 8,445,280 2000 6,367,208 1,300,026 413,316 129,468 274,032 403,500 e 2,116,842 8,484,050 2001 4,734,800 1,458,732 409,596 184,044 627,060 811,104 e 2,679,432 7,414,232 2002 2,840,031 1,283,682 123,156 68,928 246,753 315,681 e 1,722,519 4,562,550 2003 6,665,918 1,459,782 194,088 116,646 463,888 580,534 e 2,234,404 8,900,322 20-year Ave. 3,809,777 1,286,450 329,406 251,883 247,595 506,103 18,211 2,082,275 5,892,051 1984–1993Ave. 3,038,219 1,084,254 333,877 441,330 149,294 570,117 19,895 1,890,140 4,928,359 1994–2003 Ave. 4,581,334 1,488,646 324,935 146,635 302,207 454,891 14,844 2,274,410 6,855,744 2004 6,087,776 1,543,342 109,650 77,406 414,292 491,698 e 2,144,690 8,232,466
a Tower count. b Aerial survey estimates for 1985. Escapement estimates for 1984, 1987–1988, and 1995–2004, were derived from the difference between lower river sonar
estimates and Nuyakuk Tower counts. Escapement estimates for 1986 based on the average ratio of Nuyakuk/Nushagak-Mulchatna in years when data was available. In 1987, the counting tower was terminated early due to high water. Tower estimate was expanded using aerial survey data.
c Total escapements from 1989 on are determined for the entire Nushagak River drainage using Portage Creek sonar estimates. d Aerial survey estimate 1984–1991, 1994–1995 and 1997; weir count not surveyed in 1992, 1993 or 1996 due to lack of funding. e Snake River escapement is not included this year because staff was unable to conduct aerial surveys.

105
Appendix A16.–Inshore sockeye salmon total run by river system, in thousands of fish, Nushagak District, 1984–2004.
Wood Igushik Nushagak Snake c Total Total Run Total Run Nushagak Escapementd Catch Total Run Runb
Nuyakuk Nush-Mul Sonar a Total Year Number % Number % Number % Number % Estimate Number Number % Number % 1984 1,982 52 435 11 473 80 121 20 594 763 1,357 36 34 1 3,808 1985 1,593 53 460 15 429 86 69 14 498 407 905 30 35 1 2,993 1986 1,772 37 877 18 822 83 168 17 990 1,197 2,187 45 17 0 4,853 1987 2,828 55 617 12 163 42 225 58 388 1,317 1,705 33 2 0 5,152 1988 1,749 54 406 13 320 66 163 34 483 590 1,073 33 4 0 3,232 1989 2,519 51 1,214 24 513 704 1,217 24 28 1 4,978 1990 2,610 46 1,280 23 680 1,077 1,757 31 29 1 5,676 1991 3,303 44 2,424 32 493 1,243 1,736 23 11 0 7,474 1992 2,481 49 794 16 695 1,107 1,802 35 5,077 1993 3,725 49 1,580 21 715 1,513 2,228 30 7,533 1994 2,957 51 1,300 22 509 1,034 1,543 26 42 1 5,842 1995 4,022 60 1,902 28 70 25 212 75 281 475 756 11 20 0 6,700 1996 5,007 61 1,481 18 251 50 253 50 504 1,256 1,760 21 8,248 1997 3,365 74 291 6 273 73 100 27 373 491 864 19 8 0 4,528 1998 3,901 72 571 11 146 32 313 68 459 490 949 17 11 0 5,432 1999 5,930 70 1,563 19 81 26 231 74 312 640 952 11 8,445 2000 5,278 62 1,748 21 129 32 274 68 404 1,054 1,458 17 8,484 2001 3,987 54 1,315 18 184 23 627 77 811 1,301 2,112 28 7,414 2002 3,715 81 207 5 69 22 247 78 316 325 641 14 4,563 2003 5,647 63 1,018 11 117 20 464 80 581 1,655 2,236 25 8,901 20-Year Ave. 3,419 57 1,074 17 252 47 248 53 530 932 1,462 26 20 0 5,967 1984–1993Ave. 2,456 49 1,009 19 441 71 149 29 605 992 1,597 32 20 0 5,078 1994–2003 Ave. 4,381 65 1,140 16 147 34 302 66 455 872 1,327 19 20 0 6,856 2004 5,375 65% 564 7% 77 16% 414 84% 492 1,801 2,293 28% 8,232
a Sonar estimates not available for 1985–1986. Value derived from sum of escapement for the entire Nushagak River. b Due to rounding, the district total runs may not equal the sum of the rows. District total run is the sum of Wood, Igushik, Nushagak, and Snake total run numbers. c Snake River escapement is not included from 1999–2004 year because staff was unable to conduct aerial surveys. d Escapement percentages represent the portion of sonar escapement that is accounted for in the Nuyakuk or Nush-Mul.

106
Appendix A17.–Inshore commercial catch and escapement of sockeye salmon in the Togiak District by river system, in numbers of fish, Bristol Bay, 1984–2004.
Escapement Catch Togiak Year Togiak Kulukak Os/Mata Total Lakeb Riverc Tributariesd Kulukake Otherf Total Total Run 1984 213,213 96,709 12,204 322,126 95,448 15,830 39,700 49,800 200,778 522,904 1985 133,263 44,120 32,383 209,766 136,542 3,600 13,340 36,600 190,082 399,848 1986 191,158 100,466 17,064 308,688 168,384 20,000 15,000 42,800 25,000 271,184 579,872 1987 274,613 45,401 22,718 342,732 249,676 10,400 18,200 37,800 316,076 658,808 1988 673,408 143,112 5,567 822,087 276,612 18,800 13,600 31,700 340,712 1,162,799 1989 68,375 14,116 6,441 88,932 84,480 15,200 4,560 20,840 125,080 214,012 1990 168,688 27,311 1,590 197,589 141,977 17,540 29,605 49,600 39,480 278,202 475,791 1991g 522,090 33,425 6,437 549,221 254,683 15,980 7,740 23,940 18,370 320,713 869,934 1992 610,575 108,358 7,513 726,446 199,056 6,060 10,400 26,440 25,000 266,956 993,402 1993 475,799 58,616 5,518 539,933 177,185 4,600 11,330 31,800 17,560 242,475 782,408 1994 321,121 76,781 2,137 400,039 154,752 6,200 13,220 29,740 29,720 233,632 633,671 1995 527,143 76,056 2,129 605,328 185,718 6,520 18,988 14,620 14,420 240,266 845,594 1996 381,539 76,833 1,691 460,063 156,954 18,320 11,900 18,980 6,370 212,524 672,587 1997 91,639 47,979 2,951 142,569 131,682 12,300 8,325 7,950 11,116 171,373 313,942 1998 112,993 75,279 2,155 190,427 153,576 9,780 12,120 12,950 26,200 214,626 405,053 1999 346,749 38,662 0 385,411 155,898 10,800 29,438 12,300 22,760 231,196 616,607 2000 727,384 67,612 0 794,996 311,970 25,200 15,075 22,350 15,485 390,080 1,185,076 2001 h 798,426 9,762 1,908 810,096 296,676 6,520 150 17,280 17,990 338,616 1,148,712 2002 214,094 19,112 537 233,743 162,402 4,100 12,075 8,500 12,430 199,507 433,250 2003 650,066 55,081 861 706,008 232,302 8,004 21,545 261,851 967,859 20-Year Average 369,102 60,781 6,674 435,920 184,260 11,748 14,934 26,148 20,136 251,184 687,104 1983–1992 Average 338,516 66,892 11,444 415,580 179,838 13,061 16,607 34,649 26,963 254,939 670,519 1993–2002 Average 399,689 54,669 1,903 456,261 188,681 10,434 13,262 17,647 17,405 247,430 703,690 2004h,i 357,354 80,204 1,095 438,653 129,462 6,100 75 19,044 154,681 593,334
a Catches in the Osviak and Matogak sections were combined. b Tower count. c Aerial survey estimate. d Aerial survey estimate includes Gechiak, Pungokepuk, Kemuk, Nayorurun, and Ongivinuck River systems. Aerial survey estimates prior to 1986 also include
Ungalikthluk, Negukthluk, Matogak, Osviak, and other miscellaneous river systems when surveyed. e Aerial survey estimate includes Kulukak River and Lake and Tithe Creek ponds. f Aerial survey estimate includes Matogak, Osviak, Slug, Negukthlik, and Ungalikthluk and Quigmy Rivers. Prior to 1986 estimates for these systems were included
under tributaries when surveyed. g Catches are based on weekly processor reports. Fish tickets were not coded by section. h Only the Ongivinuk River was surveyed for sockeye escapement in tributaries. i Partial Survey

107
Appendix A18.–Inshore total run of sockeye salmon by district, in numbers of fish, Bristol Bay, 1984–2004.
Year Naknek-Kvichak Egegik Ugashik Nushagak Togiak Total
1984 26,495,224 6,355,758 3,928,694 3,807,367 522,904 41,109,947
1985 17,358,107 8,632,477 7,475,269 2,992,649 399,848 36,858,350
1986 6,279,318 6,004,685 6,018,531 4,853,803 579,872 23,736,209
1987 12,267,898 6,630,222 2,815,546 5,150,681 658,808 27,523,155
1988 8,778,544 8,055,759 2,177,932 3,231,420 1,162,799 23,406,454
1989 23,486,200 10,513,560 4,859,520 4,977,686 214,012 44,050,978
1990 26,503,582 12,563,344 2,898,487 5,676,987 475,791 48,118,191
1991 18,554,091 9,584,091 5,427,743 7,473,333 869,934 41,909,192
1992 15,953,105 17,592,207 5,515,893 5,076,019 993,402 45,130,626
1993 14,816,675 23,117,858 5,590,354 7,533,346 782,408 51,840,641
1994 25,899,103 12,645,190 5,447,865 5,842,759 633,671 50,468,588
1995 31,645,154 15,708,487 5,830,554 6,700,114 845,594 60,729,903
1996 11,047,409 11,884,711 5,103,222 8,247,518 672,587 36,955,447
1997 3,336,822 8,621,393 2,059,331 4,527,953 313,942 18,859,441
1998 6,345,885 4,639,777 1,655,127 5,432,143 405,053 18,477,985
1999 17,738,850 9,116,477 3,918,049 8,445,280 616,607 39,835,263
2000 8,381,629 8,083,037 2,177,210 8,484,050 1,185,076 28,311,002
2001 8,473,246 3,841,534 1,346,877 7,414,232 1,148,712 22,224,601
2002 3,722,401 5,646,466 2,478,818 4,562,550 433,250 16,843,485
2003 8,976,427 3,443,622 2,539,136 8,900,322 967,859 24,827,366 20-Year Average 14,802,984 9,634,033 3,963,208 5,966,511 694,106 35,060,841 1984–1993Average 17,049,274 10,904,996 4,670,797 5,077,329 665,978 38,368,374 1994–2003 Average 12,556,693 8,363,069 3,255,619 6,855,692 722,235 31,753,308 2004 17,563,287 11,488,380 3,942,653 8,232,466 593,334 41,820,120

108
Appendix A19.–Chinook salmon harvest, escapement and total runs in the Nushagak District, in numbers of fish, Bristol Bay, 1984–2004.
Harvests by Fishery
Year Commercial Sport
Subsistence Total Inriver
Abundance a Spawning
Escapement b Total Run
1984 61,378 2,320 9,800 73,498 80,940 154,438
1985 67,783 1,838 7,900 77,521 115,720 193,241
1986 65,783 4,790 12,600 83,173 43,434 33,854 117,027
1987 45,983 4,458 12,200 62,641 84,309 75,891 138,532
1988 16,648 2,817 10,079 29,544 56,905 50,946 80,490
1989 17,637 3,613 8,122 29,372 78,302 72,601 101,973
1990 14,812 3,486 12,407 30,705 63,955 55,931 86,636
1991 19,718 5,551 13,627 38,896 104,351 94,733 133,629
1992 47,563 4,755 13,588 65,906 82,848 74,094 140,000
1993 62,976 5,899 17,709 86,584 97,812 86,706 173,290
1994 119,480 10,626 15,490 145,596 95,954 83,103 228,699
1995 79,943 4,951 13,701 98,595 85,622 77,018 175,613
1996 72,011 5,390 15,941 93,342 52,127 42,228 135,570
1997 64,156 3,497 15,318 82,971 82,000 164,971
1998 117,079 5,827 12,258 135,164 117,495 108,037 243,201
1999 10,893 4,237 10,057 25,187 62,331 54,703 79,890
2000 12,055 6,017 9,470 27,542 56,374 47,674 75,216
2001 11,568 5,899 26,939 44,406 99,155 83,272 127,678
2002 39,473 3,693 11,281 54,447 87,141 79,790 134,237
2003 42,615 5,590 18,686 66,891 80,028 67,403 134,294
20-Year Ave. 49,478 4,763 13,359 67,599 79,303 73,332 140,931
1984–1993 Ave. 42,028 3,953 11,803 57,784 76,490 74,142 131,926
1994–2003 Ave. 56,927 5,573 14,914 77,414 81,803 72,523 149,937 2004 93,414 5,000 20,000 118,414 116,400 103,800 222,214
a Inriver abundance estimated by sonar below the village of Portage Creek. b Spawning escapement estimated from the following: 1984–1985: correlation between index counts and total
escapement estimates when aerial surveys were complete (results rounded to the nearest thousand fish). 1997: comprehensive aerial surveys. 1986–1996, 1998–2004: Inriver abundance estimated by sonar minus inriver harvests.
c Guideline harvest level used as estimate.
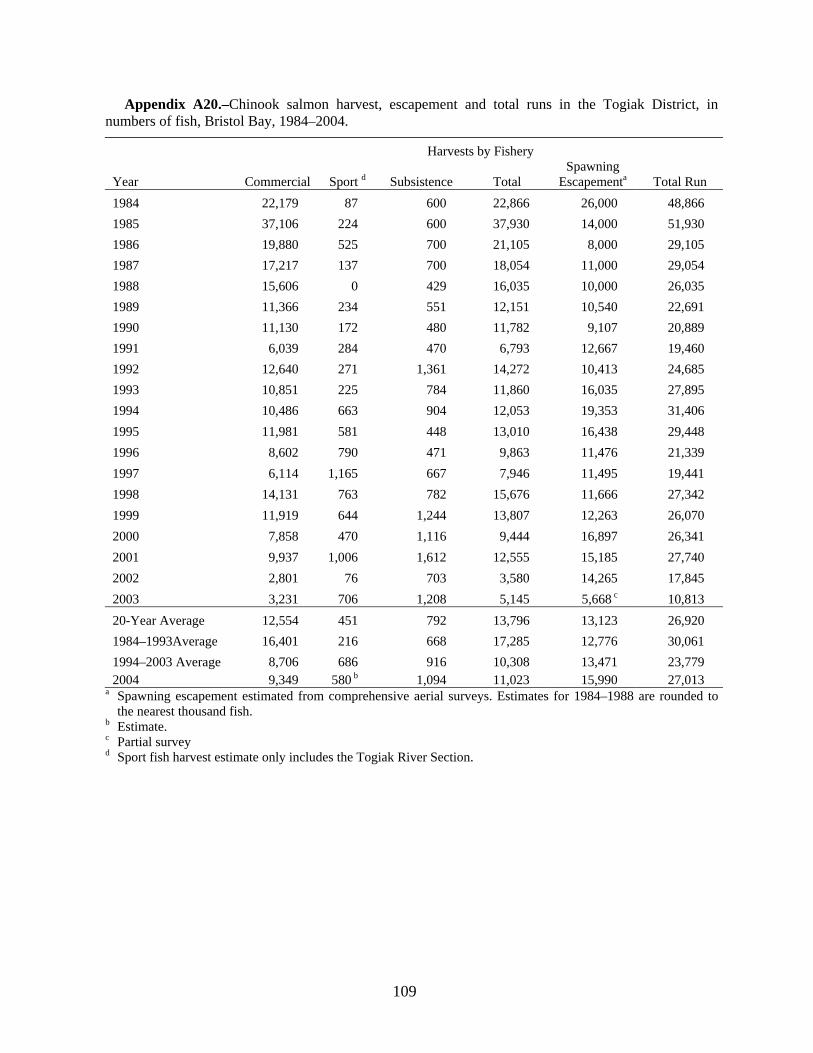
109
Appendix A20.–Chinook salmon harvest, escapement and total runs in the Togiak District, in numbers of fish, Bristol Bay, 1984–2004.
Harvests by Fishery
Year Commercial Sport d Subsistence Total Spawning
Escapementa Total Run 1984 22,179 87 600 22,866 26,000 48,866 1985 37,106 224 600 37,930 14,000 51,930 1986 19,880 525 700 21,105 8,000 29,105 1987 17,217 137 700 18,054 11,000 29,054 1988 15,606 0 429 16,035 10,000 26,035 1989 11,366 234 551 12,151 10,540 22,691 1990 11,130 172 480 11,782 9,107 20,889 1991 6,039 284 470 6,793 12,667 19,460 1992 12,640 271 1,361 14,272 10,413 24,685 1993 10,851 225 784 11,860 16,035 27,895 1994 10,486 663 904 12,053 19,353 31,406 1995 11,981 581 448 13,010 16,438 29,448 1996 8,602 790 471 9,863 11,476 21,339 1997 6,114 1,165 667 7,946 11,495 19,441 1998 14,131 763 782 15,676 11,666 27,342 1999 11,919 644 1,244 13,807 12,263 26,070 2000 7,858 470 1,116 9,444 16,897 26,341 2001 9,937 1,006 1,612 12,555 15,185 27,740 2002 2,801 76 703 3,580 14,265 17,845 2003 3,231 706 1,208 5,145 5,668 c 10,813 20-Year Average 12,554 451 792 13,796 13,123 26,920 1984–1993Average 16,401 216 668 17,285 12,776 30,061 1994–2003 Average 8,706 686 916 10,308 13,471 23,779 2004 9,349 580 b 1,094 11,023 15,990 27,013
a Spawning escapement estimated from comprehensive aerial surveys. Estimates for 1984–1988 are rounded to the nearest thousand fish.
b Estimate. c Partial survey d Sport fish harvest estimate only includes the Togiak River Section.

110
Appendix A21.–Inshore commercial catch and escapement of chum salmon in the Nushagak and Togiak Districts, in numbers of fish, 1984–2004.
Nushagak District Togiak District
Year a Catch Escapement b Total Run Catch Escapement c Total Run
1984 850,114 362,000 1,212,114 336,660 204,000 540,660
1985 396,740 288,000 684,740 203,302 212,000 415,302
1986 488,375 168,275 656,650 270,057 270,057
1987 416,476 147,433 563,909 419,425 361,000 780,425
1988 371,196 186,418 557,614 470,132 412,000 882,132
1989 523,903 377,512 901,415 203,178 143,890 347,068
1990 378,223 329,793 708,016 102,861 67,460 170,321
1991 463,780 287,280 751,060 246,589 149,210 395,799
1992 398,691 302,678 701,369 176,123 120,000 296,123
1993 505,799 217,230 723,029 144,869 98,470 243,339
1994 328,267 378,928 707,195 232,559 229,470 462,029
1995 390,158 212,612 602,770 221,126 163,040 384,166
1996 331,414 225,331 556,745 206,226 117,240 323,466
1997 185,620 61,456 247,076 47,459 106,580 154,039
1998 208,551 299,443 507,994 67,408 102,455 169,863
1999 170,795 242,312 413,107 111,677 116,183 227,860
2000 114,454 141,323 255,777 140,175 80,860 d 221,035
2001 526,602 564,373 1,090,975 211,701 252,610 464,311
2002 276,845 419,969 696,814 112,987 154,360 267,347
2003 740,311 295,413 1,035,724 68,406 39,090 e 107,496
20-Year Average 403,316 275,389 678,705 199,646 164,733 356,142
1984–1993 Average 479,330 266,662 745,992 257,320 196,448 434,123
1994–2003 Average 327,302 284,116 611,418 141,972 136,189 278,161
2004 470,248 283,805 754,053 94,030 103,810 197,840 a Escapement estimates supersede those previously reported. b Escapement based on sonar estimates from the Portage Creek site. Estimates for 1984–1985 are rounded to the
nearest thousand fish. c Escapement estimates based on aerial surveys. Estimates for 1984–1988 rounded to the nearest thousand fish. d No escapement counts were made for the Togiak River. e Only a partial count was made for the Togiak River.

111
Appendix A22.–Inshore commercial catch and escapement of pink salmon in the Nushagak District by river system, in numbers of fish, Bristol Bay, 1964–2004, even years only.
Escapement Year Catch Wooda Igushikb Nuyakukc Nush/Muld Nushagake Snakef Total Total Run 1964 1,497,817 1,560 450 883,500 25,000 50 910,560 2,408,377 1966 2,337,066 1,442,424 1,442,424 3,779,490 1968 1,705,150 2,161,116 2,161,116 3,866,266 1970 417,834 152,580 152,580 570,414 1972 67,953 58,536 58,536 126,489 1974 413,613 44,800 7,500 529,216 3,100 900 585,516 999,129 1976 739,590 21,986 5,070 794,478 41,800 100 863,434 1,603,024 1978 4,348,336 205,000 16,210 8,390,184 771,600 3,483 9,386,477 13,734,813 1980 2,202,545 31,150 3,500 2,626,746 123,000 800 2,785,196 4,987,741 1982 1,339,272 36,100 8,430 1,592,096 19,130 900 1,656,656 2,995,928 1984 3,127,153 81,400 6,190 2,760,312 73,050 5,500 2,926,452 6,053,605 1986 267,117 72,189 72,189 339,306 1988 243,890 494,610 494,610 738,500 1990 54,127 801,430 801,430 855,557 1992 190,102 g 1994 7,337 191,772 191,772 199,109 1996 2,681 821,312 821,312 823,993 1998 6,808 942 132,402 133,344 140,152 2000 38,309 135,285 135,285 173,594 2002 204 317,659 317,659 317,863 Average 950,345 52,867 6,764 1,944,653 150,954 370,832 1,676 1,362,976 2,353,334 2004 25,886 556,065 581,951 607,837
a Aerial survey estimate 1974–1984; tower count 1964. b Aerial survey estimate 1964–1980; aerial survey estimates and tower count 1976 and 1982–1984. c Tower count 1964–1984. Survey estimate below counting tower 1964 and 1982–1984. d Aerial survey estimate. e Sonar estimate from Portage Creek. f Aerial survey estimate 1964, 1974–1976 and 1980–1984, and weir count 1978. g No escapement estimate. Sonar project terminated early due to budget constraints.

112
Appendix A23.–Coho salmon harvest, escapement and total runs in the Nushagak Drainage, in numbers of fish, Bristol Bay, 1984–2004.
Harvests by Fishery Commercial Subsistencea Sport Total Inriver Spawning Total Year Harvest Lower Upper Total Total Harvest Run Escapementc Run 1984 260,310 5885 1,564 7,449 473 268,232 142,841 140,804 409,036 1985 20,230 4360 1,646 6,006 130 26,366 89,862 88,086 114,452 1986 68,568 6533 2,617 9,150 1,576 79,294 52,722 48,529 127,823 1987 13,263 4149 1,209 5,358 1,007 19,628 24,923 22,707 42,335 1988 52,698 3515 1,112 4,627 557 57,882 134,069 132,400 190,282 1989 77,077 6971 1,159 8,130 2,392 87,599 84,628 81,077 168,676 1990 7,733 4856 766 5,622 438 13,793 141,704 140,500 154,293 1991 5,574 8915 1,275 10,190 874 16,638 42,965 40,816 57,454 1992 84,077 4962 1,534 6,496 752 91,325 91,325 1993 14,345 4463 387 4,850 194 19,389 42,742 42,161 61,550 1994 5,615 4302 406 4,708 1,143 11,466 82,019 80,470 91,936 1995 4,896 3233 478 3,711 725 9,332 46,340 45,137 54,469 1996 11,401 3603 1,080 4,683 3,488 19,572 187,028 182,460 202,032 1997 4,110 3,433 500 8,043 43,369 42869 50,912 1998 22,703 201 254 455 1,368 24,526 104,948 103194 127,720 1999 2,836 3,054 244 3,298 618 6,752 34,853 33,991 40,743 2000 112,819 3,811 768 4,579 2,219 119,617 213,062 210,075 329,692 2001 3,218 4,851 612 5,463 2,357 11,038 75,961 72,992 84,030 2002 93 4,054 511 4,565 1,416 6,074 52,194 50,267 56,341 2003 583 120 1,310 1,430 917 2,930 N/A N/A N/A 20-Year Average 38,607 4,307 996 5,210 1,157 44,975 88,679 86,585 129,216 1984–1993Average 60,388 5,461 1,327 6,788 839 68,015 84,051 81,898 141,722 1994–2003 Average 16,827 3,025 629 3,633 1,475 21,935 93,308 91,273 115,320 2004 47,750 0 1,505 d 49,255 152,613 151,108 200,363
a Subsistence harvest estimated by expanding fishing permit returns; excludes estimates for the communities of Manokotak and Wood River. Estimates for 1984–1986 were based on community where permit was issued: 1987 based on community where permit issued and Nushagak watershed fishing site: 1988–present on community of residence and watershed fishing site.
b Inriver run estimated by sonar; sonar estimates expanded for years that terminated prior to August 25. Sonar stopped July 21 in 2003. c Spawning escapement estimated by sonar minus sport and subsistence harvests upriver of Portage Creek sonar site. d Estimate based on five year average. Final numbers not available at this time.

113
Appendix A24.–Coho salmon harvest by fishery, escapement and total runs for the Togiak River, in numbers of fish, Bristol Bay, 1984–2004.
Harvests by Fishery
Year Commercial Subsistencea Sport Total Spawning
Escapementb Total Run
1984 111,631 3,800 1,154 116,585 60,840 177,425
1985 35,765 1,500 0 37,265 33,210 70,475
1986 28,030 500 2,851 31,381 21,400 52,781
1987 1,284 1,600 183 3,067 16,000 19,067
1988 8,744 792 1,238 10,774 25,770 36,544
1989 35,814 976 416 37,206
1990 2,296 1,111 367 3,774 21,390 25,164
1991 4,262 1,238 87 5,587 25,260 30,847
1992 3,918 1,231 251 5,400 80,100 85,500
1993 12,613 743 330 13,686
1994 88,522 910 531 89,963
1995 8,910 703 408 10,021
1996 58,369 199 1,382 59,950 64,980 124,930
1997 2,976 260 780 4,016 20,625 24,641
1998 52,783 310 1,020 54,113 25,335 79,448
1999 2,653 217 1,109 3,979 3,855 d 7,834
2000 2,758 342 840 3,940
2001 3,218 388 904 4,510
2002 754 241 1,475 2,470
2003 961 883 2,086 3,930 6,900 d 10,830
20-Year Average 23,313 897 871 25,081 31,205 57,345
1984–1993Average 24,436 1,349 688 26,473 35,496 62,225
1994–2003 Average 22,190 445 1,054 23,689 24,339 49,537 2004 15,467 204 1,283 c 16,954 16,954
a Subsistence harvest estimated by expanding permit returns; Estimates for 1984–1987 were based on community where permit was issued; 1988–present on community of residence.
b Expanded estimates from aerial surveys. c Estimate. d Results of a partial survey.

114
Appendix A25.–Average round weight (lbs.) of the commercial salmon catch by species, Bristol Bay, 1984–2004.
Year Sockeye Chinook Chum Pink Coho 1984 5.6 20.5 6.8 3.2 7.5 1985 5.8 17.9 6.8 8.0 1986 6.0 18.8 6.7 3.5 6.7 1987 6.0 20.5 6.5 7.0 1988 6.2 18.7 7.0 3.6 7.8 1989 5.6 19.1 6.3 7.4 1990 5.7 16.9 6.3 3.8 7.5 1991 5.7 15.9 6.4 7.3 1992 5.7 16.8 6.4 3.7 7.0 1993 6.0 17.4 6.5 6.8 1994 5.5 18.0 6.5 3.7 8.2 1995 5.5 19.8 6.3 3.6 6.7 1996 6.3 18.0 7.3 3.5 6.8 1997 6.0 16.4 7.3 3.4 6.3 1998 5.7 17.7 6.4 3.3 8.4 1999 5.3 14.3 6.7 3.2 6.4 2000 6.1 15.7 6.9 3.7 7.6 2001 6.7 17.4 8.2 2.8 7.1 2002 6.1 18.2 7.1 3.8 6.8 2003 6.3 16.0 6.5 4.0 6.9 20-Year Average 5.9 17.7 6.7 3.5 7.2 1984–1993Average 5.8 18.3 6.6 3.6 7.3 1994–2003 Average 6.0 17.2 6.9 3.5 7.1 2004 5.8 15.4 6.6 4.1 6.8

115
Appendix A26.–Average price paid in dollars per pound for salmon, by species, Bristol Bay, 1984–2004.
Year Sockeye a Chinook a Chum a Pink a Coho a 1984 0.69 1.03 0.30 0.22 0.71 1985 0.85 1.02 0.31 0.20 0.71 1986 1.42 1.03 0.31 0.15 0.68 1987 1.35 1.24 0.26 0.69 1988 1.93 1.05 0.43 0.34 1.14 1989 1.07 0.80 0.26 0.17 0.67
1990 b 1.04 0.91 0.26 0.27 0.74 1991 0.70 0.68 0.22 0.11 0.58 1992 1.04 0.89 0.24 0.12 0.58 1993 0.62 0.76 0.21 0.11 0.52 1994 0.70 0.47 0.22 0.04 0.45 1995 0.75 0.65 0.20 0.11 0.43 1996 0.75 0.50 0.10 0.05 0.30 1997 0.85 0.55 0.10 0.05 0.46 1998 1.10 0.50 0.10 0.10 0.50 1999 0.80 0.50 0.10 0.05 0.30 2000 0.64 0.48 0.09 0.08 0.38 2001 0.40 0.30 0.11 0.07 0.39 2002 0.45 0.30 0.10 0.05 0.30 2003 0.50 0.30 0.09 0.03 0.30 20-Year Average 0.88 0.70 0.20 0.12 0.54 1984–1993Average 1.07 0.94 0.28 0.19 0.70 1994–2003 Average 0.69 0.46 0.12 0.06 0.38 2004 0.46 0.38 0.09 0.05 0.34
b Price paid in Nushagak District. Bristol Bay average unavailable. a Price does not include all post-season adjustments.

116
Appendix A27.–Estimated exvessel value of the commercial salmon catch by species paid to fishermen, in thousands of dollars, Bristol Bay, 1984–2004. Derived from price per pound times commercial catch.
Year Sockeye Chinook Chum Pink Coho Total 1984 94,681 2,158 4,040 2,414 3,072 106,365 1985 115,402 2,188 2,218 923 120,731 1986 135,689 1,819 2,522 207 826 141,063 1987 130,847 1,912 2,594 314 135,667 1988 168,586 891 4,418 1,171 1,792 176,858 1989 173,963 609 2,029 1,186 177,787 1990 198,897 520 1,752 508 582 202,259 1991 103,750 328 1,807 499 106,384 1992 190,368 1,029 1,359 222 767 193,745 1993 152,034 1,131 989 257 154,411 1994 138,007 1,190 1,043 15 650 140,905 1995 183,262 1,272 1,240 129 185,903 1996 139,208 788 615 7 254 140,872 1997 61,728 689 200 150 62,767 1998 62,948 1,116 294 8 521 64,887 1999 109,495 186 438 38 110,157 2000 80,331 172 236 17 363 81,119 2001 38,250 127 656 48 39,081 2002 29,164 240 330 0 18 29,752 2003 46,917 213 473 89 47,692
20 Year Average 117,676 929 1,463 415 a 624 120,920
1984–1993Average 146,422 1,259 2,373 754 a 1,022 151,527
1994–2003 Average 88,931 599 553 9 a 226 90,314 2004 68,968 645 425 10 162 70,210
a Includes even-years only.

117
Appendix A28.–South Unimak and Shumigan Island preseason sockeye allocation, actual sockeye and chum harvest in thousands of fish, Alaska Peninsula, 1984–2004.
South Unimak a Shumigan Island a Total Sockeye Sockeye Sockeye
Year Actual Quotab Chum Actual Quotab Chum Actual Quotab Chum 1984 1,131 1,111 228 257 245 109 1,388 1,356 337 1985 1,495 1,380 345 367 305 134 1,862 1,685 479 1986 314 907 252 156 200 99 470 1,107 351 1987 652 635 406 141 140 37 793 775 443 1988 474 1,263 465 282 279 62 756 1,542 527 1989 1,348 1,199 408 397 264 48 1,745 1,463 456 1990 1,091 1,087 455 256 240 64 1,347 1,327 519 1991 1,216 1,573 669 333 347 102 1,549 1,920 771 1992 2,047 1,959 324 410 432 102 2,457 2,391 426 1993 2,365 2,375 382 607 524 150 2,972 2,899 532 1994 1,001 2,938 374 460 648 208 1,461 3,586 582 1995 1,451 2,987 342 653 659 195 2,104 3,646 537 1996 572 2,564 129 446 566 228 1,018 3,130 357 1997 1,179 1,840 196 449 406 126 1,628 2,246 322 1998 975 1,529 195 314 336 50 1,289 1,865 245 1999 1,106 1,024 187 269 226 58 1,375 1,250 245 2000 892 1,650 169 359 363 70 1,251 2013 239 2001 271 185 130 149 401 334 2002 356 201 235 178 591 379 2003 336 121 117 161 453 282 20-yr Average 1,014 1,648 302 332 364 117 1,346 2,012 418 1984–1993 Average 1,213 1,349 393 321 298 91 1,534 1,647 484 1994–2003 Average 814 2,076 210 343 458 142 1,157 2,534 352 2004 532 131 816 357 1,348 488
a South Unimak includes statistical area 284 in June and July, while Shumigan Islands includes statistical area 282 in June only.
b The sockeye quota management system was initiated in 1974, and is based on 8.3 % of the Bristol Bay projected inshore harvest and traditional harvest patterns. This quota system was removed in 2001.

118
Appendix A29.–Subsistence salmon harvest, by district and species, Bristol Bay, 1984–2004.
Yearab Permits Issued Sockeye Chinook Chum Pink Coho TotalNaknek-Kvichak District 1984 382 115,200 900 600 1,300 600 118,600 1985 544 107,543 1,179 540 27 1,103 110,392 1986 412 77,283 1,295 695 2,007 650 81,930 1987 407 86,706 1,289 756 490 1,106 90,347 1988 391 88,145 1,057 588 917 813 91,520 1989 411 87,103 970 693 277 1,927 90,970 1990 466 92,326 985 861 1,032 726 95,9301991 518 97,101 1,152 1,105 191 1,056 100,605 1992 571 94,304 1,444 2,721 1,601 1,152 101,222 1993 560 101,555 2,080 2,476 762 2,025 108,898 1994 555 87,662 1,843 503 460 1,807 92,275 1995 533 75,644 1,431 1,159 383 1,791 80,407 1996 540 81,305 1,574 816 794 1,482 85,971 1997 533 85,248 2,764 478 422 1,457 90,368 1998 567 83,095 2,433 784 1,063 1,592 88,967 1999 528 85,315 1,567 725 210 856 88,674 2000 562 61,817 894 560 845 937 65,053 2001 506 57,250 869 667 383 740 59,909 2002 471 52,805 837 909 1,137 943 56,632 2003 489 61,443 1,221 259 198 812 63,934 20 Year Average 497 83,943 1,389 895 725 C 1,179 88,130 1984–1993 Average 466 94,727 1,235 1,104 860 C 1,116 99,041 1994–2003 Average 528 73,158 1,543 686 589 C 1,242 77,219 2004 481 71,110 1,075 469 1,080 566 74,300 Egegik District 1984 24 500 100 300 900 1985 23 582 14 21 1 203 821 1986 41 1,052 69 58 21 319 1,519 1987 49 3,350 87 139 2 284 3,862 1988 52 1,405 97 87 54 333 1,976 1989 50 1,636 50 33 1 414 2,134 1990 61 1,105 53 85 39 331 1,613 1991 70 4,549 82 141 32 430 5,234 1992 80 3,322 124 270 51 729 4,496 1993 69 3,633 128 148 15 905 4,829 1994 59 3,208 166 84 153 857 4,468 1995 60 2,818 86 192 100 690 3,886 1996 44 2,321 99 89 85 579 3,173 1997 34 2,438 101 21 5 740 3,304 1998 36 1,795 44 33 52 389 2,314 1999 42 2,434 106 35 2 806 3,384 2000 31 842 16 11 0 262 1,131 2001 57 2,493 111 105 16 928 3,653 2002 53 1,892 65 34 12 356 2,359 2003 62 3,240 84 32 10 297 3,663 20 Year Average 50 2,231 83 86 34 C 508 2,936 1984–1993 Average 52 2,113 78 108 24 C 425 2,738 1994–2003 Average 48 2,348 88 64 44 C 590 3,133 2004 46 2,618 169 410 91 1,423 4,711
-continued-

119
Appendix A29.–Page 2 of 3.
Year Permits Issued Sockeye Chinook Chum Pink Coho TotalUgashik District 1984 8 500 200 700 1985 9 233 17 7 143 400 1986 27 1,080 83 48 21 335 1,567 1987 22 892 104 51 29 272 1,348 1988 23 1,400 84 55 35 330 1,904 1989 22 1,309 32 35 2 214 1,592 1990 37 1,578 51 143 120 280 2,172 1991 38 1,403 121 168 42 614 2,348 1992 37 2,348 106 79 8 397 2,938 1993 39 1,766 86 107 24 495 2,478 1994 31 1,587 126 42 38 579 2,372 1995 20 1,513 56 18 6 290 1,883 1996 26 1,247 50 21 7 298 1,623 1997 28 2,785 169 39 23 311 3,327 1998 27 1,241 59 75 82 485 1,942 1999 25 1,365 35 5 0 271 1,675 2000 31 1,927 51 34 1 467 2,481 2001 24 1,197 61 8 2 357 1,624 2002 23 1,294 51 14 2 460 1,821 2003 23 1,113 31 30 0 392 1,567 20 Year Average 26 1,389 72 52 25 C 359 1,888 1984–1993 Average 26 1,251 76 77 35 C 328 1,745 1994–2003 Average 26 1,527 69 29 16 C 391 2,032 2004 21 804 64 9 4 234 1,116 Nushagak District 1984 438 43,200 9,800 10,300 6,600 8,100 78,000 1985 406 38,000 7,900 4,000 600 6,100 56,600 1986 424 49,000 12,600 10,000 5,400 9,400 86,400 1987 474 40,900 12,200 6,000 200 6,200 65,500 1988 441 31,086 10,079 8,234 6,316 5,223 60,938 1989 432 34,535 8,122 5,704 407 8,679 57,447 1990 441 33,003 12,407 7,808 3,183 5,919 62,320 1991 528 33,161 13,627 4,688 292 10,784 62,552 1992 476 30,640 13,588 7,076 3,519 7,103 61,926 1993 500 27,114 17,709 3,257 240 5,038 53,358 1994 523 26,501 15,490 5,055 2,042 5,338 54,426 1995 484 22,793 13,701 2,786 188 3,905 43,373 1996 481 22,935 15,941 4,704 1,573 5,217 50,370 1997 538 25,080 15,318 2,056 218 3,433 46,106 1998 562 25,217 12,258 2,487 1,076 5,316 46,355 1999 548 29,387 10,057 2,409 124 3,993 45,969 2000 541 24,451 9,470 3,463 1,662 5,983 45,029 2001 554 26,939 11,760 3,011 378 5,993 48,080 2002 520 22,777 11,281 5,096 1,179 4,565 44,897 2003 527 25,491 18,686 5,064 403 5,432 55,076 20 Year Average 490 30,880 12,279 5,165 1,852 C 6,120 56,297 1984–1993 Average 456 36,064 11,803 6,707 2,676 C 7,255 64,504 1994–2003 Average 528 25,157 13,396 3,613 884 C 4,917 47,968 2004 511 17,491 15,610 3,869 1,944 4,240 43,154
-continued-

120
Appendix A29. –Page 3 of 3. Year Permits Issued Sockeye Chinook Chum Pink Coho TotalTogiak District 1984 41 3,600 600 1,700 500 3,800 10,200 1985 51 3,400 600 1,000 100 1,500 6,600 1986 29 2,400 700 800 100 500 4,500 1987 46 3,600 700 1,000 1,600 6,900 1988 29 2,413 429 716 45 792 4,395 1989 40 2,825 551 891 112 976 5,355 1990 37 3,689 480 786 60 1,111 6,126 1991 43 3,517 470 553 27 1,238 5,805 1992 40 3,716 1,361 626 135 1,231 7,069 1993 38 2,139 784 571 8 743 4,245 1994 25 1,777 904 398 77 910 4,066 1995 22 1,318 448 425 0 703 2,894 1996 19 662 471 285 59 199 1,676 1997 31 1,440 667 380 0 260 2,747 1998 42 2,211 782 412 76 310 3,791 1999 76 3,780 1,244 479 84 217 5,804 2000 54 3,013 1,116 569 90 342 5,130 2001 92 4,162 1,612 367 61 388 6,590 2002 36 2,319 703 605 10 241 3,878 2003 92 4,403 1,208 483 451 883 7,428 20 Year Average 44 2,819 791 652 105 C 897 5,260 1984–1993 Average 39 3,130 668 864 121 C 1,349 6,120 1994–2003 Average 49 2,509 915 440 91 C 445 4,400 2004 46 1,795 1,094 383 108 204 3,584 Total Bristol Bay Area 1984 893 163,000 11,300 12,700 8,400 13,000 208,400 1985 1,033 149,758 9,710 5,568 728 9,049 174,813 1986 933 130,815 14,747 11,601 7,549 11,204 175,916 1987 998 135,493 14,356 7,895 689 9,453 167,886 1988 936 124,449 11,746 9,680 7,367 7,491 160,733 1989 955 127,408 9,725 7,356 799 12,210 157,498 1990 1,042 131,701 13,976 9,683 4,434 8,367 168,161 1991 1,197 139,731 15,452 6,655 584 14,122 176,544 1992 1,204 134,330 16,623 10,772 5,314 10,612 177,651 1993 1,206 136,207 20,787 6,559 1,049 9,206 173,808 1994 1,193 120,735 18,529 6,082 2,770 9,491 157,607 1995 1,119 104,086 15,722 4,580 677 7,378 132,443 1996 1,110 108,470 18,136 5,915 2,518 7,775 142,813 1997 1,166 116,991 19,159 2,974 668 6,201 145,992 1998 1,234 113,560 15,576 3,792 2,349 8,093 143,368 1999 1,219 122,281 13,009 3,653 420 6,143 145,506 2000 1,219 92,050 11,547 4,637 2,599 7,991 118,824 2001 1,226 92,041 14,412 4,158 839 8,406 119,856 2002 1,093 81,088 12,936 6,658 2,341 6,565 109,587 2003 1,182 95,690 21,231 5,868 1,062 7,816 131,667 2002 1,093 81,088 12,936 6,658 2,341 6,565 109,58720 Year Average 1,108 120,994 14,934 6,839 2,658 C 9,029 154,454 1984–1993 Average 1,040 137,289 13,842 8,847 3,691 C 10,471 174,141 1994–2003 Average 1,176 104,699 16,026 4,832 1,624 C 7,586 134,766 2004 1,100 93,819 18,012 5,141 3,225 6,667 126,865 a Harvests are extrapolated for all permits issued, based on those returned. Harvests prior to 1985 are rounded to the nearest hundred fish. b Permit and harvest estimates prior to 1989 are based on the community where the permit was issued; estimates from 1989 to the present are
based on the area fished, as first recorded on the permit. c Includes even years only.

121
Appendix A30.–Subsistence harvest of sockeye salmon by community, in numbers of fish, Kvichak River drainage, Bristol Bay, 1984–04.
Yearab Levelock Igiugig Pedro Bay Kokhanok
Iliamna- Newhalene Nondalton
Port Alsworth Otherf Total
1984 8,100 6,300 12,100 24,400 15,900 29,100 4,600 100,500 1985 6,600 3,400 12,900 21,900 22,300 14,900 4,500 86,500 1986 6,400 1,600 6,700 18,300 17,000 6,600 3,300 59,900 1987 5,700 c 7,300 16,500 27,500 11,800 3,200 72,000 1988 3,500 c 5,500 14,400 29,800 20,700 3,200 d 77,100 1989 5,100 1,200 6,700 13,000 24,700 18,500 2,200 d 71,400 1990 4,700 2,200 6,600 12,400 18,800 27,300 3,200 1,400 76,600 1991 1,029 1,712 9,739 17,184 29,094 4,163 2,755 1,110 66,786 1992 4,374 1,056 6,932 11,477 29,633 13,163 2,954 2,559 72,148 1993 4,699 1,397 6,226 18,810 19,067 17,890 3,254 2,780 74,123 1994 1,467 1,201 8,747 15,771 15,553 15,246 3,074 3,284 64,343 1995 3,756 497 5,359 14,412 20,134 4,188 2,892 3,441 54,679 1996 1,120 2,309 5,219 14,011 14,787 11,856 3,263 2,307 54,872 1997 1,062 2,067 5,501 8,722 19,513 17,194 2,348 3,101 59,508 1998 2,454 1,659 3,511 10,418 16,165 13,136 2,678 3,635 53,656 1999 1,276 1,608 5,005 10,725 14,129 17,864 4,282 2,834 57,723 2000 1,467 1,981 1,815 7,175 6,679 11,953 3,200 2,720 36,990 2001 908 779 2,118 9,447 8,132 7,566 1,958 1,901 32,808 2002 625 2,138 2,687 9,847 9,417 5,508 1,201 1,578 33,001 2003 737 1,081 2,135 9,771 13,824 8,016 1,370 1,591 38,495 20 Year Average 3,254 1,899 6,140 13,933 18,606 13,832 2,971 2,446 62,157 1984–1993 Average 5,020 2,358 8,070 16,837 23,379 16,412 3,316 1,962 1994–2003 Average 1,487 1,532 4,210 11,030 13,833 11,253 2,627 2,639 2004 1,000 1,026 4,803 11,869 21,652 8,789 2,455 1,631 53,225
a Harvests are extrapolated for all permits issued, based on those returned. Harvest estimates from 1991are rounded to the nearest hundred fish.
b Harvest estimates prior to 1990 are based on the community where the permit was issued; estimates from 1990 to the present are based on community of residence and include fish caught only in the Kvichak District.
c No permits issued. d No permits issued. Only residents of the Naknek/Kvichak watershed could obtain subsistence permits. e Includes Chekok f Subsistence harvests by non-Kvichak River watershed residents.

122
Appendix A31.–Subsistence salmon harvest by community, Nushagak District, Bristol Bay, 1984–2004.
Year ab Dillinghame Manokotak Aleknagik Ekwok New
Stuyahok Koliganek Otherf Total
1984 30,500 4,100 2,600 7,200 16,500 17,100 78,000
1985 22,900 3,600 1,600 7,000 14,500 6,800 56,400
1986 31,900 5,500 6,900 7,800 26,400 8,200 86,700
1987 33,500 5,900 3,100 6,400 11,400 4,900 65,200
1988 29,600 d 5,500 2,400 6,100 11,700 5,700 c 61,000
1989 31,800 d 5,800 2,000 4,700 9,700 3,800 c 57,800
1990 28,860 d 6,600 2,300 4,900 9,900 8,000 700 61,260
1991 34,399 d 5,873 3,043 4,532 8,326 5,438 2,163 63,774
1992 31,702 d 4,317 2,184 5,971 11,325 3,708 2,635 61,842
1993 25,315 d 3,048 2,593 2,936 12,169 4,180 2,538 52,779
1994 30,145 d 3,491 2,289 4,343 8,056 4,513 2,322 55,159
1995 24,998 d 2,453 1,468 2,046 6,911 2,983 2,406 43,265
1996 27,161 d 3,883 1,733 2,866 8,892 3,319 2,113 49,967
1997 23,255 d 3,988 1,989 1,797 6,427 4,179 4,598 46,233
1998 24,072 d 4,069 1,112 3,555 5,419 3,166 4,958 46,351
1999 26,502 d 3,413 1,532 1,805 4,556 2,772 5,389 45,969
2000 27,931 d 3,173 1,111 3,946 3,715 2,792 2,362 45,029
2001 26,435 d 3,700 2,129 2,218 7,294 2,209 4,096 48,080
2002 25,004 d 3,254 1,517 2,735 6,043 3,098 3,247 44,897
2003 26,955 d 4,214 2,044 2,291 10,817 5,721 3,034 55,076
20 Year Average 28,147 4,294 2,282 4,257 10,002 5,129 3,040 56,239
1984–1993 Average 30,048 5,024 2,872 5,754 13,192 6,783 2,009 64,476
1994–2003 Average 26,246 3,564 1,692 2,760 6,813 3,475 3,453 48,003
2004 23,308 d 2,052 2,206 1,891 6,714 3,619 3,364 43,154
a Harvests are extrapolated for all permits issued, based on those returned. Harvest estimates prior to 1991 are rounded to the nearest hundred fish.
b Harvest estimates prior to 1990 are based on the community where the permit was issued; estimates from 1990 to the present are based on community of residence and include fish caught only in the Nushagak District.
c No permits issued. Only residents of the Nushagak watershed could obtain subsistence permits. d Includes permits issued in Clarks Point and Ekuk. e Includes the village of Portage Creek and Clarks Point. f Subsistence harvests by non-watershed residents.


123
APPENDIX B. HERRING

124
Appendix B1.–Sac roe herring industry participation, fishing effort and harvest, Togiak District, 1984–2004.
Gillnet Purse Seine
Year Companies
Daily Processing Capacitya
Fishery Dates Effortb
Duration (hrs.) Harvestc C.P.U.E. Roe% Effortb
Duration (hrs.) Harvestc C.P.U.E. Roe%
Total Harvestc
1984 25 5/18–5/21 300 35.0 4,934 0.5 8.4 196 11.0 14,485 6.7 10.2 19,419 1985 23 5/23–5/25 302 11.0 4,482 1.3 7.4 155 3.0 21,330 45.9 10.0 25,812 1986 23 5/14–5/15 209 10.0 3,448 1.6 8.8 209 1.0 12,828 61.4 9.9 16,276 1987 18 4/27–5/6 148 36.0 2,685 0.5 8.6 111 5.5 12,845 21.0 8.9 15,530 1988 22 5/17 300 4.0 3,695 3.1 8.3 239 0.5 10,472 87.6 10.9 14,167 1989 19 5/9–5/14 320 5.0 2,844 1.8 7.8 310 3.0 9,415 10.1 8.5 12,259 1990 16 3,100 5/8–5/20 277 66.0 3,072 0.2 9.0 221 3.0 9,158 13.8 9.7 12,230 1991 16 3,350 5/10–5/17 170 14.0 3,182 1.3 8.5 200 3.0 11,788 19.6 10.0 14,970 1992 18 3,700 5/20–5/27 274 25.5 5,030 0.7 8.8 301 0.3 20,778 230.1 9.2 25,808 1993 12 2,500 4/27–5/9 75 144.5 3,564 0.3 10.1 140 33.8 14,392 3.0 9.6 17,956 1994 16 3,300 5/11–5/20 146 76.0 7,462 0.7 12.0 240 4.6 22,853 20.7 9.4 30,315 1995 22 4,350 5/7–5/15 250 33.5 6,995 0.8 12.0 254 12.2 19,737 6.4 10.1 26,732 1996 19 4,850 5/3–5/8 461 18.0 6,863 0.8 11.1 268 2.4 18,008 27.8 9.0 24,871 1997 18 4,200 5/2–5/6 336 24.0 5,164 0.6 11.8 231 6.4 18,649 12.6 9.4 23,813 1998 15 2,475 4/29–5/10 152 46.0 5,952 0.9 12.5 123 16.5 16,824 8.3 9.6 22,776 1999 12 2,400 5/18–5/26 171 28.0 4,858 1.0 11.5 96 4.7 15,020 33.3 9.2 19,878 2000 12 2,100 5/6–5/14 227 67.0 5,464 0.4 10.6 90 15.8 14,957 10.6 10.1 20,421 2001 11 2,255 5/6–5/13 96 84.0 6,481 0.8 10.6 64 26.0 15,849 9.5 9.2 22,330 2002 8 1,920 5/3–5/13 82 102.0 5,216 0.6 10.9 37 57.5 11,833 5.6 9.3 d 17,049 2003 7 1,920 4/25–5/7 75 142.0 6,505 0.6 10.9 35 110.2 15,158 3.9 8.9 d 21,663 1984–2003 Average 17 3,030 219 49 4,895 0.9 10.0 176 16 15,319 31.9 9.6 20,214 1994–2003 Average 14 2,977 200 62 6,096 0.7 11.4 144 26 16,889 13.9 9.5 22,985 2004 6 2,150 4/29–5/9 54 162.0 4,980 1 10.4 31 78 13,888 5.7 9.5 18,868 a Number of tons per day based on companies registered. b Peak aerial survey count. c Harvest total does include deadloss and test fish harvest. d Values are lower than inseason assessment due to more stringent post-season market scrutiny compared with previous years.

125
Appendix B2.–Exploitation of Togiak herring stock, 1984–2004.
Biomass
Estimatea S-O-K Herring Dutch Harbor Sac Roe Total Exploitation
Year (short tons) Equivalent Food/Bait Gillnet Purse Seineb Wastec Total Harvest Rate 1984 106,422 1,552 4,934 14,485 19,419 20,971 19.7% 1985 114,604 0 4,482 21,330 25,812 25,812 22.5% 1986 86,310 1,446 3,448 12,828 16,276 17,722 20.5% 1987 64,462 1,309 2,685 12,845 15,530 16,839 26.1% 1988 128,959 1,782 2,004 3,695 10,472 14,167 17,953 13.9% 1989 80,100 2,499 3,081 2,844 9,415 12,259 17,839 22.3% 1990 71,879 1,617 820 3,072 9,158 12,230 14,667 20.4% 1991 55,000 1,310 1,325 3,182 11,788 14,970 17,605 32.0% 1992 129,256 1,482 1,949 5,030 20,778 25,808 29,239 22.6% 1993 164,130 1,481 2,790 3,564 14,392 17,956 22,227 13.5% 1994 148,716 1,134 3,349 7,462 22,853 30,315 34,798 23.4% 1995 149,093 996 1,748 6,995 19,737 26,732 29,476 19.8% 1996 135,585 1,899 2,239 6,863 18,008 24,871 29,009 21.4% 1997 125,000 0 1,950 5,164 18,649 350 23,813 25,763 20.6% 1998 121,000 0 1,994 5,952 16,824 400 22,776 24,770 20.5% 1999 156,183 1,605 2,398 4,858 15,020 221 19,878 23,881 15.3% 2000 130,904 0 2,014 5,464 14,957 100 20,421 22,435 17.1% 2001 119,818 0 1439 6,481 15,849 219 22,330 23,769 19.8% 2002 120,196 260 2846 5,216 11,833 40 17,049 20,155 16.8% 2003 126,213 55 1,487 6,505 15,158 380 21,663 23,205 18.4% 1984–2003 Average 116,692 1,021 2,090 4,895 15,319 244 20,214 22,907 20.3% 1994–2003 Average 133,271 595 2,146 6,096 16,889 244 22,985 25,726 19.3% 2004 143,124 0 1,258 4,980 13,785 103 18,868 20,126 14.1%
a Preseason forecast unless peak biomass estimate inseason exceeded preseason forecast b Includes testfish harvest c Estimated waste, also included in purse seine harvest.

126
Appendix B3.–Age composition of inshore herring, Togiak District, 1984–2004.
Age Composition (%)a
Year 3 c 4 5 6 7 8 9+ Total Run
(tons) b 1984 2 2 28 42 4 24 114,880 1985 1 1 8 35 42 13 131,400 1986 1 2 15 44 38 94,770 1987 8 10 28 54 88,400 1988 2 5 1 13 5 74 134,717 1989 5 11 4 15 65 98,965 1990 d d d 6 11 3 80 88,105 1991 7 1 1 16 18 57 83,329 1992 d 10 20 1 1 15 53 156,955 1993 d 6 23 1 1 67 193,847 1994 d 2 12 28 3 55 185,454 1995 1 4 7 24 30 35 e 1996 d 3 5 7 21 64 e 1997 d 7 5 12 11 10 55 144,887 1998 d 4 5 10 11 70 e 1999 d d 1 13 9 12 65 157,026 2000 d d 1 2 17 16 63 e 2001 5 21 5 4 27 39 146,209 2002 1 25 28 4 5 36 e 2003 d 3 37 25 4 31 e 2004 d d 3.8 43.7 24.6 27.5 e
a Age composition in 1984–1992 is weighted by aerial survey data and weight at age. b Includes commercial catch, escapement, and documented waste. c Includes age 1, 2 and 3 herring. d Contribution of age class is less than 0.5%. e Age contribution of the commercial purse seine harvest (by weight) was used to represent the total run for the
1995, 1996, 1998, 2000, 2002,2003 and 2004 fishing seasons. Aerial surveys to determine abundance were hampered by poor weather conditions preventing estimation of total biomass estimate.

127
Appendix B4.–Herring spawn-on-kelp industry participation, fishing effort, area and harvest, Togiak District, 1984–2004.
Fishery Total Harvest Herring Equivalent Year Companies Dates Hours Efforta Area in pounds (in tons) Openings Average roe % 1984 6 5/21–5/24 16.0 330 K 4, K 9 406,586 1,552 3 9.8 1985 no fishery 9.6 1986 6 5/18–5/21 21.0 204 K 7, K 8, K 9 374,142 1,446 4 9.7 1987 5 4/29–5/4 6.6 187 K 9, K 10 307,307 1,309 5 8.8 1988 10 5/20 6.0 259 K 4, K 8 489,320 1,782 1 10.3 1989 11 5/14 4.0 487 K 9 559,780 2,499 1 8.3 1990 7 5/11 3.0 481 K 8 413,844 1,617 1 9.5 1991 7 5/13 2.5 532 K 4 348,357 1,310 1 9.7 1992 5 5/23 3.3 386 K 9 363,600 1,482 2 9.1 1993 2 5/1–5/2 7.0 173 K 8 383,000 1,481 2 9.7 1994 3 5/13–5/14 7.5 204 K 5 308,400 1,134 2 10.0 1995 5 5/11–5/14 14.5 188 K 2, K 3 281,600 996 3 10.6 1996 3 5/9–5/10 12.0 200 K 8, K 9 455,800 1,899 2 9.6 1997 no fishery 1998 no fishery 1999 1 5/23 8.0 130 K 9 419,563 1,605 2 9.8 2000 no fishery 2001 no fishery 2002 1 5/14 2.0 50 K9 67,793 260 1 9.8 2003 1 5/3–5/4 3.0 35 K-3 138 b 84 b 55 1 9.45 b 1994–2003 Average 2 7.8 135 257,840 992 2 9.9 1999–2003 Average 1 4.3 72 167,080 640 1 9.7 2004 no fishery
a 1984–1989 and 1992–1996, number of permits fished based on fish tickets. 1990 and 1991, peak aerial survey count. b Data confidential under Alaska Statute 16.05.815.

128
Appendix B5.–Aerial survey estimates of herring biomass and spawn deposition, Togiak District, 1984–2004.
Preseason Biomass Spawn Estimates Year a Forecasta Estimate Observations Miles 1984 106,422 114,880 171 61 1985 81,899 131,400 141 43 1986 86,310 94,700 182 67 1987 61,100 88,400 160 76 1988 54,500 134,717 107 61 1989 80,100 98,965 69 53 1990 56,000 88,105 94 66 1991 55,000 83,329 90 70 1992 60,214 156,955 160 97 1993 148,786 193,847 76 53 1994 142,497 185,454 80 72 1995 149,093 149,093 b 70 59 1996 135,585 135,585 b 99 73 1997 125,000 144,887 79 59 1998 121,000 121,000 b 42 33 1999 90,000 156,183 33 56 2000 130,904 130,904 b 71 46 2001 119,818 119,818 c 100 57 2002 120,196 120,196 b 79 32 2003 126,213 126,213 b 42 95 1984–2003 Average 102,532 128,732 97 61 1994–2003 Average 126,031 138,933 70 58 2004 143,124 143,124 b 17 36
a 1993–2004 forecasts based on Age Structured Analysis. Previous years based on age composition, abundance, average growth and mortality rates.
b Peak biomass estimate could not be determined, therefore, preseason forecast was used.

129
Appendix B6.–Exvessel value of the commercial herring and spawn-on-kelp harvest, in thousands of dollars, Togiak District, 1984–2004.
Herring Year Sac Roea Food/Baita Spawn-on-Kelpa Total a 1984 7,178 33 203 7,414 1985 13,696 41 b 13,737 1986 8,648 12 187 8,847 1987 8,614 49 166 8,829 1988 14,103 3 346 14,452 1989 4,983 19 448 5,450 1990 6,494 9 360 6,863 1991 6,173 21 383 6,577 1992 8,818 26 254 9,098 1993 5,218 3 268 5,489 1994 9,090 0 212 9,302 1995 16,713 0 362 17,075 1996 14,395 5 510 14,910 1997 4,306 0 b 4,306 1998 3,986 0 b 3,986 1999 6,211 0 315 6,526 2000 4,000 0 b 4,000 2001 3,090 0 b 3,090 2002 1,880 0 20 1,900 2003 2,797 0 c 2,797 1984–2003 Average 7,520 11 288 7,732 1994–2003 Average 6,647 1 284 6,789 2004 2,541 0 b 2,541
a Exvessel value (value paid to the fishermen) is derived by multiplying price/ton by the commercial harvest. These estimates do not include any postseason adjustments to fishermen from processors and should therefore be treated as minimum estimates.
b Fishery not conducted. c Data confidential under Alaska Statute 16.05.815.

130
Appendix B7.–Guideline and actual harvests of sac roe herring (tons) and spawn-on-kelp (lbs), Togiak District, 1984–2004.
Gillnet Sac Roe Purse Seine Sac Roe Spawn-on-Kelp
Year Guidelinea Actual Differencec Guidelinea Actual b Differencec Guidelinea Actual Differencec 1984 350,000 406,586 16%
1985 350,000 d 1986 350,000 374,142 7% 1987 350,000 307,307 –12% 1988 5,647 3,695 –35% 16,943 10,472 –38% 350,000 489,320 40% 1989 3,376 2,844 –16% 10,128 9,415 –7% 350,000 559,780 60% 1990 2,993 3,072 3% 8,980 9,158 2% 350,000 413,844 18% 1991 3,143 3,182 1% 9,429 11,788 25% 350,000 348,357 0% 1992 5,662 5,030 –11% 16,985 20,778 22% 350,000 363,600 4% 1993 6,570 3,564 –46% 19,709 14,392 –27% 350,000 383,000 9% 1994 6,277 7,462 19% 18,832 22,853 21% 350,000 308,400 –12% 1995 6,582 6,995 6% 19,747 19,737 0% 350,000 281,600 –20% 1996 5,956 6,863 15% 17,868 18,008 1% 350,000 455,800 30% 1997 5,464 5,164 –5% 16,391 18,649 14% 350,000 d 1998 5,280 5,952 13% 15,840 16,824 6% 350,000 d 1999 6,914 4,858 –30% 20,741 15,020 –28% 350,000 419,563 20% 2000 5,738 5,464 –5% 17,215 14,957 –13% 350,000 d 2001 6,268 6,481 3% 14,624 15,849 8% 350,000 d 2002 6,288 5,216 –17% 14,673 11,833 –19% 350,000 67,793 –81% 2003 6,624 6,505 –2% 15,457 15,158 –2% 350,000 13,884 e –96% 1989–03 Average 5,542 5,243 –5% 15,775 15,628 0% 350,000 328,693 –6% 1994–2003 Average 6139.1 6,096 –0.002 17138.8 16,889 –0.012 350,000 257,840 –26% 2004 7,568 4,980 –34% 17,658 13,888 –21% 350,000 d
a Harvest guideline derived from inseason biomass estimate when available, or preseason forecast if weather prevents an estimate. b Includes deadloss and test fish harvest. c Actual minus guideline divided by guideline. d No fishery conducted e Data confidential under Alaska Statute 16.05.815.