annual market report - eckart noack
DESCRIPTION
Presenting real estate statistics and home sales data for Marin, Napa, Sonoma, and San Francisco.TRANSCRIPT

M A R K E TR E P O R T
2015
Eckart Noack
T A B L E O F C O N T E N T S
03 | Foreword
28 | Marin Luxury Market
07 | Marin Sales 1965 - 2015
08 - Beach Cities 09 - Belvedere 10 - Corte Madera 11 - Fairfax 12 - Greenbrae 13 - Kentfield 14 - Larkspur 15 - Mill Valley
16 - Novato 17 - Ross 18 - San Anselmo 19 - San Rafael20 - Sausalito 21 - Tiburon22 - West Marin23 - Marin Condos
All data courtesy of BAREIS MLS
04 | Achievement
30 | Attracting Buyers Worldwide32 | Significant Sales
2 | Decker Bullock Sotheby’s International Realty
06 | 2015 Sales in Summary
26 | San Francisco
25 | Sonoma County
24 | Napa County
Marin Communities
Decker Bullock Sotheby’s International Realty has moved to the #1 brokerage position
in Marin as measured by sales volume, while ranking 3rd in California among Sotheby’s
International Realty affiliates and 12th in the United States. In 2016 we are celebrating 25
years of providing luxury service to clients at all price points.
The Bay Area is one of the most desirable places to live in the world. Its natural beauty,
relatively mild weather and robust job market, fueled in large part by the tech industry, has
resulted in a median Bay Area home price of $841,560. This is considered a luxury price
point in most regions around the globe. Local housing markets have generally recovered
and regained their 2007 peak values with some exceeding their 2007 highs.
Supply and demand is the driving force in any market. A lack of inventory, combined with
historically low interest rates has created a competitive and generally fast-moving Bay
Area real estate market. For those looking to sell, this is the best time to start the listing
and sales process because demand remains high. Buyers who require a mortgage to
finance their purchase may still have an opportunity to benefit from the lowest level of
mortgage interest rates in history.
My affiliation with Decker Bullock Sotheby’s International Realty allows me to collaborate
daily with high caliber, professional agents which in turn helps me better serve my clients.
The Sotheby’s International Realty network provides opportunities to assist my clients in
finding top agents in markets all over the world.
I look forward to assisting you with all of your real estate-related needs in 2016!
F O R E W O R D
2015 Market Report | 3 All data courtesy of BAREIS MLS
ECKART [email protected]# 01213357

Offering Luxury Service At All Price Points
Offering Luxury Service At All Price Points
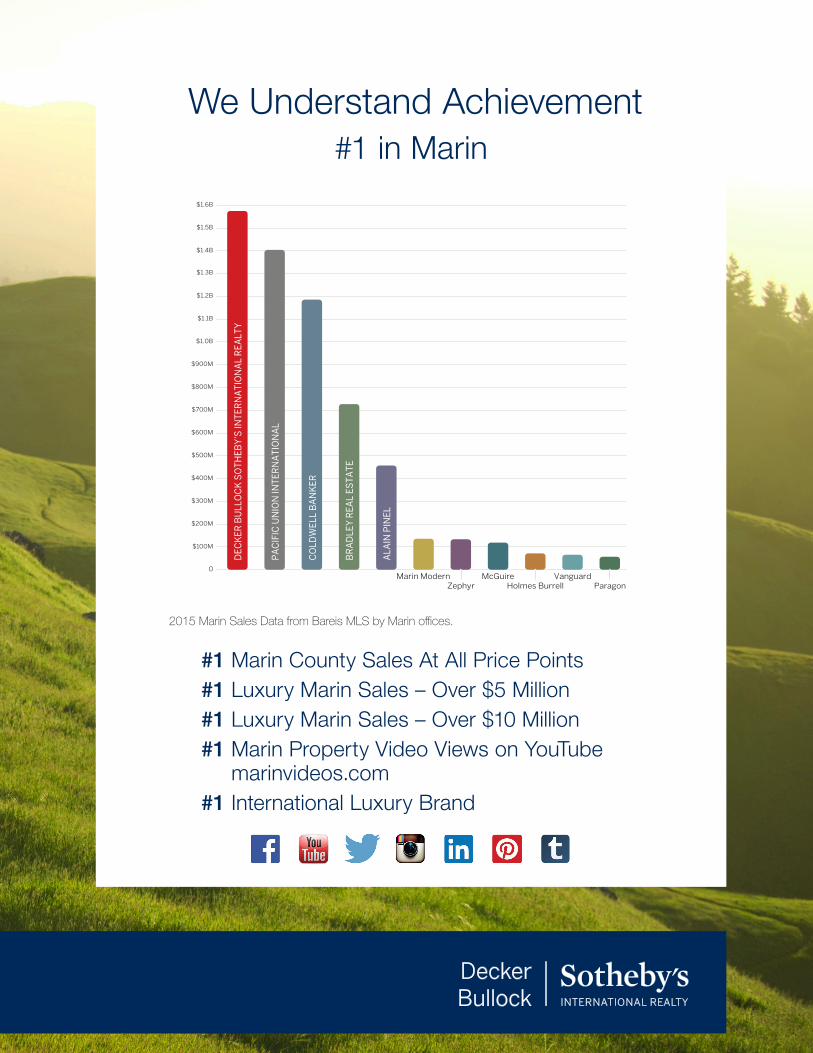
#1 Marin County Sales At All Price Points#1 Luxury Marin Sales – Over $5 Million#1 Luxury Marin Sales – Over $10 Million#1 Marin Property Video Views on YouTube
marinvideos.com#1 International Luxury Brand
We Understand Achievement#1 in Marin
$1.0B
$1.1B
$1.2B
$1.3B
$1.4B
$1.5B
$1.6B
0
$300M
$200M
$100M
$400M
$500M
$600M
$800M
$900M
$700M
DEC
KER
BU
LLO
CK
SO
TH
EBY
’S IN
TER
NA
TIO
NA
L R
EALT
Y
PA
CIF
IC U
NIO
N IN
TER
NA
TIO
NA
L
CO
LDW
ELL
BA
NK
ER
BR
AD
LEY
REA
L ES
TA
TE
ALA
IN P
INEL
McGuireHolmes Burrell
Marin ModernZephyr
VanguardParagon
2015 Marin Sales Data from Bareis MLS by Marin offices.
$250K
6 | Decker Bullock Sotheby’s International Realty
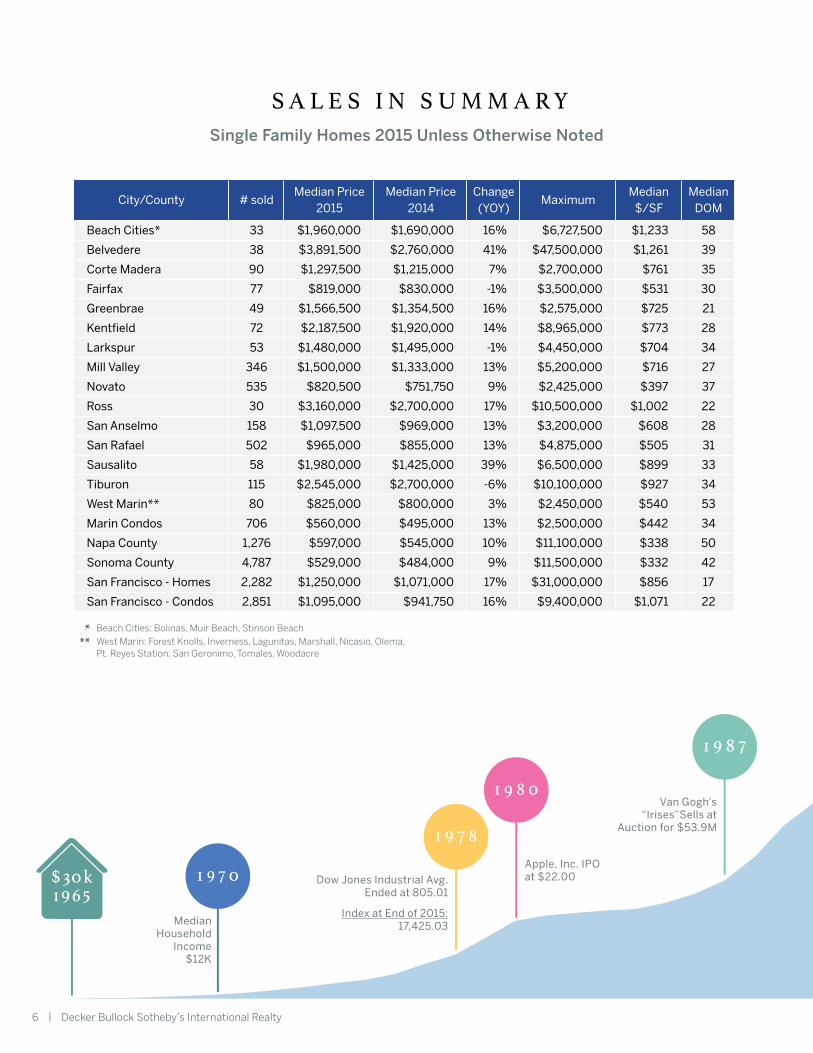
S A L E S I N S U M M A R Y
City / Area # Sold Sq. Ft. Average Maximum Average DOM
2013Average
Changein Average
Beach Cities* 36 1,907 $2,219,406 $8,000,000 104 $1,453,474 53%
Belvedere 41 3,024 $3,329,682 $12,000,000 111 $3,560,581 -7%
Corte Madera 77 1,975 $1,273,546 $3,650,000 45 $1,139,935 12%
Fairfax 84 1,886 $877,312 $1,625,000 48 $724,107 21%
Greenbrae 58 2,250 $1,435,291 $2,750,000 53 $1,343,710 7%
Kentfield 79 2,974 $2,370,263 $12,250,000 58 $2,274,739 4%
Larkspur 83 2,218 $1,654,886 $4,400,000 46 $1,436,086 15%
Mill Valley 338 2,286 $1,628,522 $5,875,000 45 $1,323,582 23%
Novato 519 2,269 $820,406 $5,050,000 55 $736,420 11%
Ross 44 3,407 $3,261,964 $9,300,000 64 $2,807,729 16%
San Anselmo 187 2,206 $1,159,098 $3,625,000 59 $1,058,590 9%
San Rafael 491 2,137 $994,355 $5,950,000 51 $930,583 7%
Sausalito 74 2,238 $1,778,413 $4,900,000 66 $1,670,049 6%
Tiburon 127 3,480 $2,935,882 $8,985,000 100 $2,337,327 26%
West Marin** 79 2,039 $927,073 $2,850,000 87 $841,579 10%
Marin County 2338 2,319 $1,376,407 $12,250,000 59 $1,190,459 16%
Single Family Homes 2015 Unless Otherwise Noted
City/County # soldMedian Price
2015Median Price
2014Change (YOY)
MaximumMedian
$/SF Median
DOM
Beach Cities* 33 $1,960,000 $1,690,000 16% $6,727,500 $1,233 58
Belvedere 38 $3,891,500 $2,760,000 41% $47,500,000 $1,261 39
Corte Madera 90 $1,297,500 $1,215,000 7% $2,700,000 $761 35
Fairfax 77 $819,000 $830,000 -1% $3,500,000 $531 30
Greenbrae 49 $1,566,500 $1,354,500 16% $2,575,000 $725 21
Kentfield 72 $2,187,500 $1,920,000 14% $8,965,000 $773 28
Larkspur 53 $1,480,000 $1,495,000 -1% $4,450,000 $704 34
Mill Valley 346 $1,500,000 $1,333,000 13% $5,200,000 $716 27
Novato 535 $820,500 $751,750 9% $2,425,000 $397 37
Ross 30 $3,160,000 $2,700,000 17% $10,500,000 $1,002 22
San Anselmo 158 $1,097,500 $969,000 13% $3,200,000 $608 28
San Rafael 502 $965,000 $855,000 13% $4,875,000 $505 31
Sausalito 58 $1,980,000 $1,425,000 39% $6,500,000 $899 33
Tiburon 115 $2,545,000 $2,700,000 -6% $10,100,000 $927 34
West Marin** 80 $825,000 $800,000 3% $2,450,000 $540 53
Marin Condos 706 $560,000 $495,000 13% $2,500,000 $442 34
Napa County 1,276 $597,000 $545,000 10% $11,100,000 $338 50
Sonoma County 4,787 $529,000 $484,000 9% $11,500,000 $332 42
San Francisco - Homes 2,282 $1,250,000 $1,071,000 17% $31,000,000 $856 17
San Francisco - Condos 2,851 $1,095,000 $941,750 16% $9,400,000 $1,071 22
Van Gogh’s “Irises”Sells at
Auction for $53.9M
Apple, Inc. IPOat $22.00Dow Jones Industrial Avg.
Ended at 805.01
Index at End of 2015: 17,425.03
Beach Cities: Bolinas, Muir Beach, Stinson Beach*** West Marin: Forest Knolls, Inverness, Lagunitas, Marshall, Nicasio, Olema,
Pt. Reyes Station, San Geronimo, Tomales, Woodacre
$250K
1 9 8 7
1 9 8 0
1 9 7 8
1 9 7 0
Median Household
Income $12K
Single Family Home & Condominium Average Sale Price
$30k1965
Data provided by BAREIS MLS
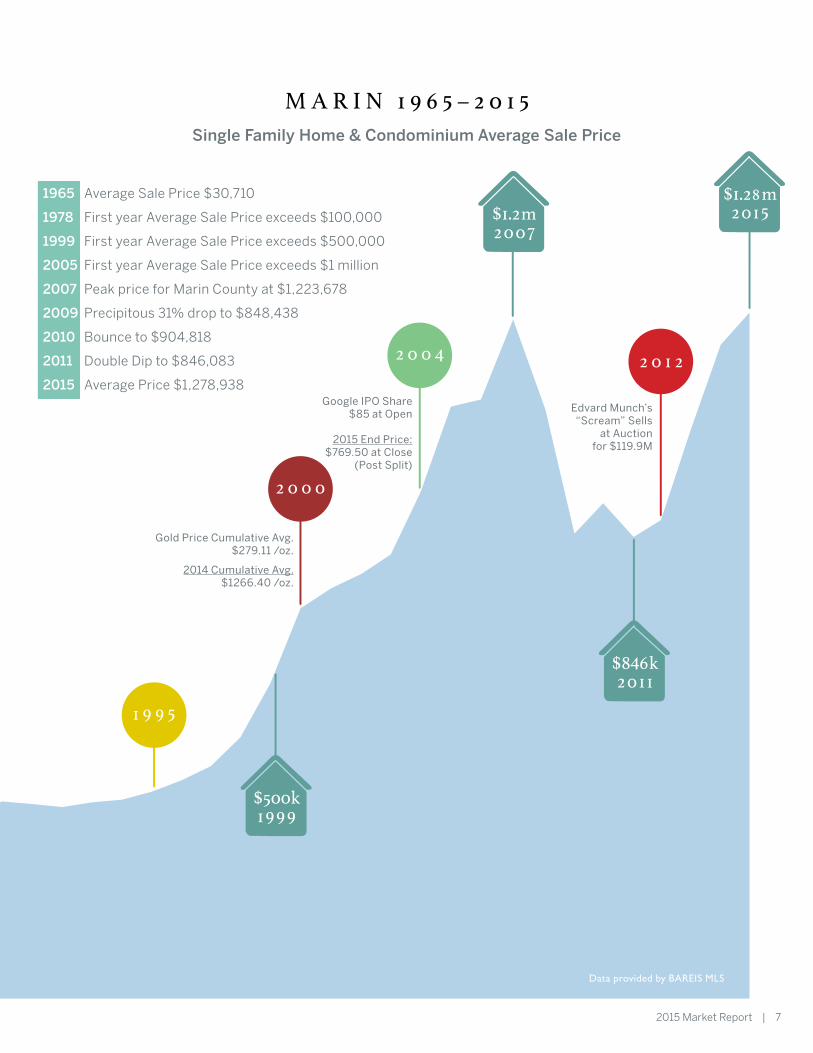
Single Family Home & Condominium Average Sale Price
M A R I N 1 9 6 5 – 2 0 1 5
2015 Market Report | 7
1965 Average Sale Price $30,710
1978 First year Average Sale Price exceeds $100,000
1999 First year Average Sale Price exceeds $500,000
2005 First year Average Sale Price exceeds $1 million
2007 Peak price for Marin County at $1,223,678
2009 Precipitous 31% drop to $848,438
2010 Bounce to $904,818
2011 Double Dip to $846,083
2015 Average Price $1,278,938Google IPO Share
$85 at Open
2015 End Price: $769.50 at Close
(Post Split)
Gold Price Cumulative Avg. $279.11 /oz.
2014 Cumulative Avg.$1266.40 /oz.
1 9 9 5
Edvard Munch’s “Scream” Sells
at Auction for $119.9M
2 0 0 0
2 0 0 4
$1.28m2015$1.2m
2007
$846k2011
$500k1999
2 0 1 2
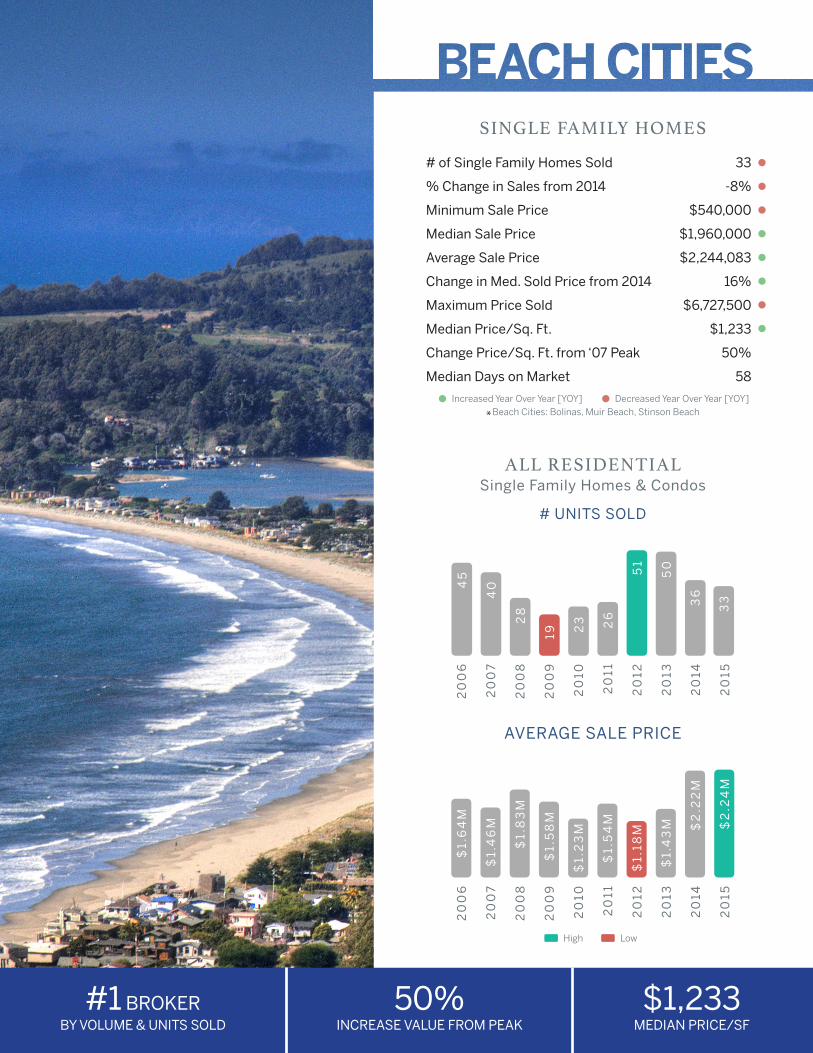
# of Single Family Homes Sold 33
% Change in Sales from 2014 -8%
Minimum Sale Price $540,000
Median Sale Price $1,960,000
Average Sale Price $2,244,083
Change in Med. Sold Price from 2014 16%
Maximum Price Sold $6,727,500
Median Price/Sq. Ft. $1,233
Change Price/Sq. Ft. from ‘07 Peak 50%
Median Days on Market 58
Increased Year Over Year [YOY] Decreased Year Over Year [YOY]
SINGLE FAMILY HOMES
20
06
20
07
20
08
20
09
20
10
20
11
20
12
20
13
20
14
20
15
High Low
# UNITS SOLD
ALL RESIDENTIAL Single Family Homes & Condos
AVERAGE SALE PRICE
20
06
20
07
20
08
20
09
20
10
20
11
20
12
20
13
20
14
20
15
$1.
64
M
$1.
46
M
$1.
83
M
$1.
58
M
$1.
54
M
$1.
23
M
$1.
18M $
2.2
2M
$1.
43
M $2
.24
M
$1,233MEDIAN PRICE/SF
50%INCREASE VALUE FROM PEAK
#1 BROKERBY VOLUME & UNITS SOLD
33
45
40
28
19 23 26
51
50
36
Beach Cities: Bolinas, Muir Beach, Stinson Beach*
39
31
31
23
23
32 33 3
6
31
43
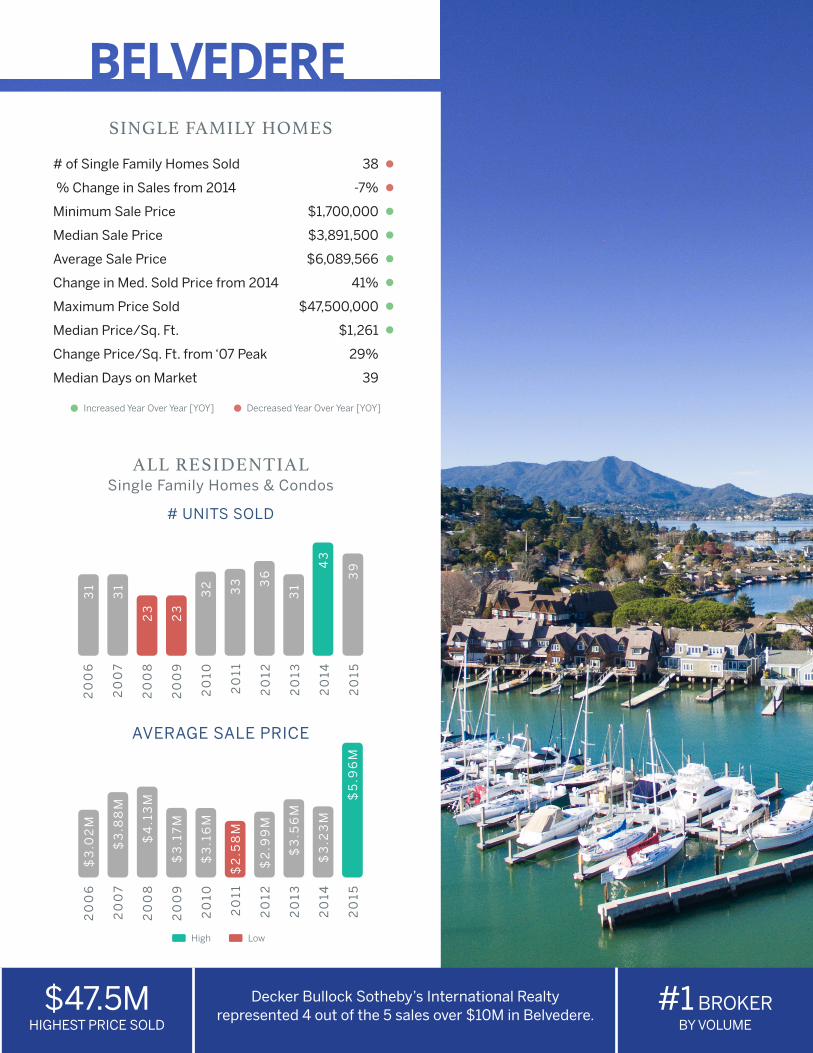
# of Single Family Homes Sold 38
% Change in Sales from 2014 -7%
Minimum Sale Price $1,700,000
Median Sale Price $3,891,500
Average Sale Price $6,089,566
Change in Med. Sold Price from 2014 41%
Maximum Price Sold $47,500,000
Median Price/Sq. Ft. $1,261
Change Price/Sq. Ft. from ‘07 Peak 29%
Median Days on Market 39
Increased Year Over Year [YOY] Decreased Year Over Year [YOY]
$3
.02
M
$3
.88
M
$4
.13
M
$3
.17
M
$3
.16
M
$2
.58
M
$3
.23
M
$2
.99
M
$3
.56
M
$5
.96
M
SINGLE FAMILY HOMES
20
06
20
07
20
08
20
09
20
10
20
11
20
12
20
13
20
14
20
15
High Low
# UNITS SOLD
ALL RESIDENTIAL Single Family Homes & Condos
AVERAGE SALE PRICE
20
06
20
07
20
08
20
09
20
10
20
11
20
12
20
13
20
14
20
15
$47.5MHIGHEST PRICE SOLD
#1 BROKERBY VOLUME
Decker Bullock Sotheby’s International Realty represented 4 out of the 5 sales over $10M in Belvedere.
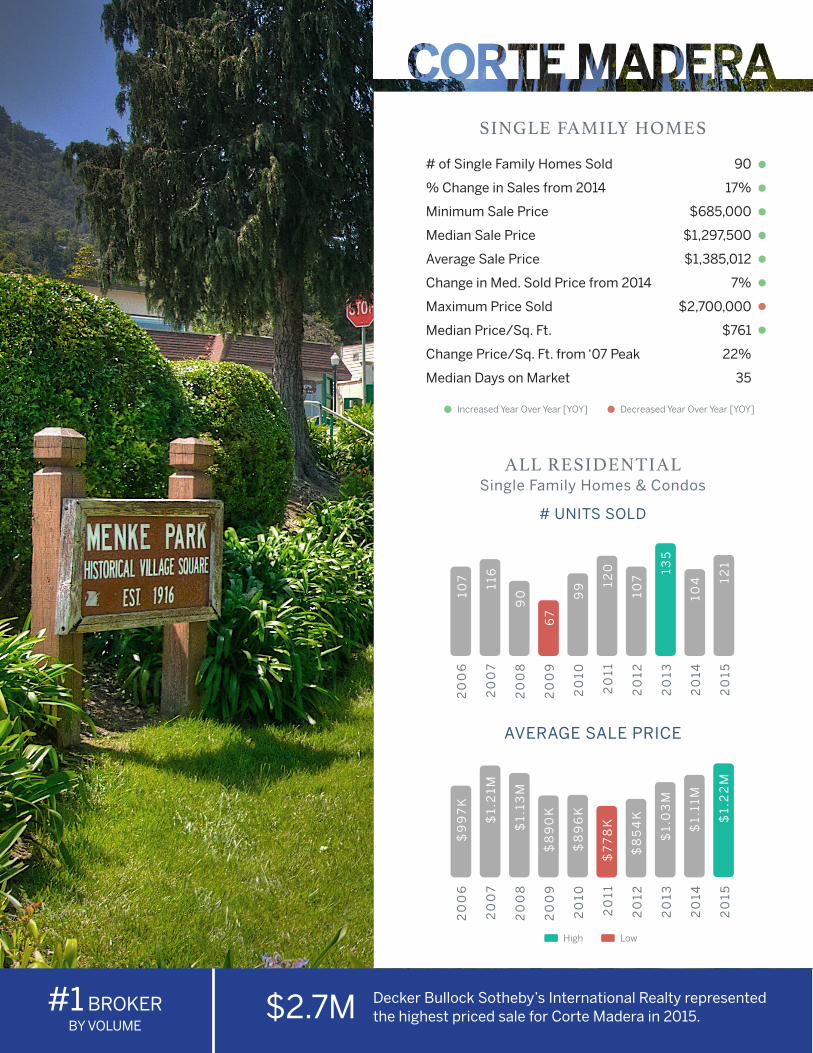
# of Single Family Homes Sold 90
% Change in Sales from 2014 17%
Minimum Sale Price $685,000
Median Sale Price $1,297,500
Average Sale Price $1,385,012
Change in Med. Sold Price from 2014 7%
Maximum Price Sold $2,700,000
Median Price/Sq. Ft. $761
Change Price/Sq. Ft. from ‘07 Peak 22%
Median Days on Market 35
Increased Year Over Year [YOY] Decreased Year Over Year [YOY]
SINGLE FAMILY HOMES
20
06
20
07
20
08
20
09
20
10
20
11
20
12
20
13
20
14
20
15
High Low
# UNITS SOLD
ALL RESIDENTIAL Single Family Homes & Condos
AVERAGE SALE PRICE
20
06
20
07
20
08
20
09
20
10
20
11
20
12
20
13
20
14
20
15$
1.2
2M
$9
97
K
$1.
21M
$1.
13M
$8
90
K
$8
96
K
$7
78
K $1.
11M
$8
54
K
$1.
03
M
107
116
90
67
99 12
0
107
135
104 12
1
#1 BROKERBY VOLUME
$2.7M Decker Bullock Sotheby’s International Realty represented the highest priced sale for Corte Madera in 2015.
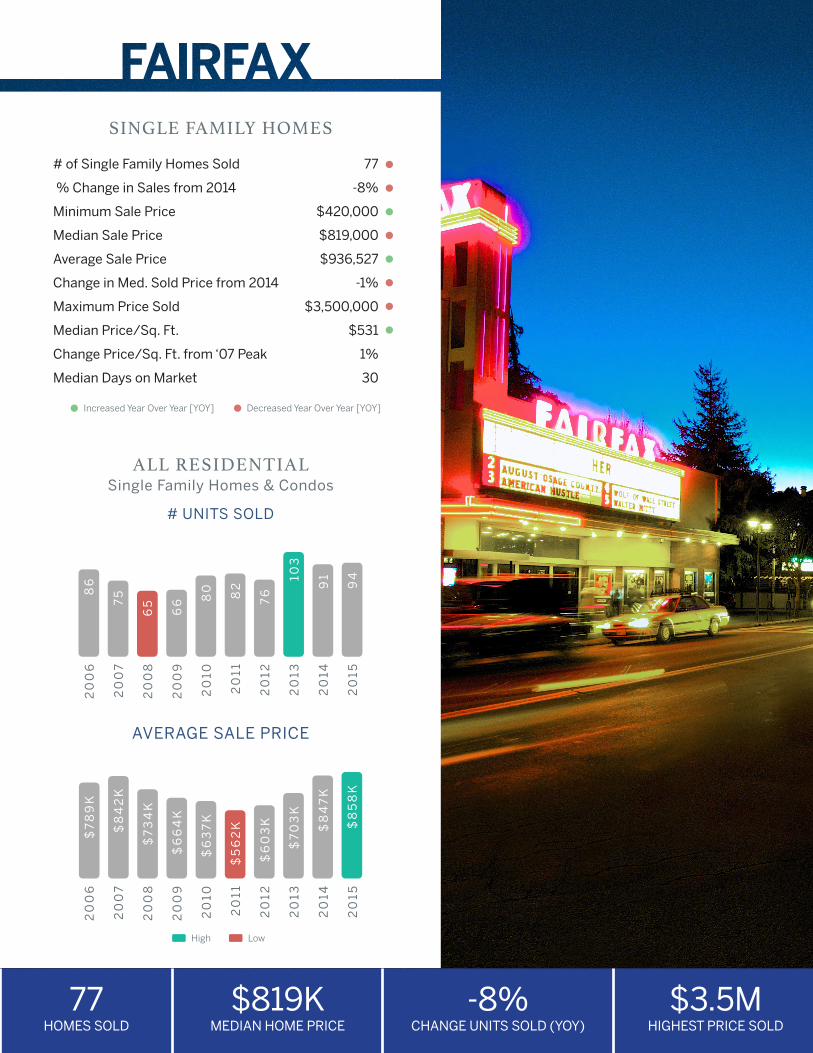
# of Single Family Homes Sold 77
% Change in Sales from 2014 -8%
Minimum Sale Price $420,000
Median Sale Price $819,000
Average Sale Price $936,527
Change in Med. Sold Price from 2014 -1%
Maximum Price Sold $3,500,000
Median Price/Sq. Ft. $531
Change Price/Sq. Ft. from ‘07 Peak 1%
Median Days on Market 30
Increased Year Over Year [YOY] Decreased Year Over Year [YOY]
SINGLE FAMILY HOMES
20
06
20
07
20
08
20
09
20
10
20
11
20
12
20
13
20
14
20
15
High Low
# UNITS SOLD
ALL RESIDENTIAL Single Family Homes & Condos
AVERAGE SALE PRICE
20
06
20
07
20
08
20
09
20
10
20
11
20
12
20
13
20
14
20
15
$7
89
K
$8
58
K
$8
42
K
$7
34
K
$6
64
K
$6
37
K
$5
62
K $8
47
K
$6
03
K
$7
03
K
86
75
65
66 8
0 82
76
103
91
94
$819KMEDIAN HOME PRICE
-8%CHANGE UNITS SOLD (YOY)
77HOMES SOLD
$3.5MHIGHEST PRICE SOLD
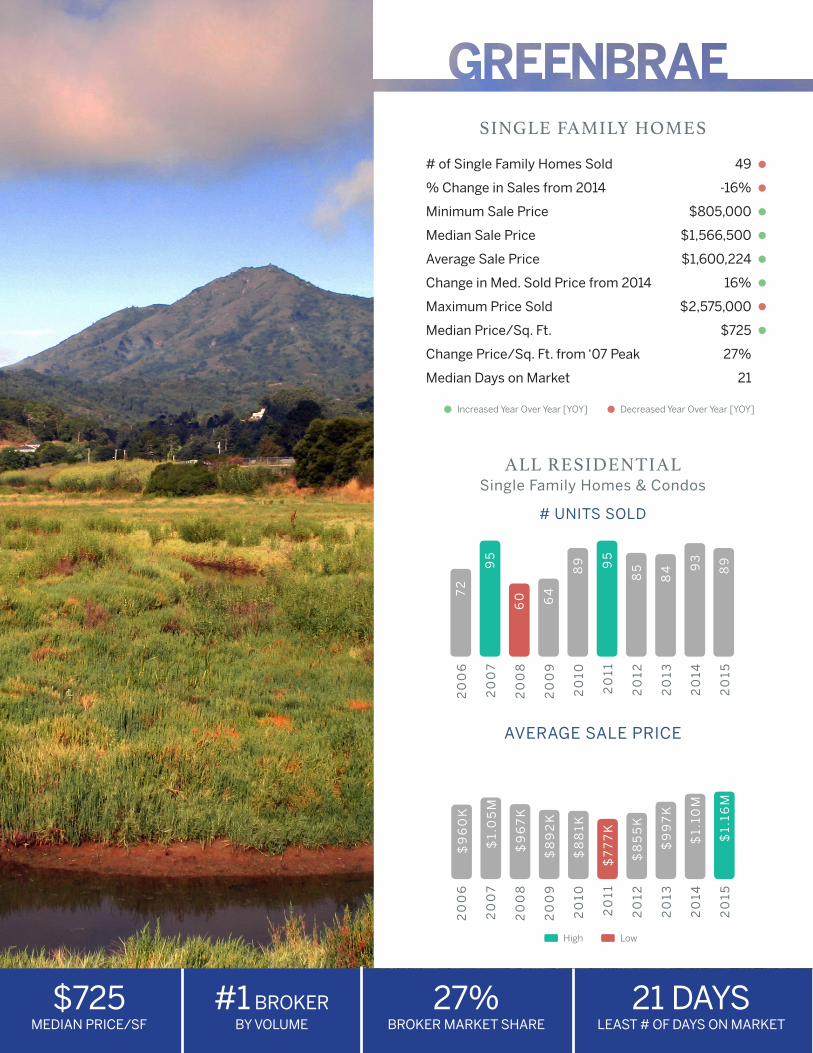
# of Single Family Homes Sold 49
% Change in Sales from 2014 -16%
Minimum Sale Price $805,000
Median Sale Price $1,566,500
Average Sale Price $1,600,224
Change in Med. Sold Price from 2014 16%
Maximum Price Sold $2,575,000
Median Price/Sq. Ft. $725
Change Price/Sq. Ft. from ‘07 Peak 27%
Median Days on Market 21
Increased Year Over Year [YOY] Decreased Year Over Year [YOY]
20
06
20
07
20
08
20
09
20
10
20
11
20
12
20
13
20
14
20
15
High Low
# UNITS SOLD
ALL RESIDENTIAL Single Family Homes & Condos
AVERAGE SALE PRICE
SINGLE FAMILY HOMES
20
06
20
07
20
08
20
09
20
10
20
11
20
12
20
13
20
14
20
15$
1.16
M
$9
60
K
$1.
05
M
$9
67
K
$8
92
K
$8
81K
$7
77
K
$1.
10M
$8
55
K
$9
97
K
72
95
60 64
89 9
5
85
84 9
3
89
$725MEDIAN PRICE/SF
21 DAYSLEAST # OF DAYS ON MARKET
27%BROKER MARKET SHARE
#1 BROKERBY VOLUME
2
00
6
20
07
20
08
20
09
20
10
20
11
20
12
20
13
20
14
20
15
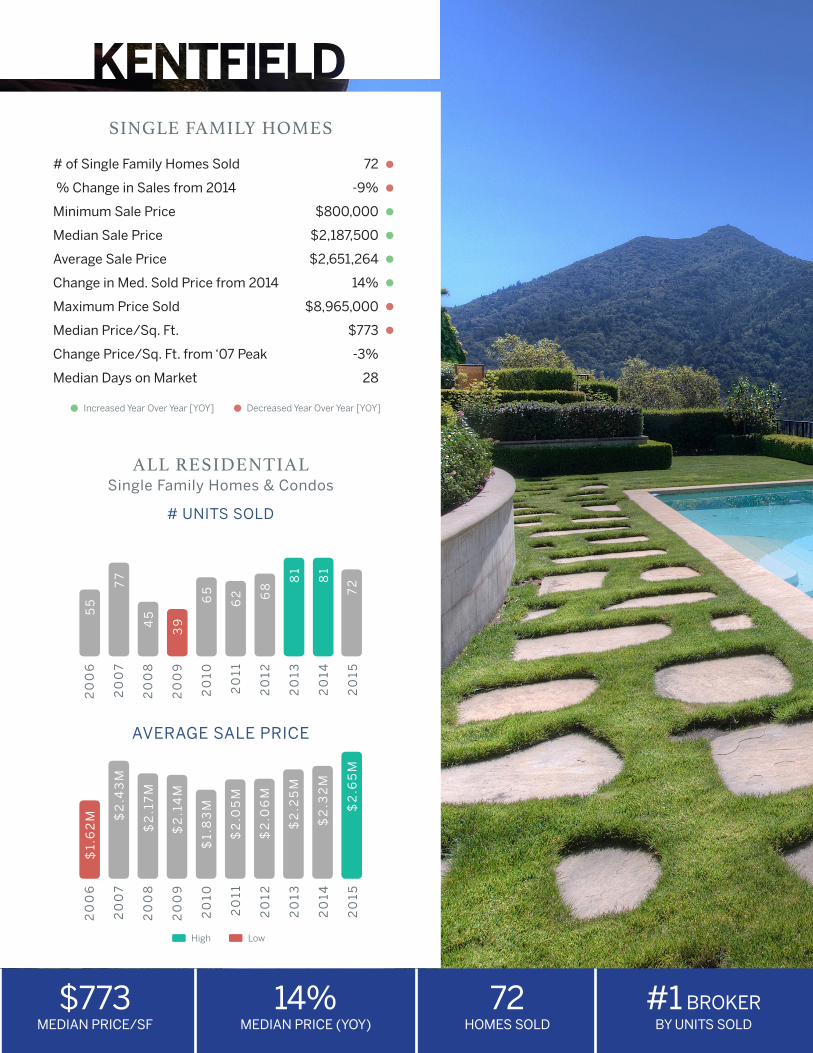
# of Single Family Homes Sold 72
% Change in Sales from 2014 -9%
Minimum Sale Price $800,000
Median Sale Price $2,187,500
Average Sale Price $2,651,264
Change in Med. Sold Price from 2014 14%
Maximum Price Sold $8,965,000
Median Price/Sq. Ft. $773
Change Price/Sq. Ft. from ‘07 Peak -3%
Median Days on Market 28
Increased Year Over Year [YOY] Decreased Year Over Year [YOY]
High Low
# UNITS SOLD
ALL RESIDENTIAL Single Family Homes & Condos
AVERAGE SALE PRICE
SINGLE FAMILY HOMES
20
06
20
07
20
08
20
09
20
10
20
11
20
12
20
13
20
14
20
157
2
55
77
45
39
65
62 6
8
81
81
$1.
62
M
$2
.65
M
$2
.43
M
$2
.17
M
$2
.14
M
$1.
83
M
$2
.05
M
$2
.32
M
$2
.06
M
$2
.25
M
$773MEDIAN PRICE/SF
14%MEDIAN PRICE (YOY)
#1 BROKERBY UNITS SOLD
72HOMES SOLD
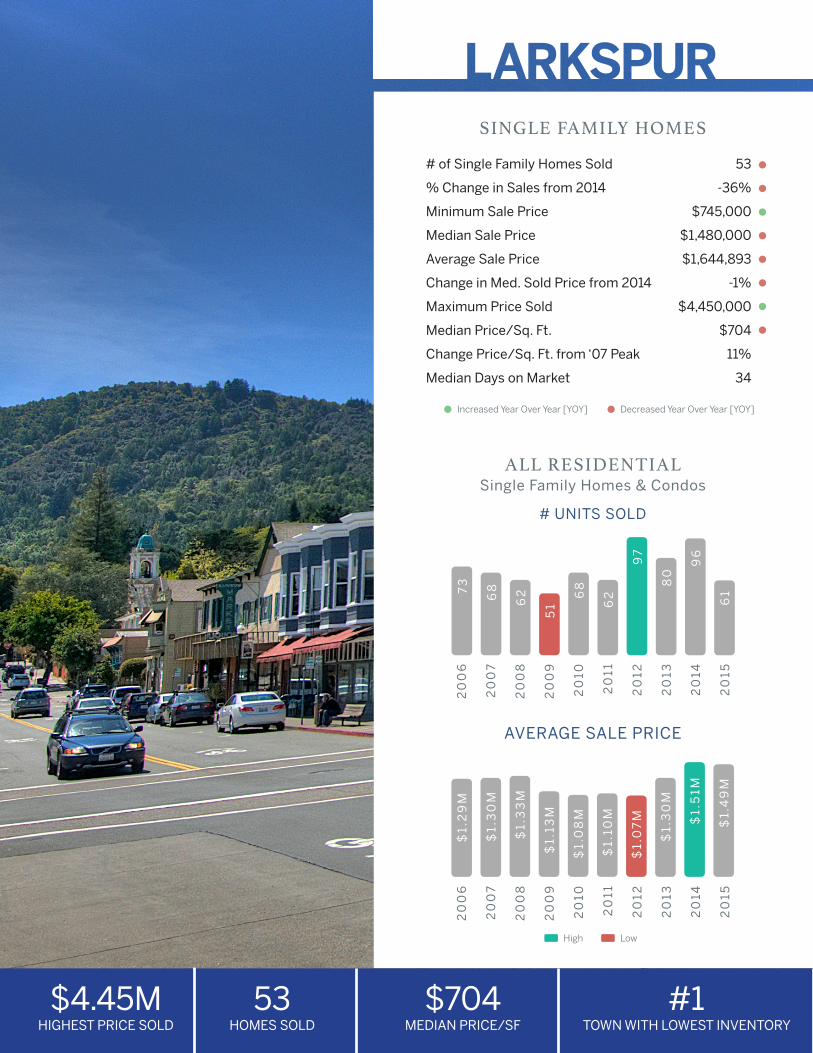
# of Single Family Homes Sold 53
% Change in Sales from 2014 -36%
Minimum Sale Price $745,000
Median Sale Price $1,480,000
Average Sale Price $1,644,893
Change in Med. Sold Price from 2014 -1%
Maximum Price Sold $4,450,000
Median Price/Sq. Ft. $704
Change Price/Sq. Ft. from ‘07 Peak 11%
Median Days on Market 34
Increased Year Over Year [YOY] Decreased Year Over Year [YOY]
SINGLE FAMILY HOMES
20
06
20
07
20
08
20
09
20
10
20
11
20
12
20
13
20
14
20
15
High Low
# UNITS SOLD
ALL RESIDENTIAL Single Family Homes & Condos
AVERAGE SALE PRICE
20
06
20
07
20
08
20
09
20
10
20
11
20
12
20
13
20
14
20
15$
1.4
9M
$1.
29
M
$1.
30
M
$1.
33
M
$1.
13M
$1.
08
M
$1.
10M $1.
51M
$1.
07
M
$1.
30
M
73
68
62
51
68
62
97
80
96
61
$4.45MHIGHEST PRICE SOLD
$704MEDIAN PRICE/SF
#1TOWN WITH LOWEST INVENTORY
53HOMES SOLD
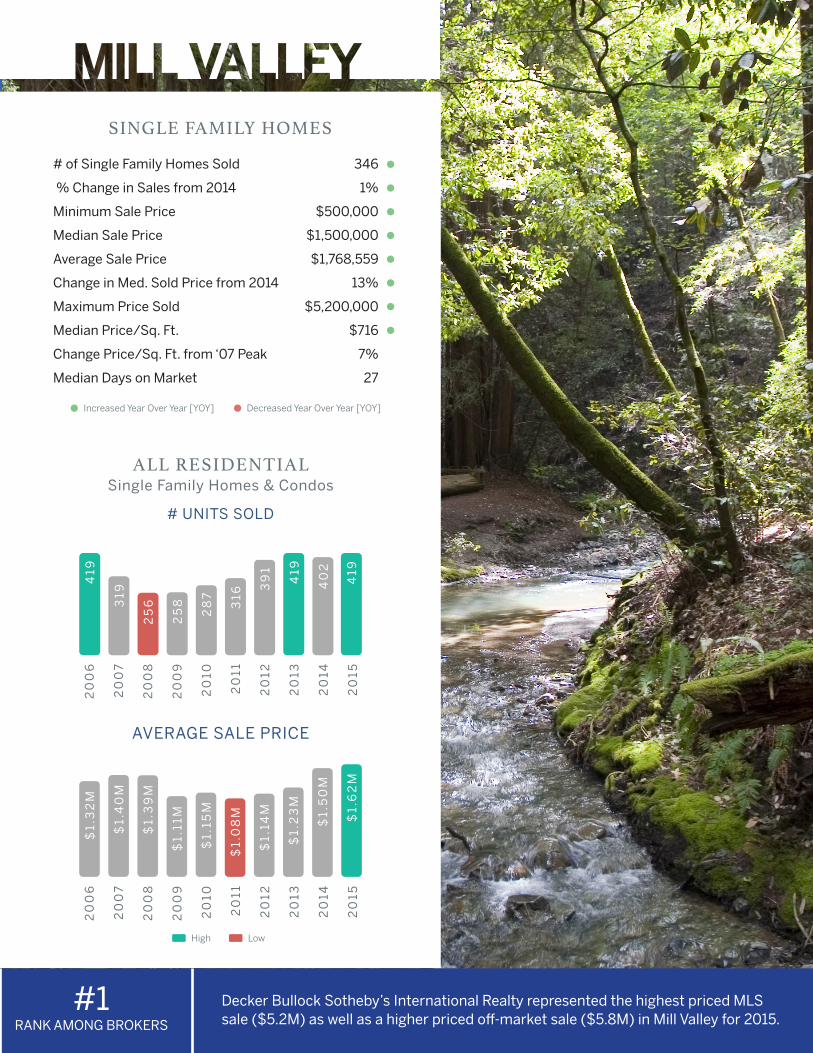
# of Single Family Homes Sold 346
% Change in Sales from 2014 1%
Minimum Sale Price $500,000
Median Sale Price $1,500,000
Average Sale Price $1,768,559
Change in Med. Sold Price from 2014 13%
Maximum Price Sold $5,200,000
Median Price/Sq. Ft. $716
Change Price/Sq. Ft. from ‘07 Peak 7%
Median Days on Market 27
Increased Year Over Year [YOY] Decreased Year Over Year [YOY]
SINGLE FAMILY HOMES
20
06
20
07
20
08
20
09
20
10
20
11
20
12
20
13
20
14
20
15
High Low
# UNITS SOLD
ALL RESIDENTIAL Single Family Homes & Condos
AVERAGE SALE PRICE
20
06
20
07
20
08
20
09
20
10
20
11
20
12
20
13
20
14
20
15
$1.
32
M
$1.
40
M
$1.
39
M
$1.
11M
$1.
15M
$1.
08
M
$1.
50
M
$1.
14M
$1.
23
M
$1.
62
M
419
319
25
6
25
8
28
7
316
39
1
419
40
2
#1RANK AMONG BROKERS
419
Decker Bullock Sotheby’s International Realty represented the highest priced MLS sale ($5.2M) as well as a higher priced off-market sale ($5.8M) in Mill Valley for 2015.
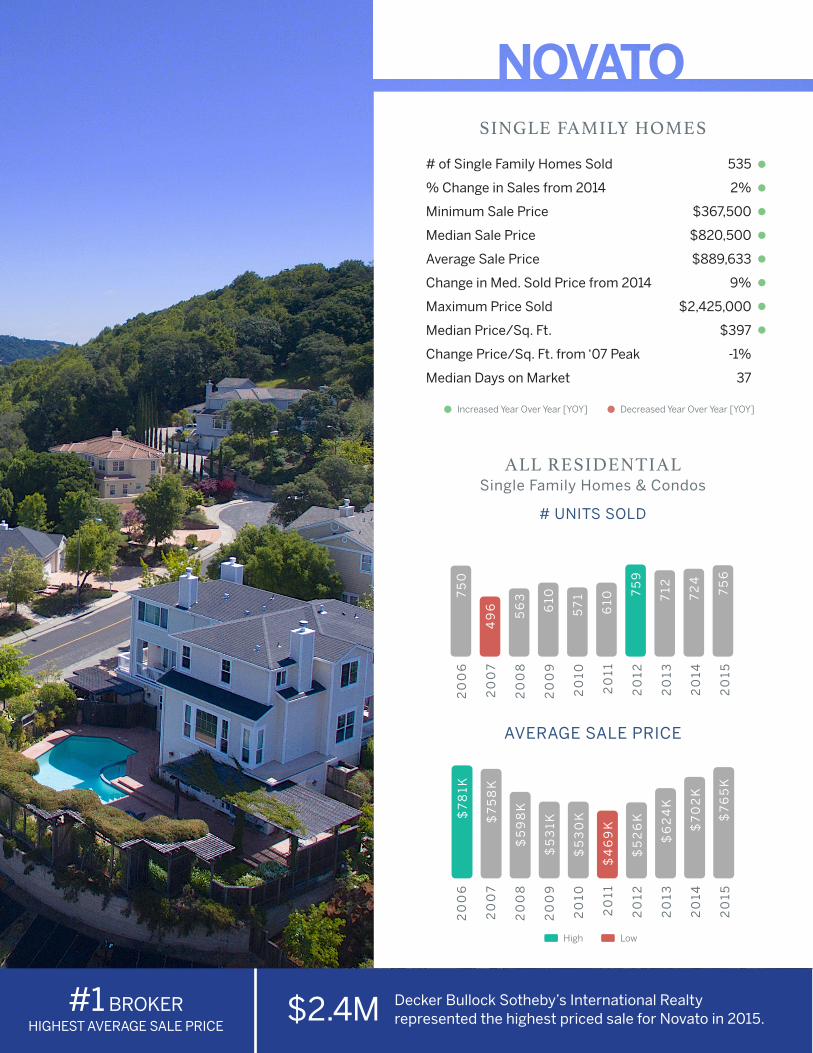
# of Single Family Homes Sold 535
% Change in Sales from 2014 2%
Minimum Sale Price $367,500
Median Sale Price $820,500
Average Sale Price $889,633
Change in Med. Sold Price from 2014 9%
Maximum Price Sold $2,425,000
Median Price/Sq. Ft. $397
Change Price/Sq. Ft. from ‘07 Peak -1%
Median Days on Market 37
Increased Year Over Year [YOY] Decreased Year Over Year [YOY]
SINGLE FAMILY HOMES
20
06
20
07
20
08
20
09
20
10
20
11
20
12
20
13
20
14
20
15
High Low
# UNITS SOLD
ALL RESIDENTIAL Single Family Homes & Condos
AVERAGE SALE PRICE
20
06
20
07
20
08
20
09
20
10
20
11
20
12
20
13
20
14
20
15$
76
5K
$7
81K
$7
58
K
$5
98
K
$5
31K
$5
30
K
$4
69
K $7
02
K
$5
26
K
$6
24
K
75
0
49
6
56
3
610
57
1
610
75
9
712
72
4
75
6
$2.4M#1 BROKERHIGHEST AVERAGE SALE PRICE
Decker Bullock Sotheby’s International Realty represented the highest priced sale for Novato in 2015.
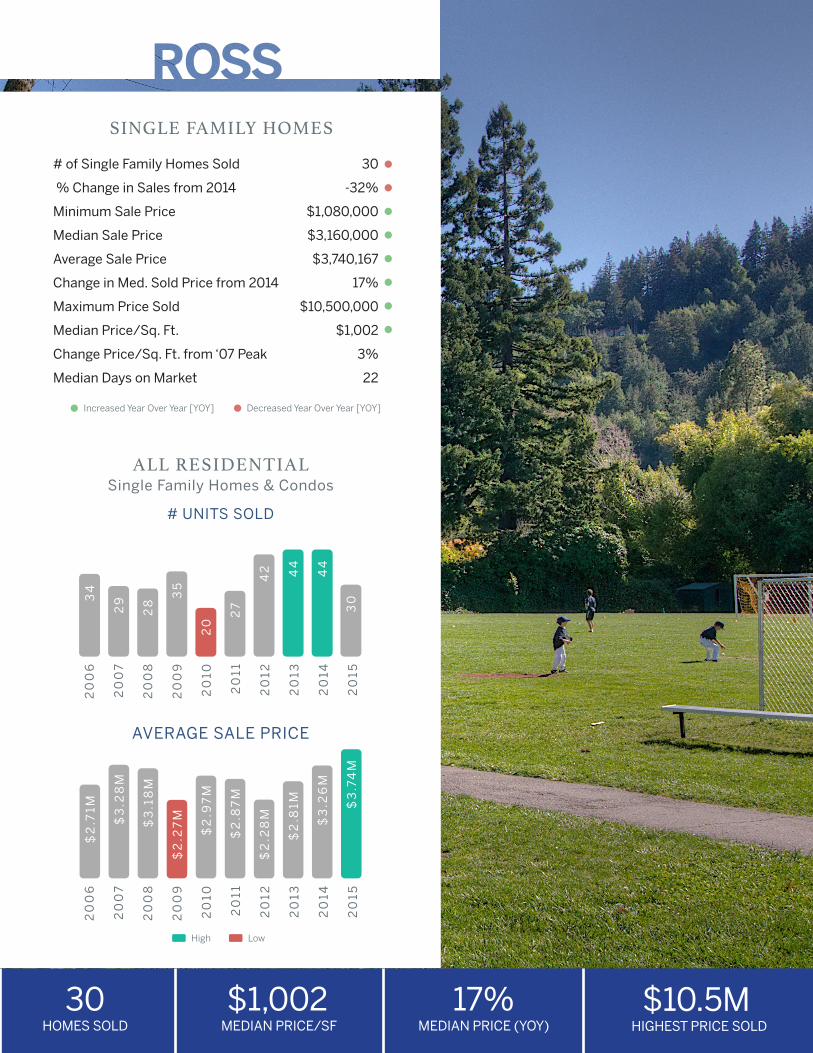
# of Single Family Homes Sold 30
% Change in Sales from 2014 -32%
Minimum Sale Price $1,080,000
Median Sale Price $3,160,000
Average Sale Price $3,740,167
Change in Med. Sold Price from 2014 17%
Maximum Price Sold $10,500,000
Median Price/Sq. Ft. $1,002
Change Price/Sq. Ft. from ‘07 Peak 3%
Median Days on Market 22
Increased Year Over Year [YOY] Decreased Year Over Year [YOY]
SINGLE FAMILY HOMES
20
06
20
07
20
08
20
09
20
10
20
11
20
12
20
13
20
14
20
15
High Low
# UNITS SOLD
ALL RESIDENTIAL Single Family Homes & Condos
AVERAGE SALE PRICE
20
06
20
07
20
08
20
09
20
10
20
11
20
12
20
13
20
14
20
15
$2
.71M $
3.7
4M
$3
.28
M
$3
.18
M
$2
.27
M
$2
.97
M
$2
.87
M
$3
.26
M
$2
.28
M
$2
.81M
34
29
28
35
20
27
42 44
44
30
$1,002 MEDIAN PRICE/SF
30HOMES SOLD
17%MEDIAN PRICE (YOY)
$10.5M HIGHEST PRICE SOLD
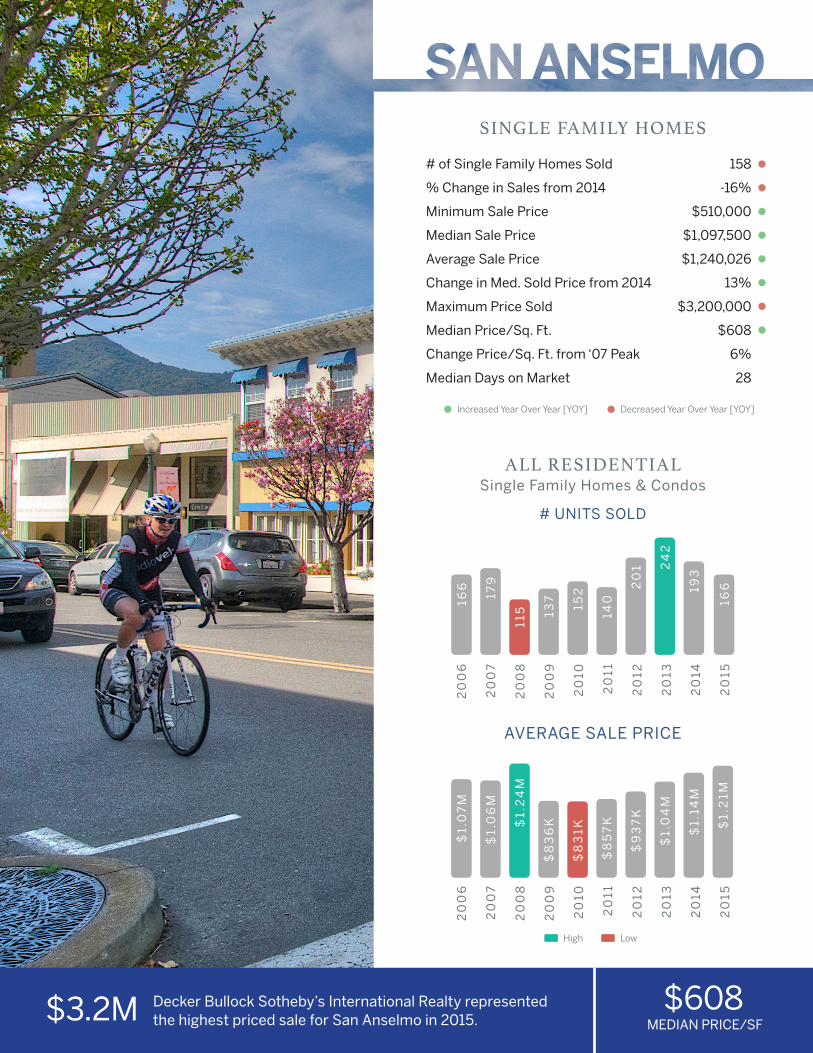
# of Single Family Homes Sold 158
% Change in Sales from 2014 -16%
Minimum Sale Price $510,000
Median Sale Price $1,097,500
Average Sale Price $1,240,026
Change in Med. Sold Price from 2014 13%
Maximum Price Sold $3,200,000
Median Price/Sq. Ft. $608
Change Price/Sq. Ft. from ‘07 Peak 6%
Median Days on Market 28
Increased Year Over Year [YOY] Decreased Year Over Year [YOY]
SINGLE FAMILY HOMES
20
06
20
07
20
08
20
09
20
10
20
11
20
12
20
13
20
14
20
15
High Low
# UNITS SOLD
ALL RESIDENTIAL Single Family Homes & Condos
AVERAGE SALE PRICE
20
06
20
07
20
08
20
09
20
10
20
11
20
12
20
13
20
14
20
15
166
179
115 13
7
152
140
20
1 24
2
193
$1.
07
M
$1.
06
M
$1.
24
M
$8
36
K
$8
31K
$8
57
K
$1.
14M
$9
37
K
$1.
04
M
$1.
21M
166
$3.2M Decker Bullock Sotheby’s International Realty represented the highest priced sale for San Anselmo in 2015.
$608 MEDIAN PRICE/SF
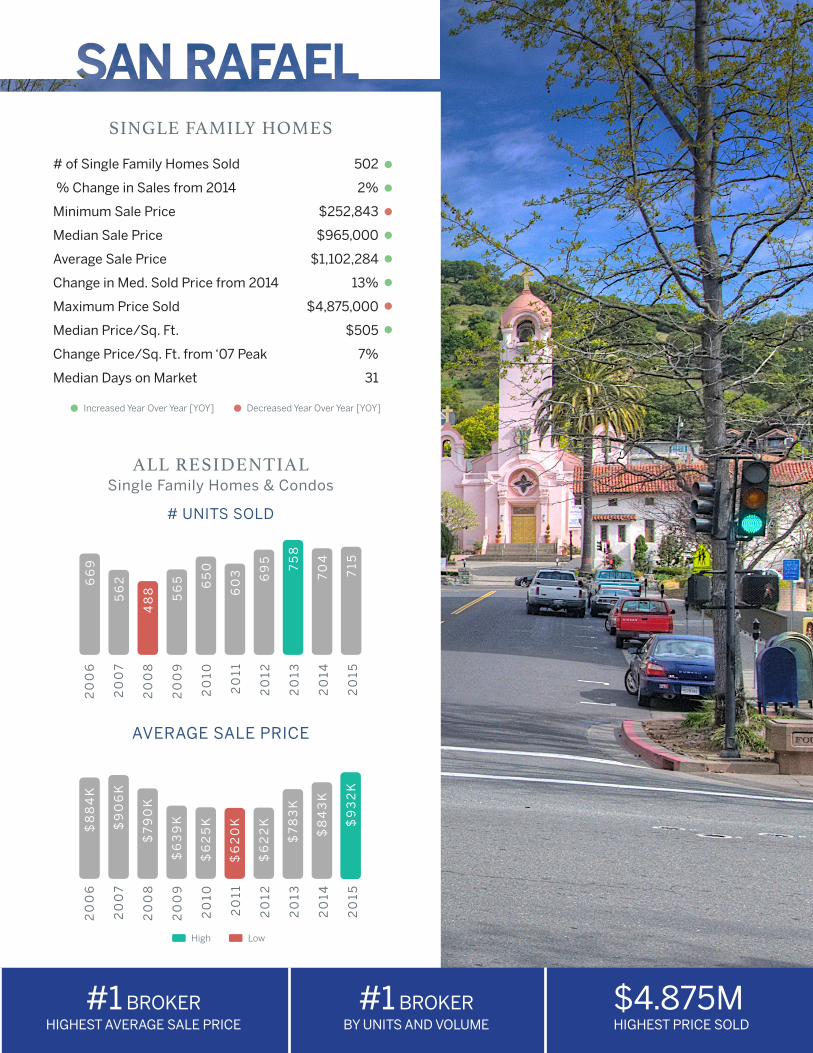
# of Single Family Homes Sold 502
% Change in Sales from 2014 2%
Minimum Sale Price $252,843
Median Sale Price $965,000
Average Sale Price $1,102,284
Change in Med. Sold Price from 2014 13%
Maximum Price Sold $4,875,000
Median Price/Sq. Ft. $505
Change Price/Sq. Ft. from ‘07 Peak 7%
Median Days on Market 31
Increased Year Over Year [YOY] Decreased Year Over Year [YOY]
SINGLE FAMILY HOMES
20
06
20
07
20
08
20
09
20
10
20
11
20
12
20
13
20
14
20
15
High Low
# UNITS SOLD
ALL RESIDENTIAL Single Family Homes & Condos
AVERAGE SALE PRICE
20
06
20
07
20
08
20
09
20
10
20
11
20
12
20
13
20
14
20
15
66
9
56
2
48
8 56
5 65
0
60
3 69
5
75
8
70
4
715
$8
84
K
$9
06
K
$7
90
K
$6
39
K
$6
25
K
$6
20
K
$8
43
K
$6
22
K
$7
83
K
$9
32
K
#1 BROKERHIGHEST AVERAGE SALE PRICE
#1 BROKERBY UNITS AND VOLUME
$4.875M HIGHEST PRICE SOLD
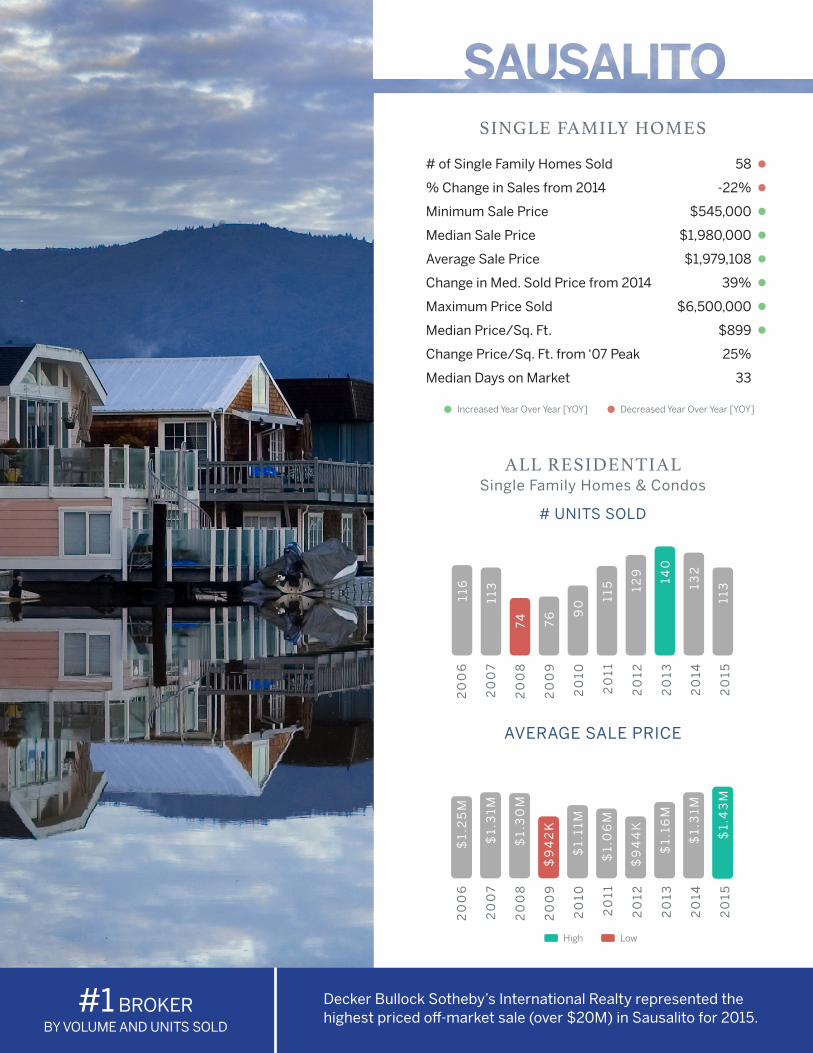
# of Single Family Homes Sold 58
% Change in Sales from 2014 -22%
Minimum Sale Price $545,000
Median Sale Price $1,980,000
Average Sale Price $1,979,108
Change in Med. Sold Price from 2014 39%
Maximum Price Sold $6,500,000
Median Price/Sq. Ft. $899
Change Price/Sq. Ft. from ‘07 Peak 25%
Median Days on Market 33
Increased Year Over Year [YOY] Decreased Year Over Year [YOY]
SINGLE FAMILY HOMES
20
06
20
07
20
08
20
09
20
10
20
11
20
12
20
13
20
14
20
15
High Low
# UNITS SOLD
ALL RESIDENTIAL Single Family Homes & Condos
AVERAGE SALE PRICE
20
06
20
07
20
08
20
09
20
10
20
11
20
12
20
13
20
14
20
15$
1.4
3M
$1.
25
M
$1.
31M
$1.
30
M
$9
42
K
$1.
11M
$1.
06
M
$1.
31M
$9
44
K
$1.
16M
116
113
74 76 9
0 115 12
9
140
132
113
#1 BROKERBY VOLUME AND UNITS SOLD
Decker Bullock Sotheby’s International Realty represented the highest priced off-market sale (over $20M) in Sausalito for 2015.
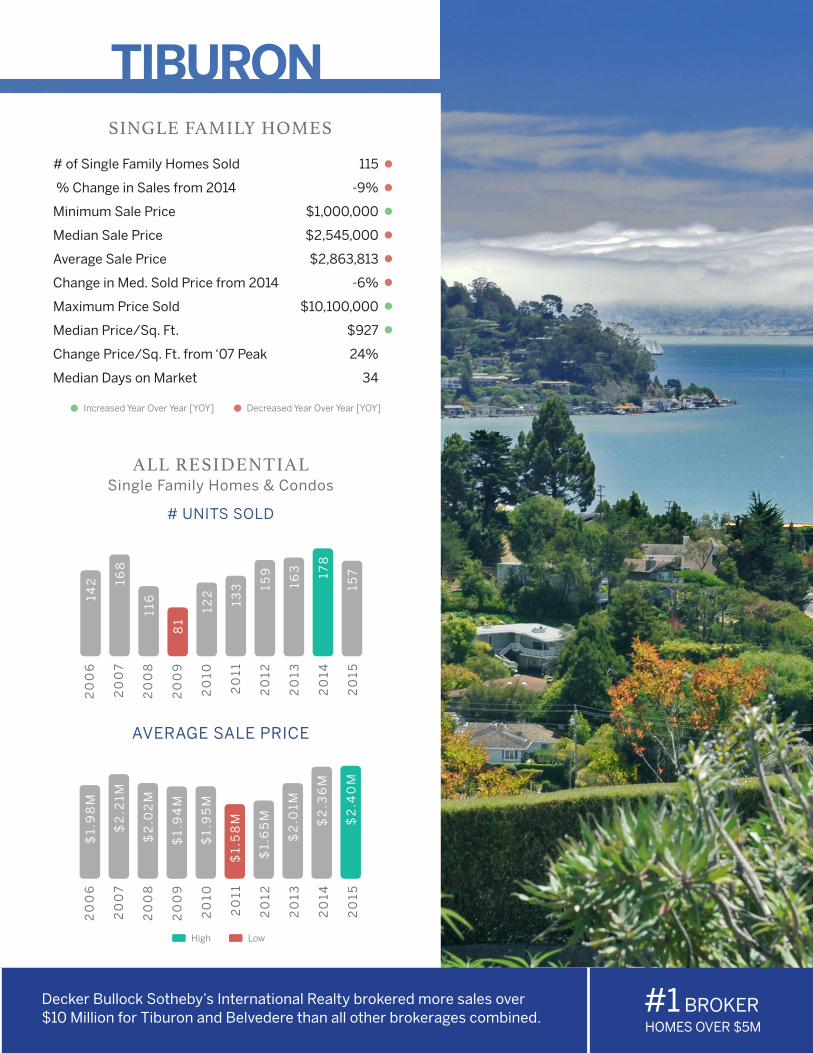
# of Single Family Homes Sold 115
% Change in Sales from 2014 -9%
Minimum Sale Price $1,000,000
Median Sale Price $2,545,000
Average Sale Price $2,863,813
Change in Med. Sold Price from 2014 -6%
Maximum Price Sold $10,100,000
Median Price/Sq. Ft. $927
Change Price/Sq. Ft. from ‘07 Peak 24%
Median Days on Market 34
Increased Year Over Year [YOY] Decreased Year Over Year [YOY]
SINGLE FAMILY HOMES
20
06
20
07
20
08
20
09
20
10
20
11
20
12
20
13
20
14
20
15
High Low
# UNITS SOLD
ALL RESIDENTIAL Single Family Homes & Condos
AVERAGE SALE PRICE
20
06
20
07
20
08
20
09
20
10
20
11
20
12
20
13
20
14
20
15
142 16
8
116
81
122
133 15
9
163 17
8
157
$1.
98
M
$2
.21M
$2
.02
M
$1.
94
M
$1.
95
M
$1.
58
M $2
.36
M
$1.
65
M
$2
.01M
$2
.40
M
Decker Bullock Sotheby’s International Realty brokered more sales over $10 Million for Tiburon and Belvedere than all other brokerages combined.
#1 BROKER HOMES OVER $5M
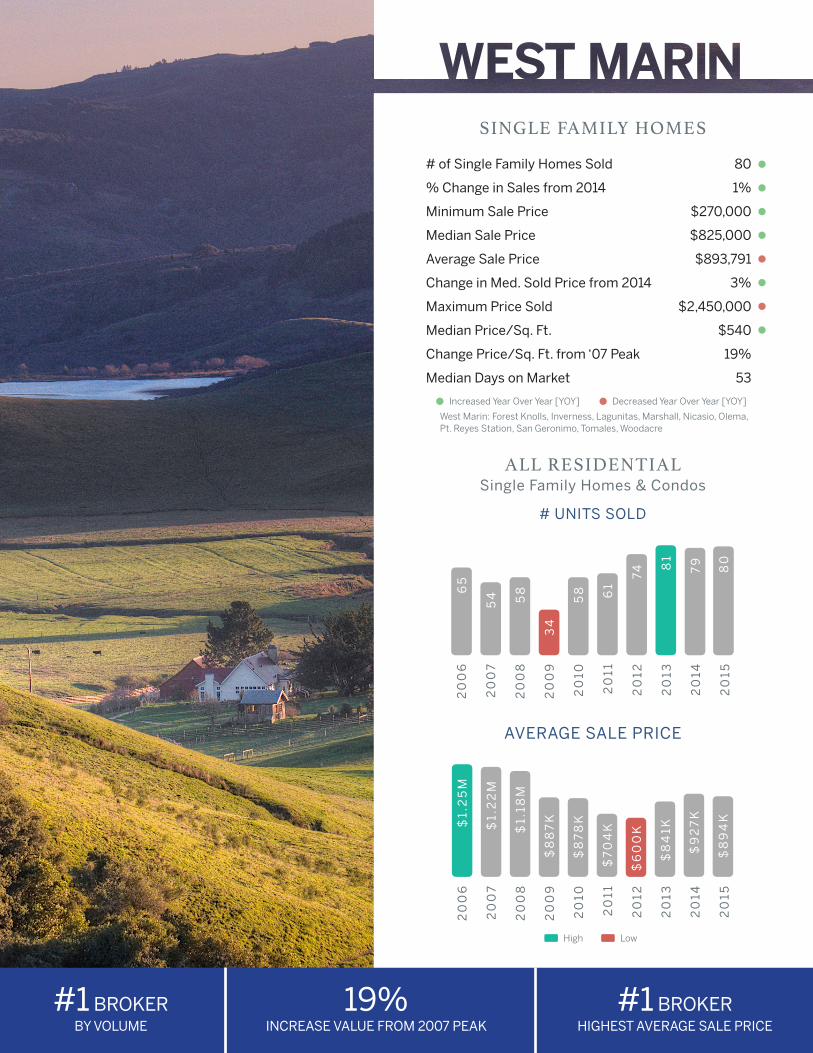
# of Single Family Homes Sold 80
% Change in Sales from 2014 1%
Minimum Sale Price $270,000
Median Sale Price $825,000
Average Sale Price $893,791
Change in Med. Sold Price from 2014 3%
Maximum Price Sold $2,450,000
Median Price/Sq. Ft. $540
Change Price/Sq. Ft. from ‘07 Peak 19%
Median Days on Market 53
Increased Year Over Year [YOY] Decreased Year Over Year [YOY]
SINGLE FAMILY HOMES
20
06
20
07
20
08
20
09
20
10
20
11
20
12
20
13
20
14
20
15
High Low
# UNITS SOLD
ALL RESIDENTIAL Single Family Homes & Condos
AVERAGE SALE PRICE
20
06
20
07
20
08
20
09
20
10
20
11
20
12
20
13
20
14
20
15
$1.
25
M
$1.
22
M
$1.
18M
$8
87
K
$8
78
K
$7
04
K
$9
27
K
$6
00
K
$8
41K
$8
94
K8
0
65
54 58
34
58 61
74 8
1
79
West Marin: Forest Knolls, Inverness, Lagunitas, Marshall, Nicasio, Olema,Pt. Reyes Station, San Geronimo, Tomales, Woodacre
#1 BROKERHIGHEST AVERAGE SALE PRICE
#1 BROKERBY VOLUME
19%INCREASE VALUE FROM 2007 PEAK
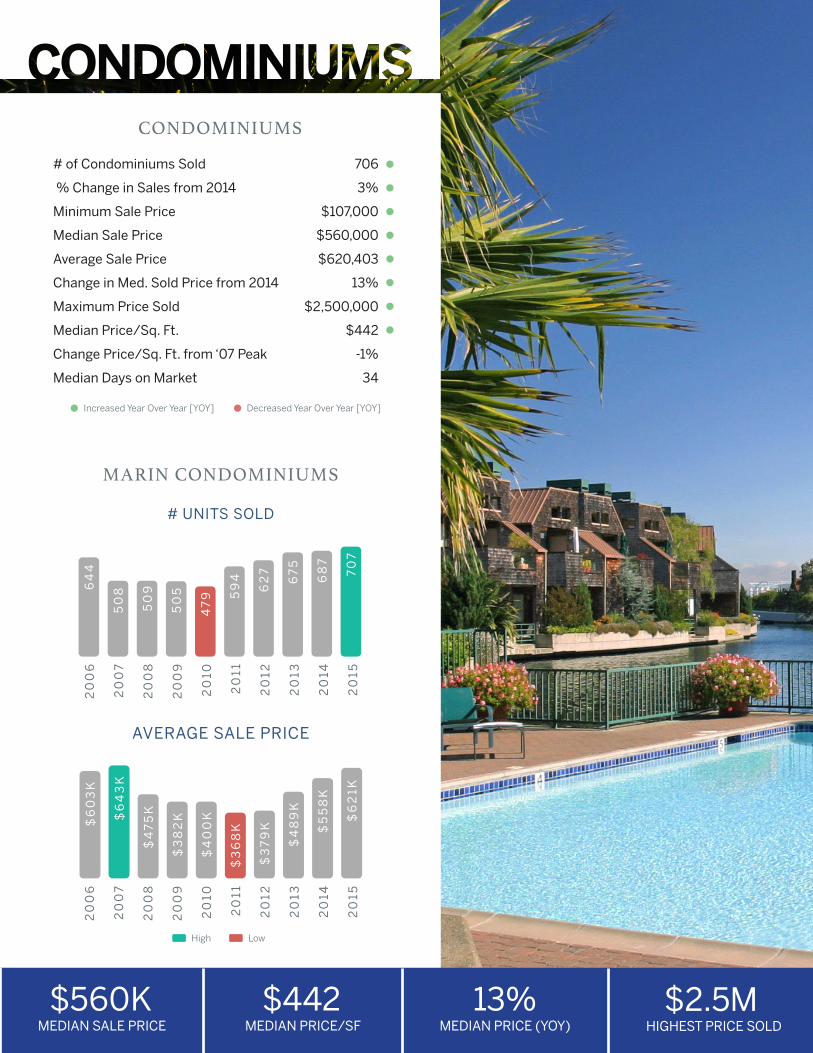
# of Condominiums Sold 706
% Change in Sales from 2014 3%
Minimum Sale Price $107,000
Median Sale Price $560,000
Average Sale Price $620,403
Change in Med. Sold Price from 2014 13%
Maximum Price Sold $2,500,000
Median Price/Sq. Ft. $442
Change Price/Sq. Ft. from ‘07 Peak -1%
Median Days on Market 34
Increased Year Over Year [YOY] Decreased Year Over Year [YOY]
CONDOMINIUMS
MARIN CONDOMINIUMS
20
06
20
07
20
08
20
09
20
10
20
11
20
12
20
13
20
14
20
15
High Low
# UNITS SOLD
AVERAGE SALE PRICE
20
06
20
07
20
08
20
09
20
10
20
11
20
12
20
13
20
14
20
15$
62
1K
$6
03
K
$6
43
K
$4
75
K
$3
82
K
$4
00
K
$3
68
K $5
58
K
$3
79
K
$4
89
K
64
4
50
8
50
9
50
5
47
9 59
4
62
7
67
5
68
7
70
7
$442 MEDIAN PRICE/SF
$560K MEDIAN SALE PRICE
13%MEDIAN PRICE (YOY)
$2.5M HIGHEST PRICE SOLD
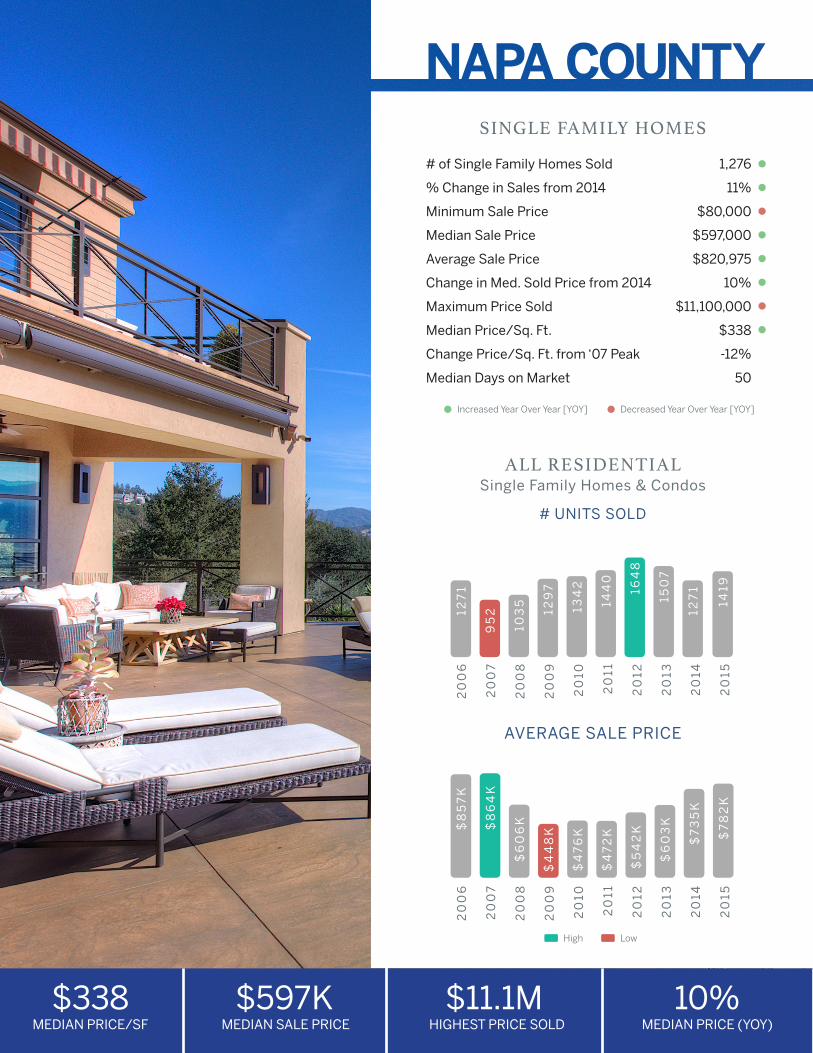
# of Single Family Homes Sold 1,276
% Change in Sales from 2014 11%
Minimum Sale Price $80,000
Median Sale Price $597,000
Average Sale Price $820,975
Change in Med. Sold Price from 2014 10%
Maximum Price Sold $11,100,000
Median Price/Sq. Ft. $338
Change Price/Sq. Ft. from ‘07 Peak -12%
Median Days on Market 50
Increased Year Over Year [YOY] Decreased Year Over Year [YOY]
SINGLE FAMILY HOMES
20
06
20
07
20
08
20
09
20
10
20
11
20
12
20
13
20
14
20
15
High Low
# UNITS SOLD
ALL RESIDENTIAL Single Family Homes & Condos
AVERAGE SALE PRICE
20
06
20
07
20
08
20
09
20
10
20
11
20
12
20
13
20
14
20
15
127
1
95
2
103
5
129
7
134
2
144
0
164
8
150
7
127
1
1419
$8
57
K
$8
64
K
$6
06
K
$4
48
K
$4
76
K
$4
72
K
$7
35
K
$5
42
K
$6
03
K
$7
82
K
$338MEDIAN PRICE/SF
10%MEDIAN PRICE (YOY)
$11.1M HIGHEST PRICE SOLD
$597K MEDIAN SALE PRICE
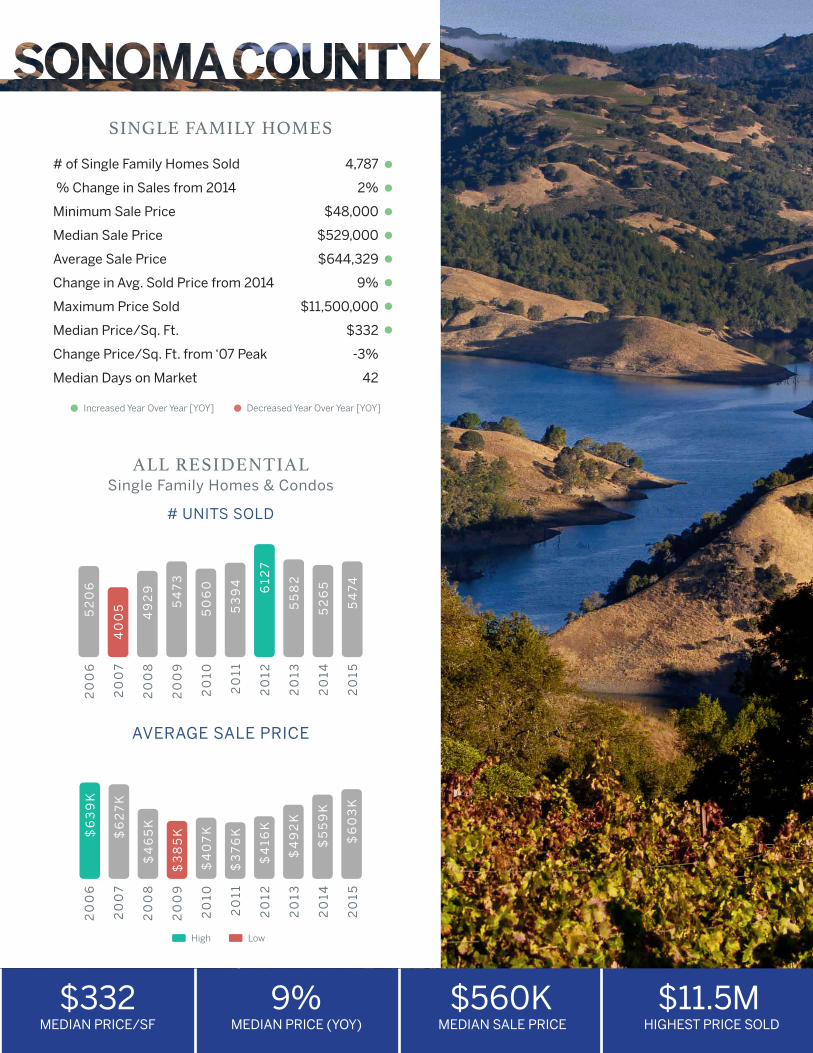
# of Single Family Homes Sold 4,787
% Change in Sales from 2014 2%
Minimum Sale Price $48,000
Median Sale Price $529,000
Average Sale Price $644,329
Change in Avg. Sold Price from 2014 9%
Maximum Price Sold $11,500,000
Median Price/Sq. Ft. $332
Change Price/Sq. Ft. from ‘07 Peak -3%
Median Days on Market 42
Increased Year Over Year [YOY] Decreased Year Over Year [YOY]
SINGLE FAMILY HOMES
20
06
20
07
20
08
20
09
20
10
20
11
20
12
20
13
20
14
20
15
High Low
# UNITS SOLD
ALL RESIDENTIAL Single Family Homes & Condos
AVERAGE SALE PRICE
20
06
20
07
20
08
20
09
20
10
20
11
20
12
20
13
20
14
20
15
$6
39
K
$6
27
K
$4
65
K
$3
85
K
$4
07
K
$3
76
K
$5
59
K
$4
16K
$4
92
K
$6
03
K
52
06
40
05
49
29
54
73
50
60
53
94 612
7
55
82
52
65
54
74
$332MEDIAN PRICE/SF
9%MEDIAN PRICE (YOY)
$560K MEDIAN SALE PRICE
$11.5M HIGHEST PRICE SOLD
NEIGHBORHOODSDISTRICT
5
1
6
2
7
3
8
9
10
4
# UNITS SOLDSINGLE FAMILY HOMES
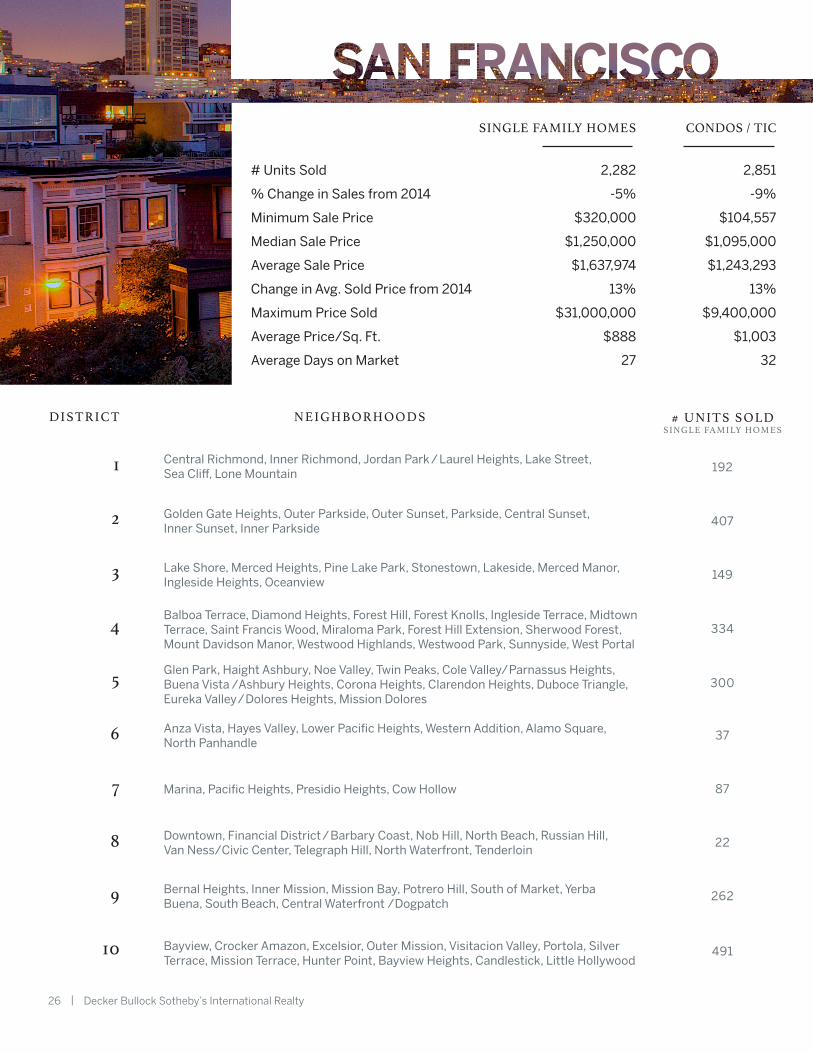
Central Richmond, Inner Richmond, Jordan Park / Laurel Heights, Lake Street,Sea Cliff, Lone Mountain 192
Glen Park, Haight Ashbury, Noe Valley, Twin Peaks, Cole Valley/Parnassus Heights, Buena Vista /Ashbury Heights, Corona Heights, Clarendon Heights, Duboce Triangle, Eureka Valley/Dolores Heights, Mission Dolores
300
Lake Shore, Merced Heights, Pine Lake Park, Stonestown, Lakeside, Merced Manor, Ingleside Heights, Oceanview
Marina, Pacific Heights, Presidio Heights, Cow Hollow 87
Bernal Heights, Inner Mission, Mission Bay, Potrero Hill, South of Market, Yerba Buena, South Beach, Central Waterfront /Dogpatch
262
Golden Gate Heights, Outer Parkside, Outer Sunset, Parkside, Central Sunset,Inner Sunset, Inner Parkside
407
Anza Vista, Hayes Valley, Lower Pacific Heights, Western Addition, Alamo Square,North Panhandle
37
Balboa Terrace, Diamond Heights, Forest Hill, Forest Knolls, Ingleside Terrace, Midtown Terrace, Saint Francis Wood, Miraloma Park, Forest Hill Extension, Sherwood Forest, Mount Davidson Manor, Westwood Highlands, Westwood Park, Sunnyside, West Portal
334
Downtown, Financial District /Barbary Coast, Nob Hill, North Beach, Russian Hill, Van Ness/Civic Center, Telegraph Hill, North Waterfront, Tenderloin
22
Bayview, Crocker Amazon, Excelsior, Outer Mission, Visitacion Valley, Portola, Silver Terrace, Mission Terrace, Hunter Point, Bayview Heights, Candlestick, Little Hollywood
491
26 | Decker Bullock Sotheby’s International Realty
149
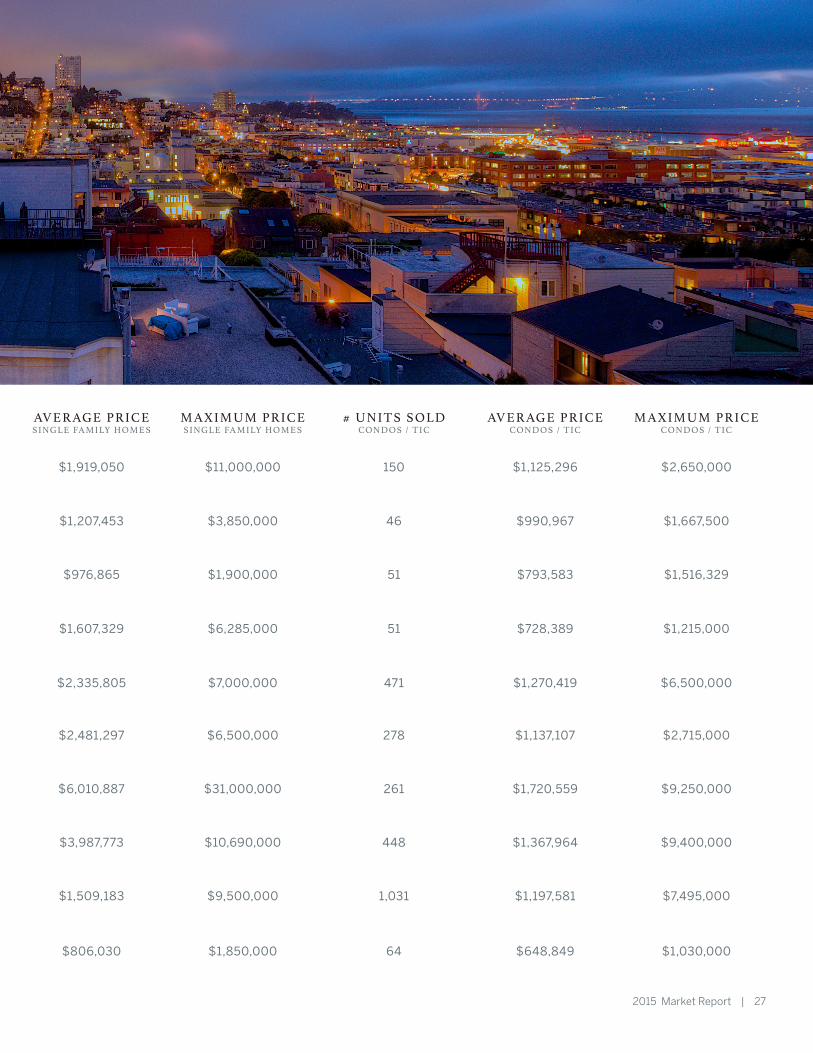
SINGLE FAMILY HOMES CONDOS / TIC
# Units Sold 2,282 2,851
% Change in Sales from 2014 -5% -9%
Minimum Sale Price $320,000 $104,557
Median Sale Price $1,250,000 $1,095,000
Average Sale Price $1,637,974 $1,243,293
Change in Avg. Sold Price from 2014 13% 13%
Maximum Price Sold $31,000,000 $9,400,000
Average Price/Sq. Ft. $888 $1,003
Average Days on Market 27 32
# UNITS SOLDSINGLE FAMILY HOMES
# UNITS SOLDCONDOS / TIC
150
471
261
1,031
46
278
51
448
64
AVERAGE PRICESINGLE FAMILY HOMES
$1,919,050
$2,335,805
$6,010,887
$1,509,183
$1,207,453
$2,481,297
$1,607,329
$3,987,773
$806,030
MAXIMUM PRICESINGLE FAMILY HOMES
$11,000,000
$7,000,000
$31,000,000
$9,500,000
$3,850,000
$6,500,000
$6,285,000
$10,690,000
$1,850,000
AVERAGE PRICECONDOS / TIC
$1,125,296
$1,270,419
$1,720,559
$1,197,581
$990,967
$1,137,107
$728,389
$1,367,964
$648,849
MAXIMUM PRICECONDOS / TIC
$2,650,000
$6,500,000
51$976,865 $1,900,000 $793,583 $1,516,329
$9,250,000
$7,495,000
$1,667,500
$2,715,000
$1,215,000
$9,400,000
$1,030,000
2015 Market Report | 27
28 | Decker Bullock Sotheby’s International Realty All data courtesy of BAREIS MLS
2015 Market Report | 29 All data courtesy of BAREIS MLS
High Low
7
1 1
3 3
2
3
2
20
06
20
07
20
08
20
09
20
10
20
11
20
12
20
13
20
14
20
15
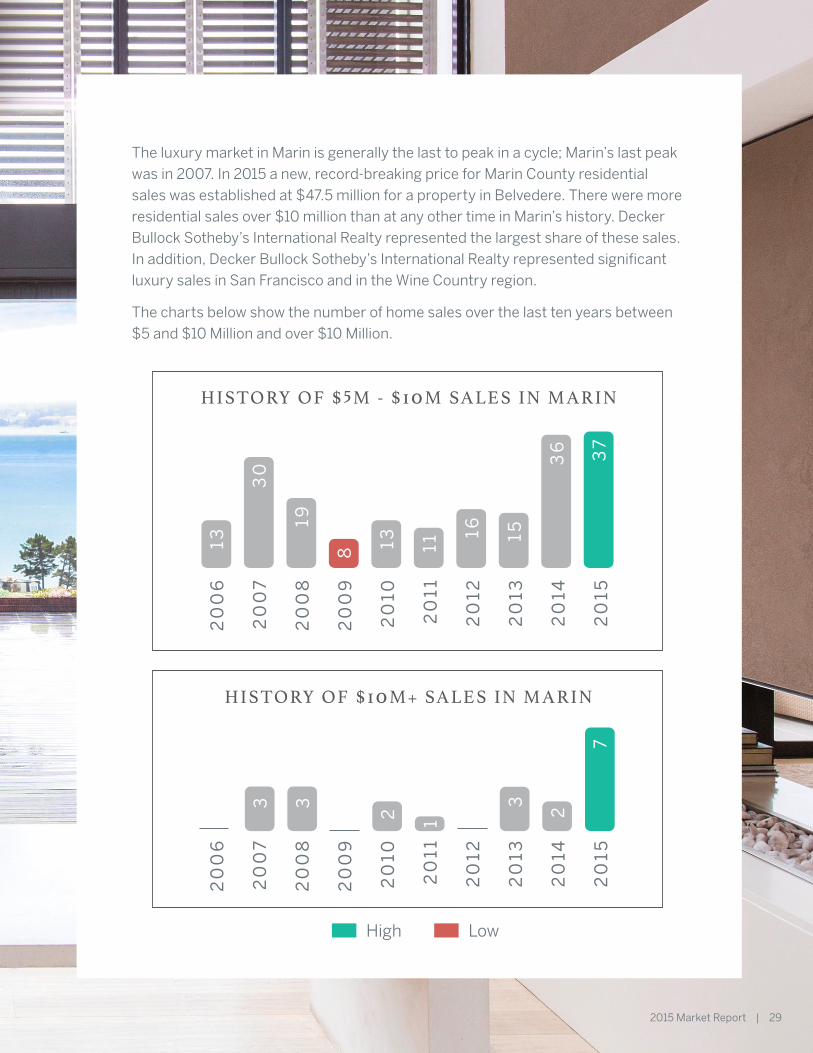
HISTORY OF $10 M+ SALES IN MARIN
HISTORY OF $5M - $10 M SALES IN MARIN
The luxury market in Marin is generally the last to peak in a cycle; Marin’s last peak
was in 2007. In 2015 a new, record-breaking price for Marin County residential
sales was established at $47.5 million for a property in Belvedere. There were more
residential sales over $10 million than at any other time in Marin’s history. Decker
Bullock Sotheby’s International Realty represented the largest share of these sales.
In addition, Decker Bullock Sotheby’s International Realty represented significant
luxury sales in San Francisco and in the Wine Country region.
The charts below show the number of home sales over the last ten years between
$5 and $10 Million and over $10 Million.
20
06
20
07
20
08
20
09
20
10
20
11
20
12
20
13
20
14
20
15
13
30
19
8 13 11
16 15
36 37

B R A N D A D VA N T A G E
OF UNIQUE VISITORS FROM
OUTSIDE THE UNITED STATES
48%
9,348,472SOTHEBYSREALTY.COM UNIQUE VISITORS IN 2015
74,737,939SOTHEBYSREALTY.COM PAGE VIEWS IN 2015
A T T R A C T I N G B U Y E R S W O R L D W I D E
STATE OF THE ART WORLDWIDE AND LOCAL EXPOSURE

2015 Market Report | 31
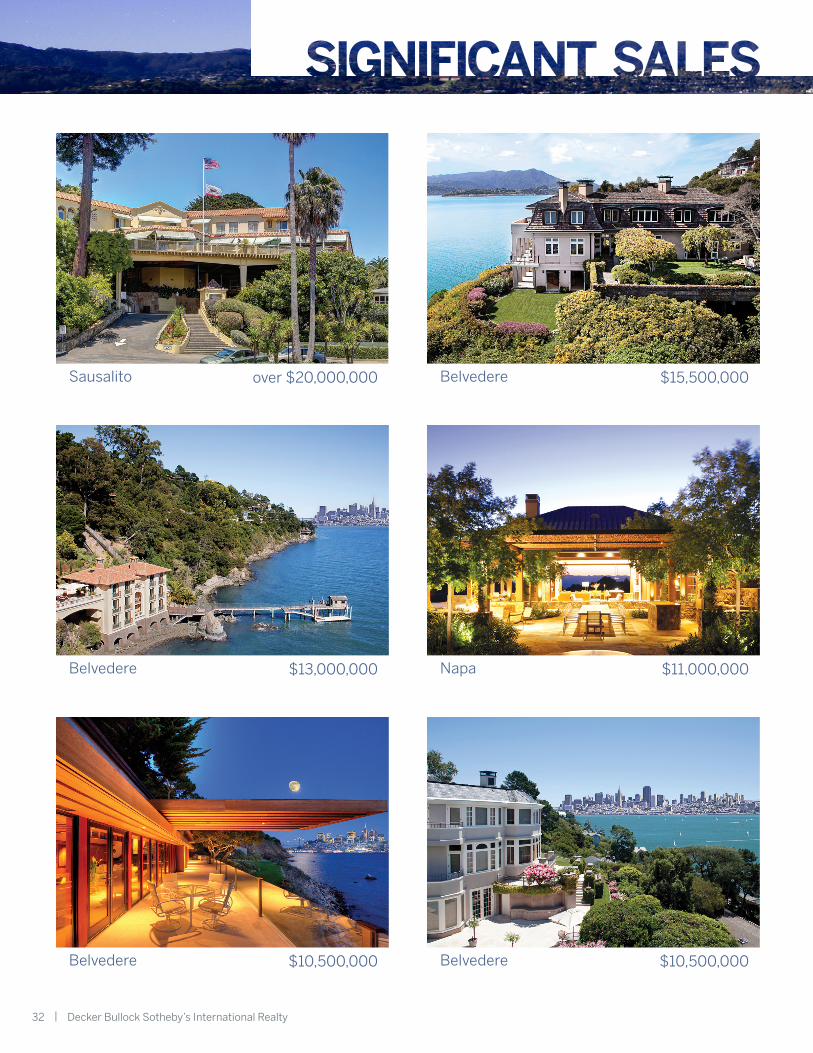
over $20,000,000Sausalito
$13,000,000Belvedere
$10,500,000Belvedere
32 | Decker Bullock Sotheby’s International Realty
$15,500,000Belvedere
$11,000,000Napa
$10,500,000Belvedere
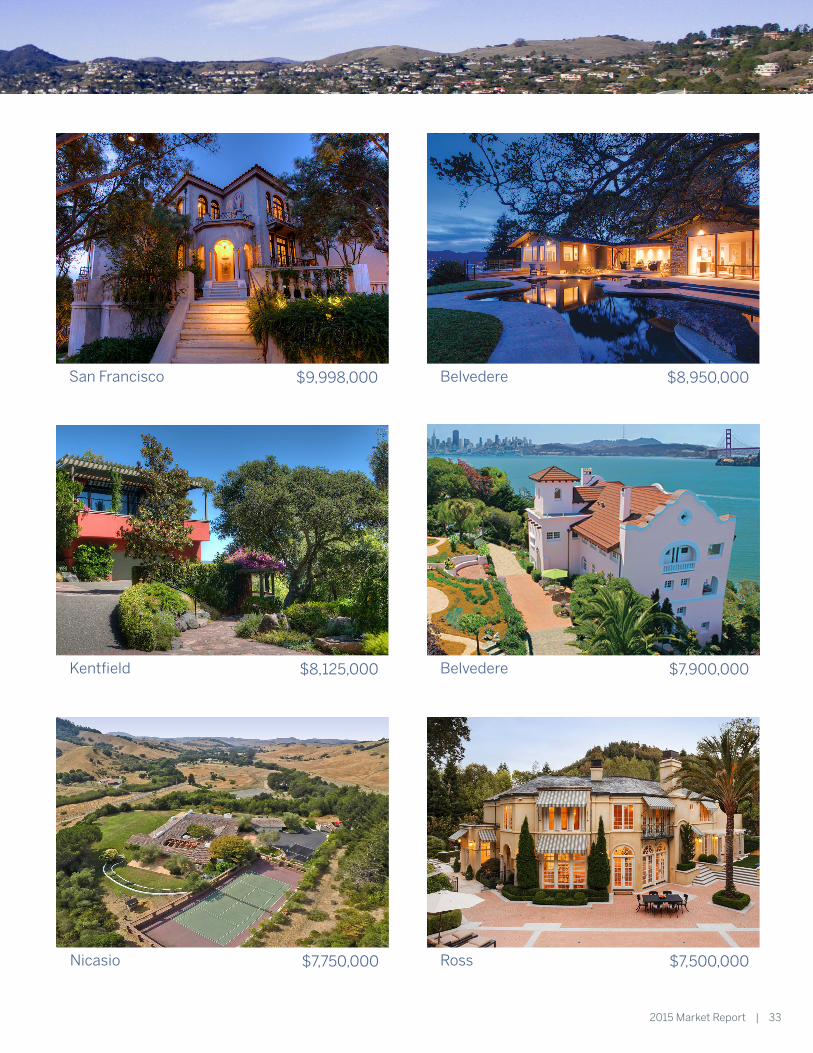
2015 Market Report | 33
$9,998,000San Francisco
$7,900,000Belvedere
$8,950,000Belvedere
$8,125,000Kentfield
$7,750,000Nicasio $7,500,000Ross
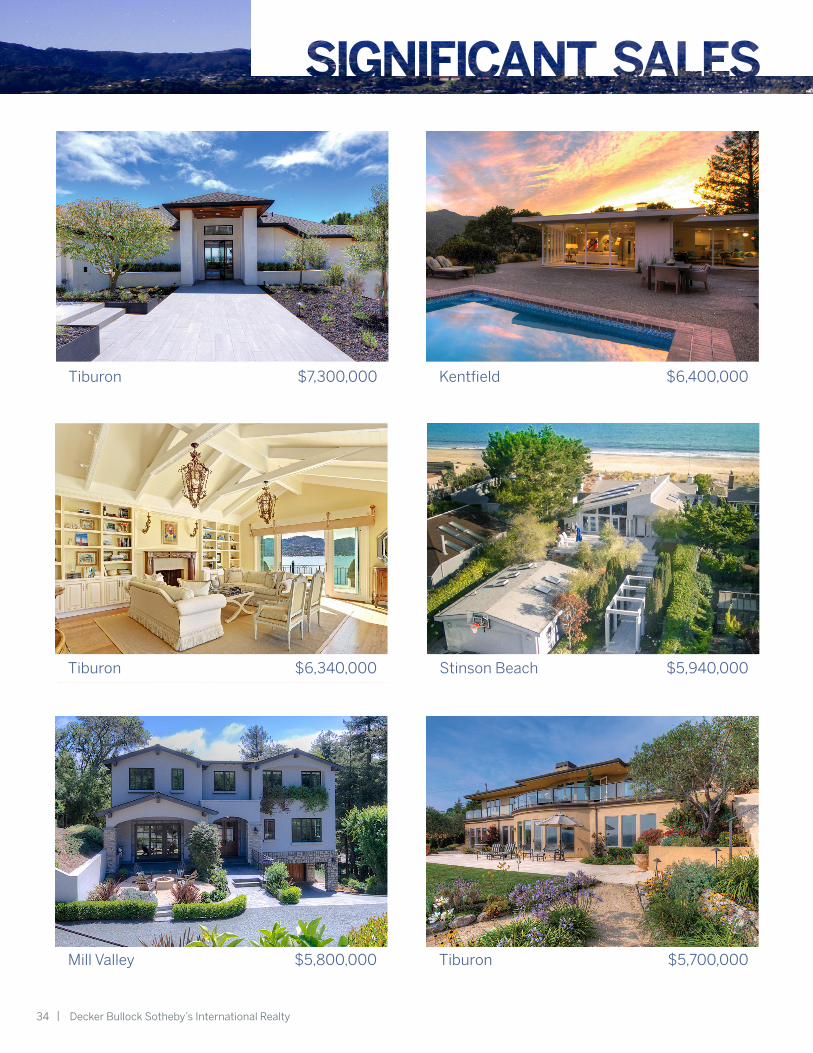
$6,400,000Kentfield
$5,940,000Stinson Beach
34 | Decker Bullock Sotheby’s International Realty
$7,300,000Tiburon
$6,340,000Tiburon
$5,800,000Mill Valley $5,700,000Tiburon
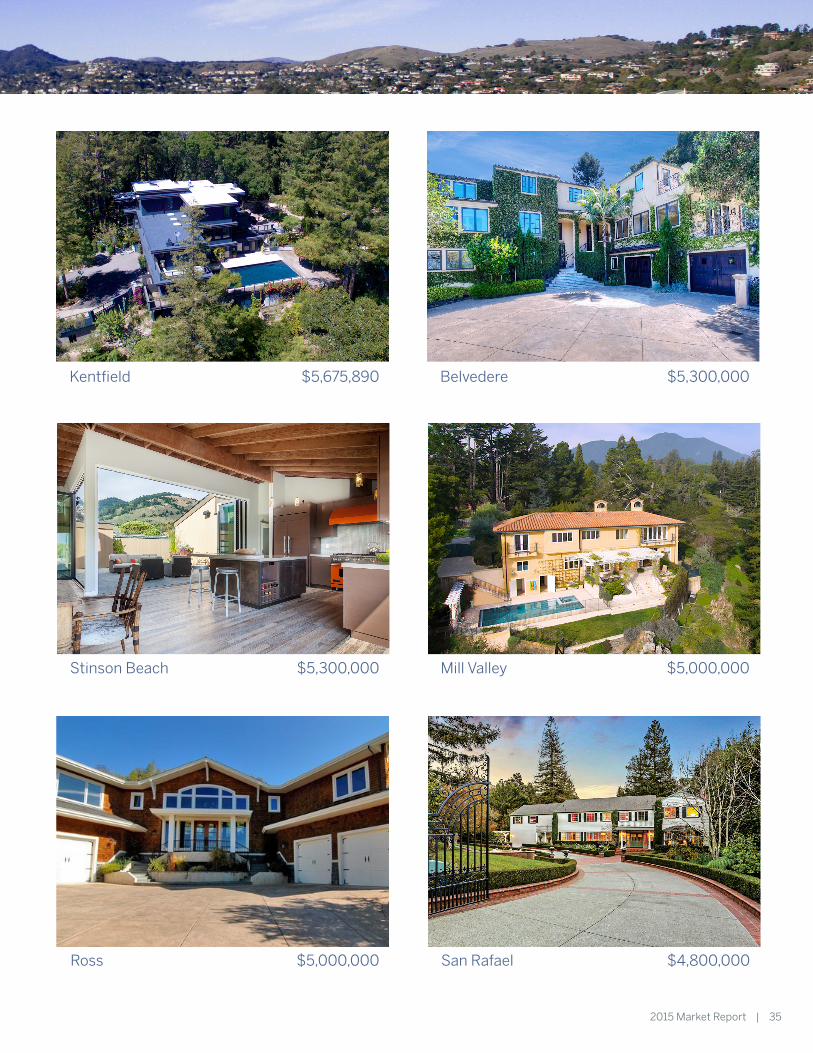
2015 Market Report | 35
$5,300,000Belvedere
$5,000,000Mill Valley
$5,675,890Kentfield
$5,300,000Stinson Beach
$5,000,000Ross $4,800,000San Rafael
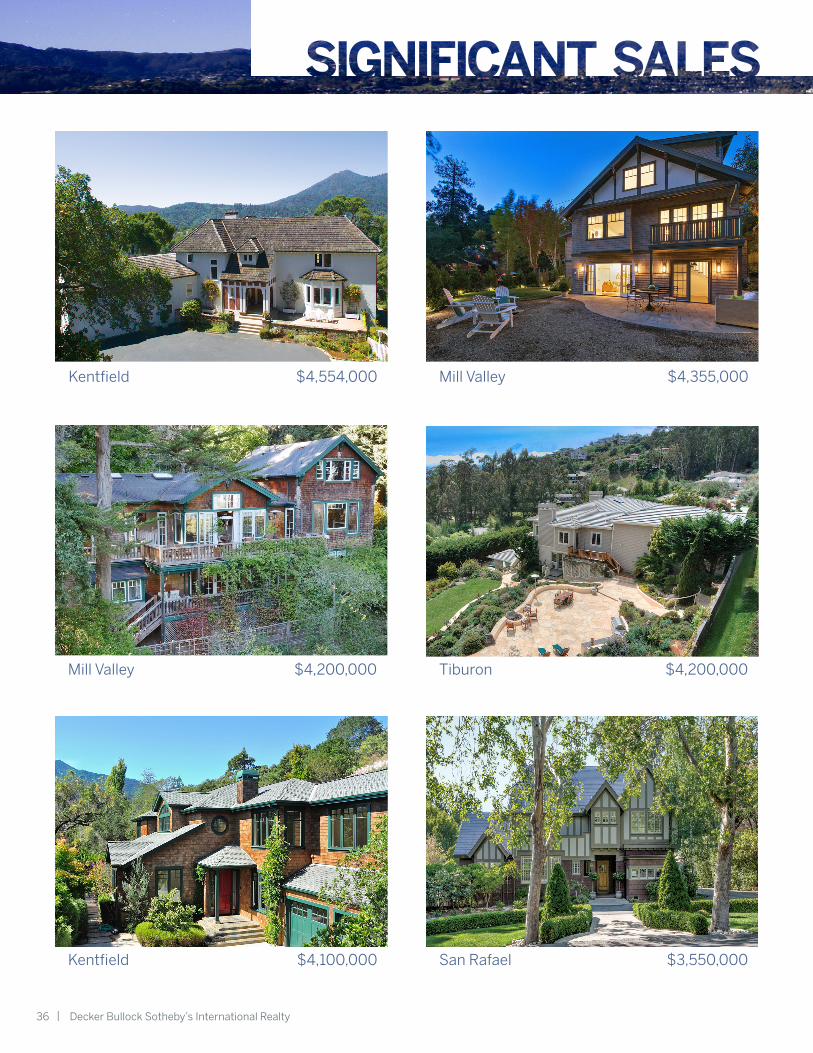
36 | Decker Bullock Sotheby’s International Realty
$4,355,000Mill Valley$4,554,000Kentfield
$4,200,000Mill Valley $4,200,000Tiburon
$4,100,000Kentfield $3,550,000San Rafael
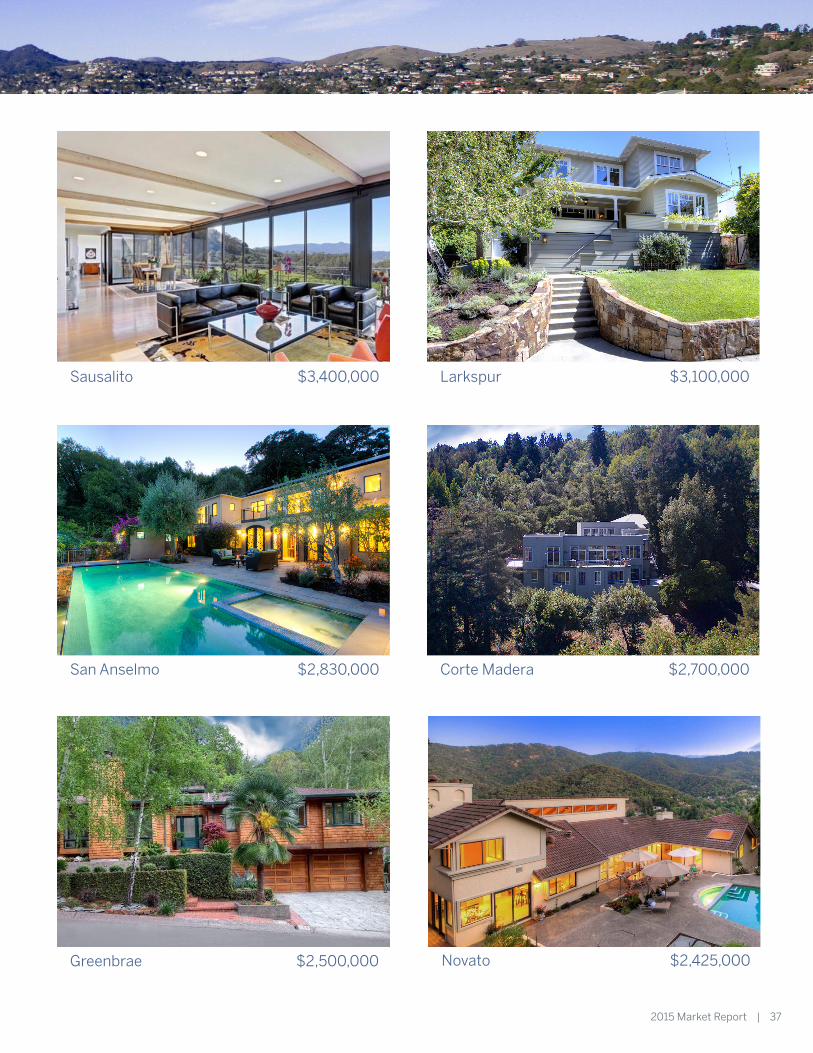
2015 Market Report | 37
$3,100,000Larkspur
$2,500,000Greenbrae
$2,700,000Corte Madera
$2,425,000Novato
$3,400,000Sausalito
$2,830,000San Anselmo
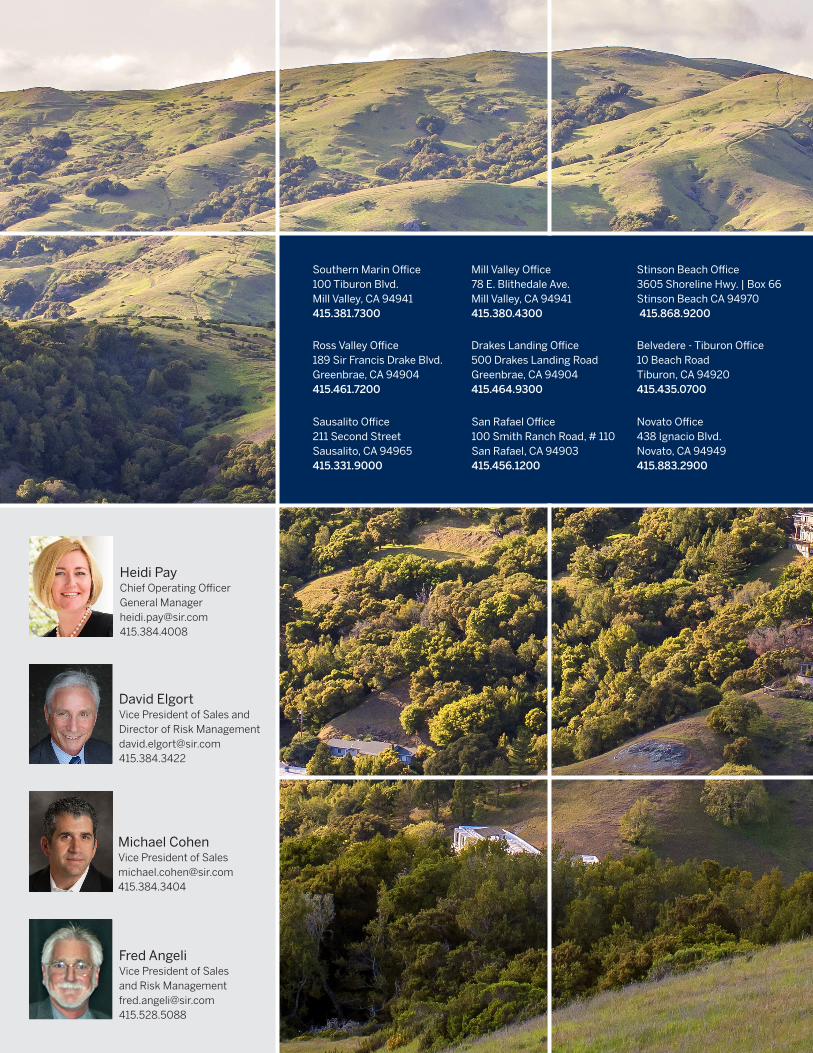
Southern Marin Office100 Tiburon Blvd.Mill Valley, CA 94941415.381.7300
Mill Valley Office 78 E. Blithedale Ave.Mill Valley, CA 94941415.380.4300
Stinson Beach Office 3605 Shoreline Hwy. | Box 66Stinson Beach CA 94970 415.868.9200
San Rafael Office 100 Smith Ranch Road, # 110San Rafael, CA 94903415.456.1200
Ross Valley Office189 Sir Francis Drake Blvd.Greenbrae, CA 94904415.461.7200
Drakes Landing Office500 Drakes Landing RoadGreenbrae, CA 94904415.464.9300
Sausalito Office211 Second StreetSausalito, CA 94965415.331.9000
Novato Office438 Ignacio Blvd.Novato, CA 94949415.883.2900
Belvedere - Tiburon Office10 Beach RoadTiburon, CA 94920415.435.0700
Heidi PayChief Operating OfficerGeneral [email protected]
David ElgortVice President of Sales and Director of Risk [email protected]
Michael CohenVice President of [email protected]
Fred AngeliVice President of Salesand Risk [email protected]