annual monitoring report 2009 · 2019-11-06 · 2 executive summary – annual monitoring report...
TRANSCRIPT

NORTH WEST REGIONAL AGGREGATES WORKING PARTY Cheshire • Cumbria • Greater Manchester
Halton • Lancashire • Merseyside • Warrington
ANNUAL MONITORING REPORT 2009
[Incorporating 2008 statistics]

1
CHESHIRE WEST AND CHESTER COUNCIL Richard Evans Chairman NWRAWP Minerals and Waste Planning Policy Team Cumbria County Council
Anne Mosquera Secretary NWRAWP Minerals and Waste Policy Unit Cheshire West and Chester Council For further information please contact: Natalie Durney-Knight NWRAWP Technician Minerals and Waste Policy Unit Cheshire West and Chester Council Backford Hall CHESTER CH1 6PZ Tel: 01244 973117 E-mail: [email protected] December 2009

2
EXECUTIVE SUMMARY – ANNUAL MONITORING REPORT 2009 i. The North West Regional Aggregates Working Party (NWRAWP) is one of nine similar
working parties throughout England and Wales established in the 1970’s, the core functions of which are set out in the Terms of Reference detailed in Appendix A.
ii. The Annual Monitoring Report 2009 represents the seventeenth annual report and uses
data collected for sales and reserves during the period 1st January to 31st December 2008. Information regarding planning applications, progress of development plans, construction activity and the use of recycled and secondary aggregate is also included for the same period.
iii. Total primary aggregate sales fell during 2008 by approximately 14% from 13.08mt in
2007 to 11.17mt. Sales of both crushed rock and land-won sand and gravel fell during the same period by 15% and 14% respectively. Sales of marine dredged aggregate fell significantly by 33% from 0.66mt in 2007 to 0.44mt.
iv. Total permitted primary aggregate reserves fell by approximately 1.6% from 384.8mt in
2007 to 378.63mt. Reserves of crushed rock fell by 3.8% during the monitoring period from 346.07mt in 2007 to 332.66mt, whilst reserves of sand and gravel increased by 18.6% from 38.74mt in 2007 to 45.97mt.
v. Landbanks remained relatively stable during the 2008 monitoring period. The landbanks
at 31st December 2008 were 31.98 years for crushed rock and 13.4 years for sand and gravel.
vi. Some significant planning applications for the removal of primary aggregate were
determined during the 2008 monitoring period. A total of 18.9mt in crushed rock reserves and 11.54mt in sand and gravel reserves was released. Applications for the release of 6.66mt of crushed rock and 5.16mt of sand and gravel remained in hand as at 31st December 2008.
vii. Total arisings of alternative materials fell 19% from 0.52mt in 2007 to 0.43mt. Total
arisings of Pulverised Fuel Ash (PFA) and Furnace Bottom Ash fell by 55% and 49% respectively, whilst arisings of slate waste increased by 28%.
viii. Despite the downturn in the economy during 2008 some major construction projects
continued across the North West region. Significant investment in Chester continued including the Delamere Street Development, whilst several major road projects were completed in Cumbria. East Lancashire saw substantial housing clearance and refurbishment activity supported by private sector investment. In Greater Manchester the New Islington Millennium Community housing development continued to progress throughout 2008 and the Gateway to the Future project for Stockport Town Centre and M60 Gateway also commenced during the monitoring period.

3
CONTENTS
CHAPTER PAGE
Executive Summary 2
1. Introduction 7
2. Membership Changes 9
3. Meetings 9
4. Results of the annual monitoring of primary aggregate sales 2009 Total aggregate sales Crushed rock sales Sand and gravel sales Total aggregate reserves Crushed rock reserves Sand and gravel reserves Landbanks Commentary on trends
9 13 13 14 14 14 15 15 15
5. Monitoring of primary aggregate landbanks 22
6. Marine sand and gravel landings from off the North West coast Active dredging off the North West coast (including Penrhyn, North Wales) Landings from off the North West coast (excluding Penrhyn, North Wales) Barrow Eastham Heysham Liverpool Summary
25 25 27 27 27 29 29 29
7. Monitoring of planning applications 30
8. Sub-regional profiles Cheshire Cumbria Lancashire Greater Manchester, Merseyside, Halton and Warrington
31 31 36 42 49
9. Secondary and recycled aggregate Alternative arisings Recycled aggregate
54 54 55
10. Monitoring of development plans 60
11. Environment Act 1995: Review of aggregate mineral planning permissions
60

4
FIGURES AND TABLES PAGE
Figure 1: North West RAWP Mineral Planning Authorities 8
Figure 2: Trends in primary aggregate sales in the North West 1995-2008
13
Figure 3: Primary aggregate sales in the North West 2008 17
Figure 4: Active crushed rock sites in the North West 2008 18
Figure 5: Active sand and gravel sites in the North West 2008 19
Figure 6: Inactive crushed rock sites in the North West 2008 20
Figure 7: Inactive sand and gravel sites in the North West 2008 21
Figure 8: Crushed rock sales against annualised apportionment in the North West 1995 -2008
24
Figure 9: Sand and gravel sales against annualised apportionment in the North West 1995 -2008
24
Figure 10: Marine dredged aggregate landings from off the North West coast 27
Figure 11: : Applications pending, licensed dredging grounds and landing points in North West coastal waters
29
Figure 12: Cheshire primary aggregate sales against annualised apportionment
31
Figure 13: Spatial distribution of minerals working in Cheshire 2008 35
Figure 14: Cumbria primary aggregate sales against annualised apportionment
36
Figure 15: Spatial distribution of minerals working in Cumbria 2008 41
Figure 16: Lancashire primary aggregate sales against annualised apportionment
42
Figure 17: Spatial distribution of minerals working in Lancashire 2008 48
Figure 18: Greater Manchester, Merseyside, Halton and Warrington primary aggregate sales against annualised apportionment
49
Figure 19: Spatial distribution of minerals working in Greater Manchester, Merseyside, Halton and Warrington 2008
53
Figure 20: Fixed Construction Demolition and Excavation Waste (CDEW) sites in the North West 2008
56
Table 1: Monitoring of total primary aggregate sales – North West 1994-2008 10
Table 2: Monitoring of crushed rock sales – North West 1994-2008 10
Table 3: Monitoring of sand and gravel sales – North West 1994-2008 11
Table 4: Monitoring of total primary aggregate reserves – North West 1994-2008
11
Table 5: Monitoring of crushed rock reserves – North West 1994-2008 12

5
FIGURES AND TABLES CONTINUED PAGE
Table 6: Monitoring of sand and gravel reserves – North West 1994-2008 12
Table 7: Monitoring of landbanks – North West 2008 22
Table 8: Marine dredged aggregate removed from off the North West coast 26
Table 9: Marine dredged aggregate landed from off the North West coast 26
Table 10: Marine dredged aggregate licence holders 28
Table 11: Monitoring of mineral planning applications determined 1st January – 31st December 2008
30
Table 12: Monitoring of mineral planning applications pending as at 31st December 2008
30
Table 13: Monitoring of total primary aggregate sales – Cheshire sub-region 1994-2008
32
Table 14: Monitoring of total primary aggregate reserves – Cheshire sub-region 1994-2008
32
Table 15: Cheshire sites included in AM2008 aggregate monitoring survey 34
Table 16: Monitoring of total primary aggregate sales – Cumbria sub-region 1994-2008
37
Table 17: Monitoring of total primary aggregate reserves – Cumbria sub-region 1994-2008
37
Table 18: Cumbria sites included in AM2008 aggregate monitoring survey 39
Table 19: Monitoring of total primary aggregate sales – Lancashire sub-region 1994-2008
43
Table 20: Monitoring of total primary aggregate reserves – Lancashire sub-region 1994-2008
43
Table 21: Lancashire sites included in AM2008 aggregate monitoring survey 46
Table 22: Monitoring of total primary aggregate sales – Greater Manchester, Merseyside, Halton and Warrington sub-region 1994-2008
50
Table 23: Monitoring of total primary aggregate reserves – Greater Manchester, Merseyside, Halton and Warrington sub-region 1994-2008
50
Table 24: Greater Manchester, Merseyside, Halton and Warrington sites included in AM2008 aggregate monitoring survey
52
Table 25: Alternative arisings in the North West 2007-2008 54
Table 26: Fixed Construction, Demolition and Excavation Waste (CDEW) in the North West 2008
57
Table 27: Environment Act 1995: Summary of aggregate mineral review sites 61

6
APPENDICES PAGE
Appendix A: NWRAWP Terms of Reference 62
Appendix B: Monitoring of aggregate mineral primary planning applications
Table A: Monitoring of primary aggregate mineral primary planning applications decisions made 1st January – 31st December 2008 Table B: Monitoring of primary aggregate mineral primary planning applications in hand as at 31st December 2008
63
63
64
Appendix C: Development plans in the North West region 65
Appendix D: Historical monitoring statistics 1989-2008 Table A: Monitoring of crushed rock sales – North West 1989-2008 Table B: Monitoring of sand and gravel sales – North West 1989-2008 Table C: Monitoring of crushed rock reserves – North West 1989-2008 Table D: Monitoring of sand and gravel reserves – North West 1989-2008
69 69 70 71 72
Appendix E: Minutes of meeting held on 2nd December 2008 73
Appendix F: National and regional guidelines for aggregate provision 2001-2016
76
Appendix G: National and regional guidelines for aggregate provision 2005-2020
78
Appendix H: Membership of the North West RAWP 79

7
1 INTRODUCTION 1.1 The North West Regional Aggregates Working Party (NWRAWP) is one of nine similar
working parties throughout England and Wales established in the 1970’s, the core functions of which are set out in the Terms of Reference detailed in Appendix A. The NWRAWP is comprised of the counties of Cumbria (including the Lake District National Park) and Lancashire; the Metropolitan Boroughs of Greater Manchester and Merseyside along with the Unitary Authorities of Blackburn with Darwen, Blackpool, Halton and Warrington and the newly established Cheshire East and Cheshire West and Chester authorities1 (Figure 1). Those parts of the Peak District National Park which fall within Cheshire East and Greater Manchester are represented by the East Midlands Regional Aggregates Working Party and those parts of the Yorkshire Dales National Park which fall within Cumbria are represented by the Yorkshire and Humberside Regional Aggregates Working Party. Please note that for the purposes of mapping the areas of Merseyside, Halton and Warrington are included within the Greater Manchester sub-region.
1.2 Membership is drawn from the constituent Mineral Planning Authorities (MPAs), central
government departments and representatives from the aggregates industry. The metropolitan districts in Greater Manchester are represented by the Greater Manchester Geological Unit (GMGU), which provides mineral planning services to the ten Metropolitan Borough Councils (MBCs). The five Merseyside authorities are represented on mineral planning issues by the Environment Advisory Service (EAS) which regularly provides professional planning advice for Knowsley, Sefton, and St Helens MBCs on issues relating to the environment including minerals extraction and waste disposal. Lancashire County Council acts for the authorities of Blackburn with Darwen and Blackpool on minerals policy issues. Cumbria acts for the Lake District National Park Authority in respect of work undertaken by the NWRAWP. The authorities of Halton and Warrington represent themselves on mineral planning issues.
1.3 The terms of reference of the North West Regional Aggregate Working Party are set out
in Appendix A. 1.4 The Annual Monitoring Report 2009 represents the seventeenth annual report and
provides information relating to land and marine won primary aggregate sales and reserves throughout the North West Region for the preceding year (2008). Information relating to the progress of development plans, planning applications, construction industry activity, secondary and recycled aggregates and mineral review applications is also provided for the period 1st January 2008 to 31st December 2008.
1.5 This report includes maps to illustrate the spatial distribution of crushed rock and sand
and gravel sites in the North West Region within Sections 4 and 8. 1 Cheshire West and Chester and Cheshire East Unitary Authorities were formed on 1
st April 2009 and replaced Cheshire County
Council and the six district authorities of Chester City, Congleton, Crewe and Nantwich, Ellesmere Port and Neston, Macclesfield and Vale Royal

8
Figure 1: North West RAWP Mineral Planning Authorities
NB: Please note Cheshire West and Chester and Cheshire East Unitary Council were not formed until 1st April 2009

9
2 MEMBERSHIP CHANGES 2.1 The current membership of the NWRAWP is included as Appendix G. Since the 1st January
2009 the following membership changes have taken place:
2.2 Mr R Evans has replaced Mr H Collin as Chairman to the North West RAWP. 2.3 Mrs A Mosquera has replaced Mr A Farrow as Secretary to the North West RAWP. 2.4 Mr M Plummer has replaced Mr D A Wilkes as Department for Communities and Local
Government representative for the North West RAWP.
2.5 Ms C Williams has replaced Mr K Patrick as representative of the Greater Manchester Geological Unit (GMGU) for the North West RAWP.
3 MEETINGS 3.1 The working party met on 2nd December 2008 to discuss the key findings from the Annual
Monitoring Survey 2008 (incorporating 2007 statistics). Other matters discussed at the meeting included the implications of The Yorkshire and Humber Plan (Regional Spatial Strategy - RSS), the implications of Paragraph 70 of Mineral Policy Statement 1 (MPS1) Practice Guide regarding landbanks and Local Government Review (LGR) in Cheshire.
3.2 The minutes from this meeting are detailed in Appendix E.
4 RESULTS OF THE ANNUAL MONITORING OF PRIMARY AGGREGATE SALES AND RESERVES 2009 (INCORPORATING 2008 STATISTICS)
4.1 From January 2009 to August 2009 the NWRAWP, in conjunction with its constituent
MPAs, carried out an annual survey of aggregate sales and reserves in the North West region for the 2008 monitoring period AM08 (1st January 2008 to 31st December 2008).
4.2 Tables 1-6 provide figures for the sales and reserves of primary aggregates in the North West region for the 2008 monitoring period. Figures for the previous thirteen years are also provided for comparison. Results from the Unitary Authorities of Halton and Warrington have been included with the figures for Greater Manchester and Merseyside, and those for Blackpool and Blackburn with Darwen have been included with the figures for Lancashire. Figure 2 and 3 on pages 13 and 17 provide geographical and graphical illustrations of primary aggregate sales across the region for the AM08 period.

10
Table 1: Monitoring of total primary aggregate sales – North West 1994 – 2008 (million tonnes)
AM94 AM95 AM96 AM97 AM98 AM99 AM00 AM01 AM02 AM03 AM04 AM05 AM06 AM07 AM08
Total Primary Aggregate Sales
Limestone 1 9.1 7.3 6.1 6.5 5.9 6.0 6.1 5.6 5.6 5.2 5.5 5.1 5.3 5.8 5.18
Sandstone & Igneous Rock 2 6.3 6.0 5.37 5.06 4.90 4.58 4.2 4.5 4.6 4.12 3.95 3.53 3.55 3.62 2.84
Land-won Sand & Gravel 5.55 4.93 4.51 4.72 4.16 4.1 3.78 3.1 3.2 3.36 2.84 3.06 2.97 3.0 2.69
Marine Dredged Sand & Gravel 0.22 0.22 0.25 0.25 0.23 0.29 0.29 0.46 0.50 0.47 0.6 0.66 0.64 0.66 0.44
Harbour Authorities Sand & Gravel ~ ~ ~ ~ ~ ~ ~ ~ 0.1 0.03 ~ ~ 0.02 ~ 0.02
TOTAL PRIMARY AGGREGATE SALES 21.17 18.45 16.23 16.53 15.14 14.92 14.37 13.66 14.0 13.18 12.89 12.35 12.48 13.08 11.17
1 Excludes Limestone used for non-aggregate purposes 2 Includes High Specification Aggregate (HSA) NB: Figures may include some estimates by MPAs, totals may not add up due to rounding. Figures exclude Borrow Pits.
Table 2: Monitoring of crushed rock sales – North West 1994 – 2008 (million tonnes)
AM94 AM95 AM96 AM97 AM98 AM99 AM00 AM01 AM02 AM03 AM04 AM05 AM06 AM07 AM08
LIMESTONE 1
Cumbria 4.8 3.8 3.2 3.5 3.2 3.4 3.4 3.0 2.9 2.6 2.8 2.6 2.7 2.8 2.7
Lancashire 4.3 3.5 2.9 3.0 2.7 2.6 2.7 2.6 2.7 2.6 2.7 2.5 2.6 3.0 2.48
TOTAL LIMESTONE 9.1 7.3 6.1 6.5 5.9 6.0 6.1 5.6 5.6 5.2 5.5 5.1 5.3 5.8 5.18
SANDSTONE & IGNEOUS ROCK
Cumbria 2
0.8 0.8 0.7 0.7 0.8 0.8 1 1.1 1.1 1.1 1.1 0.36 0.27 0.53 0.4
Cumbria - High Specification Aggregate (HSA) ~ ~ ~ ~ ~ ~ ~ ~ ~ ~ ~ 0.74 0.69 0.7 0.75
Lancashire 2.7 2.8 2.63 2.17 2.1 1.8 1.7 1.9 2.2 1.6 1.3 1.2 1.0 1.26 0.98
Cheshire 3/4
1.0 0.6 0.44 0.29 0.1 0.1 0.1 0.1 0.01 0.02 0.05 0.03 0.05 0.03 0.02
GtManchester/M’side/Halton/Warrington5 1.8 1.8 1.6 1.9 1.9 1.8 1.4 1.4 1.3 1.4 1.5 1.2 1.54 1.1 0.69
TOTAL SANDSTONE & IGNEOUS ROCK 6.3 6.0 5.37 5.06 4.85 4.58 4.2 4.5 4.6 4.12 3.95 3.53 3.55 3.62 2.84
TOTAL CRUSHED ROCK 15.4 13.3 11.5 11.6 10.75 10.58 10.3 10.1 10.2 9.32 9.45 8.63 8.85 9.42 8.02
1 Excludes Limestone used for non-aggregate purposes 4 Prior to 1998 figures include Halton and Warrington 2 Cumbria figures include the Lake District National Park 5 Prior to 1998 figures exclude Halton and Warrington 3 Prior to 1999 figures include Peak Park within Cheshire NB: Figures may include some estimates by MPAs, total may not add up due to rounding. Figures exclude Borrow Pits.

11
Table 3: Monitoring of sand and gravel sales – North West 1994 – 2008 (million tonnes)
AM94 AM95 AM96 AM97 AM98 AM99 AM00 AM01 AM02 AM03 AM04 AM05 AM06 AM07 AM08
LAND-WON SAND & GRAVEL
Cumbria 1
1.1 0.9 0.8 0.8 0.9 0.9 0.8 0.7 0.9 1.0 0.8 0.7 0.79 0.87 0.77
Lancashire 0.77 0.8 0.8 0.91 0.66 0.48 0.34 0.5 0.5 0.46 0.44 0.38 0.34 0.33 0.31
Cheshire 2/3
3.2 2.9 2.65 2.56 2.3 2.48 2.33 1.7 1.4 1.4 1.1 1.58 1.44 1.51 1.17
GtManchester/M’side/Halton/Warrington4
0.48 0.33 0.26 0.5 0.3 0.24 0.31 0.23 0.4 0.5 0.5 0.4 0.4 0.3 0.44
TOTAL LAND-WON SAND & GRAVEL 5.55 4.93 4.51 4.72 4.16 4.1 3.78 3.1 3.2 3.36 2.84 3.06 2.97 3.0 2.69
MARINE DREDGED SAND & GRAVEL
Cumbria ~ ~ ~ ~ ~ ~ ~ 0.03 0.04 0.04 0.02 0.02 0.02 0.01 0.02
Lancashire ~ ~ ~ ~ ~ 0.05 0.07 0.18 0.13 0.11 0.1 0.12 0.1 0.12 0.01
GtManchester/M’side/Halton/Warrington4
0.22 0.22 0.25 0.25 0.23 0.24 0.22 0.25 0.33 0.32 0.48 0.52 0.49 0.53 0.41
TOTAL MARINE SAND & GRAVEL 0.22 0.22 0.25 0.25 0.23 0.29 0.29 0.46 0.5 0.47 0.6 0.66 0.64 0.66 0.44
HARBOUR AUTHORITIES SAND & GRAVEL
Cumbria ~ ~ ~ ~ ~ ~ ~ ~ 0.1 0.03 ~ ~ 0.02 ~ 0.02
TOTAL SAND & GRAVEL 5.77 5.15 4.76 4.97 4.39 4.34 4.07 3.56 3.8 3.86 3.44 3.72 3.63 3.66 3.15
1 Cumbria figures include the Lake District National Park 3 Prior to 1998 figures include Halton and Warrington 2 Prior to 1999 figures include Peak Park within Cheshire 4 Prior to 1998 figures exclude Halton and Warrington NB: Figures may include some estimates by MPAs, total may not add up due to rounding. Figures exclude Borrow Pits.
Table 4: Monitoring total of primary aggregate reserves – North West 1994 – 2008 (million tonnes)
AM94 AM95 AM96 AM97 AM98 AM99 AM00 AM01 AM02 AM03 AM04 AM05 AM06 AM07 AM08
Total Primary Aggregate Reserves
Limestone 1 270.9 209.5 175.5 185.4 151.1 168.6 170.8 159.9 161.3 156.7 150.8 148.2 174.7 173.9 162.7
Sandstone & Igneous Rock 2 266.6 245.6 228.0 215.4 196.65 191.9 179.3 172.8 166.6 158.9 168.4 152.9 164.8 172.2 169.96
Land-won Sand & Gravel 56.7 56.0 51.1 49.7 46.64 46.27 43.2 47.9 47.3 41.34 39.24 43.02 45.59 38.7 45.97
TOTAL PRIMARY AGGREGATE RESERVES 610.4 500.4 454.6 450.5 394.4 406.77 393.3 380.6 375.2 356.9 358.6 343.5 385.1 384.8 378.63
1 Excludes Limestone used for non-aggregate purposes 2 Includes High Specification Aggregate (HSA) NB: Figures may include some estimates by MPAs, totals may not add up due to rounding. Figures exclude Borrow Pits.

12
Table 5: Monitoring of crushed rock reserves – North West 1994 – 2008 (million tonnes)
AM94 AM95 AM96 AM97 AM98 AM99 AM00 AM01 AM02 AM03 AM04 AM05 AM06 AM07 AM08
LIMESTONE 1
Cumbria 2 177.6 143.9 111.7 121.9 91.7
3 111.8 116.7 106.0 102.0 99.2 96.1 97.9 97.7 102.5 110.05
Lancashire 4 93.3 65.9 63.8 63.5 59.4 56.8 54.1 53.9 59.3 57.5 54.7 50.32 77.0 71.4 52.6
TOTAL LIMESTONE 270.9 209.5 175.5 185.4 151.1 168.6 170.8 159.9 161.3 156.7 150.8 148.22 174.7 173.9 162.7
SANDSTONE & IGNEOUS ROCK
Cumbria 2 77.1 76.3 69.6 67.7 66.8 67.5 66.5 65.0 63.0 62.0 60.9 48.85 49.2 48.69 47.75
Cumbria - High Specification Aggregate (HSA)
~ ~ ~ ~ ~ ~ ~ ~ ~ ~ ~ 9.85 9.55 19.0 28.9
Lancashire 151.8 125.0 112.7 105.7 86.0 84.0 73.5 71.1 70.3 68.7 79.8 64.5 75.1 74.1 70.35
Cheshire 5/6
9.8 9.4 10.2 9.6 8.52 8.4 8.36 6.5 5.6 5.6 5.4 5.4 5.35 5.52 5.6 GtManchester/M’side/Halton/ Warrington
7/8
27.9 34.9 35.5 32.4 35.33 32.0 30.9 30.2 27.7 22.6 22.5 23.69 25.54 24.86 17.36
TOTAL SANDSTONE & IGNEOUS ROCK
266.6 245.6 228.0 215.4 196.65 191.9 179.3 172.8 166.6 158.9 168.4 152.92 164.77 172.17 169.96
TOTAL CRUSHED ROCK RESERVES 553.7 444.4 403.5 400.8 347.75 360.5 350.1 332.7 327.9 315.6 319.4 300.51 339.47 346.07 332.66
1 Excludes Limestone used for non-aggregate purposes 5 Prior to 1998 figures include Peak Park within Cheshire 2 Cumbria includes the Lake District National Park 6 Prior to 1998 figures include Halton and Warrington 3 Nil return from one site 7 Prior to 1998 figures exclude Halton and Warrington 4 Data up to and including AM94 include reserves for non-aggregate NB: Figures may include some estimates by MPAs and totals may not add up due to rounding.
Table 6: Monitoring of sand and gravel reserves – North West 1994 – 2008 (million tonnes)
AM94 AM95 AM96 AM97 AM98 AM99 AM00 AM01 AM02 AM03 AM04 AM05 AM06 AM07 AM08
LAND-WON SAND & GRAVEL
Cumbria 1 15.2 14.1 12.2 13.5 12.2 12.3 11.8 12.0 12.1 11.4 10.5 9.18 9.19 8.67 13.47
Lancashire 9.0 9.5 9.2 8.6 7.38 7.0 6.4 4.6 4.0 3.54 3.24 4.4 5.21 5.4 10.3
Cheshire 2 29.3 28.3 25.9 24.1 21.7 19.3 17.9 24.6 23.5 19.7 19.2 20.53 21.3 19.52 16.4
GtManchester/M’side/Halton/Warrington3 3.2 4.1 3.8 3.5 5.36 7.67 7.1 6.7 7.7 6.7 6.3 8.91 9.89 5.15 5.8
TOTAL LAND-WON SAND & GRAVEL RESERVES
56.7 56.7 51.1 49.7 46.64 46.27 43.2 47.9 47.3 41.34 39.24 43.02 45.59 38.74 45.97
1 Cumbria includes the Lake District National Park 3 Prior to 1998 figures exclude Halton and Warrington 2 Prior to 1998 figures include Halton and Warrington NB: Figures may include some estimates by MPAs and totals may not add up due to rounding. Figures exclude Borrow Pits.

13
Figure 2: Trends in primary aggregate sales in the North West 1995 – 2008 (million tonnes)
Total aggregate sales
4.3 Total aggregate sales declined during 2008 by approximately 14% from 13.08mt in 2007
to 11.17mt, the lowest recorded for fifteen years. Total aggregate sales had been increasing over the two previous survey years from 12.35mt in 2005 to 13.08mt in 2007.
Crushed rock sales
4.4 Total sales of crushed rock declined during the 2008 monitoring period by approximately
15%, from 9.42mt in 2007 to 8.02mt, the lowest recorded figure for fifteen years. Sales had been increasing since 2005 when a figure of 8.63mt was recorded. This year’s figure of 8.02mt is some 2.38mt short of the 2001-2016 regional apportionment figure of 10.4mt per annum2 for the North West region.
4.5 Sales of limestone decreased during 2008 in both Cumbria and Lancashire, by 10.7% from
5.8mt in 2007 to 5.18mt. This figure is broadly in line with those recorded since 2003.
4.6 Sales of sandstone and igneous rock have also decreased during the 2008 monitoring period by 21.6%, from 3.62mt in 2007 to 2.84mt. This is the lowest recorded figure for fifteen years. All parts of the region recorded a decrease in sales apart from Cumbria where an increase in sales of High Specification Aggregate (HSA) from 0.7mt in 2007 to 0.75mt was recorded, the highest recorded figure since 2005.
2 National and Regional Guidelines for Aggregates Provision in England: 2001-2016, ODPM June 2003
02468
101214161820
19
95
19
96
19
97
19
98
19
99
20
00
20
01
20
02
20
03
20
04
20
05
20
06
20
07
20
08
mill
ion
to
nn
es
Survey Year
Crushed Rock Sand & Gravel Marine Sand & Gravel Total Aggregate

14
Sand and gravel sales 4.7 Total sales of sand and gravel decreased during 2008 by 14%, from 3.66mt in 2007 to
3.15mt, the lowest recorded for over twenty years3.
4.8 Sales of land-won sand and gravel decreased during 2008 by 10%, from 3.0mt in 2007 to 2.69mt, this is also the lowest recorded figure for fifteen years. All areas of the region recorded declining sales during the 2008 monitoring period. This figure is 0.74mt below the 2001-2016 regional apportionment figure of 3.43mt4 per annum for the North West region.
4.9 Sales of marine dredged sand and gravel significantly decreased during the monitoring
period by 33%, from 0.66mt in 2007 to 0.44mt5. However, overall sales have remained above the annualised apportionment figure of 0.25mt. Lancashire recorded a considerable decline of 91%, from 0.12mt to 0.01mt, whilst Cumbria recorded an increase of 100%, from 0.01mt in 2007 to 0.02mt.
Total aggregate reserves
4.10 Total aggregate reserves decreased during 2008 by approximately 1.6%, from 384.8mt in
2007 to 378.63mt. However, reserves have remained relatively stable over the past three monitoring periods and have remained higher than those recorded between 2002 and 2005. Crushed rock reserves
4.11 Total reserves of crushed rock have decreased by 3.8% during 2008, from 346.07mt in
2007 to 332.66mt. Reserves are in line with the figure recorded, for the 2001 monitoring period, when a figure of 332.7mt was recorded.
4.12 Reserves of limestone have decreased by 6.4% from 173.9mt in 2007 to 162.7mt, but remain higher than figures recorded between 2002 and 2005. This fall in reserves is largely due to the reassessment at one quarry in Lancashire which has resulted in a reduction of 19mt in reserves. Reserves of limestone have increased in Cumbria by 7.4% from 102.5mt in 2007 to 110.05mt.
4.13 Reserves of sandstone and igneous rock (including HSA) have decreased by 1.3% during
2008 from 172.17mt in 2007 to 169.96mt. Cheshire and Cumbria recorded increased reserves by 1.5% and 13.2% respectively. All other parts of the region have experienced a decrease in reserves during the 2008 monitoring period, with the most sizeable reduction
3 Historical monitoring statistics are included as Appendix D
4 National and Regional Guidelines for Aggregates Provision in England: 2001-2016, ODPM June 2003
5 This does not include harbour authorities

15
being in the Greater Manchester/Merseyside/Halton/Warrington area where there was a significant decrease of 30.2% from 24.86mt in 2007 to 17.36mt, the lowest recorded figure for over twenty years. This reduction can be attributed to the unexpected closure of two sites and reassessment of reserves at another site resulting in a loss of 5.95mt in total.
Sand and gravel reserves
4.14 Total reserves of sand and gravel increased by 18.6% during the 2008 monitoring period,
from 38.74mt in 2007 to 45.97mt. Reserve figures remain higher than figures recorded since 1993 when a figure of 41.34mt was recorded. Lancashire experienced a considerable increase in reserves of 91% from 5.4mt in 2007 to 10.3mt. This increase is largely accounted for by a new permission being granted for the extraction of 4.2mt at Runshaw (Euxton). Cumbria also experienced a significant increase in reserves by 55.4% from 8.67mt in 2007 to 13.47mt due to permissions being granted at several sites. Greater Manchester/Merseyside/Halton/Warrington recorded an increase of 13% from 5.15mt in 2007 to 5.8mt, with reserves being released at Morleys Hall. Cheshire recorded a downturn in reserves of 16% from 19.52mt in 2007 to 16.4mt. This is due to the withdrawal of one site from the AM2008 monitoring survey, as the site had previously been included as a primary aggregate in error. Landbanks
4.15 Landbanks have been calculated using the guidelines published by the ODPM on 10th June
2003, ‘National and Regional Guidelines for Aggregate Provision in England 2001-2016’ (guidelines are included as Appendix E).
4.16 The total landbank for crushed rock as at 31st December 2008 is 31.98 years. This is 1.3 years lower than the previous year’s landbank of 33.28 years, but remains higher than in 2005 when a landbank of 28.9 years was recorded.
4.17 The total landbank for sand and gravel as at 31st December 2008 is 13.4 years. This is 1.93 years higher than the previous year’s landbank of 11.47 years, but remains lower than in 2006 when a landbank of 12.59 years was recorded.
4.18 More detailed information regarding the aggregate landbanks is included in Section 5 and
within Table 7 on page 22. Commentary on trends
4.19 Table’s 1-3 and Figure 2 illustrate the sales trends for primary aggregates across the North
West region since 1995. Figure 2 shows that total aggregate sales had been in general decline over the past fifteen years, apart from an upward turn in sales between 2005 and 2007. Total sales have fallen considerably during the 2008 monitoring period by 14.6%

16
from 13.08mt in 2008 to 11.17mt, the lowest recorded figure for over twenty years. This is the most significant decline in sales since 1996 when sales fell by 12% to 16.23mt from 18.45mt in 1995.
4.20 One of the central reasons behind the notable fall in sales is the financial crisis experienced in 2007 leading to recession during 2008. The recession has caused a downturn in house building and major development, resulting in a reduction in the demand for primary aggregate. Whilst the economy remains unstable it is likely that primary aggregate sales will remain at a reduced level. However, it should be noted that aggregate supply will play a vital role in the recovering economy.
4.21 The Aggregate Levy and landfill tax also remain as reasons behind the general trend of
declining sales since 2002. The Aggregate Levy was introduced in 2002 at a rate of £1.60 per tonne to establish the Sustainability Fund, an attempt at mitigating against the effects of quarrying e.g. dust, noise etc and encouraging the use of alternative materials. The Levy was increased to £1.95 per tonne on the 1st April 2008 and again on 1st April 2009 to £2.00 per tonne. Both the Aggregate Levy and the Landfill Tax have lead to an increased use of construction, demolition and excavation waste (CD&EW) and secondary resources.
4.22 Sales of crushed rock fell by approximately 15% from 9.42mt in 2007 to 8.02mt. Sales of
land-won sand and gravel fell by 14% from 3.66mt in 2007 to 3.15mt. Sales of marine dredged sand and gravel fell by 33% from 0.66mt in 2007 to 0.44mt.
4.23 Total aggregate reserves have decreased by 1.6% from 384.8mt in 2007 to 378.63mt. One
of the main reasons for the fall in reserves is the reassessment of limestone reserves at one quarry in Lancashire which resulted in a reduction of 19mt.
4.24 Figure 3 illustrates the distribution of aggregate sales across the North West region during
the 2008 monitoring period. Figures 4-6 provide a geographical illustration of the sites included in the AM08 survey; more detailed information is included within Section 8 (Sub-regional Profiles). Active sites are those sites which have permitted reserves and have carried out minerals development during the 2008 monitoring period, inactive sites are those sites which have permitted reserves but no minerals development has been carried out during the monitoring period.

17
Figure 3: Primary aggregate sales in the North West 2008 (million tonnes)
NB: For the purposes of mapping the areas of Merseyside, Halton and Warrington are included within the GtManchester sub-region

18
Figure 4: Active crushed rock sites in the North West 2008
NB: For the purposes of mapping the areas of Merseyside, Halton and Warrington are included within the GtManchester sub-region

19
Figure 5: Active sand and gravel sites in the North West 2008
NB: For the purposes of mapping the areas of Merseyside, Halton and Warrington are included within the GtManchester sub-region

20
Figure 6: Inactive crushed rock sites in the North West 2008
NB: For the purposes of mapping the areas of Merseyside, Halton and Warrington are included within the GtManchester sub-region

21
Figure 7: Inactive sand and gravel sites in the North West 2008
NB: For the purposes of mapping the areas of Merseyside, Halton and Warrington are included within the GtManchester sub-region

22
5 MONITORING OF PRIMARY AGGREGATE LANDBANKS 5.1 The method for calculating landbanks is set out in Paragraph 70, of ‘Minerals Planning
Policy 1: Planning and Minerals’ (MPS1), as: ‘The length of the landbank should be calculated using the expected provision (supply in response to demand) included in the development plan expressed on an annual basis’.
5.2 On 29th June 2009 the Department for Communities and Local Government published
revised national and regional guidelines for aggregate provision in England for the period 2005 – 2020. These revised guidelines are included within Appendix F. For the purposes of this report the landbanks have been calculated using the guidelines published by the ODPM on 10th June 2003, ‘National and Regional Guidelines for Aggregate Provision in England 2001 – 2016’, as they were still current during the AM08 period, they have also been included within Appendix E.
5.3 The regional landbanks as at 31st December 2008 calculated using the above method are
set out in Table 7:
Table 7: Monitoring of landbanks – North West 2008
Permitted Reserves as at
31.12.2008
2001-2016 Annual
Apportionment (mt/pa)
Landbank as at 31.12.2008
(years)
Crushed Rock 1
Cumbria 2 186.7 4.1 45.5
Lancashire 122.95 4.6 26.7
Cheshire 5.6 0.13 43.1
GtManchester/Merseyside/Halton/Warrington 17.36 1.65 10.5
Total Crushed Rock 332.61 10.4 31.98
Sand & Gravel 3
Cumbria 2 13.47 0.7 19.24
Lancashire 10.3 0.5 20.6
Cheshire 16.4 1.97 8.3
GtManchester/Merseyside/Halton/Warrington 5.8 0.26 22.3
Total Sand & Gravel 45.97 3.43 13.4
1 Includes figures for High Specification Aggregate (HSA) 2 Cumbria includes Lake District National Park 3 Data excludes marine aggregate reserves

23
5.4 Figures 8 and 9 illustrate primary aggregate sales against the annualised apportionment figures provided by the ‘National and Regional Guidelines for Aggregate Provision in England 2001 – 2016’. New guidelines published on 29th June 2009 are yet to be apportioned.
5.5 Figure 8 illustrates that sales of crushed rock have remained below the annualised apportionment figures since 1996. The annual apportionment was reduced in 2003, under revised guidelines6, from 12.55mt to 10.4mt which has resulted in sales more closely reflecting the annualised requirement.
5.6 Figure 9 illustrates that sales of sand and gravel have gradually declined since 1997 when
sales were in excess of the annualised apportionment figure of 4.65mt. The annual apportionment was reduced in 2003 in line with declining sales to 3.44mt. Since 2003 sales had been in excess of the annual apportionment requirement but have fallen sharply during the 2008 monitoring period to 0.75mt below the required figure.
6 National and Regional Guidelines for Aggregate Provision in England 2001 – 2016

24
Figure 8: Crushed rock sales against annualised apportionment in the North West 1995 – 2008 (million tonnes)
Figure 9: Sand and gravel sales against annualised apportionment in the North West 1995 – 2008 (million tonnes)
NB: Aggregate guidelines prior to 2003 are as specified within Annex A of Minerals Planning Guidance Note 6: Guidance for Aggregate Provision in England’ (MPG6) published in 1994. The aggregate guideline figure for 2003 reflects the revised national and regional guidelines for aggregate provision as published by the ODPM on the 10
th June 2003 (National and Regional Guidelines for Aggregate Provision in England 2001 – 2016).
0
2
4
6
8
10
12
14
19
95
19
96
19
97
19
98
19
99
20
00
20
01
20
02
20
03
20
04
20
05
20
06
20
07
20
08
mill
ion
ton
ne
s
Survey Year
Crushed Rock Sales 2001-2016 Apportionment
0
1
2
3
4
5
6
19
95
19
96
19
97
19
98
19
99
20
00
20
01
20
02
20
03
20
04
20
05
20
06
20
07
20
08
mill
ion
ton
ne
s
Survey Year
Sand & Gravel Sales 2001-2016 Apportionment

25
6 MARINE SAND & GRAVEL LANDINGS FROM OFF THE NORTH WEST COAST
Active dredging off the North West coast (including Penrhyn, North Wales) 6.1 During November 2009 The Crown Estate along with the British Marine Aggregates
Producers Association (BMAPA) published the reports ‘The area involved – 11th annual report’ and ‘Marine aggregates, The Crown Estate licences, Summary of statistics 2008’. The figures detailed in Tables 8 and 9 are taken from these reports.
6.2 There are currently 9 licences operating across 4 active dredge areas off the North West coast. An application has been made for a further dredge area (Area 457) in Liverpool Bay. Table 10, on page 28, contains details of these licences and Figure 11, on page 29, illustrates the position of the active and application dredge areas.
6.3 During the 2008 monitoring period a total of 728,182 tonnes of aggregate was removed
from off the North West coast, of which 432,889 was primary aggregate, 207,506 was secondary aggregate (contract fill) and 87,787 was removed from rivers (River Mersey)7. This figure is broadly in line with those recorded since 2005 and indicates that levels of extraction have remained fairly stable.
6.4 The authorised limit of removal currently stands at 1.38mt of primary aggregate per
annum. The total amount of aggregate removed from off the North West coast during 2008 represents 52% of the authorised limit. It is clear that the current level of extraction remains well below the authorised limit.
6.5 During the same period 505,031 tonnes of aggregate was landed from off the North West coast, representing 69% of the total aggregate extracted. This figure is approx 29.7% lower than the figure recorded for 2007 and is the lowest recorded since 2001. The total amount of material landed from off the North West coast does not equate to the total removed due to market forces, material is landed where it is needed and not necessarily at the closest wharf to where it was removed.
7 Data taken from Marine Aggregates The Crown Estate Licences Summary of Statistics 2008, The Crown Estate

26
Table 8: Marine dredged aggregate removed from off the North West coast
North West Region (inc Penrhyn N Wales) 1995 1996 1997 1998 1999 2000 2001 2002 2003 2004 2005 2006 2007 2008
Pri
mar
y Primary Aggregates removed ~ ~ ~ ~ ~ ~ ~ ~ ~ ~ 611,983 608,134 633,405 432,889
Rivers and Miscellaneous removed ~ ~ ~ ~ ~ ~ ~ ~ ~ ~ 124,506 111,687 109,399 87,787
Seco
nd
ary
Beach Nourishment removed ~ ~ ~ ~ ~ ~ ~ ~ ~ ~ 0 0 0 0
Contract Fill removed ~ ~ ~ ~ ~ ~ ~ ~ ~ ~ 0 0 0 207,506
Total Aggregates Removed ~ ~ ~ ~ ~ ~ ~ ~ ~ ~ 736,489 720,001 742,804 728,182
Authorised limit of removal (mt) pa ~ ~ ~ ~ ~ ~ ~ ~ ~ ~ 1.38 1.38 1.38 1.38
~ Data not available Data taken from the report ‘Marine aggregates, The Crown Estate Licences, Summary of statistics’ 2005, 2006, 2007 and 2008.
Table 9: Marine dredged aggregate landed from off the North West coast
Landing Point 1995 1996 1997 1998 1999 2000 2001 2002 2003 2004 2005 2006 2007 2008
Engl
and
Barrow ~ ~ ~ ~ ~ ~ 30,000 42,835 42,835 21,049 20,206 22,321 14,890 23,319
Eastham ~ ~ ~ ~ ~ 43,046 71,615 74,055 75,000 99,079 124,506 111,687 109,399 87,787
Heysham ~ ~ ~ ~ 53,848 75,376 105,982 129,719 105,812 95,550 95,285 138,088 119,767 11,930
Liverpool 222,610 247,197 246,598 231,072 243,882 179,444 253,382 260,258 237,262 385,886 428,842 373,812 428,635 327,094
Wal
es
Penrhyn 54,483 40,054 36,939 43,510 57,314 61,270 44,951 66,334 51,311 52,307 47,257 46,091 46,002 54,901
Total landed from off North West coast
277,093 287,251 283,537 274,582 355,044 359,136 505,930 573,201 512,220 653,871 716,096 691,999 718,693 505,031
Total landed excluding Penrhyn (N Wales)
222,610 247,197 246,598 231,072 297,730 297,866 460,979 506,867 460,909 601,564 668,839 645,908 672,691 450,130

27
Figure 10: Marine dredged aggregate landings from off the North West coast
-
100,000
200,000
300,000
400,000
500,000
600,000
700,000
800,000
19
95
19
96
19
97
19
98
19
99
20
00
20
01
20
02
20
03
20
04
20
05
20
06
20
07
20
08
ton
ne
s
Survey Year
Eastham Liverpool Heysham Barrow Penrhyn Total Landings
Landings from off the North West coast (excluding Penrhyn, North Wales)
6.6 Landings from off the North West coast (excluding Penrhyn, North Wales) during the 2008
monitoring period amounted to 450,130 tonnes. This figure is approximately 33% lower than the figure recorded for 2007 and is the lowest since 2001. The most central reason for this downturn is the general slowing of construction activity in the North West region, due to the slowing of the wider economy, and increased demands for marine dredged aggregate elsewhere in the UK during the 2008 monitoring period. Barrow
6.7 During 2008, 23,319 tonnes of aggregate was landed at Barrow from off the North West coast. This is an increase of approximately 56% from 14,890 tonnes in 2007. This figure remains below figures recorded between 2001–2003 but does however bring landings back in line with those recorded since 2004. Eastham
6.8 Landings at Eastham have been slowly declining since 2005 when they were recorded at their highest at 124,506. Landings have again decreased during 2008 to 87,787, a fall of 21,612 tonnes (approximately 19%). However, landings remain broadly in line with figures recorded between 2001–2004.

28
Heysham
6.9 Landings at Heysham have significantly decreased during the 2008 monitoring period from 119,767 tonnes in 2007 to 11,930 tonnes, a decline of approximately 90%. This is the lowest recorded figure since 1999 when a figure of 53,848 was recorded. The main reason for this decline is the increased demand for marine dredged aggregate in Barrow where landings increased by approximately 56%. Liverpool
6.10 Landings at Liverpool have decreased by approximately 23% from 428,635 tonnes in 2007 to 327,094 during 2008, a decline of 101,541 tonnes. However, landings remain higher than those recorded between 1995–2003 and are broadly in line with figures recorded since 2004.
Summary
6.11 Table 8 details quantities of aggregate removed from off the North West coast during
2008 categorised by aggregate type, Table 9 details landings by port. Both tables use statistics published by the Crown Estate and the British Marine Aggregates Producers Association (BMAPA). Figure 10 plots the landings of marine aggregate since 1995 and Figure 11 illustrates the location of the applications pending, active and licensed dredging grounds off the North West coast, Table 10 provides details of these licenses. Table 10: Marine dredged aggregate license holders
Active Dredge Area License Holders
No Operator Approximate Centre Point Co-Ordinates Status
175/1 Norwest Sand & Ballast Co. Ltd 03 02.6151 W 53 27.1463 N Active
193/1 CEMEX UK Materials Ltd 03 02.6151 W 53 27.1463 N Active
195/1 Tarmac Marine Dredging Ltd 03 02.6151 W 53 27.1463 N Active
175/2 Norwest Sand & Ballast Co. Ltd 03 01.7218 W 53 26.3069 N Active
193/2 CEMEX UK Materials Ltd 03 01.7218 W 53 26.3069 N Active
195/2 Tarmac Marine Dredging Ltd 03 01.7218 W 53 26.3069 N Active
331 Tarmac Marine Dredging Ltd 03 52.2050 W 54 12.1980 N Active
392 Tarmac Marine Dredging Ltd 03 26.2040 W 53 27.4050 N Active
393 Norwest Sand & Ballast Co. Ltd 03 26.2040 W 53 27.4050 N Active
457 Westminster Gravels Ltd 03 32.3590 W 53 36.9250 N Yet to commence

29
Figure 11: Applications pending, licensed dredging grounds and landing points in North West coastal waters
NB: Merseyside is part of the GtManchester sub-region

30
7 MONITORING OF PLANNING APPLICATIONS 7.1 The monitoring of planning applications provides essential information on new
permissions and reserves. If problems arise in meeting landbank requirements, monitoring of planning applications provides one means of identifying the causes.
7.2 Table 11 gives details of planning applications received for aggregate extraction in the North West region, granted or refused planning permission during the period 1st January 2008 to 31st December 2008. During the monitoring period all application were granted permission. Table 12 provides details of planning applications pending as at 31st December 2008. More detailed information regarding planning applications determined and pending is included within the sub-regional profiles.
Table 11: Monitoring of mineral planning applications determined 1
st January 2008 - 31
st December 2008
Crushed Rock (mt) Sand & Gravel (mt)
Granted Refused Granted Refused
Cheshire ~ ~ 0.9 ~
Cumbria 18.9 ~ 6.27 ~
Lancashire ~ ~ 4.2 ~
GtManchester ~ ~ 0.175 ~
Merseyside ~ ~ ~ ~
Warrington ~ ~ ~ ~
Total 18.9mt ~ 11.545mt ~
Table 12: Monitoring of mineral planning applications pending as at 31
st December 2008
Crushed Rock (mt) Sand & Gravel (mt)
Cheshire ~ 3.0
Cumbria 5.2 ~
Lancashire ~ 0.76
GtManchester 0.4 1.4
Merseyside 1.06 ~
Warrington ~ ~
Total 6.66mt 5.16mt

31
8 SUB-REGIONAL PROFILES CHESHIRE 8.1 On the 1st April 2009 Cheshire County Council and the six district councils were abolished
and replaced by the two new unitary authorities of Cheshire East and Cheshire West and Chester. This report deals with minerals activity during the period 1st January to 31st December 2008 and therefore Cheshire is treated as one authority area. Total aggregate sales
8.2 Table 13 illustrates total primary aggregate sales in Cheshire 1994-2008. Figure 12
illustrates primary aggregate sales in Cheshire compared to the annualised apportionment as per the National and Regional Guidelines for Aggregate Provision in England 2001-2016. Figure 12: Cheshire primary aggregate sales against annualised apportionment
8.3 Total aggregate sales in Cheshire decreased during the 2008 monitoring period by 22.7% from 1.54mt in 2007 to 1.19mt. This is the lowest recorded for over twenty years apart from in 2004 when a figure of 1.15 was recorded. Total aggregate reserves
8.4 Table 14 illustrates total primary aggregate reserves in Cheshire 1994-2008. Reserves in Cheshire decreased by 12% during the 2008 monitoring period, from 25.04mt in 2007 to 22mt. This is the lowest recorded reserve figure for over twenty years.
0
0.5
1
1.5
2
2.5
20
04
20
05
20
06
20
07
20
08
mill
ion
to
nn
es
Survey Year
Crushed Rock Production
2001-2016 Crushed Rock Apportionment
Sand & Gravel Production
2001-2016 Sand & Gravel
Apportionment

32
Table 13: Monitoring of total primary aggregate sales –Cheshire sub-region 1994 – 2008 (million tonnes)
AM94 AM95 AM96 AM97 AM98 AM99 AM00 AM01 AM02 AM03 AM04 AM05 AM06 AM07 AM08
LAND-WON SAND & GRAVEL
Land-won Sand & Gravel 3.2 2.9 2.65 2.56 2.3 2.48 2.33 1.7 1.4 1.4 1.1 1.58 1.44 1.51 1.17
TOTAL SAND & GRAVEL SALES 3.2 2.9 2.65 2.56 2.3 2.48 2.33 1.7 1.4 1.4 1.1 1.58 1.44 1.51 1.17
CRUSHED ROCK
Sandstone & Igneous Rock 1.0 0.6 0.44 0.29 0.1 0.1 0.1 0.1 0.01 0.02 0.05 0.03 0.05 0.03 0.02
TOTAL CRUSHED ROCK SALES 1.0 0.6 0.44 0.29 0.1 0.1 0.1 0.1 0.0 0.02 0.1 0.03 0.05 0.0 0.02
TOTAL AGGREGATE SALES 4.20 3.50 3.09 2.85 2.40 2.58 2.43 1.80 1.41 1.42 1.15 1.61 1.49 1.54 1.19
NB Data up to and including AM98 includes Peak Park, Halton and Warrington within Cheshire
Table 14: Monitoring of total primary aggregate reserves –Cheshire sub-region 1994 – 2008 (million tonnes)
AM94 AM95 AM96 AM97 AM98 AM99 AM00 AM01 AM02 AM03 AM04 AM05 AM06 AM07 AM08
SAND & GRAVEL
Land-won Sand & Gravel 29.3 28.3 25.9 24.1 21.7 19.3 17.9 24.6 23.5 19.7 19.2 20.53 21.3 19.52 16.4
TOTAL SAND & GRAVEL RESERVE 29.3 28.3 25.9 24.1 21.7 19.3 17.9 24.6 23.5 19.7 19.2 20.53 21.3 19.52 16.4
CRUSHED ROCK
Sandstone & Igneous Rock 9.8 9.4 10.2 9.6 8.52 8.4 8.36 6.5 5.6 5.6 5.4 5.4 5.35 5.52 5.6
TOTAL CRUSHED ROCK RESERVE 9.8 9.4 10.2 9.6 8.5 8.4 8.36 6.5 5.6 5.6 5.4 5.4 5.35 5.5 5.6
TOTAL AGGREGATE RESERVE 39.1 37.7 36.1 33.7 30.22 27.7 26.26 31.1 29.1 25.3 24.6 25.93 26.65 25.04 22.0
NB Data up to and including AM98 includes Peak Park, Halton and Warrington within Cheshire

33
Crushed rock 8.5 Total crushed rock sales decreased by 0.01mt during the 2008 monitoring period, a fall of
approximately 33% from 0.03mt in 2007 to 0.02mt. This is below the annualised requirement of 0.13mt but is consistent with figures recorded from 1998-2003.
8.6 Reserves of crushed rock increased during the 2008 monitoring period by 1.5% from 5.52mt in 2007 to 5.6mt. This figure is 0.1mt higher than would have been expected given the low levels of sales during 2008. However, there have been some reassessments of reserves during the monitoring period that have lead to a small increase in reserves at some quarries.
8.7 The landbank for crushed rock as at 31st December 2008 is 43.1 years. The landbank
therefore remains largely unchanged from 42.5 years as at 31st December 2007.
Sand and gravel
8.8 Total sand and gravel sales decreased by 0.34mt during the 2008 monitoring period, a fall of approximately 22.5% from 1.51mt in 2007 to 1.17mt. This is below the annualised requirement of 1.97mt and is the lowest recorded figure for over twenty years apart from 2004 when a figure of 1.1 was recorded.
8.9 Reserves of sand and gravel have decreased during 2008 by 16% from 19.52mt in 2007 to 16.4mt, the lowest recorded figure for over twenty years. This is approximately 1.95mt lower than what would have been expected given the low levels of sales during 2008. This reduction in reserve figure is due to the withdrawal of one site from the AM2008 monitoring survey. This site had previously been counted as primary aggregate in error.
8.10 The landbank for sand and gravel as at 31st December 2008 is 8.3 years. This is 1.6 years
lower than at 31st December 2007. This reduction in landbank can be attributed to the withdrawal of one site from the annual monitoring survey as mentioned above.
Construction activity
8.11 Significant investment continued during 2008 especially in Chester where the
development of the HQ building was completed along with several other schemes commencing, including the Delamere Street Development, a £34m development of new housing, office and retail accommodation; and The Old Port housing development.

34
Table 15: Cheshire sites included in AM2008 aggregate monitoring survey
No Site Name Grid Reference Operator Aggregate Type Status
1 Sycamore Quarry SJ 939 764 A.M & D Earl Sandstone Active
2 Endon Quarry SJ 941 760 Park Skip HireSandstone and
GritstoneActive
3 Bridge Quarry SJ 939 767 Multigrove Limited Sandstone Active
4 Marksend SJ 942 757 A.M & D Earl Gritstone Active
5 Gawsworth SJ 705 869 Wyman Limited Gritstone Active
6 Lee Hills SJ 928 691 Mr R Rathbone Gritstone Inactive
7 Rough Hey SJ 923 683 Wyman Limited Gritstone Inactive
8 Bridestones SJ 909 700 Bridestone Stone Sandstone Active
No Site Name Grid Reference Operator Aggregate Type Status
8 Town Farm SJ 565 740 Marchington Stone Limited Sand & Gravel Active
9 Forest Hill SJ 611 717 CEMEX RMC Ltd Sand & Gravel Active
10 Mere Farm SJ 834 744Hanson Quarry Products
Europe LtdSand & Gravel Active
11 Fourways SJ 572 693 Tarmac Ltd Sand & Gravel Active
12 Cherry Orchard SJ 568 680 Cherry Orchard Sand Unit Sand & Gravel Active
13 White Moss SJ 775 548 Land Recovery Limited Sand & Gravel Active
No Site Name Grid Reference Operator Aggregate Type Status
14 Dingle Bank SJ 815 748 Sibelco UK Ltd Slica Sand Active
15 Eaton Hall SJ 861 643 Tarmac Ltd Silica Sand Active
16 Bent Farm SJ 828 623 Sibelco UK Ltd Silica Sand Active
17 Arclid Hall SJ 786 613 Bathgate Silica Sand Ltd Silica Sand Active
18 Far Arclid SJ 785 615 Bathgate Silica Sand Ltd Silica Sand Inactive
No Site Name Grid Reference Operator Aggregate Type Status
19 Crown Farm SJ 575 703 Tarmac Ltd Construction Sand Active
20 Delamere SJ 564 698 Tarmac Ltd Construction Sand Inactive
21 Cobden Farm SJ 585 675 Tarmac Ltd Construction Sand Active
22 Hough Mill SJ 702 492 Anthony Construction Ltd Construction Sand Restoration
Crushed Rock Sites
Sand & Gravel Sites
Silica Sand Sites
Sand Sites
!
#
!
"

35
Figure 13: Spatial distribution of minerals working in Cheshire 2008

36
CUMBRIA 8.12 For the purposes of RAWP annual monitoring, the Cumbria sub-region includes the Lake
District National Park. Total aggregate sales
8.13 Table 16 illustrates total primary aggregate sales in Cumbria 1994-2008. Figure 14
illustrates primary aggregate sales in Cumbria against the annualised apportionment requirements as per the National and Regional Guidelines for Aggregate Provision in England 2001-2016.
Figure 14: Cumbria primary aggregate sales against annualised apportionment
8.14 Total aggregate sales in Cumbria decreased during the 2008 monitoring period by 5%, from 4.91mt in 2007 to 4.66mt8. This figure is broadly in line with figures recorded since 2003.
Total aggregate reserves
8.15 Table 17 illustrates total primary aggregate reserves in Cumbria 1994-2008. Total
aggregate reserves in Cumbria increased during 2008 by 11.9%, from 178.86mt to 200.17mt. This is the highest recorded reserve figure since 1997 when a figure of 203.1mt was recorded. The rise in reserve figures can be attributed to the granting of several permissions for the extraction of significant amounts of primary aggregate during 2008 (Appendix B).
8 Includes harbour authorities and marine dredged sand and gravel sales
0
0.5
1
1.5
2
2.5
3
3.5
4
4.5
2004 2005 2006 2007 2008
mill
ion
tonn
es
Survey Year
Crushed Rock Production
2001-2016 Crushed Rock Apportionment
Sand & Gravel Production
2001-2016 Sand &
Gravel Apportionment

37
Table 16: Monitoring of total primary aggregate sales –Cumbria sub-region 1994 – 2008 (million tonnes)
AM94 AM95 AM96 AM97 AM98 AM99 AM00 AM01 AM02 AM03 AM04 AM05 AM06 AM07 AM08
SAND & GRAVEL
Land-won Sand & Gravel 1.1 0.9 0.8 0.8 0.9 0.9 0.8 0.7 0.9 1.0 0.8 0.7 0.79 0.87 0.77
Marine Dredged Sand & Gravel ~ ~ ~ ~ ~ ~ ~ 0.03 0.04 0.04 0.02 0.02 0.02 0.01 0.02
Harbour Authorities Sand & Gravel ~ ~ ~ ~ ~ ~ ~ ~ 0.1 0.03 ~ ~ 0.02 ~ 0.02
TOTAL SAND & GRAVEL SALES 1.1 0.9 0.8 0.8 0.9 0.9 0.8 0.7 1.04 1.1 0.82 0.72 0.83 0.88 0.81
CRUSHED ROCK
Limestone1
4.8 3.8 3.2 3.5 3.22
3.4 3.4 3.0 2.9 2.6 2.8 2.6 2.7 2.8 2.7
Sandstone & Igneous Rock 0.8 0.8 0.7 0.7 0.8 0.8 1 1.1 1.1 1.1 1.1 0.36 0.27 0.53 0.4
High Specification Aggregate (HSA) ~ ~ ~ ~ ~ ~ ~ ~ ~ ~ ~ 0.74 0.69 0.7 0.75
TOTAL CRUSHED ROCK SALES 5.6 4.6 3.9 4.2 4.0 4.2 4.4 4.1 4.0 3.7 3.9 3.7 3.66 4.0 3.85
TOTAL AGGREGATE SALES 5.6 4.6 3.9 4.2 4.0 4.2 4.4 4.1 4.0 3.7 3.9 3.7 3.66 4.03 3.85
1 Excludes limestone for non-aggregate purposes 2 Nil return from one site NB Cumbria includes the Lake District National Park
Table 17: Monitoring of total primary aggregate reserves –Cumbria sub-region 1994 – 2008 (million tonnes)
AM94 AM95 AM96 AM97 AM98 AM99 AM00 AM01 AM02 AM03 AM04 AM05 AM06 AM07 AM08
LAND-WON SAND & GRAVEL
Land-won Sand & Gravel 15.2 14.1 12.2 13.5 12.2 12.3 11.8 12.0 12.1 11.4 10.5 9.18 9.19 8.67 13.47
TOTAL SAND & GRAVEL RESERVE 15.2 14.1 12.2 13.5 12.2 12.3 11.8 12.0 12.1 11.4 10.5 9.18 9.19 8.67 13.47
CRUSHED ROCK
Limestone 177.6 143.9 111.7 121.9 91.7 111.8 116.7 106.0 102.0 99.2 96.1 97.9 97.7 102.5 110.05
Sandstone & Igneous Rock 77.1 76.3 69.6 67.7 66.8 67.5 66.5 65.0 63.0 62.0 60.9 48.85 49.2 48.69 47.75
High Specification Aggregate (HSA) ~ ~ ~ ~ ~ ~ ~ ~ ~ ~ ~ 9.85 9.55 19.0 28.9
TOTAL CRUSHED ROCK RESERVE 254.7 220.2 181.3 189.6 158.5 179.3 183.2 171.0 165.0 161.2 157.0 156.6 156.5 170.2 186.7
TOTAL AGGREGATE RESERVE 269.9 234.3 193.5 203.1 170.7 191.6 195.0 183.0 177.1 172.6 167.5 165.78 165.64 178.86 200.17
1 Excludes limestone for non-aggregate purposes NB Cumbria includes the Lake District National Park

38
Crushed Rock 8.16 Sales of crushed rock decreased by 4.5% during the 2008 monitoring period, from 4.03mt
in 2007 to 3.85mt. This is in line with sales recorded for 2004-2006 but remains slightly below the annualised requirement of 4.1mt.
8.17 Sales of limestone decreased by 3.5% from 2.8mt in 2007 to 2.7mt. This is in line with the slight decrease in overall crushed rock sales. Sales of igneous rock and HSA also decreased by 6.5% from 1.23mt in 2007 to 1.15mt.
8.18 Overall reserves of crushed rock increased by 9.7% from 170.19mt in 2007 to 186.7mt,
the highest recorded figure since 1997 when a figure of 189.6mt was recorded. This increase is in line with the recorded increase in total aggregate reserves.
8.19 Reserves of limestone have increased by approximately 7.4% from 102.5mt in 2007 to
110.05mt; bringing reserves back in line with those recorded in 2000. This rise is due to the release of 8.2mt of limestone at Tendley Quarry and 10.7mt of HSA at Roan Edge. Reserves of igneous rock and HSA have increased by 13.2% from 67.69mt in 2007 to 76.65 but remain higher than figures recorded for 2001-2006.
8.20 The landbank for crushed rock as at 31st December 2008 is 45.5 years. The landbank has
increased by 4 years, from 41.5 years as at 31st December 2007.
Sand and gravel 8.21 Sales of land won sand and gravel decreased by 11.5% during 2008 from 0.87mt in 2007
to 0.77mt, however this remains above the annualised requirement of 0.7mt and is in line with figures recorded for 2005 and 2006.
8.22 Reserves of sand and gravel have increased by 55% during the 2008 monitoring period from 8.67mt in 2007 to 13.47mt. This increase is largely due to the granting of permission at three sites for the extraction of a total of 6.27mt, further details are recorded in Appendix B.
8.23 The landbank for land won sand and gravel as at 31st December 2008 is 19.24 years. The landbank has increased by 6.84 years, from 12.4 years as at 31st December 2007. This is again due to permissions being granted for the extraction of 6.27mt. Construction Activity
8.24 During the 2008 monitoring period several road projects were completed (High/Low
Newton, Temple Sowerby and Distington By-passes). Work also commenced on Vault 9 storage facility at Low Level Waste Repository Limited, a development that will provide 100,000m3 of storage capacity for nuclear waste.

39
Table 18: Cumbria sites included in AM2008 aggregate monitoring survey
No Site Name Grid Reference Operator Aggregate Type Status
1 Shap Blue NY 564 106 CEMEX RMC (UK) Ltd Igneous Rock Active
2 Shap Pink Quarry NY 555 084 CEMEX RMC (UK) Ltd Igneous Rock Inactive
No Site Name Grid Reference Operator Aggregate Type Status
3 Silvertop Quarry NY 586 602W & M Thomspon
(Quarries) LimitedLimestone Active
4 Snowhill Quarry SD 280 387 Mr M Smallwood Limestone Inactive
5 Moota Quarry NY 148 361 CEMEX RMC (UK) Ltd Limestone Active
6 Tendley Quarry NY 088 288 Tendley Quarries Ltd Limestone Active
7 Eskett & Rowrah NY 054 167 Aggregate Industries UK Limestone Active
8 Flusco NY 464 293 Lakeland Minerals Ltd Limestone Inactive
9 Shap Beck NY 550 181Hanson Quarry Products
Europe LtdLimestone Active
10 Shapfell NY 587 138Corus Construction and
Industrial BusinessesLimestone Active
11 Helbeck Quarry NY 799 158Sherburn Stone Company
LtdLimestone Active
12 Hartley Quarry NY 787 083 CEMEX RMC (UK) Ltd Limestone Active
13 Kendal Fell Quarry SD 502 925 Tarmac Ltd Limestone Inactive
14 Sandside Quarry SD 482 807 Tarmac Ltd Limestone Active
15 Holme Park SD 536 788 Aggregate Industries UK Limestone Active
16 Goldmire Quarry SD 219 739 Neil Price Limited Limestone Active
17 Stainton Quarry SD 246 729 Tarmac Ltd Limestone Active
No Site Name Grid Reference Operator Aggregate Type Status
18 Kirkhouse Quarry NY 564 601 Lakeland Minerals Ltd Sand & Gravel Active
19 Low Gelt NY 523 587Hanson Quarry Products
Europe LtdSand & Gravel Active
20 Faugh No 1 Sand Pit NY 512 552Hanson Quarry Products
Europe LtdSand & Gravel Active
21 Brocklewath Farm NY 348 551 William Roper Sand & Gravel Active
22 Faugh No2 Sand Pit NY 510 548 No Details Held Sand & Gravel Inactive
Igneous Rock Sites
Limestone Sites
Sand and Gravel Sites
#
#
!

40
23 Cardewmires Quarry NY 343 505 Tarmac Ltd Sand & Gravel Active
24 Highfield NY 511 252 D A Harrison Sand & Gravel Active
25 Overby No2 Sand Pit NY 125 470 Thomas Armstrong Ltd Sand & Gravel Active
26 Aldoth Quarry NY 146 482 D A Harrison Sand & Gravel Active
27 New Cowper NY 118 458 Thomas Armstrong Ltd Sand & Gravel Active
28 Bullgill Sand Pit NY 095 388 Thomas Armstrong Ltd Sand & Gravel Restoration
29 Low Plains NY 490 410 Tarmac Ltd Sand & Gravel Active
30 Bonnie Mount Quarry NY 548 313 JEA & SM Burne Sand & Gravel Active
31 Peel Place Quarry SD 069 011 Tendley Quarries Ltd Sand & Gravel Active
32 Roosecote Sand Pit SD 224 687 L & W Wilson (Endmoor) Sand & Gravel Active
No Site Name Grid Reference Operator Aggregate Type Status
33 Roan Edge SD 584 926 CEMEX RMC (UK) Ltd HSA Active
34 Holmescales SD 556 869 Aggregate Industries UK HSA Active
35 Ghyll Scaur SD 171 828 Aggregate Industries UK HSA Active
HSA Sites!
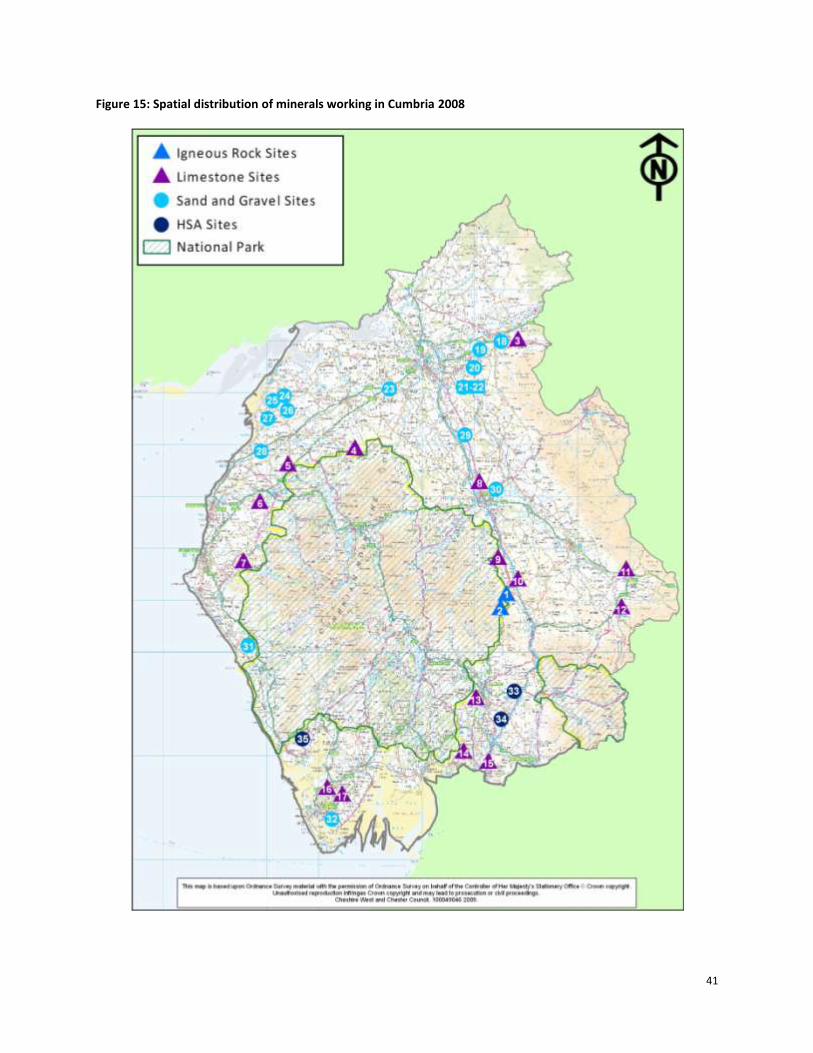
41
Figure 15: Spatial distribution of minerals working in Cumbria 2008

42
LANCASHIRE Total aggregate sales
8.25 Table 19 illustrates total primary aggregate sales in Lancashire 1994-2008. Figure 16
illustrates primary aggregate sales in Lancashire compared to the annualised requirements as per the National and Regional Guidelines for Aggregate Provision in England 2001-2016.
Figure 16: Lancashire primary aggregate sales against annualised apportionment
8.26 Total aggregate sales in Lancashire decreased during the 2008 monitoring period by
19.7% from 4.71mt in 2007 to 3.78mt9. This is the lowest recorded figure for over twenty years.
Total aggregate reserves
8.27 Table 20 illustrates total primary aggregate reserves in Lancashire 1994-2008. Total
aggregate reserves decreased by 11.7% from 150.9mt in 2007 to 133.25mt during 2008, but remain higher than figures recorded for 2005 when total aggregate reserves were recorded at 119.22mt. This is largely due to the reassessment of limestone reserves at one quarry which has led to a reduction of 19mt.
9 Includes harbour authorities and marine dredged sand and gravel sales
0
0.5
1
1.5
2
2.5
3
3.5
4
4.5
5
2004 2005 2006 2007 2008
mill
ion
tonn
es
Survey Year
Crushed Rock Production
2001-2016 Apportionment
Sand & Gravel Production
2001-2016
Apportionment

43
Table 19: Monitoring of total primary aggregate sales –Lancashire sub-region 1994 – 2008 (million tonnes)
AM94 AM95 AM96 AM97 AM98 AM99 AM00 AM01 AM02 AM03 AM04 AM05 AM06 AM07 AM08
LAND-WON SAND & GRAVEL
Land-won Sand & Gravel 0.77 0.8 0.8 0.91 0.66 0.48 0.34 0.5 0.5 0.46 0.44 0.38 0.34 0.33 0.31
Marine Dredged Sand & Gravel ~ ~ ~ ~ ~ 0.05 0.07 0.18 0.13 0.11 0.1 0.12 0.1 0.12 0.01
TOTAL SAND & GRAVEL SALES 0.77 0.8 0.8 0.91 0.66 0.53 0.41 0.68 0.63 0.57 0.54 0.50 0.44 0.45 0.32
CRUSHED ROCK
Limestone1
4.3 3.5 2.9 3.0 2.7 2.6 2.7 2.6 2.7 2.6 2.7 2.5 2.6 3.0 2.48
Sandstone & Igneous Rock 2.7 2.8 2.63 2.17 2.1 1.8 1.7 1.9 2.2 1.6 1.3 1.2 1.0 1.26 0.98
TOTAL CRUSHED ROCK SALES 7.0 6.30 5.53 5.17 4.80 4.40 4.40 4.50 4.90 4.20 4.00 3.70 3.60 4.26 3.46
TOTAL AGGREGATE SALES 7.77 7.10 6.33 6.08 5.46 4.93 4.81 5.18 5.53 4.77 4.54 4.20 4.04 4.71 3.78
1 Excludes limestone for non-aggregate purposes
Table 20: Monitoring of total primary aggregate reserves –Lancashire sub-region 1994 – 2008 (million tonnes)
AM94 AM95 AM96 AM97 AM98 AM99 AM00 AM01 AM02 AM03 AM04 AM05 AM06 AM07 AM08
SAND & GRAVEL
Land-won Sand & Gravel 9.0 9.5 9.2 8.6 7.38 7.0 6.4 4.6 4.0 3.54 3.24 4.4 5.21 5.4 10.3
TOTAL SAND & GRAVEL RESERVE 9.0 9.5 9.2 8.6 7.38 7.0 6.4 4.6 4.0 3.54 3.24 4.4 5.21 5.4 10.30
CRUSHED ROCK
Limestone1 93.3 65.9 63.8 63.5 59.4 56.8 54.1 53.9 59.3 57.5 54.7 50.32 77.0 71.4 52.6
Sandstone & Igneous Rock 151.8 125.0 112.7 105.7 86.0 84.0 73.5 71.1 70.3 68.7 79.8 64.5 75.1 74.1 70.35
TOTAL CRUSHED ROCK RESERVE 245.1 190.9 176.5 169.2 145.4 140.8 127.6 125.0 129.6 126.2 134.5 114.8 152.1 145.5 122.95
TOTAL AGGREGATE RESERVE 254.1 200.4 185.7 177.8 152.78 147.8 134.0 129.6 133.6 129.74 137.74 119.22 157.34 150.9 133.25
1 Data up to and including AM94 include reserves for non-aggregate

44
Crushed rock
8.28 Total crushed rock sales decreased during 2008 by 19% from 4.26mt in 2007 to 3.45mt. This is the lowest recorded sales figure for over twenty years and is 1.15mt below the annualised requirement of 4.6mt.
8.29 Sales of limestone also decreased during 2008 by 18% from 3.0mt in 2007 to 2.46mt. Again this is the lowest recorded figure for over twenty years. The economic recession has had a detrimental effect on primary aggregate sales in England and could be a reason for the downturn in sales of limestone in Lancashire.
8.30 Sales of sandstone and gritstone also decreased during 2008 in line with overall crushed
rock sales by 21% from 1.26mt in 2007 to 0.99mt. As with overall crushed rock sales and sales of limestone, this is the lowest sales figure recorded for over twenty years.
8.31 Total reserves of crushed rock decreased during 2008 by 15.5% from 145.5mt to
122.95mt. This is largely due to the reassessment of limestone reserves at one quarry which has led to a reduction of 19mt. However reserves remain higher than in 2005 when a figure of 114.82mt was recorded.
8.32 Limestone reserves decreased significantly during 2008 by 26.3% from 71.4mt during
2007 to 52.6mt. The reassessment of reserves at one site has lead to this reduction in limestone reserves as stated above.
8.33 Reserves of sandstone and gritstone decreased by 5.1% during 2008 from 74.1mt in 2007 to 70.35mt. This is 2.77mt lower than would have been expected given the low levels of sales during 2008.
8.34 The landbank for crushed rock as at 31st December 2008 is 26.7 years. The landbank has decreased by 4.9 years from 31.6 years as at 31st December 2007.
Sand and gravel
8.35 Total land won sand and gravel sales decreased by 0.02mt during 2008 from 0.33mt in
2007 to 0.31mt, a fall of approximately 6%. This is also 0.19mt below the annualised requirement of 0.5mt and continues the downward turn in sales since 2005.
8.36 Reserves of sand and gravel have increased considerably by 90% during 2008 from 5.4mt in 2007 to 10.3mt. This is largely due to permission being granted for the extraction of 4.2mt of land won sand at Runshaw (Euxton) Quarry.
8.37 The landbank for sand and gravel as at 31st December 2008 is 20.6 years. The landbank
has increased by 8.6 years from 12.0 years as at 31st December 2007. This increase is largely due to the release of reserves at Runshaw (Euxton) Quarry.

45
Construction Activity
8.38 Despite the downturn in the economy during the monitoring period some significant
construction programmes have continued to progress. Construction of several large scale housing and industrial sites has continued during 2008 along with regeneration programmes in some coastal areas. East Lancashire saw substantial housing clearance and refurbishment activity supported by private sector investment. There has also been notable investment in renewable energy infrastructure including biomass and onshore wind capacity.
8.39 Significant development was also seen as a result of the Government funded programme Building Schools for the Future (BSF). Over 20 schools are undergoing redevelopment under the programme, including provision of 9 new purpose-built sites with a considerable construction programme during 2008.

46
Table 21: Lancashire sites included in AM2008 aggregate monitoring survey
No Site Name Grid Reference Operator Aggregate Type Status
1 Waddington Fell SD 717 477 Aggregate Industries UK LtdSandstone and
GritstoneActive
2 Leeming SD 683 406 Brown Bros (Longridge) LtdSandstone and
GritstoneActive
3 Whinney Hill Quarry SD 758 306 Park Royal Haulage LtdSandstone and
GritstoneActive
4 Deerplay Ford SD 758 235 Waste Recycling Group LtdSandstone and
GritstoneInactive
5 Jamestone Quarry SD 756 233 Aggregate Industries UK LtdSandstone and
GritstoneInactive
6Withnell Gritstone
(Brinscall Quarry)SD 634 215 Armstrongs Aggregates Ltd
Sandstone and
GritstoneActive
7 Whitworth Quarry SD 875 203 Aggregate Industries UK LtdSandstone and
GritstoneActive
8 Scout Moor SD 815 190 Marshalls Natural StoneSandstone and
GritstoneActive
No Site Name Grid Reference Operator Aggregate Type Status
9 Back Lane SD 511 693 Aggregate Industries UK Ltd Limestone Active
10 Leapers Wood SD 516 694 Tarmac Ltd Limestone Active
11 Dunald Mill SD 511 680 Tarmac Ltd Limestone Active
12 Bankfield Quarry SD 756 437 Tarmac Ltd Limestone Active
No Site Name Grid Reference Operator Aggregate Type Status
13Tarnacre Hall Farm
(Sharples Quarry)SD 468 426 RMC Aggregates Sand & Gravel Inactive
14 Bradleys Sand Pit SD 512 340J A Jackson Contractors
(Preston) LtdSand & Gravel Active
15 Lower Brockholes SD 578 306Hargreaves Quarries (GB)
LtdSand & Gravel Active
16 Lydiate Lane Quarry SD 553 240 Wheale Ltd Sand & Gravel Active
17 German Lane SD 562 171 P Casey Environmental Ltd Sand & Gravel Inactive
18 Sandons Farm SD 592 131 Rigshaw Ltd Sand & Gravel Active
Crushed Rock Sites
Limestone Sites
Sand and Gravel Sites
#
#
!

47
No Site Name Grid Reference Operator Aggregate Type Status
19 Port of Heysham SD 400 602 Tarmac Ltd Sand Active
20 Foreshore St Annes SD 295 287William Rainford
(Holdings) LtdSand Active
21Runshaw Quarry
(Euxton)SD 540 190 Tarmac Ltd Sand Inactive
Sand Sites!

48
Figure 17: Spatial distribution of minerals working in Lancashire 2008

49
GREATER MANCHESTER (Incorporating Merseyside, Halton and Warrington) 8.40 For the purposes of RAWP annual monitoring, the areas of Greater Manchester,
Merseyside, Halton and Warrington are treated as one sub-region.
Total aggregate sales 8.41 Table 22 illustrates total primary aggregate sales in Greater Manchester, Merseyside,
Halton and Warrington 1994-2008. Figure 18 illustrates the primary aggregate sales in the sub-region compared to the annualised apportionment as per the National and Regional Guidelines for Aggregate Provision in England 2001-2016.
Figure 18: Greater Manchester, Merseyside, Halton and Warrington primary aggregate sales against annualised apportionment
8.42 Total aggregate sales decreased during the 2008 monitoring period by 20% from 1.93mt
in 2007 to 1.54mt10. This is the lowest overall sales figure recorded for over twenty years and continues the downward turn in overall sales since 2007.
Total aggregate reserves
8.43 Table 23 illustrates total primary aggregate reserves in the sub-region 1994-2008. Total
aggregate reserves decreased by 22.8% during 2008 from 30.01mt in 2007 to 23.16mt. This is the lowest reserve figure recorded for over twenty years and continues the downward turn in reserves since 2006.
10
Includes harbour authorities and marine dredged sand and gravel sales
0
0.2
0.4
0.6
0.8
1
1.2
1.4
1.6
1.8
2004 2005 2006 2007 2008
mill
ion
tonn
es
Survey Year
Crushed Rock Production
2001-2016 Apportionment
Sand & Gravel Production
2001-2016
Apportionment

50
Table 22: Monitoring of total primary aggregate sales –Lancashire sub-region 1994 – 2008 (million tonnes)
AM94 AM95 AM96 AM97 AM98 AM99 AM00 AM01 AM02 AM03 AM04 AM05 AM06 AM07 AM08
LAND-WON SAND & GRAVEL
Land-won Sand & Gravel 0.48 0.33 0.26 0.5 0.3 0.24 0.31 0.23 0.4 0.5 0.5 0.4 0.4 0.3 0.44
Marine Dredged Sand & Gravel 0.22 0.22 0.25 0.25 0.23 0.24 0.22 0.25 0.33 0.32 0.48 0.52 0.49 0.53 0.41
TOTAL SAND & GRAVEL SALES 0.70 0.55 0.51 0.75 0.53 0.48 0.53 0.48 0.73 0.82 0.98 0.92 0.89 0.83 0.85
CRUSHED ROCK
Sandstone & Igneous Rock 1.8 1.8 1.6 1.9 1.9 1.8 1.4 1.4 1.3 1.4 1.5 1.2 1.54 1.1 0.69
TOTAL CRUSHED ROCK SALES 1.8 1.8 1.6 1.9 1.9 1.8 1.4 1.4 1.3 1.4 1.5 1.2 1.54 1.1 0.69
TOTAL AGGREGATE SALES 2.50 2.35 2.11 2.65 2.43 2.28 1.93 1.88 2.03 2.22 2.48 2.12 2.43 1.93 1.54
NB Data up to and including AM98 exclude Halton and Warrington
Table 23: Monitoring of total primary aggregate reserves –Lancashire sub-region 1994 – 2008 (million tonnes)
AM94 AM95 AM96 AM97 AM98 AM99 AM00 AM01 AM02 AM03 AM04 AM05 AM06 AM07 AM08
SAND & GRAVEL
Land-won Sand & Gravel 3.2 4.1 3.8 3.5 5.36 7.67 7.1 6.7 7.7 6.7 6.3 8.91 9.89 5.15 5.8
TOTAL SAND & GRAVEL RESERVE 3.2 4.1 3.8 3.5 5.36 7.67 7.1 6.7 7.7 6.7 6.3 8.91 9.89 5.15 5.8
CRUSHED ROCK
Sandstone & Igneous Rock 27.9 34.9 35.5 32.4 35.33 32.0 30.9 30.2 27.7 22.6 22.5 23.69 25.54 24.86 17.36
TOTAL CRUSHED ROCK RESERVE 27.9 34.9 35.5 32.4 35.3 32.0 30.9 30.2 27.7 22.6 22.5 23.69 25.54 24.9 17.36
TOTAL AGGREGATE RESERVE 31.1 39.0 39.3 35.9 40.69 39.67 38.0 36.9 35.4 29.3 28.8 32.6 35.43 30.01 23.16
NB Data up to and including AM98 exclude Halton and Warrington

51
Crushed Rock
8.44 Total crushed rock sales decreased during 2008 by 37% from 1.1mt in 2007 to 0.69mt, the lowest recorded crushed rock sales figure for over twenty years. This figure is also 0.96mt below the annualised requirement of 1.65mt.
4.25 Reserves of crushed rock also declined during 2008 by 30% from 24.86mt in 2007 to 17.26mt. This reserve figure is 6.91mt lower than would have been expected given the low levels of sales during 2008. This drop is largely a result of the unexpected closure of two sites and reassessment of reserves at another site resulting in a loss of 5.95mt in total.
8.45 The landbank for crushed rock as at 31st December 2008 is 10.5 years. This landbank is 4.6
years less than the 15.1 years landbank at 31st December 2007.
Sand and gravel
8.46 Sales of land won sand and gravel increased during the 2008 monitoring period by 46% from 0.3mt in 2007 to 0.44mt. This is the highest sales figure recorded since 2004 when a figure of 0.5mt was recorded. This year’s figure is also 0.18mt above the annualised requirement of 0.26mt.
8.47 Reserves of sand and gravel have also increased during 2008 by 12.5% from 5.15mt in 2007 to 5.8mt. However, reserves remain dramatically below figures recorded for 2006 when reserves stood at 9.89mt. This small increase could partly be attributed to the release of 0.175mt reserve of sand at Morleys Hall Quarry.
8.48 The landbank for sand and gravel as at 31st December 2008 is 22.3 years. This landbank is
2.5 years above the 19.8 years landbank as at 31st December 2007.
Construction Activity 8.49 Major construction activity has continued in the sub-region throughout the 2008
monitoring period. The New Islington Millennium Community housing development continued to progress throughout 2008. The 12.5ha site at Ancoats, East Manchester is an ongoing project started in 2003 and is expected to continue to 2014. The project has cost £38m so far and its final building cost is expected to reach in excess of £200m.
8.50 The Gateway to the Future regeneration project for Stockport Town Centre and M60 Gateway began during 2008 with the redevelopment of the Stockport College campus and the BAM properties’ office development.
8.51 Regeneration activity also progressed throughout 2008 in Merseyside with major projects
completing including the Liverpool 1 shopping development and the Mann Island mixed

52
use development. There were also significant road projects underway in Merseyside including the M62 and M57 junction remodelling.
Table 24: Greater Manchester, Merseyside, Halton and Warrington
No Site Name Grid Reference Operator Aggregate Type Status
1 Fletcher Bank SD 804 170 Marshalls Mono Ltd Sandstone Active
2 Harwood Quarry SD 747 124 James Booth (Bolton)Sandstone and
BrickshaleActive
3 Montcliffe Quarry SD 656 124Hanson Quarry Products
Europe LtdSandstone Active
4 Pilkington Quarry SD 622 121 Armstrongs Sandstone Active
5 New Hey Quarry SD 940 119 Brock Plc Sandstone Inactive
6 High Moor Quarry SD 973 067 Veolia Sandstone Inactive
7 Buckton Vale Quarry SD 922 016 Aggregate Industries UK Ltd Sandstone Active
8 Harrop Edge Quarry SJ 982 959Chartrange (Quarry
Products)Sandstone Inactive
9 Southworth Quarry SJ 620 940WM Gaskell Bros (WM&C)
LtdSandstone Active
10 Bold Heath Quarry SJ 537 890 D Morgan Plc Crushed Rock Inactive
No Site Name Grid Reference Operator Aggregate Type Status
11 Astley Moss SJ 371 500 Marshalls Mono Ltd Sand and Gravel Active
No Site Name Grid Reference Operator Aggregate Type Status
12 Pilsworth Quarry SD 825 088 Tarmac Ltd Sand Active
13 Morleys Hall Quarry SJ 687 988Astley Sand and
Aggregates LtdSand Active
14 Offerton Sand Quarry SJ 928 893 Mrs S L Bowers Sand Active
Crushed Rock Sites
Sand and Gravel Sites
Sand Sites
#
!
"

53
Figure 19: Spatial distribution of minerals working in Greater Manchester, Merseyside, Halton and Warrington 2008

54
9 SECONDARY AND RECYCLED AGGREGATE 9.1 Government guidance contained within Minerals Policy Statement 1: Planning and
Minerals provides for an increased emphasis on the use of secondary and recycled aggregate. Attempts at collecting sales and reserve data for secondary and recycled aggregate have been difficult and have produced vague and unreliable results. There has been a lack of response to surveys and returns received in the past have been crude estimates. Alternative arisings
9.2 During the 2008 monitoring survey, data was gathered for the arisings of secondary aggregate during the period 1st January 2008 to 31st December 2008, across the North West region. Table 25 illustrates the findings of this survey.
Table 25: Alternative arisings in the North West 2007-2008
AM2007 AM2008
Pulverised Fuel Ash
Cheshire ~ ~
Cumbria ~ ~
Lancashire ~ ~
GtManchester/Merseyside/Halton/Warrington 278,325 125,468
Total Pulverised Fuel Ash 278,325 125,468
Furnace Bottom Ash
Cheshire ~ ~
Cumbria ~ ~
Lancashire ~ ~
GtManchester/Merseyside/Halton/Warrington 21,482 10,910
Total Furnace Bottom Ash 21,482 10,910
Slate Waste
Cheshire ~ ~
Cumbria 226,083 290,000
Lancashire ~ ~
GtManchester/Merseyside/Halton/Warrington ~ ~
Total Slate Waste 226,083 290,000
Total Secondary Aggregate 525,890 426,378

55
9.3 The total alternative arisings decreased during the 2008 monitoring period by 19% from 525,890 tonnes to 426,378 tonnes. Total arisings of Pulverised Fuel Ash (PFA) have fallen by 55% from 278,325 tonnes in 2007 to 125,468 tonnes. Total arisings of Furnace Bottom Ash have also fallen dramatically during 2008 from 21,482 tonnes in 2007 to 10,910 tonnes, a fall of 49%. Total arisings of slate waste have increased by approximately 28% from 226,083 tonnes in 2007 to 290,000 tonnes.
9.4 The above figures could indicate a greater reliance on primary aggregate during the 2008 monitoring period or it may be attributed to the general downturn in sales of overall aggregates due to the economic recession.
Recycled Aggregate
9.5 The collection of data regarding the arisings and use of recycled aggregate or construction
demolition and excavation waste (CD&EW) is notoriously problematic due the very nature of the construction industry. Data previously collected has not taken account of mobile crushers and screens and it is therefore considered that wide evidence gaps have remained.
9.6 In 2006 the Regional Technical Advisory Body and the North West Counties Group commissioned a study to fill these evidence gaps for CD&EW streams in the North West region. The results of this report were discussed in detail in last year’s Annual Monitoring Report.
9.7 It is considered that without provision of data being made mandatory these evidence
gaps will remain and data continue to be considered unreliable.
9.8 Details of fixed permitted CD&EW operations in the North West region are included in Figure 20 and Table 26.

56
Figure 20: Fixed Construction Demolition and Excavation Waste (CD&EW) sites in the North West 2008
NB: For the purposes of mapping the areas of Merseyside, Halton and Warrington are included within the GtManchester sub-region

57
Table 26: Fixed Construction Demolition and Excavation Waste (CDEW) sites in the North West 2008
No Site Name Location Operator Status
1 Kingmoor Rockliffe Estate Carlisle Longtown Skip Hire Active
2 Hespin Wood Carlisle Cumbria Waste Management Active
3 Thackwood Landfill Penrith H & E Trotter Active
4 Derwent Howe Maryport Thomas Armstrong Ltd Active
5 Roan Edge Landfill Kendal L & W Wilson (Endmoor) Active
6 Goldmire Quarry Barrow-in-Furness Neil Price Limited Active
7 Ellel Crag Quarry Lancaster Ellel Crag Recycling Ltd Active
8Riverside Waste Transfer
StationFleetwood Wyre Waste Recycling Limited Active
9 Beacon Road Poulton Le Fylde Blackpool Skip Hire Inactive
10 Greenacres Recycling Poulton Le Fylde Frank Smith Skip Hire Active
11 Kingscourt Development Poulton Le Fylde M J Teale Active
12 Blackpool Recycling Centre Blackpool Tarmac Ltd Active
13 Anna's Road Westby Woods Waste Group Active
14 Bradleys Sand Pit Fulwood J A Jackson Contractors (Preston) Ltd Active
15 Bankfield Quarry Clitheroe Tarmac Ltd Active
16Great Harwood Reclamation Site
Great Harwood S B Tippers Active
17 The Stoneyard Accrington Connolly Demolition Ltd Active
18 Red Scar MRF Preston Sita (Lancashire) Ltd Active
19 Red Scar Industrial Estate Preston Preston Recycling Ltd Active
20 Radburn Works Brindle Tarmac Ltd Active
21 Redrose Drive Leyland Clive Hurt Plant Hire Ltd Active
22 Whittle Le Woods Whittle Le Woods Neales Waste Management Ltd Active
23 Ackhurst Road Chorley A1 Skips (Chorley) Active
24 Ackhurst Road Chorley MGH Reclaim Ltd Active
25 Ackhurst Road Chorley Ruttle Plant Hire Ltd Active
26 Town Lane Chorley A1 Skips Ltd Active
Cumbria
Lancashire

58
27White Lund Industrial
EstateChorley Neales Waste Management Ltd Active
28Albert & Hope Mills and
Robin Bank WorksDarwen Frank Barnes (Darwen) Ltd Active
29 India Street Darwen R U Recycling Ltd Active
30 Tower House Clitheroe City Centre Commercials Active
31 Sloyan Doyle Simmonswood Sloyan Doyle Active
32 R and D Draper Simmonswood R and D Draper Active
33Liverpool Recycled
AggregatesSimmonswood Liverpool Recycled Aggregates Active
34 BW Recycling Simonswood BW Recycling Active
35 Lower Eafield Farm Rochdale Mayer Brothers Active
36 Fletcher Bank Bury Marshalls Mono Ltd Active
37 The Coal Yard Oldham Holroyds Active
38 Edge Green Road Wigan Hanson Quarry Products Europe Ltd Active
39 Morleys Sand Quarry Tyldesley Astley Sand and Aggregates Ltd Active
40Manchester Tippers
Recycling CentreSalford Manchester Tippers and Aggregates Ltd Active
41 Ashbury Depot West Gorton Lafarge Aggregates Ltd Active
42 Bennett Street West Gorton M & A Demolition (UK) Ltd Active
43 RMC Readymix North West West Gorton RMC Readymix Ltd Active
44 Rondin House Manchester P McGuiness & Co Ltd Active
45 Northbank Industrial Park Salford Frank O'Gara & Sons Ltd Active
46 Soapstone Way Salford W Maher & Sons Ltd Active
47 Southworth Quarry Winwick Gaskell Brothers Active
48 Woolston Depot Woolston W Maher & Sons Ltd Yet to commence
49 Stockport Recycling Stockport Tarmac Ltd Active
50 Offerton Sand Quarry Offerton Offerton Sand & Gravel Ltd Active
51 Early Skips Capenhurst Early Skips Ltd Active
52 Alan's Skip Hire Dunkirk Alan's Skip Hire Active
53 Cheshire Waste Backford Cheshire Waste & Skip Hire Limited Active
54 Ash Skip Hire Winnington Ash Skip Hire Limited Active
55 Northwich Mini Skips Rudheath Northwich Mini Skips Active
GtManchester/Merseyside/Halton/Warrington
Cheshire

59
56 Henshaws Macclesfield Henshaws Envirocare Active
57 Tilley & Pryor Sandbach Tilley & Pryor Skip Hire Active
58 Enviro Skips Radway Green Enviro Skip Hire Active
59 Nick Brookes WardleNick Brookes Waste Disposal &
DemolitionActive

60
10 MONITORING OF DEVELOPMENT PLANS 10.1 There was continued progress in the development of Core Strategies during the 2008
monitoring period. The current status of all LDFs are included in Appendix C. 10.2 The status of current Minerals Local Plans are as follows
Cheshire Replacement Minerals Local Plan was adopted in June 1999, policies were saved in 2007
Cumbria Minerals & Waste Local Plan was adopted in June 2000
Lancashire Minerals & Waste Local Plan was adopted in December 2001
11 ENVIRONMENT ACT 1995: REVIEW OF AGGREGATE MINERAL PLANNING PERMISSIONS 11.1 The Environment Act 1995 came into force on 1st November 1995. The Act requires
review of old mineral planning permissions granted prior to 22nd February 1982. The Act also requires MPAs to carry out periodic reviews of all mineral planning permissions.
11.2 Sites were put into three categories under the Act i.e. Phase I, Phase II and Dormant Sites. Phase I sites are those sites where permission was granted after 30th June 1948 but before 1st April 1969. Sites wholly or partly within a National Park, Site of Special Scientific Interest (SSSI) or Area of Outstanding Natural Beauty (AONB) are also Phase I sites irrespective of the date of permission.
11.3 Phase II sites are those sites where permission was granted after 31st March 1969 but
before 22nd February 1982. Dormant sites are those sites where no minerals development has been carried out to any substantial extent at any time in the period 22nd February 1982 to 6th June 1995.
11.4 Table 27 illustrates the numbers of sites in each category within each area of the North
West region. There are no reported changes for any of these areas during the 2008 monitoring period.

61
Table 27: Environment Act 1995: Summary of aggregate mineral review sites.
1 Application allowed to lapse as superseded by modern planning permission 2 Permission allowed to lapse on three sites as working had finished. Permission lapsed on two sites due to failure to submit conditions by due date. 3 Position with respect to dormant sites in Greater Manchester under review. 2003 report used for dormant sites.
Orig
inal
Laps
ed
Subm
itted
but
not
yet d
eter
min
ed
Det
erm
ined
With
SoS
In H
igh
Cour
t
Chal
leng
e
Orig
inal
Laps
ed
Subm
itted
but
not
yet d
eter
min
ed
Det
erm
ined
With
SoS
In H
igh
Cour
t
Chal
leng
e
Orig
inal
Subm
itted
but
not
yet d
eter
min
ed
Det
erm
ined
Cumbria 10 1 1 1 8 - - 2 - - 2 - - 27 - 1
Cheshire 5 - - 7 - - 1 - - 1 - - 7 1 -
Lake District National Park 5 - 2 3 - - 0 - - - - 2 - -
Lancashire 11 - - 11 - - 2 1 1 1 1 - - 8 - -
Greater Manchester/
Merseyside10 5 2 1 4 - - 1 - - 1 - - 18 3 - 1
MPA
Phase I Phase II Dormant

62
APPENDIX A North West Regional Aggregate Working Party Terms of reference 1 To hold at least one RAWP meeting per year, with membership to include representatives
from DCLG, the Government Office, the Regional Planning Body, MPAs, QPA, BAA and such other representatives as appropriate (e.g. NFDC, BMAPA).
2 To agree either at the first meeting of each year, or early in the year via correspondence,
an agenda of RAWP business for that year. 3 To organise, in conjunction with MPAs, an Annual Monitoring (AM) survey to monitor
(subject to confidentiality) the sales and reserves of primary aggregates in the region, imports to it and exports from it by sea or rail (including marine aggregates).
4 To support the National Aggregate Minerals surveys, which include all inter-regional
movements of aggregate, in years when such surveys are carried out. 5 To produce, supply to the RPB and publish on the DCLG website an Annual Monitoring
Report (AMR) containing core information to inform stakeholders in a consistent manner of the findings from the AM survey.
6 To give technical advice to DCLG, NCG, the RPB and MPAs on:
a) demand for and supply of aggregates in the region (including alternatives, marine aggregates and imports).
b) trends in supply in the medium to longer term, including aggregate imports and exports.
7 To give technical advice to the RPB and MPAs on:
a) sub-regional apportionment of land-won aggregates, and, where undertaken, b) regional apportionment of provision for recycling sites for CDEW.
8 To liaise with the Regional Technical Advisory Body (RTAB) to co-ordinate monitoring and
technical advice on aggregates and waste management, and other RAWPs on the inter-regional movement of aggregate.

63
APPENDIX B Table A: Monitoring of aggregate mineral primary planning applications decisions made 1st January 2008 – 31st December 2008
MPA
Site Name Location &
Grid Reference
Applicant / Operator
Application Number
Date Submitted
Mineral / Type of Working
Area of Application
(ha)
Quantity of Minerals
Decision / Date
Issued
Cheshire County Council
Arclid Quarry
378 300 361 400
Bathgate Silica Sand
8/07/0222/CPO 14/02/2007 Silica Sand 8.7ha 900,000 tonnes
Approved 24/10/2008
Cumbria County Council
Brisco Brickworks
NY4252 Esk Building
Products 1/07/9026 03/12/2007 Sand 7ha
270,000 tonnes
Approved 29/07/2008
Cumbria County Council
High House Quarry
NY1348 D A
Harrison 2/06/9017 20/07/2006
Sand and Gravel
19.6ha 1.5mt Approved
29/08/2008
Cumbria County Council
Overby Quarry
NY1247
Thomas Armstrong (Holdings)
Ltd
2/06/9033 12/12/2006 Sand and
Gravel 37ha 4.5mt
Approved 11/09/2008
Cumbria County Council
Tendley Quarry
NY0828NE Tendley
Quarries Ltd 2/03/9034 07/10/2003 Limestone 72.6ha 8.2mt
Approved 19/11/2008
Greater Manchester
Morleys Hall
SJ 687 988
Astley Sand &
Aggregates Ltd
A/08/70564 16/01/2008 Sand and
Clay 3.6ha
Extension 175,000 tonnes
Approved 08/12/2008
Lancashire County Council
Runshaw (Euxton)
540 190 Tarmac Ltd 9/05/319 23/03/2005 Sand 68ha 4.2mt Approved 08/2008
No aggregate mineral primary planning decisions made in Merseyside or Warrington during the 2008 monitoring period. NB: Aggregate mineral primary planning decisions do not include applications for extension of time, variation of conditions etc, only applications for the release of mineral reserves are included within this information

64
Table B: Monitoring of aggregate mineral primary planning applications in hand as at 31st December 2008
MPA
Site Name Location &
Grid Reference
Applicant / Operator
Application Number
Date Submitted
Mineral / Type of Working
Area of Application
(ha)
Quantity of Minerals
Cheshire County Council
Bent Farm Quarry
383 000 362 000
WBB Minerals
8/08/0375/CPO 03/03/2008 Silica Sand 73.30ha 3mt
Cumbria County Council
Shapfell Quarry
NY5914SW Corus UK Ltd 3/08/9020 01/12/2008 Limestone 30ha 5.2mt
Greater Manchester
Pilkington Quarry
SD 622 121 Armstrongs 80931/08 10/09/2008 Sand and
Sandstone 11.3ha 1.4mt
Greater Manchester
Harrop Edge SD 982 959 Chartrange
(Quarry Products)
K00029/02 17/12/2001 Gritstone 5.8ha 0.4mt
Lancashire County Council
Bradleys Sandpit
509 340 JA Jackson
Contractors Ltd
6/07/1197 24/10/2007 Sand 12.4ha 760,000 tonnes
Merseyside Bold Heath
Quarry SJ537 890 D Morgan Plc P/2008/0914 29/08/2008
Crushed Rock
40ha 1.06mt
NB: Aggregate mineral primary planning decisions do not include applications for extension of time, variation of conditions etc, only applications for the release of mineral reserves are included within this information

65
APPENDIX C Development plans in the North West region – Current progress on preparation and review
Authority UDP /
Minerals Local Plan Position
LDF Position
Local Development
Scheme Statement of Community Involvement
Core Strategy/ Development
Plan Document's
Ch
esh
ire
Cheshire County Council
Replacement Minerals Local Plan adopted 1999 - Policies saved 2007
Adopted March 2007
Adopted October 2006
All Minerals Local Plan policies saved 2007. No further Core Strategy work due to LGR.
Cheshire West and Chester Council (Post April 2009)
CCC Minerals Local Plan saved 2007
Adopted 2nd March 2009
Adopted 23rd July 2009
Core Strategy Issues and Options November 2009.
Cheshire East Council (Post April 2009)
CCC Minerals Local Plan saved 2007
Adopted 18th February 2009
Consultation November 2009
Due for adoption November 2010.
Cu
mb
ria
Cumbria Cumbria Minerals Local Plan adopted June 2000
Adopted March 2009
Adopted January 2006
Core Strategy and generic Development Control Policies adopted 23rd April 2009. Site Allocations Policies and Proposals Map to be submitted March/April 2010.
Lake District Authority
Lake District Local Plan adopted 1998
Adopted March 2005
Adopted June 2006 Pre-submission consultation November 2009.

66
Lan
cash
ire
Blackburn with Darwen
Adopted 2002 Adopted 2007 Adopted August 2006
Core Strategy due for adoption 2009.
Blackpool Adopted June 2006
Adopted March 2007
Adopted June 2007 Due for adoption July 2010.
Lancashire County Council
Minerals Local Plan adopted 2001
Adopted April 2007
Adopted May 2006 Core Strategy adopted February 2009 Minerals and Waste Site Allocations and Development Management DPDs Consultation scheduled for November 2009.
Gre
ate
r M
anch
este
r, M
erse
ysid
e, H
alto
n a
nd
War
rin
gto
n
Bolton Replacement UDP adopted April 2005
Adopted December 2006
Adopted March 2007
Core Strategy Preferred Options Due for adoption December 2010
Bury Current UDP adopted August 1997. Review abandoned for preparation of LDF
Adopted March 2007
Adopted March 2006
Core Strategy Preferred Options Due for adoption February 2011.
Halton UDP adopted April 2005
Adopted March 2007 Revised March 2009
Adopted July 2006 Due for submission December 2010.
Knowsley UDP adopted June 2006
Adopted March 2007 Revised March 2009
Adopted May 2007 Preferred Options consultation scheduled for February 2010.

67
Gre
ate
r M
anch
est
er,
Mer
seys
ide
, Hal
ton
an
d W
arri
ngt
on
Liverpool UDP adopted
2002 Adopted April 2005 Most recent revision July 2009
Adopted July 2007 Core Strategy Second Preferred Options consultation November 2009.
Manchester Current UDP adopted 1995 - Partial Reviews Adopted
Series of alterations have been adopted between 1998-2004
Adopted January 2007
Refining Options. Core Strategy due for adoption October 2010
Oldham Replacement UDP adopted July 2006
Adopted March 2007
Adopted April 2007 Preferred Options. Due for adoption October 2011.
Rochdale Replacement UDP adopted June 2006
Adopted March 2007
Adopted December 2007
Preferred Options. Due for adoption February 2011.
Salford Replacement UDP adopted May 2006
Approved June 2007
Adopted March 2008
Preferred Options. Due for adoption January 2011.
Sefton Replacement UDP adopted June 2006
Adopted 2009 after revision
Adopted October 2006
Core Strategy Preferred Options consultation November 2009.
St Helens Review of UDP abandoned to proceed with preparation of LDF
Adopted April 2005 Most recent revision April 2007
Adopted January 2007
Core Strategy Pre-Submission Spring 2010.

68
Gre
ate
r M
anch
est
er,
Mer
seys
ide
, Hal
ton
an
d W
arri
ngt
on
Stockport Replacement
UDP adopted May 2006
Adopted March 2007
Adopted July 2006 Preferred Options. Due for adoption September 2010.
Tameside Replacement UDP adopted November 2004
Adopted April 2007
Adopted July 2006 Issues and Options. Core Strategy due for adoption September 2010.
Trafford Replacement UDP adopted June 2006
Adopted March 2007
Adopted July 2006 Preferred Options. Core Strategy due for adoption January 2011.
Warrington UDP adopted January 2006
Adopted March 2007
Adopted March 2006
Core Strategy due for adoption 2010.
Wigan Replacement UDP adopted April 2006
Adopted February 2007
Adopted July 2006 Preferred Options. Core Strategy due for adoption July 2010.
Wirral UDP adopted 2000
Adopted July 2007
Adopted December 2006
Core Strategy Issues and Options consultation October 2009.

69
APPENDIX D Historical monitoring statistics 1989-2008 Table A: Monitoring of Crushed Rock Sales – North West Region 1989 – 2008 (million tonnes)
AM
19
89
AM
19
90
AM
19
91
AM
19
92
AM
19
93
AM
19
94
AM
19
95
AM
19
96
AM
19
97
AM
19
98
AM
19
99
AM
20
00
AM
20
01
AM
20
02
AM
20
03
AM
20
04
AM
20
05
AM
20
06
AM
20
07
AM
20
08
LIMESTONE 1
Cumbria 2 4.4 4.3 3.8 4.2 4.1 4.8 3.8 3.2 3.5 3.2 3.4 3.4 3.0 2.9 2.6 2.8 2.6 2.7 2.8 2.7
Lancashire 3.4 3.6 3.5 3.8 3.7 4.3 3.5 2.9 3.0 2.7 2.6 2.7 2.6 2.7 2.6 2.7 2.5 2.6 3.0 2.46
TOTAL LIMESTONE 7.8 7.9 7.3 8.0 7.8 9.1 7.3 6.1 6.5 5.9 6.0 6.1 5.6 5.6 5.2 5.5 5.1 5.3 5.8 5.16
SANDSTONE & IGNEOUS ROCK
Cumbria 2 0.6 0.6 0.6 0.7 0.6 0.8 0.8 0.7 0.7 0.8 0.8 1.0 1.1 1.1 1.1 1.1 0.36 0.27 0.53 0.4
Cumbria – High Specification Aggregate (HSA)
~ ~ ~ ~ ~ ~ ~ ~ ~ ~ ~ ~ ~ ~ ~ ~ 0.74 0.69 0.7 0.75
Lancashire 1.9 1.5 1.8 1.6 2.3 2.7 2.8 2.63 2.17 2.1 1.8 1.7 1.9 2.2 1.6 1.3 1.2 1.0 1.26 0.99
Cheshire 3/4
0.7 0.6 0.3 0.3 0.6 1.0 0.6 0.44 0.29 0.1 0.1 0.1 0.1 0.01 0.02 0.05 0.03 0.05 0.03 0.02
GtManchester/M’side/Halton/Warrington 5 1.5 1.4 1.4 1.6 2.0 1.8 1.8 1.6 1.9 1.9 1.8 1.4 1.4 1.3 1.4 1.5 1.2 1.54 1.1 0.69
TOTAL SANDSTONE & IGNEOUS ROCK 4.7 4.1 4.1 4.2 5.5 6.3 6.0 5.37 5.06 4.9 4.58 4.2 4.5 4.6 4.12 3.95 3.53 3.55 3.62 2.85
TOTAL CRUSHED ROCK SALES 12.5 12.0 11.4 12.2 13.3 15.4 13.3 11.47 11.56 10.8 10.58 10.3 10.1 10.2 9.32 9.45 8.63 8.85 9.42 8.01
1 Excludes Limestone used for non-aggregate purposes 4 Prior to 1998 figures include Halton and Warrington 2 Cumbria figures include the Lake District National Park 5 Prior to 1998 figures exclude Halton and Warrington 3 Prior to 1999 figures include Peak Park within Cheshire NB: Figures may include some estimates by MPAs, total may not add up due to rounding.

70
Table B: Monitoring of Sand and Gravel Sales – North West Region 1989 – 2008 (million tonnes)
AM
19
89
AM
19
90
AM
19
91
AM
19
92
AM
19
93
AM
19
94
AM
19
95
AM
19
96
AM
19
97
AM
19
98
AM
19
99
AM
20
00
AM
20
01
AM
20
02
AM
20
03
AM
20
04
AM
20
05
AM
20
06
AM
20
07
AM
20
08
LAND-WON SAND & GRAVEL
Cumbria 1 1.0 0.9 0.9 0.8 0.9 1.1 0.9 0.8 0.8 0.9 0.9 0.8 0.7 0.9 1.0 0.8 0.7 0.79 0.87 0.77
Lancashire 0.95 0.81 0.78 0.8 0.8 0.77 0.8 0.8 0.91 0.66 0.48 0.34 0.5 0.5 0.46 0.44 0.38 0.34 0.33 0.31
Cheshire 2/3
2.5 2.84 2.8 2.6 2.6 3.2 2.9 2.65 2.56 2.3 2.48 2.33 1.7 1.4 1.4 1.1 1.58 1.44 1.51 1.17
GtManchester/M’side/Halton/Warrington 4 0.9 0.83 0.8 0.7 0.28 0.48 0.33 0.26 0.5 0.3 0.24 0.31 0.23 0.4 0.5 0.5 0.4 0.4 0.3 0.44
TOTAL LAND-WON SAND & GRAVEL 5.3 5.38 5.28 4.9 4.58 5.55 4.93 4.51 4.72 4.16 4.1 3.78 3.1 3.2 3.36 2.84 3.06 2.97 3.0 2.69
MARINE DREDGED SAND & GRAVEL 5
Cumbria ~ ~ ~ ~ ~ ~ ~ ~ ~ ~ ~ ~ 0.03 0.04 0.04 0.02 0.02 0.02 0.01 0.02
Lancashire ~ ~ ~ ~ ~ ~ ~ ~ ~ ~ 0.05 0.07 0.18 0.13 0.11 0.1 0.12 0.1 0.12 0.01
GtManchester/M’side/Halton/Warrington 4 ~ ~ ~ ~ 0.22 0.22 0.22 0.25 0.25 0.23 0.24 0.22 0.25 0.33 0.32 0.48 0.52 0.49 0.53 0.41
TOTAL MARINE DREDGES SAND & GRAVEL 0.22 0.22 0.22 0.25 0.25 0.23 0.29 0.29 0.46 0.5 0.47 0.6 0.66 0.64 0.66 0.44
HARBOUR AUTHORITIES SAND & GRAVEL
Cumbria ~ ~ ~ ~ ~ ~ ~ ~ ~ ~ ~ ~ ~ 0.1 0.03 ~ ~ 0.02 ~ 0.02
TOTAL SAND & GRAVEL SALES 5.3 5.38 5.28 4.9 4.8 5.77 5.15 4.76 4.97 4.39 4.34 4.07 3.56 3.8 3.86 3.44 3.72 3.63 3.66 3.15
1 Cumbria figures include the Lake District National Park 4 Prior to 1998 figures exclude Halton and Warrington 2 Prior to 1999 figures include Peak Park within Cheshire 5 Prior to 1994 marine dredged sand and gravel figures incorporated with total land-won sand and gravel. 3 Prior to 1998 figures include Halton and Warrington NB: Figures may include some estimates by MPAs, total may not add up due to rounding. Figures exclude Borrow Pits.

71
Table C: Monitoring of Crushed Rock Permitted Reserves – North West Region 1989 – 2008 (million tonnes)
AM
19
89
AM
19
90
AM
19
91
AM
19
92
AM
19
93
AM
19
94
AM
19
95
AM
19
96
AM
19
97
AM
19
98
AM
19
99
AM
20
00
AM
20
01
AM
20
02
AM
20
03
AM
20
04
AM
20
05
AM
20
06
AM
20
07
AM
20
08
LIMESTONE 1
Cumbria 2 162.3 182.7 157.4 157.6 169.0 177.6 143.9 111.7 121.9 91.7
3 111.8 116.7 106.0 102.0 99.2 96.1 97.9 97.7 102.5 110.05
Lancashire 4 93.0 115.0 110.0 102.0 103.8 93.3 65.9 63.8 63.5 59.4 56.8 54.1 53.9 59.3 57.5 54.7 50.32 77.0 71.4 75.6
TOTAL LIMESTONE 255.3 297.7 267.4 259.6 272.8 270.9 209.5 175.5 185.4 151.1 168.6 170.8 159.9 161.3 156.7 150.8 148.22 174.7 173.9 185.65
SANDSTONE & IGNEOUS ROCK
Cumbria 23.9 19.3 70.6 63.4 76.1 77.1 76.3 69.6 67.7 66.8 67.5 66.5 65.0 63.0 62.0 60.9 48.85 49.2 48.69 47.75
Cumbria – (HSA) ~ ~ ~ ~ ~ ~ ~ ~ ~ ~ ~ ~ ~ ~ ~ ~ 9.85 9.55 19.0 18.2
Lancashire 53.0 67.9 43.4 73.0 146.4 151.8 125.0 112.7 105.7 86.0 84.0 73.5 71.1 70.3 68.7 79.8 64.5 75.1 74.1 65.1
Cheshire 5/6
6.0 4.8 4.5 2.9 8.2 9.8 9.4 10.2 9.6 8.52 8.4 8.36 6.5 5.6 5.6 5.4 5.4 5.35 5.52 5.6
GtManchester/M’side Halton/Warrington
7
36.0 33.5 36.9 33.6 35.5 27.9 34.9 35.5 32.4 35.33 32.0 30.9 30.2 27.7 22.6 22.5 23.69 25.54 24.86 17.26
TOTAL SANDSTONE & IGNEOUS ROCK
118.9 125.5 155.4 172.9 266.2 266.6 245.6 228.0 215.4 196.65 191.9 179.26 172.8 166.6 158.9 168.4 152.92 164.77 172.17 153.91
TOTAL CRUSHED ROCK RESERVES
374.2 423.2 422.8 432.5 539.0 553.7 444.4 403.5 400.8 347.75 360.5 350.06 332.7 327.9 315.6 319.4 300.51 339.47 346.07 339.56
1 Excludes Limestone used for non-aggregate purposes 5 Prior to 1998 figures include Peak Park within Cheshire
2 Cumbria includes the Lake District National Park 6 Prior to 1998 figures include Halton and Warrington
3 Nil return recorded for one site 7 Prior to 1998 figures exclude Halton and Warrington
4 Data up to and including AM94 include reserves for non-aggregate
NB: Figures may include some estimates by MPAs and totals may not add up due to rounding.

72
Table D: Monitoring of Sand and Gravel Permitted Reserves – North West Region 1989 – 2008 (million tonnes)
AM
19
89
AM
19
90
AM
19
91
AM
19
92
AM
19
93
AM
19
94
AM
19
95
AM
19
96
AM
19
97
AM
19
98
AM
19
99
AM
20
00
AM
20
01
AM
20
02
AM
20
03
AM
20
04
AM
20
05
AM
20
06
AM
20
07
AM
20
08
LAND-WON SAND & GRAVEL
Cumbria 1 9.1 8.1 17.4 18.7 17.3 15.2 14.1 12.2 13.5 12.2 12.3 11.8 12.0 12.1 11.4 10.5 9.18 9.19 8.67 7.2
Lancashire 5.2 3.8 3.6 7.0 9.4 9.0 9.5 9.2 8.6 7.38 7.0 6.4 4.6 4.0 3.54 3.24 4.4 5.21 5.4 10.3
Cheshire 2/4
22.6 22.3 24.7 27.5 27.4 29.3 28.3 25.9 24.1 21.7 19.3 17.6 24.6 23.5 19.7 19.2 20.53 21.3 19.52 16.4
GtManchester/M’side/Halton/Warrington 3 5.7 4.8 4.7 2.8 4.0 3.2 4.1 3.8 3.5 5.36 7.67 7.1 6.7 7.7 6.7 6.3 8.91 9.89 5.15 5.8
TOTAL LAND-WON SAND & GRAVEL RESERVES
42.6 39.0 50.4 56.1 58.1 56.7 56.7 51.1 49.7 46.64 46.27 43.2 47.9 47.3 41.34 39.24 43.02 45.59 38.74 39.7
1 Cumbria includes the Lake District National Park 3 Prior to 1998 figures exclude Halton and Warrington
2 Prior to 1998 figures include Halton and Warrington 4 Prior to 1999 figures include Peak Park within Cheshire
NB: Figures may include some estimates by MPAs and totals may not add up due to rounding. Figures exclude Borrow Pits
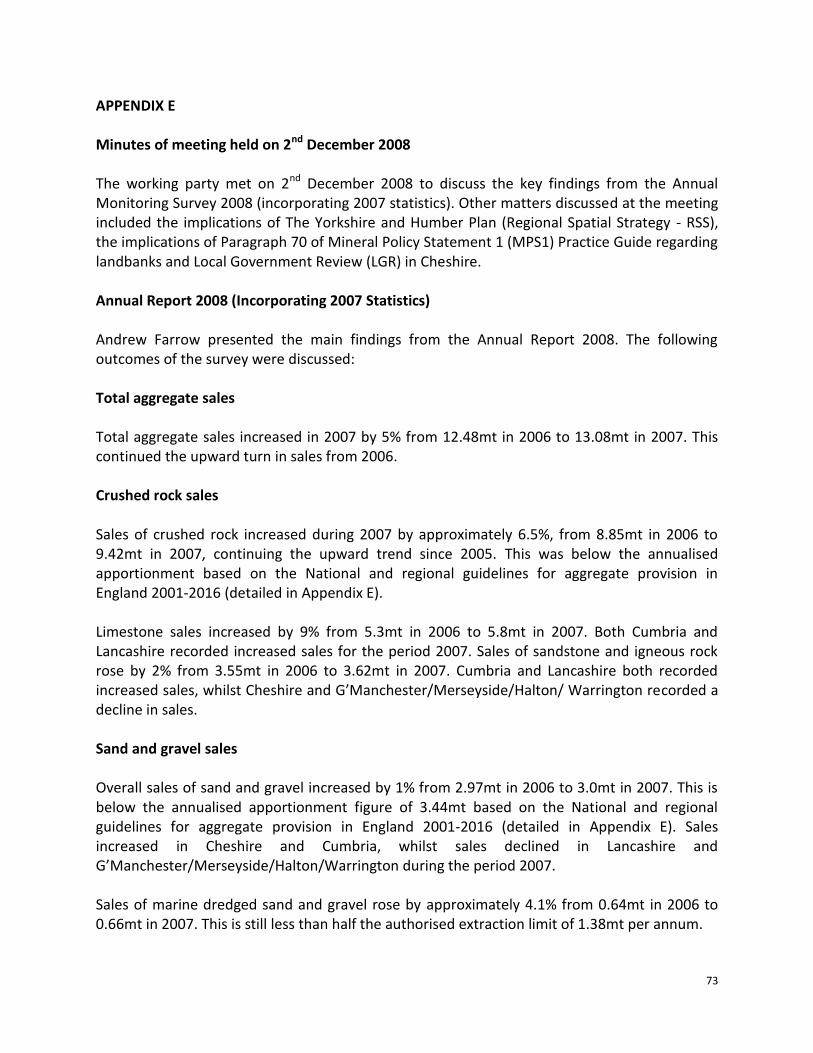
73
APPENDIX E Minutes of meeting held on 2nd December 2008 The working party met on 2nd December 2008 to discuss the key findings from the Annual Monitoring Survey 2008 (incorporating 2007 statistics). Other matters discussed at the meeting included the implications of The Yorkshire and Humber Plan (Regional Spatial Strategy - RSS), the implications of Paragraph 70 of Mineral Policy Statement 1 (MPS1) Practice Guide regarding landbanks and Local Government Review (LGR) in Cheshire. Annual Report 2008 (Incorporating 2007 Statistics) Andrew Farrow presented the main findings from the Annual Report 2008. The following outcomes of the survey were discussed: Total aggregate sales Total aggregate sales increased in 2007 by 5% from 12.48mt in 2006 to 13.08mt in 2007. This continued the upward turn in sales from 2006. Crushed rock sales Sales of crushed rock increased during 2007 by approximately 6.5%, from 8.85mt in 2006 to 9.42mt in 2007, continuing the upward trend since 2005. This was below the annualised apportionment based on the National and regional guidelines for aggregate provision in England 2001-2016 (detailed in Appendix E).
Limestone sales increased by 9% from 5.3mt in 2006 to 5.8mt in 2007. Both Cumbria and Lancashire recorded increased sales for the period 2007. Sales of sandstone and igneous rock rose by 2% from 3.55mt in 2006 to 3.62mt in 2007. Cumbria and Lancashire both recorded increased sales, whilst Cheshire and G’Manchester/Merseyside/Halton/ Warrington recorded a decline in sales.
Sand and gravel sales Overall sales of sand and gravel increased by 1% from 2.97mt in 2006 to 3.0mt in 2007. This is below the annualised apportionment figure of 3.44mt based on the National and regional guidelines for aggregate provision in England 2001-2016 (detailed in Appendix E). Sales increased in Cheshire and Cumbria, whilst sales declined in Lancashire and G’Manchester/Merseyside/Halton/Warrington during the period 2007. Sales of marine dredged sand and gravel rose by approximately 4.1% from 0.64mt in 2006 to 0.66mt in 2007. This is still less than half the authorised extraction limit of 1.38mt per annum.

74
Total aggregate reserves Total aggregate reserves decreased by 0.06% from 385.06mt in 2006 to 384.81mt in 2007. However, reserves remained higher than historically recorded in 2001. Crushed rock reserves increased by 1.94% from 339.47mt in 2006 to 346.07mt in 2007, whilst reserves of sand gravel significantly decreased by 15% from 45.59mt in 2006 to 38.74mt in 2007. This was mainly due to the closure of the only sand and gravel operator in Merseyside.
Landbanks
Crushed rock = 33.28 years as at 31/12/2007, compared to 33.20 years as at 31/12/2006, a minimal increase of 0.08 years. Sand and gravel = 11.29 years as at 31/12/2007, compared to 12.59 years as at 31/12/2006, a decrease of 1.3 years.
Implications of ‘The Yorkshire and Humber Plan’ (RSS) Richard Evans raised ‘The Yorkshire and Humber Plan: Policy ENV4’ (MPAs should ‘seek a progressive reduction in aggregate production from National Parks and Areas of Outstanding Beauty...’11. Richard Evans expressed concerns regarding the future supply of High Specification Aggregate (HSA) in the region. Geoff Storey stated that current permissions within the Yorkshire Dales National Park are due to expire in 2009, 2011 and 2018 and therefore there is the potential for a shortfall in the supply of HSA by 2018 if not in 2009.
Harold Collin commented that forthcoming apportionment figures from the National and regional guidelines for aggregate provision in England 2005-2020 will be affected and that this may well be the trigger for addressing the issue at a national level.
Implications of Paragraph 70 MPS1 Practice Guide (Landbanks) Richard Evans commented that Minerals Planning Guidance (MPG) 6 provided two methods for calculating landbanks, the second of which involved using a rolling three year average. This method has now been removed under MPS1 Practice Guide and it is considered that this method was in fact the most useful of the two.
11
The Yorkshire and Humber Plan Regional Spatial Strategy to 2026, Government Office for Yorkshire and the Humber, May 2008

75
Local Government Review in Cheshire Both new shadow authorities were up and running in December 2008 with an increasing number of positions being filled in upper tiers. Both new councils struggled to get budgets in place but used rationalisation exercises to overcome certain issues. As of April 1st 2009 Cheshire County Council and the six District Councils are to be abolished and two new Unitary authorities of Cheshire East and Cheshire West and Chester are to be created.
Andrew Farrow has now taken up a new role at Flintshire County Council and responsibility as Secretary to the North West RAWP is to be handed to Anne Mosquera, Minerals and Waste Spatial Planning Manager.
Negotiations regarding the future of joint minerals and waste working are still ongoing. Decisions relating to the Cheshire sub-region in terms of future apportionment are still to be made in the light of LGR and the formation of the two new authorities.

76
APPENDIX F National and Regional Guidelines for Aggregate Provision in England 2001-2016 On 10th June 2003, the ODPM published the ‘National and Regional Guidelines for Aggregate Provision in England 2001-2016’. The guidelines replace those in Annex A of Minerals Planning Guidance Note 6, published in 1994. The revised guidelines are set out below: National and Regional Guidelines for Aggregate Provision in England 2001-2016
New Regions
Guidelines for land-won production
Assumptions
Land-won Sand & Gravel
Land-won Crushed Rock
Marine Sand & Gravel
Alternative Materials
Net Imports to England
South East England 212 35 120 118 85
London 19 0 53 82 6
East of England 256 8 32 110 8
East Midlands 165 523 0 95 0
West Midlands 162 93 0 88 16
South West 106 453 9 121 4
North West 55 167 4 101 50
Yorkshire and the Humber 73 220 3 128 0
North East 20 119 9 76 0
England 1068 1618 230 919 169
Source: National and Regional Guidelines for Aggregate Provision in England 2001-2016, ODPM, June 2003
Before the regional guidelines can be used in the preparation of minerals development plans they need to be broken down to mineral planning authority (MPA) areas. The apportionment of the regional guidelines to sub-regional areas in the North West is the responsibility of 4NW taking into account advice from MPAs and the North West RAWP. A five-year average production level was used for the basis of the apportionment, as this best reflected recent supply patterns. The numerical implications for each MPA in terms of land-won sand and gravel and crushed rock provision, by apportioning the regional guidelines based on the above, are detailed below.

77
Sub-regional apportionment of aggregates provision in the North West region 2001-2016 (million tonnes)
Sand and Gravel Annualised Requirement
Cheshire 31.5 1.97
Cumbria 11.2 0.7
Lancashire 8.2 0.5
GtManchester/Merseyside/ Halton/Warrington
4.1 0.26
Total 55 3.43
Figures from - The North West of England Plan: Regional Spatial Strategy to 2021, Government Office for the North West of England
Crushed Rock Annualised Requirement
Cheshire 2.17 0.13
Cumbria 65.5 4.1
Lancashire 72.9 4.6
GtManchester/Merseyside/ Halton/Warrington
26.4 1.65
Total 166.97 10.4
Figures from - The North West of England Plan: Regional Spatial Strategy to 2021, Government Office for the North West of England
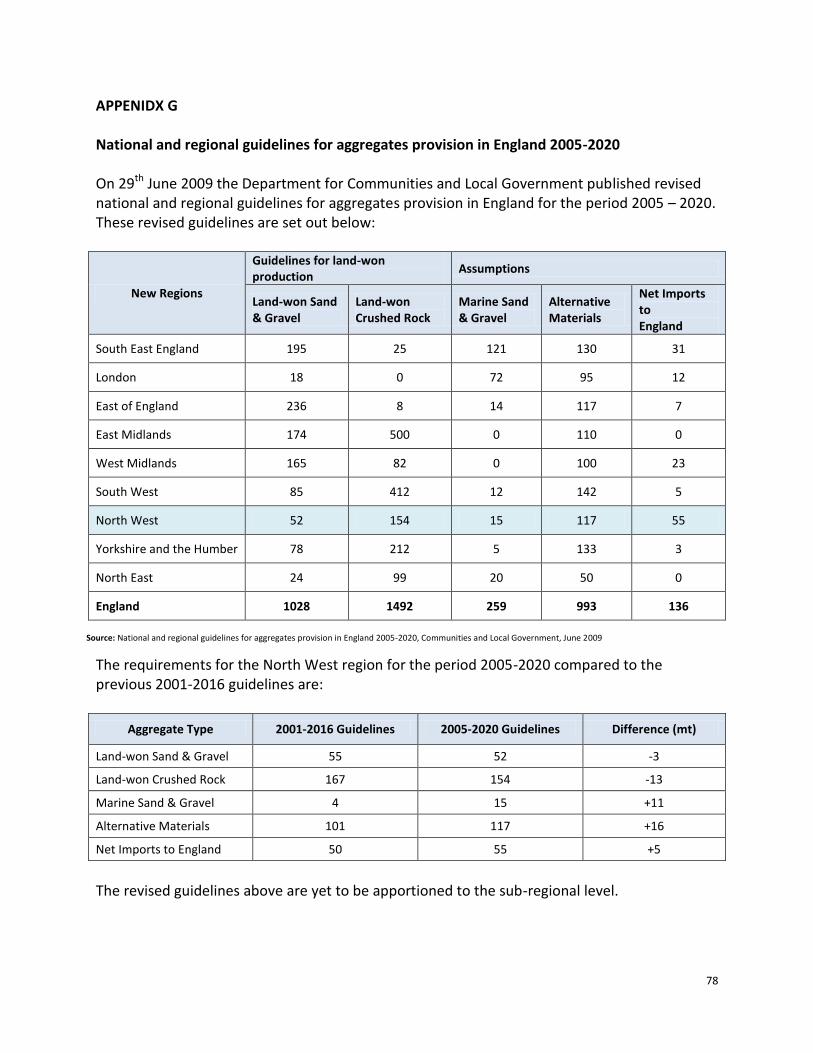
78
APPENIDX G National and regional guidelines for aggregates provision in England 2005-2020 On 29th June 2009 the Department for Communities and Local Government published revised national and regional guidelines for aggregates provision in England for the period 2005 – 2020. These revised guidelines are set out below:
New Regions
Guidelines for land-won production
Assumptions
Land-won Sand & Gravel
Land-won Crushed Rock
Marine Sand & Gravel
Alternative Materials
Net Imports to England
South East England 195 25 121 130 31
London 18 0 72 95 12
East of England 236 8 14 117 7
East Midlands 174 500 0 110 0
West Midlands 165 82 0 100 23
South West 85 412 12 142 5
North West 52 154 15 117 55
Yorkshire and the Humber 78 212 5 133 3
North East 24 99 20 50 0
England 1028 1492 259 993 136
Source: National and regional guidelines for aggregates provision in England 2005-2020, Communities and Local Government, June 2009
The requirements for the North West region for the period 2005-2020 compared to the previous 2001-2016 guidelines are:
Aggregate Type 2001-2016 Guidelines 2005-2020 Guidelines Difference (mt)
Land-won Sand & Gravel 55 52 -3
Land-won Crushed Rock 167 154 -13
Marine Sand & Gravel 4 15 +11
Alternative Materials 101 117 +16
Net Imports to England 50 55 +5
The revised guidelines above are yet to be apportioned to the sub-regional level.

79
APPENDIX H
NWRAWP Membership
North West RAWP Representatives
North West Regional Aggregates Working Party Chairman
Mr Richard Evans Minerals and Waste Planning Policy Team County Offices, Kendal Cumbria LA9 4RQ [email protected] 01539 713425
North West Regional Aggregates Working Party Technical Secretary
Mrs Anne Mosquera Minerals and Waste Spatial Planning Manager Cheshire West and Chester Council Backford Hall, Backford Nr Chester CH1 6PX [email protected] 01244 973802
North West Regional Aggregates Working Party Technical Assistant
Mrs Natalie Durney-Knight Environmental Planning Officer Cheshire West and Chester Council Backford Hall, Backford Nr Chester CH1 6PX [email protected] 01244 973117
Central and Regional Government Representatives
Department for Communities and Local Government
Mr Mark Plummer Department for Communities and Local Government Minerals and Waste Planning Zone 1/H4, Eland House, Bressenden Place, London SW1E 5DU [email protected] 0303 444 1708
4NW Mr Duncan McCorquodale 4NW Wigan Investment Centre, Waterside Drive Wigan WN3 5BA [email protected] 01942 776729

80
Government Office North West Mr Chris Bamber Government Office North West City Tower, Piccadilly Plaza Manchester M1 4BE [email protected] 0161 952 4167
Highways Agency (Manchester) Mr Ian Tull Highways Agency City Tower, Piccadilly Plaza Manchester M1 4BE [email protected] 0161 930 5602
Local Government Representatives
Cheshire East Mr Jamie Longmire Spatial Planning Municipal Buildings, Earl Street Crewe CW1 2BJ [email protected] 01270 537461
Environmental Advisory Service (Merseyside)
Mr Paul Slinn Environmental Advisory Service Bryant House, Liverpool Road North Maghull L31 2PA [email protected] 0151 934 2791
GMGU Mrs Carolyn Williams GMGU Environment, 10th Floor, Emerson House Albert Street, Eccles Manchester M30 0TE [email protected] 0161 275 0311
Lancashire County Council Mr Marcus Hudson Environment Directorate Guild House, Cross Street Preston PR1 8RD [email protected] 01772 534272

81
Warrington Borough Council Mr David Ringwood Environment and Regeneration Department New Town House, Buttermarket Street Warrington WA1 2NH [email protected] 01925 442814
Industry Representatives
Aggregate Industries UK Limited Mr Geoff Storey Aggregate Industries UK Ltd High Roads, Nether Kellet, Carnforth, Lancashire LA6 1EA [email protected] 01524 732261
British Aggregates Association Mr Ian Pearson Marshalls Natural Stone Division Brier Lodge, Southowram Halifax HX3 9SY [email protected] 01422 434413
British Marine Aggregate Producers Association
Mr Andrew Bellamy BMAPA UMA House, Shopwhyke Road Chichester PO20 2AD [email protected] 01243 817200
Cemex Mr Keith Frost Cemex Cemex House, Coldharbour Lane Thorpe, Surrey TW20 8TD [email protected] 01932 583450
Hanson Heidelberg Cement Group Mr Tom Brown Hanson Aggregates Clifford House, Wetherby Business Park York Road, Wetherby West Yorkshire LS22 7NS [email protected] 01937 581977

82
Mineral Products Association Mr Ken Hobden Minerals Products Association Gillingham House, Gillingham Street London SW1V 1HU [email protected]
020 7963 8000
Sibelco UK Ltd Mr Nick Horsley Sibelco UK Ltd Brookside Hall, Congleton Road Sandbach, Cheshire CW11 4TF 01298 768202
Tarmac Limited Mr Grahame Fyles Tarmac Limited Tunstead House, Buxton Derbyshire SK17 8TG [email protected] 01298 768202