annual monitoring report 2018 marana high plains …
TRANSCRIPT

ANNUAL MONITORING REPORT 2018
MARANA HIGH PLAINS EFFLUENT RECHARGE PROJECT
Underground Storage Facility Permit No. 71-563876.0008 (PCRFCD)
Water Storage Permit No. 73-563876.0200 (PCRWRD)
Pima County, Arizona Board of Supervisors
Ally Miller, District 1
Ramon Valadez, District 2 Sharon Bronson, District 3
Steve Christy, District 4 Richard Elias, Chairman, District 5
County Administrator
Chuck Huckelberry
Prepared by
David Scalero, Principal Hydrologist Pima County Regional Flood Control District
Water Resources Division 201 N. Stone Avenue, 7th Floor
Tucson, Arizona 85701
for
Arizona Department of Water Resources 1110 W. Washington Street, Ste 310
Phoenix, Arizona 85007
February 19, 2019
i
TABLE OF CONTENTS
CHAPTER PAGE NO.
1.0 INTRODUCTION................................................................................................................1
2.0 PROJECT OPERATIONS ...................................................................................................2
2.1 Water Delivery .........................................................................................................2
2.2 Inflow Volumes........................................................................................................3
2.3 Evaporation/Evapotranspiration ..............................................................................3
2.4 Recharge Volumes ...................................................................................................4
3.0 HYDROLOGICAL MONITORING ...................................................................................4
3.1 Basin Water Levels ..................................................................................................4
3.2 Regional Groundwater Levels..................................................................................5
3.3 Perched Groundwater Occurrence ...........................................................................5
4.0 INFILTRATION RATE ASSESSMENT ............................................................................5
5.0 WATER QUALITY MONITORING ..................................................................................6
5.1 Water Quality Sampling Activities ..........................................................................6
5.2 Chemical Analyses Results ......................................................................................6
6.0 FACILITY INSPECTIONS .................................................................................................6
7.0 CONCLUSIONS ..................................................................................................................7

ii
FIGURES
1 Location Map
2 Facility Layout
3 AZMET Tucson Weather Station
4 Monitor Well Location Map
TABLES
1 Water Quality Data Summary
2 Facility Inspections: Problems and Solutions
APPENDICES
A Daily Inflow Volumes and Water Quantity Summary
B Evaporation Calculations and Cooley Method Description
C Daily Wetted Acreages
D Evapotranspiration Calculations and AZMET Method Description
E Water Level Measurements
F Infiltration Rate Data and Calculations

1
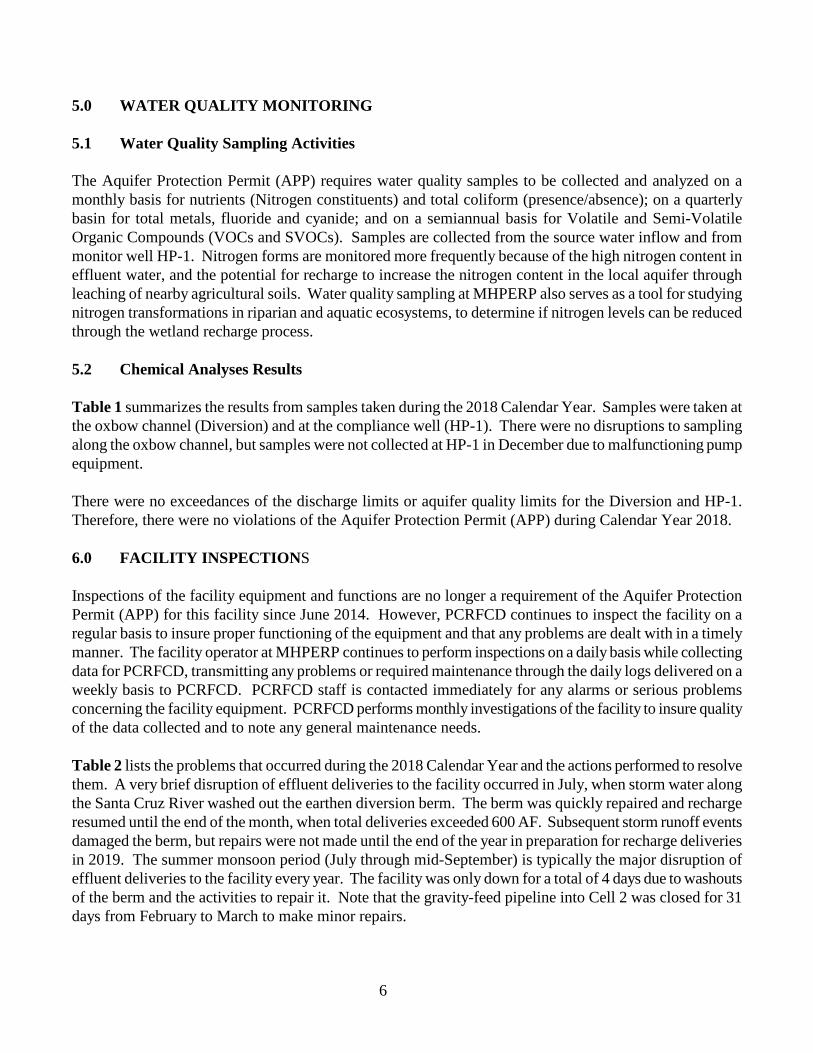
1.0 INTRODUCTION The Marana High Plains Effluent Recharge Project (MHPERP) is a constructed recharge project developed by the Pima County Regional Flood Control District (PCRFCD) in cooperation with the Bureau of Reclamation (BOR), Arizona Water Protection Fund (AWPF), Pima County Regional Water Reclamation Department (PCRWRD), and the Town of Marana. The project is located in Section 33 of Township 11 South, Range 11 East in the Avra Valley sub-basin of the Tucson Active Management Area (Figure 1). It is one component of a regional water resource, flood control, environmental protection and enhancement, and recreation program (the Northwest TAMA Replenishment Program) that is sponsored by more than a dozen local, state, and federal entities. MHPERP is designed to recharge treated effluent into the local groundwater aquifer, while simultaneously creating wildlife habitat and public recreation opportunities associated with recharge facilities. The overall objectives for the project include the following:
• To recharge up to 600 acre-feet of water per year while maximizing infiltration rates in basins having side slopes vegetated with emergent plants and riparian trees;
• To provide trails, descriptive literature, and interpretive signs describing the project operations.
Trails at the project site may eventually be linked to a longer river trail network that is scheduled to be built along the Santa Cruz River;
• To re-vegetate the area outside the recharge basins with plants that will improve wildlife habitat
value and, once established, could survive if the recharge activities cease;
• To maintain wildlife, aquatic macroinvertebrates, and vegetative resources associated with an important effluent-dominated stream; and
• To monitor the biological effects that may result from establishing other habitat types that are now
rare to the area (e.g., marsh, grassland), and increase the aerial extent of riparian vegetation. The MHPERP facility is comprised of one settling basin (equalization basin) and four spreading basins (recharge cells), totaling 4.5 acres of recharge area (Figure 2). A comprehensive description of MHPERP and the related monitoring plan was provided to the Arizona Department of Water Resources (ADWR) in support of the Constructed Underground Storage Facility (USF) Permit Application for the project filed in June 2007. In addition to the USF Permit (No. 71-563876.0008), the facility has an Aquifer Protection Permit (No. P-103195) from the Arizona Department of Environmental Quality (ADEQ) that authorizes the discharge of treated effluent into the aquifer. The facility has been operating since February 2003, first as a pilot project and then as a constructed recharge project. In accordance with Sections 2 and 3 of the USF Permit (all versions), this is the sixteenth annual report for MHPERP. This report includes all of the data that was collected during the 2018 Calendar Year.

2
2.0 PROJECT OPERATIONS A modified USF Permit (71-563876.0008) was approved and signed by the ADWR Deputy Assistant Director, Gerry L. Walker, on March 24, 2017. This permit authorizes PCRFCD to store effluent at MHPERP over a twenty-year term (through November 24, 2028) or until the Operation Prohibition Limits are met. Maximum annual storage at the facility is based on three constructed phases as follows: Phase 1: 350 acre-feet per annum recharged within the equalization basin and the four recharge cells, as
constructed in 2002, Phase 2: 450 acre-feet per annum after construction of recharge enhancement trenches within Recharge
Cells 1, 3 and 4, as constructed in 2009, Phase 3: 600 acre-feet per annum after re-excavation of Recharge Cell 2, as constructed in 2010. The facility operated per Phase 3 of the permit throughout the 2018 Calendar Year. Contingency plans are in place within the current USF Permit to allow the District to perform enhancement functions as needed to maximize recharge at the facility. 2.1 Water Delivery Water is delivered to MHPERP via the “oxbow” channel, a remnant channel of the Santa Cruz River from when the riverbed was less incised and the channel meandered back and forth across the floodplain. A berm consisting of streambed materials is used to divert some of the effluent flowing down the main channel of the Santa Cruz River into the oxbow channel. The primary source of the effluent discharge is the Tres Rios Wastewater Reclamation Facility, which is approximately 10 miles upstream of the diversion structure. Some effluent from the new Agua Nueva Wastewater Reclamation Facility, approximately 15 miles upstream of the diversion structure, may mix with the effluent flows from the Tres Rios WRF during the winter months. A constructed wet well collects the oxbow channel flows at the Northeast corner of the facility. Two non-clogging, submersible pumps convey effluent through an 8-inch line into an equalization basin, used to provide a more constant source of available effluent for recharge and help serve as a settling basin for removing particulate materials that could clog the recharge cells. Level sensors automatically turn the pumps on and off due to water levels within the oxbow channel and the equalization basin. From the equalization basin, the effluent passes through a 16-inch isolation valve into the main distribution line, which feeds into each of the four recharge cells through motorized butterfly valves. Due to modifications of the basins over the last several years, the automatic level sensors in these basins are no longer needed to maintain water levels. The valves are closed manually (cranking the turn valve) by the facility operator when the cells are scheduled for a drying cycle. Another effluent delivery system was constructed in November 2016 to provide gravity flow into Recharge Cell 2. The new system consists of a pipeline between the wet well and the bottom of Recharge Cell 2, with a slide ditch gate used to control flows into the basin and a flow meter (FMC2) installed to measure the flows for reporting purposes. The gate opens and closes manually and the flow meter is connected to a solar panel, which saves on electric power use at the facility and allows effluent deliveries to the project even if electrical
3
power is down. From Recharge Cell 2, effluent can be delivered to the other recharge cells through the main distribution line coming from the Equalization Basin. Deliveries to MHPERP are based on the daily cycle of discharges from the treatment plants to the Santa Cruz River. Peaks in water levels at this site normally occur in the late morning and early evening hours. Deliveries to the facility are impacted by storm water events in the Santa Cruz River that damage and sometimes demolish the earthen structure used to divert flows into the oxbow channel. Malfunctioning pumps, faulty valve controls, and basin maintenance can also disrupt deliveries to the facility. Details of all the delivery interruptions for Calendar Year 2018 are provided in Section 6.0 (Facility Inspections and Maintenance) of this report. 2.2 Inflow Volumes Water deliveries into MHPERP are measured using 1) a Magnetflow® Mag Meter installed within the main line that runs from the pumps to the equalization basin (FMeq) and 2) an American Sigma 950 flow meter installed within the gravity-feed pipeline that runs between the wet well and Recharge Cell 2 (FMC2). Upon review of documentation provided by PCRFCD, ADWR’s Recharge Program determined that the facility could use the new delivery system (Monitor Point FMC2) for storing water and recharge credit accrual on December 12, 2016.1 The facility’s operator reads daily totals on-site and then compiles the data onto a daily log sheet. The daily log sheets are transmitted to PCRFCD staff on a weekly basis. Appendix A contains the daily flow meter readings and volumes for Calendar Year 2018; note that there is a separate spreadsheet for meter readings at FMC2. Monthly, quarterly and annual volumes are provided at the bottom of the worksheets in both gallons and acre-feet. The total water volume delivered to MHPERP for Calendar Year 2018 was 637.5 acre-feet (AF), with a high of 154.8 AF in March and a low of 0.0 AF from August through December, after the maximum of 600 acre-feet was surpassed. A total of 226.9 AF (35.6%) was delivered via the pumps into the equalization basin (FMeq) and 410.6 AF (64.4%) was delivered via the gravity-feed pipeline into Cell 2 (FMC2). 2.3 Evaporation/Evapotranspiration Appendix B displays the calculated monthly, quarterly and annual evaporation volumes for the recharge facility. These calculations are based on the Cooley Method (1970) using the “Maximum Curve”, as approved by ADWR (also in Appendix B). Evaporation for each recharge cell is based on the percentage of open surface water that is not covered by vegetation. Daily and monthly wetted areas are provided in Appendix C. Daily and monthly evapotranspiration volumes for the vegetated basins are provided in Appendix D. Evapotranspiration for each recharge cell is based on the percentage of vegetation within each basin, which is determined on a monthly basis during routine site inspections. The evapotranspiration volumes are calculated using the daily reference evapotranspiration values determined by the Arizona Meteorological Network (AZMET) at their Tucson weather station (Figure 3).2 AZMET determines reference 1 ADWR approval was provided via an email from Tracey L. Carpenter, Hydrologist with the Water Planning and Permitting Division, dated December 12, 2016. 2 The Marana weather station continued to be out of service through the 2017 Calendar Year.
4
evapotranspiration (ETo) using a modification to the Penman Equation developed for the California Irrigation Management Information System (CIMIS). An explanation of the procedures used in this computation is also provided in Appendix D. No multiplication factor was used in the calculation of reference evapotranspiration (ETo) for the MHPERP because there are no available crop coefficients for the native vegetation in this region.3 2.4 Recharge Volumes The water quantity summary is provided at the end of Appendix A. This summary includes the monthly net recharge volumes for the facility, which are the sum of the monthly volumes delivered to the recharge cells less the monthly evaporation and evapotranspiration losses. Quarterly sums and the annual sum are also provided on this worksheet. The net recharge (effluent stored) for the facility during the 2018 Calendar Year is 627.7 AF. This means that the maximum permitted amount of 600 AF was stored for the Pima County Regional Wastewater Reclamation Department, who has a Water Storage Permit (No. 73-563876.0200) for the facility. 3.0 HYDROLOGIC MONITORING Hydrologic monitoring of the facility includes measurement of on-site and off-site groundwater levels and direct observation of basin water levels. The on-site monitoring network consists of one monitor well and one piezometer, both measured monthly using a depth sounder (Figure 4). Off-site monitoring consists of quarterly water level measurements for one monitor well, SC-10. 3.1 Basin Water Levels Water levels within the equalization basin are expected to fluctuate from one to five feet above the bottom elevation of 1,984 feet above mean sea level when in operation. Water depths in Recharge Cells 1 and 3 can fluctuate from 4 to 5 feet during the wet cycle, while water depths in Recharge Cell 2 can fluctuate from about 7 to 8 feet during the wet cycle.4 Water depths in Recharge Cell 4 are expected to fluctuate from six to twenty inches during the wet cycles.5 Water levels within the basins are maintained manually by the facility operator to maintain high infiltration rates, as determined by PCRFCD staff based on basin performance and as needed to prevent overflows.
3 The reference evapotranspiration (ET) values are determined for tall (8-15”), cool season grasses. Much of the vegetation in Recharge Cells 3 and 4 consists mostly of shrubs and grasses that are approximately 8-15” in height. Since no information is available for the species at MHPERP, it is assumed that ET losses at this facility are the same as those calculated at the AZMET station. 4 Depths to the bottoms of these three basins have been significantly increased due to enhancement activities. Water levels may primarily range from only two to three feet in Cells 1 & 3 because of greater infiltration rates and shorter wetting cycles. 5 Water depths are measured from a base elevation of 1982 feet above mean sea level. The bottom of the basin has been lowered approximately 8-10 inches since operations commenced in 2003 due to maintenance activities.
5
3.2 Regional Groundwater Levels In 2018, groundwater levels were measured for two monitoring wells, one on-site (HP-1) and one off-site (SC-10). Both wells were measured by PCRFCD personnel using an electric sounder. HP-1 was measured on a monthly basis and SC-10 was measured on a quarterly basis. Appendix E contains the water level data and hydrographs for the on-site and off-site monitor wells. All of the monitor wells have alert levels of 30 feet below land surface (bls) and operation prohibition limits of 20 feet bls. Alert levels for the monitoring wells were not exceeded during the 2018 Calendar Year. Water levels in the on-site deep well (HP-1) fluctuated from 189.0 feet below land surface (bls) in January 2018 to a low of 193.8 feet bls in July 2018, and then up to 186.6 feet bls by December 2018. Water levels in the off-site monitor well (SC-10) dropped from 188.0 feet bls in March 2018 to 192.5 feet bls in September 2018, and then went up to 185.9 feet bls by December 2018. 3.3 Perched Groundwater Occurrence Appendix E also contains the monitoring data and hydrograph for the one piezometer (HP-2) used to assess perched water conditions at the facility. This well was dry at its total depth of 80 feet bls during the entire 2018 Calendar Year. The alert level and operation prohibition limit for this well are set at 30 feet bls and 20 feet bls respectively. 4.0 INFILTRATION RATE ASSESSMENT Appendix F contains the average monthly, quarterly and annual infiltration rates for the entire facility during the 2018 Calendar Year. Infiltration rates are estimated using the “volumetric” method, which is simply the total daily inflow divided by the wetted acreage. Total wetted acreage for the facility is a summation of the wetted acreages for the recharge cells in operation, as described below. The total wetted acreage used to calculate the infiltration rate within each recharge cell is determined using observations made by the daily operator combined with known topography of the recharge cell bottom. Rating curves, calculated using topography of the site, are used to estimate the percentage of wetted area in each recharge cell. The percent wetted area is then multiplied by the total basin acreage to calculate the wetted acreage. Water levels within the equalization basin are determined visually by the facility operator using a staff gauge. The data is recorded onto daily logs and provided to PCRFCD on a monthly basis. Infiltration rates are then calculated using the same methods as for the recharge cells. In 2018, monthly infiltration rates for the project ranged from 0.00 feet per day in August through December (no water delivered) to 3.88 feet per day in March. The average infiltration rate for the year was 1.69 feet/day, which is just slightly above last year’s rate of 1.63 feet/day. Infiltration rates were greater than one foot/day in every month that had consistent daily deliveries to the facility (July being the exception). The moderately high infiltration rates are primarily a product of the deepening of the basins (exposure to coarser materials) in previous years and improved effluent quality from the upstream treatment plants.
6
5.0 WATER QUALITY MONITORING 5.1 Water Quality Sampling Activities The Aquifer Protection Permit (APP) requires water quality samples to be collected and analyzed on a monthly basis for nutrients (Nitrogen constituents) and total coliform (presence/absence); on a quarterly basin for total metals, fluoride and cyanide; and on a semiannual basis for Volatile and Semi-Volatile Organic Compounds (VOCs and SVOCs). Samples are collected from the source water inflow and from monitor well HP-1. Nitrogen forms are monitored more frequently because of the high nitrogen content in effluent water, and the potential for recharge to increase the nitrogen content in the local aquifer through leaching of nearby agricultural soils. Water quality sampling at MHPERP also serves as a tool for studying nitrogen transformations in riparian and aquatic ecosystems, to determine if nitrogen levels can be reduced through the wetland recharge process. 5.2 Chemical Analyses Results Table 1 summarizes the results from samples taken during the 2018 Calendar Year. Samples were taken at the oxbow channel (Diversion) and at the compliance well (HP-1). There were no disruptions to sampling along the oxbow channel, but samples were not collected at HP-1 in December due to malfunctioning pump equipment. There were no exceedances of the discharge limits or aquifer quality limits for the Diversion and HP-1. Therefore, there were no violations of the Aquifer Protection Permit (APP) during Calendar Year 2018. 6.0 FACILITY INSPECTIONS Inspections of the facility equipment and functions are no longer a requirement of the Aquifer Protection Permit (APP) for this facility since June 2014. However, PCRFCD continues to inspect the facility on a regular basis to insure proper functioning of the equipment and that any problems are dealt with in a timely manner. The facility operator at MHPERP continues to perform inspections on a daily basis while collecting data for PCRFCD, transmitting any problems or required maintenance through the daily logs delivered on a weekly basis to PCRFCD. PCRFCD staff is contacted immediately for any alarms or serious problems concerning the facility equipment. PCRFCD performs monthly investigations of the facility to insure quality of the data collected and to note any general maintenance needs. Table 2 lists the problems that occurred during the 2018 Calendar Year and the actions performed to resolve them. A very brief disruption of effluent deliveries to the facility occurred in July, when storm water along the Santa Cruz River washed out the earthen diversion berm. The berm was quickly repaired and recharge resumed until the end of the month, when total deliveries exceeded 600 AF. Subsequent storm runoff events damaged the berm, but repairs were not made until the end of the year in preparation for recharge deliveries in 2019. The summer monsoon period (July through mid-September) is typically the major disruption of effluent deliveries to the facility every year. The facility was only down for a total of 4 days due to washouts of the berm and the activities to repair it. Note that the gravity-feed pipeline into Cell 2 was closed for 31 days from February to March to make minor repairs.

7
7.0 CONCLUSIONS The calculated volume of water stored at MHPERP for Calendar Year 2018 was 627.7 AF. This is the fifth consecutive year that the facility has reached at least 600 AF. The facility operated under Phase 3 of the modified USF Permit No. 71-563876.0008 for the entire Calendar Year, which allowed the Pima County Regional Wastewater Reclamation District to store a maximum of 600 AF for the year. Monitoring of operations has showed no continuing exceedences of water quality standards (Drinking Water Standards) at the project site. On-site and off-site monitoring showed no negative impacts to surrounding operations from a water level perspective. Infiltration at the facility was relatively good during 2018, maintaining monthly rates over one foot/day during normal operations. The average annual infiltration rate for the entire facility in 2018 was 1.69 feet/day, which is a good rate considering there were very few disruptions to effluent deliveries between the start of operations on January 1 and the end of operations on July 31. Deepening of the basins and improved quality of effluent from the upstream treatment facilities has significantly increased infiltration at this facility over the last several years. A total of only 4 days resulted in no effluent deliveries to the project during facility operations. All down time was due to washout of the diversion berm by a storm flow event in early July. Facility operations ended on July 31 due to the annual permitted amount of 600 AF being surpassed. This resulted in another 153 days of downtime at the end of the year to allow the basins to dry and for basin maintenance in preparation for Calendar Year 2019. Greater exposure of sands and gravels in Recharge Basins 1-3 and a better quality effluent (lower turbidity and nutrients) delivered by the upstream treatment facilities has made the facility much more efficient; and the goal of 600 AF of recharge per annum more attainable. The addition of the gravity-feed distribution system into Recharge Cell 2 allows the project to operate with very little use of electricity supplied by the local power company and independent of mechanical pumps that can break down or reduce in efficiency over time.

FIGURES
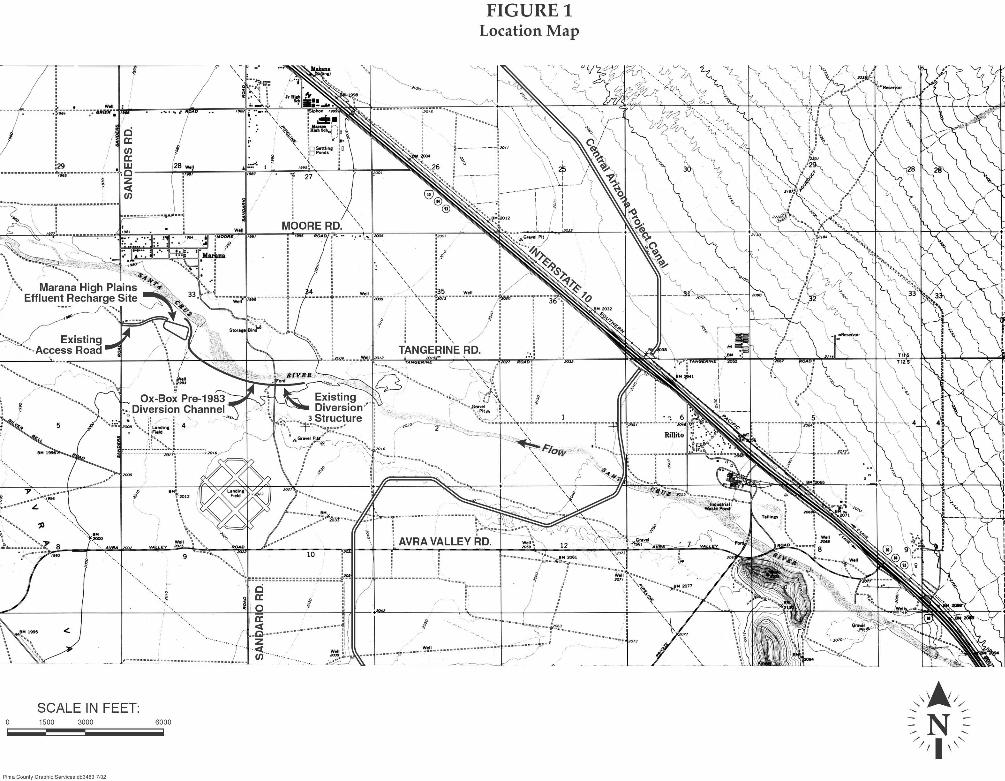
FIGURE 2 Facility Map
SCALE IN FEET:
100 50 25 0
TOTAL RECHARGE AREA = 4.50 ACRES ESTIMATED RECHARGE VOLUME = 600 ACRE-FT/YR
LEGEND MONITOR WELL
PIEZOMETER
EXISTING CONVEYANCE (FMeq)
NEW CONVEYANCE (FMC2)

Miles 2 4
FIGURE 3 Tucson AZMET Weather Station
Location Map
W I1
N O
RA
C
N S
TO
N
W GORET RD
N 1
ST
N C
AM
PB
R
Y C
LUB
RD N
ALV
ERN
A
N R
D
N S
AN
DA
R
N C
AM
INO
DE
W PRINCE RD
E RIVE
E I10
W WETMORE RD NVILLE RD
W EL CAMINO DEL CERRO E I10
E RIVER RD
W RIVER RD
W I10
W SUNSET RD E SUNRIS
W I10
W GOLDEN GATE RD
W ORANGE GROVE RD
N O
RA
CL
E RD
W RIVER RD
W ORANGE GROVE RD E SKYLINE DR
N S
AN
DA
RIO
RD
W PICTURE ROCKS RD
N YU
MA
MIN
E RD
W INA RD W INA RD
N LA
CH
OLLA
BL
W INA RD W INA RD E INA RD
W MAGEE RDW MAGEE RDW
I10
N SILVERBELL RD
W I10
W CORTARO FARMS RD
W HARDY RD
W OVERTON RD
N SILVER
BELL R
D
W TWIN PEA
KS RD
W I10
N S
AN
DA
RIO
RD
W LINDA VISTA BL
W LAMBERT LN
N LA
CH
OLLA
BL
N LA
CA
NA
DA
DR
W I10W AVRA VALLEY RD
W AVRA VALLEY RD
E LAMBERT LN
N S
HA
NN
ON
RD
W NARANJA DR
W T
WIN
PEA
KS
RD
E I10
W T
ANGE
RINE
RD
W TANGERINE RD W TANGERINE RD E TANGERINE RD
N O
RA
CL
E R
D S
AN
DER
S R
D
ANGERINE FARMS RD
W MOORE RD W MOORE RD W MOORE RD
W SILVERBELL RD
MHPERP
AZMET Weather Station
Date on line: Jan 1 1987 (Day of Year = 1) Location: 1 km (p.6 miles) northwest of Intersection of Campbell Ave. & Roger Rd. Elevation: 713 meters (2339 ft) Coordinates: Latitude = 32º 16’ 49” N; Longitude = 110º 56’ 45” W Cooperator: Campus Agricultural Center (CAC), College of Agri., Univ. of Arizona
LEGEND Weather Station
1
SCALE

FIGURE 4 Marana High Plains Effluent Recharge Project Monitor Wells Location Map

TABLES
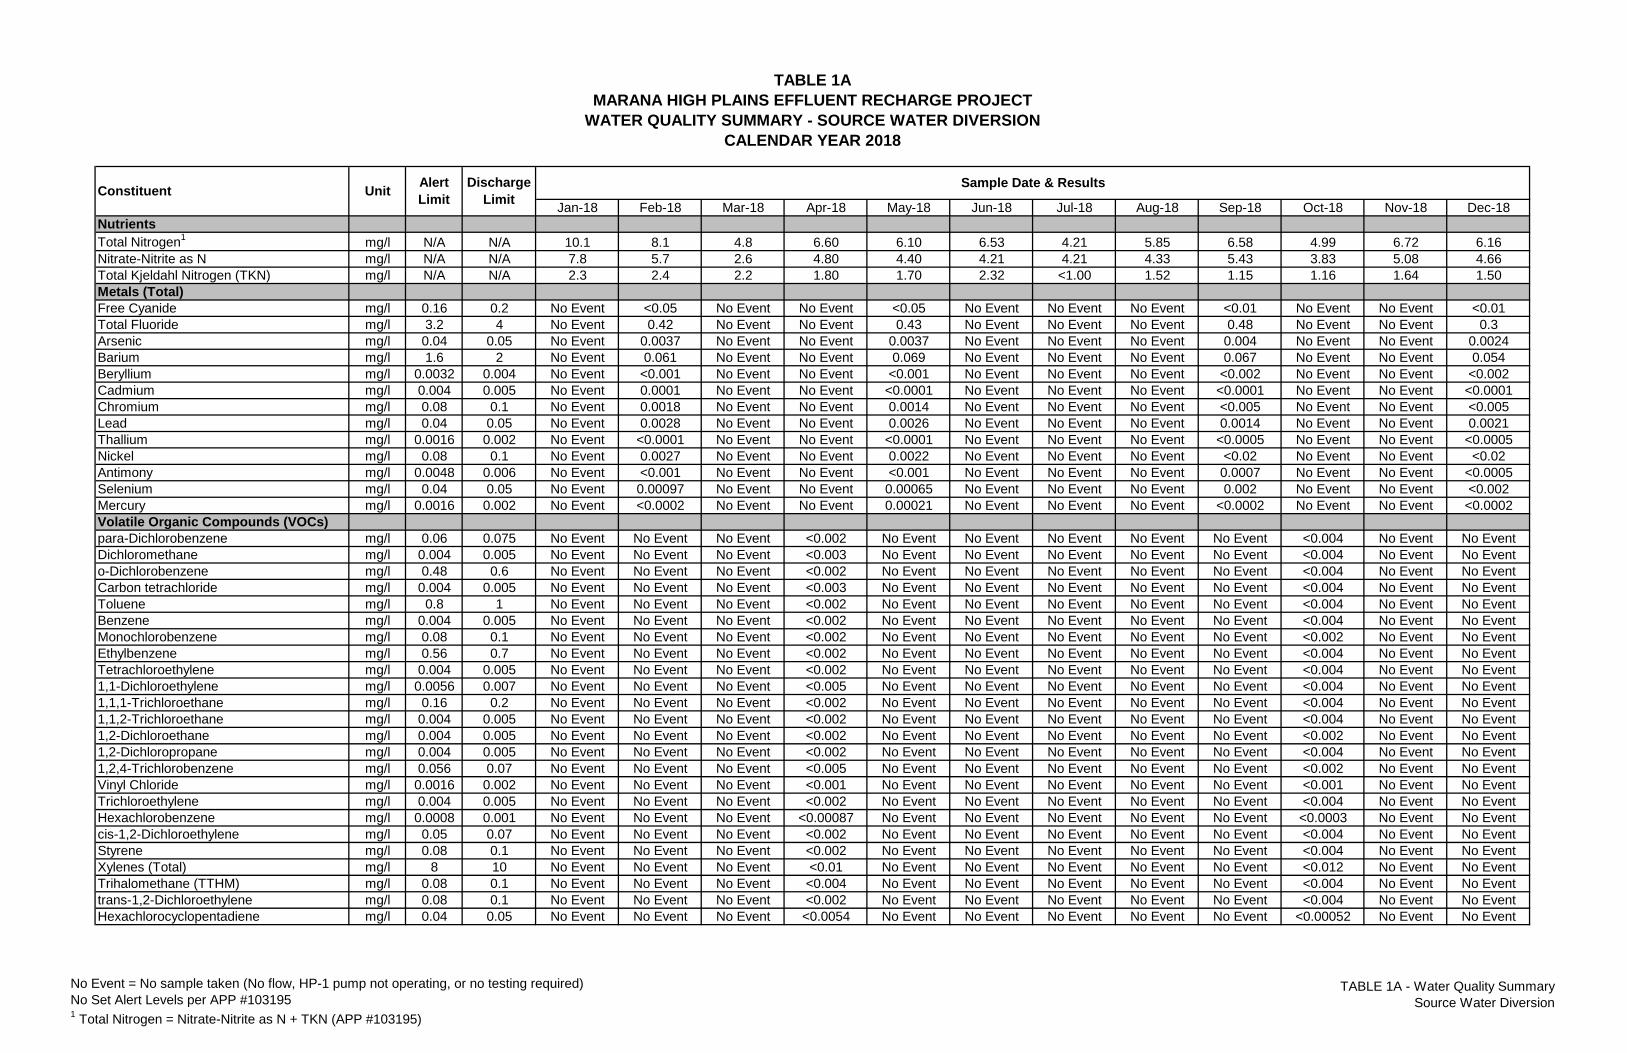
TABLE 1AMARANA HIGH PLAINS EFFLUENT RECHARGE PROJECT
WATER QUALITY SUMMARY - SOURCE WATER DIVERSIONCALENDAR YEAR 2018
No Event = No sample taken (No flow, HP-1 pump not operating, or no testing required)No Set Alert Levels per APP #1031951 Total Nitrogen = Nitrate-Nitrite as N + TKN (APP #103195)
TABLE 1A - Water Quality SummarySource Water Diversion
Jan-18 Feb-18 Mar-18 Apr-18 May-18 Jun-18 Jul-18 Aug-18 Sep-18 Oct-18 Nov-18 Dec-18NutrientsTotal Nitrogen1 mg/l N/A N/A 10.1 8.1 4.8 6.60 6.10 6.53 4.21 5.85 6.58 4.99 6.72 6.16Nitrate-Nitrite as N mg/l N/A N/A 7.8 5.7 2.6 4.80 4.40 4.21 4.21 4.33 5.43 3.83 5.08 4.66Total Kjeldahl Nitrogen (TKN) mg/l N/A N/A 2.3 2.4 2.2 1.80 1.70 2.32 <1.00 1.52 1.15 1.16 1.64 1.50Metals (Total)Free Cyanide mg/l 0.16 0.2 No Event <0.05 No Event No Event <0.05 No Event No Event No Event <0.01 No Event No Event <0.01Total Fluoride mg/l 3.2 4 No Event 0.42 No Event No Event 0.43 No Event No Event No Event 0.48 No Event No Event 0.3Arsenic mg/l 0.04 0.05 No Event 0.0037 No Event No Event 0.0037 No Event No Event No Event 0.004 No Event No Event 0.0024Barium mg/l 1.6 2 No Event 0.061 No Event No Event 0.069 No Event No Event No Event 0.067 No Event No Event 0.054Beryllium mg/l 0.0032 0.004 No Event <0.001 No Event No Event <0.001 No Event No Event No Event <0.002 No Event No Event <0.002Cadmium mg/l 0.004 0.005 No Event 0.0001 No Event No Event <0.0001 No Event No Event No Event <0.0001 No Event No Event <0.0001Chromium mg/l 0.08 0.1 No Event 0.0018 No Event No Event 0.0014 No Event No Event No Event <0.005 No Event No Event <0.005Lead mg/l 0.04 0.05 No Event 0.0028 No Event No Event 0.0026 No Event No Event No Event 0.0014 No Event No Event 0.0021Thallium mg/l 0.0016 0.002 No Event <0.0001 No Event No Event <0.0001 No Event No Event No Event <0.0005 No Event No Event <0.0005Nickel mg/l 0.08 0.1 No Event 0.0027 No Event No Event 0.0022 No Event No Event No Event <0.02 No Event No Event <0.02Antimony mg/l 0.0048 0.006 No Event <0.001 No Event No Event <0.001 No Event No Event No Event 0.0007 No Event No Event <0.0005Selenium mg/l 0.04 0.05 No Event 0.00097 No Event No Event 0.00065 No Event No Event No Event 0.002 No Event No Event <0.002Mercury mg/l 0.0016 0.002 No Event <0.0002 No Event No Event 0.00021 No Event No Event No Event <0.0002 No Event No Event <0.0002Volatile Organic Compounds (VOCs)para-Dichlorobenzene mg/l 0.06 0.075 No Event No Event No Event <0.002 No Event No Event No Event No Event No Event <0.004 No Event No EventDichloromethane mg/l 0.004 0.005 No Event No Event No Event <0.003 No Event No Event No Event No Event No Event <0.004 No Event No Evento-Dichlorobenzene mg/l 0.48 0.6 No Event No Event No Event <0.002 No Event No Event No Event No Event No Event <0.004 No Event No EventCarbon tetrachloride mg/l 0.004 0.005 No Event No Event No Event <0.003 No Event No Event No Event No Event No Event <0.004 No Event No EventToluene mg/l 0.8 1 No Event No Event No Event <0.002 No Event No Event No Event No Event No Event <0.004 No Event No EventBenzene mg/l 0.004 0.005 No Event No Event No Event <0.002 No Event No Event No Event No Event No Event <0.004 No Event No EventMonochlorobenzene mg/l 0.08 0.1 No Event No Event No Event <0.002 No Event No Event No Event No Event No Event <0.002 No Event No EventEthylbenzene mg/l 0.56 0.7 No Event No Event No Event <0.002 No Event No Event No Event No Event No Event <0.004 No Event No EventTetrachloroethylene mg/l 0.004 0.005 No Event No Event No Event <0.002 No Event No Event No Event No Event No Event <0.004 No Event No Event1,1-Dichloroethylene mg/l 0.0056 0.007 No Event No Event No Event <0.005 No Event No Event No Event No Event No Event <0.004 No Event No Event1,1,1-Trichloroethane mg/l 0.16 0.2 No Event No Event No Event <0.002 No Event No Event No Event No Event No Event <0.004 No Event No Event1,1,2-Trichloroethane mg/l 0.004 0.005 No Event No Event No Event <0.002 No Event No Event No Event No Event No Event <0.004 No Event No Event1,2-Dichloroethane mg/l 0.004 0.005 No Event No Event No Event <0.002 No Event No Event No Event No Event No Event <0.002 No Event No Event1,2-Dichloropropane mg/l 0.004 0.005 No Event No Event No Event <0.002 No Event No Event No Event No Event No Event <0.004 No Event No Event1,2,4-Trichlorobenzene mg/l 0.056 0.07 No Event No Event No Event <0.005 No Event No Event No Event No Event No Event <0.002 No Event No EventVinyl Chloride mg/l 0.0016 0.002 No Event No Event No Event <0.001 No Event No Event No Event No Event No Event <0.001 No Event No EventTrichloroethylene mg/l 0.004 0.005 No Event No Event No Event <0.002 No Event No Event No Event No Event No Event <0.004 No Event No EventHexachlorobenzene mg/l 0.0008 0.001 No Event No Event No Event <0.00087 No Event No Event No Event No Event No Event <0.0003 No Event No Eventcis-1,2-Dichloroethylene mg/l 0.05 0.07 No Event No Event No Event <0.002 No Event No Event No Event No Event No Event <0.004 No Event No EventStyrene mg/l 0.08 0.1 No Event No Event No Event <0.002 No Event No Event No Event No Event No Event <0.004 No Event No EventXylenes (Total) mg/l 8 10 No Event No Event No Event <0.01 No Event No Event No Event No Event No Event <0.012 No Event No EventTrihalomethane (TTHM) mg/l 0.08 0.1 No Event No Event No Event <0.004 No Event No Event No Event No Event No Event <0.004 No Event No Eventtrans-1,2-Dichloroethylene mg/l 0.08 0.1 No Event No Event No Event <0.002 No Event No Event No Event No Event No Event <0.004 No Event No EventHexachlorocyclopentadiene mg/l 0.04 0.05 No Event No Event No Event <0.0054 No Event No Event No Event No Event No Event <0.00052 No Event No Event
DischargeLimit
Sample Date & ResultsConstituent Unit AlertLimit
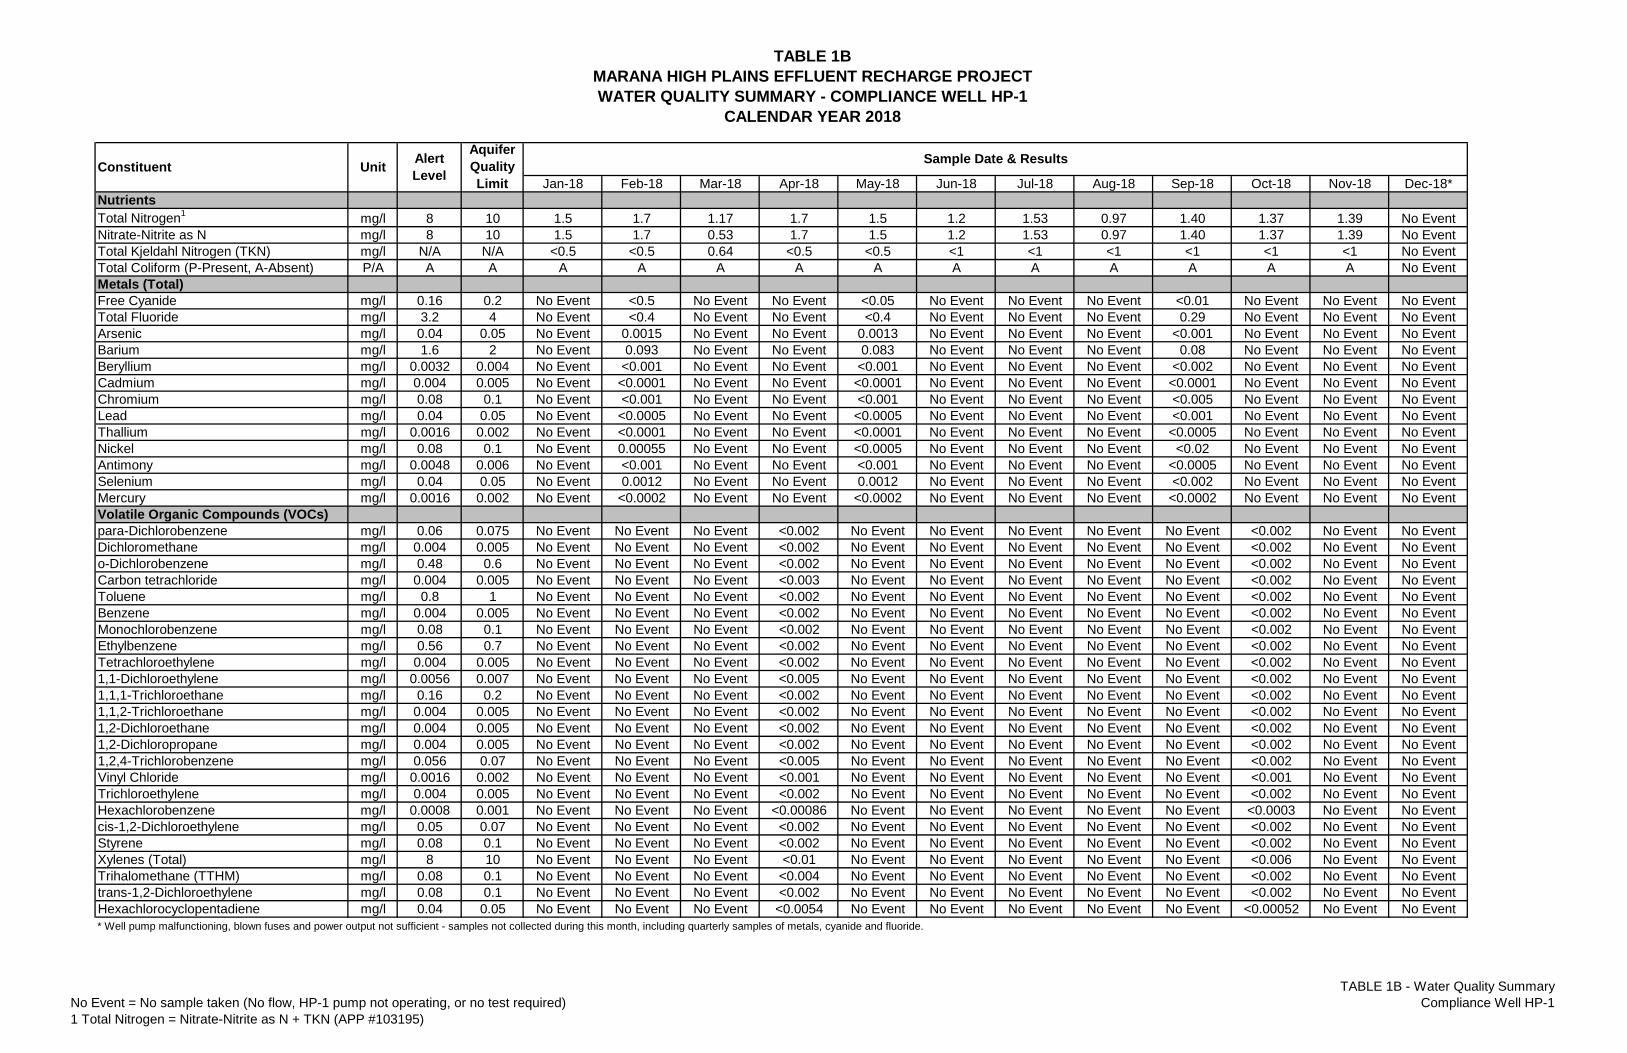
TABLE 1BMARANA HIGH PLAINS EFFLUENT RECHARGE PROJECTWATER QUALITY SUMMARY - COMPLIANCE WELL HP-1
CALENDAR YEAR 2018
No Event = No sample taken (No flow, HP-1 pump not operating, or no test required)1 Total Nitrogen = Nitrate-Nitrite as N + TKN (APP #103195)
TABLE 1B - Water Quality SummaryCompliance Well HP-1
Jan-18 Feb-18 Mar-18 Apr-18 May-18 Jun-18 Jul-18 Aug-18 Sep-18 Oct-18 Nov-18 Dec-18*NutrientsTotal Nitrogen1 mg/l 8 10 1.5 1.7 1.17 1.7 1.5 1.2 1.53 0.97 1.40 1.37 1.39 No EventNitrate-Nitrite as N mg/l 8 10 1.5 1.7 0.53 1.7 1.5 1.2 1.53 0.97 1.40 1.37 1.39 No EventTotal Kjeldahl Nitrogen (TKN) mg/l N/A N/A <0.5 <0.5 0.64 <0.5 <0.5 <1 <1 <1 <1 <1 <1 No EventTotal Coliform (P-Present, A-Absent) P/A A A A A A A A A A A A A A No EventMetals (Total)Free Cyanide mg/l 0.16 0.2 No Event <0.5 No Event No Event <0.05 No Event No Event No Event <0.01 No Event No Event No EventTotal Fluoride mg/l 3.2 4 No Event <0.4 No Event No Event <0.4 No Event No Event No Event 0.29 No Event No Event No EventArsenic mg/l 0.04 0.05 No Event 0.0015 No Event No Event 0.0013 No Event No Event No Event <0.001 No Event No Event No EventBarium mg/l 1.6 2 No Event 0.093 No Event No Event 0.083 No Event No Event No Event 0.08 No Event No Event No EventBeryllium mg/l 0.0032 0.004 No Event <0.001 No Event No Event <0.001 No Event No Event No Event <0.002 No Event No Event No EventCadmium mg/l 0.004 0.005 No Event <0.0001 No Event No Event <0.0001 No Event No Event No Event <0.0001 No Event No Event No EventChromium mg/l 0.08 0.1 No Event <0.001 No Event No Event <0.001 No Event No Event No Event <0.005 No Event No Event No EventLead mg/l 0.04 0.05 No Event <0.0005 No Event No Event <0.0005 No Event No Event No Event <0.001 No Event No Event No EventThallium mg/l 0.0016 0.002 No Event <0.0001 No Event No Event <0.0001 No Event No Event No Event <0.0005 No Event No Event No EventNickel mg/l 0.08 0.1 No Event 0.00055 No Event No Event <0.0005 No Event No Event No Event <0.02 No Event No Event No EventAntimony mg/l 0.0048 0.006 No Event <0.001 No Event No Event <0.001 No Event No Event No Event <0.0005 No Event No Event No EventSelenium mg/l 0.04 0.05 No Event 0.0012 No Event No Event 0.0012 No Event No Event No Event <0.002 No Event No Event No EventMercury mg/l 0.0016 0.002 No Event <0.0002 No Event No Event <0.0002 No Event No Event No Event <0.0002 No Event No Event No EventVolatile Organic Compounds (VOCs)para-Dichlorobenzene mg/l 0.06 0.075 No Event No Event No Event <0.002 No Event No Event No Event No Event No Event <0.002 No Event No EventDichloromethane mg/l 0.004 0.005 No Event No Event No Event <0.002 No Event No Event No Event No Event No Event <0.002 No Event No Evento-Dichlorobenzene mg/l 0.48 0.6 No Event No Event No Event <0.002 No Event No Event No Event No Event No Event <0.002 No Event No EventCarbon tetrachloride mg/l 0.004 0.005 No Event No Event No Event <0.003 No Event No Event No Event No Event No Event <0.002 No Event No EventToluene mg/l 0.8 1 No Event No Event No Event <0.002 No Event No Event No Event No Event No Event <0.002 No Event No EventBenzene mg/l 0.004 0.005 No Event No Event No Event <0.002 No Event No Event No Event No Event No Event <0.002 No Event No EventMonochlorobenzene mg/l 0.08 0.1 No Event No Event No Event <0.002 No Event No Event No Event No Event No Event <0.002 No Event No EventEthylbenzene mg/l 0.56 0.7 No Event No Event No Event <0.002 No Event No Event No Event No Event No Event <0.002 No Event No EventTetrachloroethylene mg/l 0.004 0.005 No Event No Event No Event <0.002 No Event No Event No Event No Event No Event <0.002 No Event No Event1,1-Dichloroethylene mg/l 0.0056 0.007 No Event No Event No Event <0.005 No Event No Event No Event No Event No Event <0.002 No Event No Event1,1,1-Trichloroethane mg/l 0.16 0.2 No Event No Event No Event <0.002 No Event No Event No Event No Event No Event <0.002 No Event No Event1,1,2-Trichloroethane mg/l 0.004 0.005 No Event No Event No Event <0.002 No Event No Event No Event No Event No Event <0.002 No Event No Event1,2-Dichloroethane mg/l 0.004 0.005 No Event No Event No Event <0.002 No Event No Event No Event No Event No Event <0.002 No Event No Event1,2-Dichloropropane mg/l 0.004 0.005 No Event No Event No Event <0.002 No Event No Event No Event No Event No Event <0.002 No Event No Event1,2,4-Trichlorobenzene mg/l 0.056 0.07 No Event No Event No Event <0.005 No Event No Event No Event No Event No Event <0.002 No Event No EventVinyl Chloride mg/l 0.0016 0.002 No Event No Event No Event <0.001 No Event No Event No Event No Event No Event <0.001 No Event No EventTrichloroethylene mg/l 0.004 0.005 No Event No Event No Event <0.002 No Event No Event No Event No Event No Event <0.002 No Event No EventHexachlorobenzene mg/l 0.0008 0.001 No Event No Event No Event <0.00086 No Event No Event No Event No Event No Event <0.0003 No Event No Eventcis-1,2-Dichloroethylene mg/l 0.05 0.07 No Event No Event No Event <0.002 No Event No Event No Event No Event No Event <0.002 No Event No EventStyrene mg/l 0.08 0.1 No Event No Event No Event <0.002 No Event No Event No Event No Event No Event <0.002 No Event No EventXylenes (Total) mg/l 8 10 No Event No Event No Event <0.01 No Event No Event No Event No Event No Event <0.006 No Event No EventTrihalomethane (TTHM) mg/l 0.08 0.1 No Event No Event No Event <0.004 No Event No Event No Event No Event No Event <0.002 No Event No Eventtrans-1,2-Dichloroethylene mg/l 0.08 0.1 No Event No Event No Event <0.002 No Event No Event No Event No Event No Event <0.002 No Event No EventHexachlorocyclopentadiene mg/l 0.04 0.05 No Event No Event No Event <0.0054 No Event No Event No Event No Event No Event <0.00052 No Event No Event* Well pump malfunctioning, blown fuses and power output not sufficient - samples not collected during this month, including quarterly samples of metals, cyanide and fluoride.
Constituent Unit AlertLevel
AquiferQualityLimit
Sample Date & Results
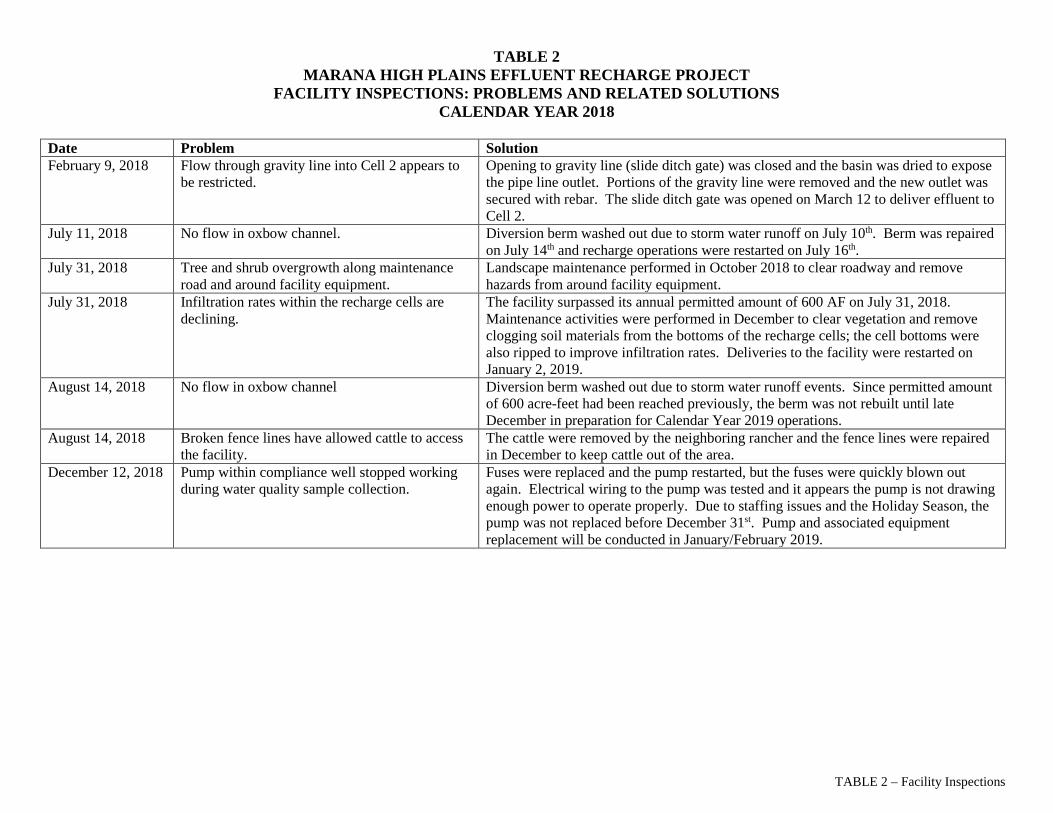
TABLE 2 MARANA HIGH PLAINS EFFLUENT RECHARGE PROJECT
FACILITY INSPECTIONS: PROBLEMS AND RELATED SOLUTIONS CALENDAR YEAR 2018
TABLE 2 – Facility Inspections
Date Problem Solution February 9, 2018 Flow through gravity line into Cell 2 appears to
be restricted. Opening to gravity line (slide ditch gate) was closed and the basin was dried to expose the pipe line outlet. Portions of the gravity line were removed and the new outlet was secured with rebar. The slide ditch gate was opened on March 12 to deliver effluent to Cell 2.
July 11, 2018 No flow in oxbow channel. Diversion berm washed out due to storm water runoff on July 10th. Berm was repaired on July 14th and recharge operations were restarted on July 16th.
July 31, 2018 Tree and shrub overgrowth along maintenance road and around facility equipment.
Landscape maintenance performed in October 2018 to clear roadway and remove hazards from around facility equipment.
July 31, 2018 Infiltration rates within the recharge cells are declining.
The facility surpassed its annual permitted amount of 600 AF on July 31, 2018. Maintenance activities were performed in December to clear vegetation and remove clogging soil materials from the bottoms of the recharge cells; the cell bottoms were also ripped to improve infiltration rates. Deliveries to the facility were restarted on January 2, 2019.
August 14, 2018 No flow in oxbow channel Diversion berm washed out due to storm water runoff events. Since permitted amount of 600 acre-feet had been reached previously, the berm was not rebuilt until late December in preparation for Calendar Year 2019 operations.
August 14, 2018 Broken fence lines have allowed cattle to access the facility.
The cattle were removed by the neighboring rancher and the fence lines were repaired in December to keep cattle out of the area.
December 12, 2018 Pump within compliance well stopped working during water quality sample collection.
Fuses were replaced and the pump restarted, but the fuses were quickly blown out again. Electrical wiring to the pump was tested and it appears the pump is not drawing enough power to operate properly. Due to staffing issues and the Holiday Season, the pump was not replaced before December 31st. Pump and associated equipment replacement will be conducted in January/February 2019.

APPENDIX A Daily Flow Volumes &
Water Quantity Summary
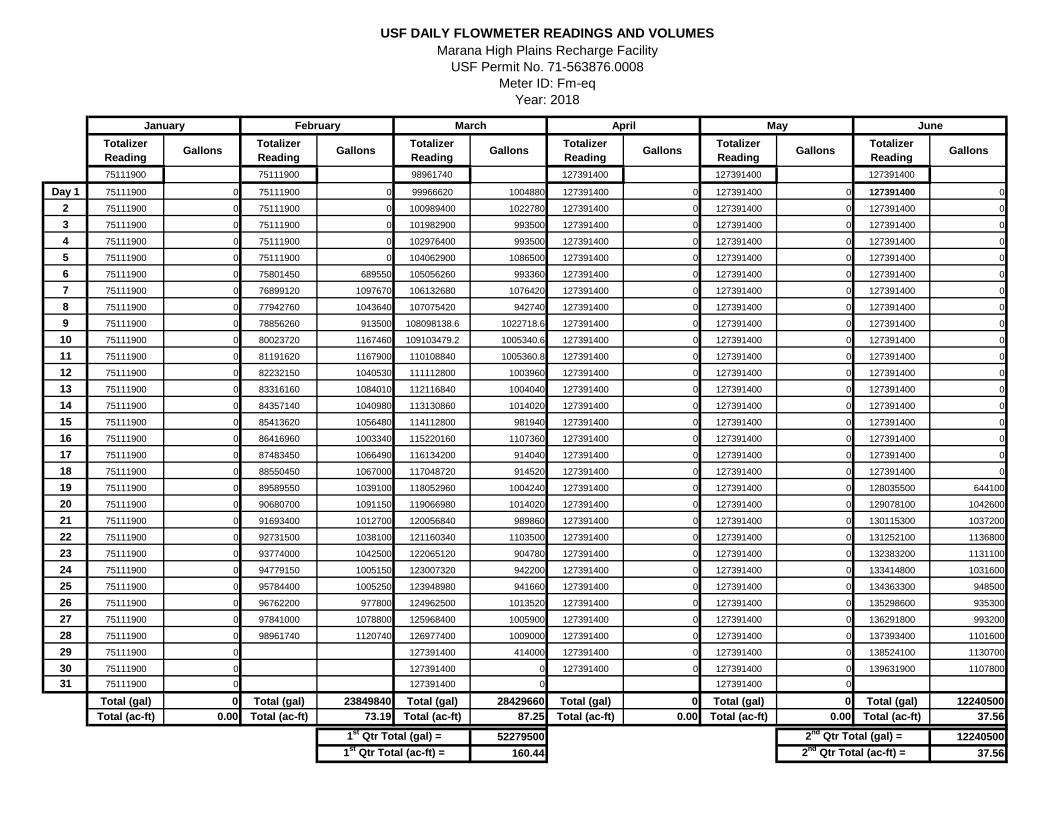
TotalizerReading Gallons Totalizer
Reading Gallons TotalizerReading Gallons Totalizer
Reading Gallons TotalizerReading Gallons Totalizer
Reading Gallons
75111900 75111900 98961740 127391400 127391400 127391400
Day 1 75111900 0 75111900 0 99966620 1004880 127391400 0 127391400 0 127391400 0
2 75111900 0 75111900 0 100989400 1022780 127391400 0 127391400 0 127391400 0
3 75111900 0 75111900 0 101982900 993500 127391400 0 127391400 0 127391400 0
4 75111900 0 75111900 0 102976400 993500 127391400 0 127391400 0 127391400 0
5 75111900 0 75111900 0 104062900 1086500 127391400 0 127391400 0 127391400 0
6 75111900 0 75801450 689550 105056260 993360 127391400 0 127391400 0 127391400 0
7 75111900 0 76899120 1097670 106132680 1076420 127391400 0 127391400 0 127391400 0
8 75111900 0 77942760 1043640 107075420 942740 127391400 0 127391400 0 127391400 0
9 75111900 0 78856260 913500 108098138.6 1022718.6 127391400 0 127391400 0 127391400 0
10 75111900 0 80023720 1167460 109103479.2 1005340.6 127391400 0 127391400 0 127391400 0
11 75111900 0 81191620 1167900 110108840 1005360.8 127391400 0 127391400 0 127391400 0
12 75111900 0 82232150 1040530 111112800 1003960 127391400 0 127391400 0 127391400 0
13 75111900 0 83316160 1084010 112116840 1004040 127391400 0 127391400 0 127391400 0
14 75111900 0 84357140 1040980 113130860 1014020 127391400 0 127391400 0 127391400 0
15 75111900 0 85413620 1056480 114112800 981940 127391400 0 127391400 0 127391400 0
16 75111900 0 86416960 1003340 115220160 1107360 127391400 0 127391400 0 127391400 0
17 75111900 0 87483450 1066490 116134200 914040 127391400 0 127391400 0 127391400 0
18 75111900 0 88550450 1067000 117048720 914520 127391400 0 127391400 0 127391400 0
19 75111900 0 89589550 1039100 118052960 1004240 127391400 0 127391400 0 128035500 644100
20 75111900 0 90680700 1091150 119066980 1014020 127391400 0 127391400 0 129078100 1042600
21 75111900 0 91693400 1012700 120056840 989860 127391400 0 127391400 0 130115300 1037200
22 75111900 0 92731500 1038100 121160340 1103500 127391400 0 127391400 0 131252100 1136800
23 75111900 0 93774000 1042500 122065120 904780 127391400 0 127391400 0 132383200 1131100
24 75111900 0 94779150 1005150 123007320 942200 127391400 0 127391400 0 133414800 1031600
25 75111900 0 95784400 1005250 123948980 941660 127391400 0 127391400 0 134363300 948500
26 75111900 0 96762200 977800 124962500 1013520 127391400 0 127391400 0 135298600 935300
27 75111900 0 97841000 1078800 125968400 1005900 127391400 0 127391400 0 136291800 993200
28 75111900 0 98961740 1120740 126977400 1009000 127391400 0 127391400 0 137393400 1101600
29 75111900 0 127391400 414000 127391400 0 127391400 0 138524100 1130700
30 75111900 0 127391400 0 127391400 0 127391400 0 139631900 110780031 75111900 0 127391400 0 127391400 0
Total (gal) 0 Total (gal) 23849840 Total (gal) 28429660 Total (gal) 0 Total (gal) 0 Total (gal) 12240500Total (ac-ft) 0.00 Total (ac-ft) 73.19 Total (ac-ft) 87.25 Total (ac-ft) 0.00 Total (ac-ft) 0.00 Total (ac-ft) 37.56
52279500 12240500160.44 37.56
1st Qtr Total (gal) =1st Qtr Total (ac-ft) =
2nd Qtr Total (gal) =2nd Qtr Total (ac-ft) =
March April MayJanuary February
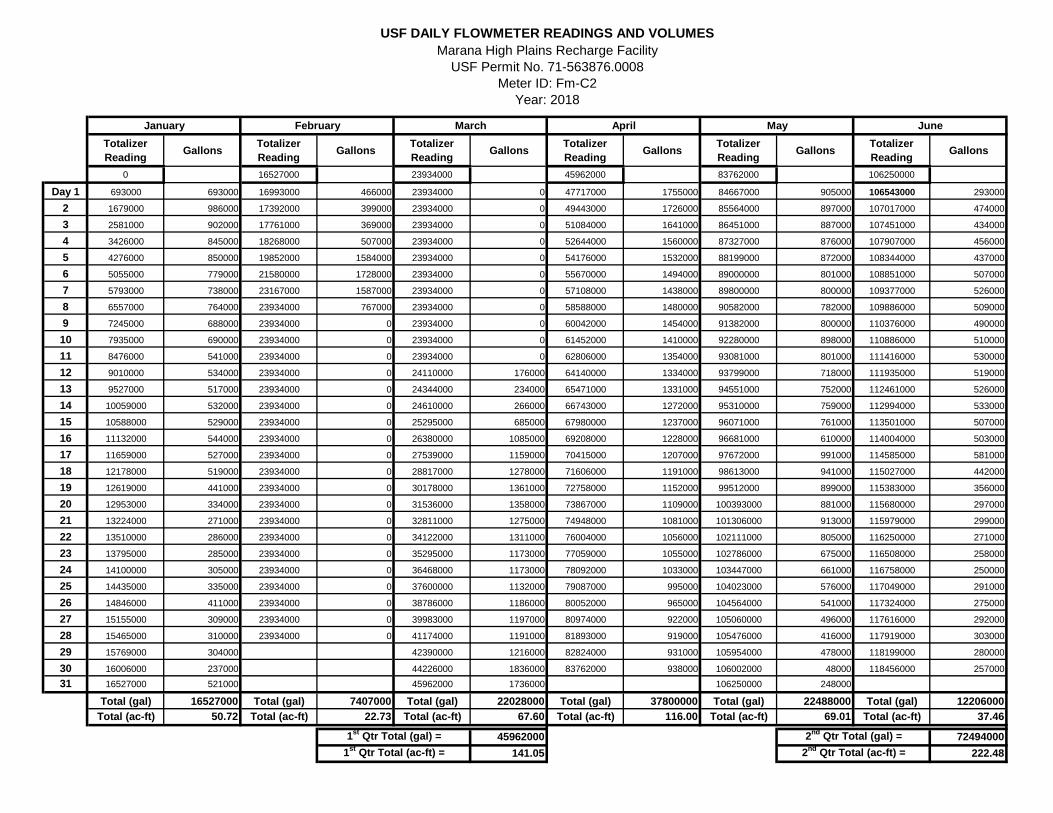
USF DAILY FLOWMETER READINGS AND VOLUMES
Meter ID: Fm-eq
Marana High Plains Recharge FacilityUSF Permit No. 71-563876.0008
Year: 2018
June
Day 12345678910111213141516171819202122232425262728293031
TotalizerReading Gallons Totalizer
Reading Gallons TotalizerReading Gallons Totalizer
Reading Gallons TotalizerReading Gallons Totalizer
Reading Gallons
139631900 149044900 149044900 149044900 149044900 149044900
140439300 807400 149044900 0 149044900 0 149044900 0 149044900 0 149044900 0
141438400 999100 149044900 0 149044900 0 149044900 0 149044900 0 149044900 0
142527500 1089100 149044900 0 149044900 0 149044900 0 149044900 0 149044900 0
143453000 925500 149044900 0 149044900 0 149044900 0 149044900 0 149044900 0
144446900 993900 149044900 0 149044900 0 149044900 0 149044900 0 149044900 0
145439300 992400 149044900 0 149044900 0 149044900 0 149044900 0 149044900 0
146400000 960700 149044900 0 149044900 0 149044900 0 149044900 0 149044900 0
147362700 962700 149044900 0 149044900 0 149044900 0 149044900 0 149044900 0
148325700 963000 149044900 0 149044900 0 149044900 0 149044900 0 149044900 0
149044900 719200 149044900 0 149044900 0 149044900 0 149044900 0 149044900 0
149044900 0 149044900 0 149044900 0 149044900 0 149044900 0 149044900 0
149044900 0 149044900 0 149044900 0 149044900 0 149044900 0 149044900 0
149044900 0 149044900 0 149044900 0 149044900 0 149044900 0 149044900 0
149044900 0 149044900 0 149044900 0 149044900 0 149044900 0 149044900 0
149044900 0 149044900 0 149044900 0 149044900 0 149044900 0 149044900 0
149044900 0 149044900 0 149044900 0 149044900 0 149044900 0 149044900 0
149044900 0 149044900 0 149044900 0 149044900 0 149044900 0 149044900 0
149044900 0 149044900 0 149044900 0 149044900 0 149044900 0 149044900 0
149044900 0 149044900 0 149044900 0 149044900 0 149044900 0 149044900 0
149044900 0 149044900 0 149044900 0 149044900 0 149044900 0 149044900 0
149044900 0 149044900 0 149044900 0 149044900 0 149044900 0 149044900 0
149044900 0 149044900 0 149044900 0 149044900 0 149044900 0 149044900 0
149044900 0 149044900 0 149044900 0 149044900 0 149044900 0 149044900 0
149044900 0 149044900 0 149044900 0 149044900 0 149044900 0 149044900 0
149044900 0 149044900 0 149044900 0 149044900 0 149044900 0 149044900 0
149044900 0 149044900 0 149044900 0 149044900 0 149044900 0 149044900 0
149044900 0 149044900 0 149044900 0 149044900 0 149044900 0 149044900 0
149044900 0 149044900 0 149044900 0 149044900 0 149044900 0 149044900 0
149044900 0 149044900 0 149044900 0 149044900 0 149044900 0 149044900 0
149044900 0 149044900 0 149044900 0 149044900 0 149044900 0 149044900 0149044900 0 149044900 0 149044900 0 149044900 0
Total (gal) 9413000 Total (gal) 0 Total (gal) 0 Total (gal) 0 Total (gal) 0 Total (gal) 0Total (ac-ft) 28.89 Total (ac-ft) 0.00 Total (ac-ft) 0.00 Total (ac-ft) 0.00 Total (ac-ft) 0.00 Total (ac-ft) 0.00
9413000 028.89 0.00
226.89
3rd Qtr Total (gal) =4th Qtr Total (ac-ft) =
September
USF DAILY FLOWMETER READINGS AND VOLUMESMarana High Plains Recharge Facility
USF Permit No. 71-563876.0008Meter ID: Fm-eq
Annual Total Del. Vol for FM-eq (ac-ft) =
4th Qtr Total (gal) =3rd Qtr Total (ac-ft) =
Year: 2018
AugustJuly October November December
TotalizerReading Gallons Totalizer
Reading Gallons TotalizerReading Gallons Totalizer
Reading Gallons TotalizerReading Gallons Totalizer
Reading Gallons
0 16527000 23934000 45962000 83762000 106250000
Day 1 693000 693000 16993000 466000 23934000 0 47717000 1755000 84667000 905000 106543000 293000
2 1679000 986000 17392000 399000 23934000 0 49443000 1726000 85564000 897000 107017000 474000
3 2581000 902000 17761000 369000 23934000 0 51084000 1641000 86451000 887000 107451000 434000
4 3426000 845000 18268000 507000 23934000 0 52644000 1560000 87327000 876000 107907000 456000
5 4276000 850000 19852000 1584000 23934000 0 54176000 1532000 88199000 872000 108344000 437000
6 5055000 779000 21580000 1728000 23934000 0 55670000 1494000 89000000 801000 108851000 507000
7 5793000 738000 23167000 1587000 23934000 0 57108000 1438000 89800000 800000 109377000 526000
8 6557000 764000 23934000 767000 23934000 0 58588000 1480000 90582000 782000 109886000 509000
9 7245000 688000 23934000 0 23934000 0 60042000 1454000 91382000 800000 110376000 490000
10 7935000 690000 23934000 0 23934000 0 61452000 1410000 92280000 898000 110886000 510000
11 8476000 541000 23934000 0 23934000 0 62806000 1354000 93081000 801000 111416000 530000
12 9010000 534000 23934000 0 24110000 176000 64140000 1334000 93799000 718000 111935000 519000
13 9527000 517000 23934000 0 24344000 234000 65471000 1331000 94551000 752000 112461000 526000
14 10059000 532000 23934000 0 24610000 266000 66743000 1272000 95310000 759000 112994000 533000
15 10588000 529000 23934000 0 25295000 685000 67980000 1237000 96071000 761000 113501000 507000
16 11132000 544000 23934000 0 26380000 1085000 69208000 1228000 96681000 610000 114004000 503000
17 11659000 527000 23934000 0 27539000 1159000 70415000 1207000 97672000 991000 114585000 581000
18 12178000 519000 23934000 0 28817000 1278000 71606000 1191000 98613000 941000 115027000 442000
19 12619000 441000 23934000 0 30178000 1361000 72758000 1152000 99512000 899000 115383000 356000
20 12953000 334000 23934000 0 31536000 1358000 73867000 1109000 100393000 881000 115680000 297000
21 13224000 271000 23934000 0 32811000 1275000 74948000 1081000 101306000 913000 115979000 299000
22 13510000 286000 23934000 0 34122000 1311000 76004000 1056000 102111000 805000 116250000 271000
23 13795000 285000 23934000 0 35295000 1173000 77059000 1055000 102786000 675000 116508000 258000
24 14100000 305000 23934000 0 36468000 1173000 78092000 1033000 103447000 661000 116758000 250000
25 14435000 335000 23934000 0 37600000 1132000 79087000 995000 104023000 576000 117049000 291000
26 14846000 411000 23934000 0 38786000 1186000 80052000 965000 104564000 541000 117324000 275000
27 15155000 309000 23934000 0 39983000 1197000 80974000 922000 105060000 496000 117616000 292000
28 15465000 310000 23934000 0 41174000 1191000 81893000 919000 105476000 416000 117919000 303000
29 15769000 304000 42390000 1216000 82824000 931000 105954000 478000 118199000 280000
30 16006000 237000 44226000 1836000 83762000 938000 106002000 48000 118456000 25700031 16527000 521000 45962000 1736000 106250000 248000
Total (gal) 16527000 Total (gal) 7407000 Total (gal) 22028000 Total (gal) 37800000 Total (gal) 22488000 Total (gal) 12206000Total (ac-ft) 50.72 Total (ac-ft) 22.73 Total (ac-ft) 67.60 Total (ac-ft) 116.00 Total (ac-ft) 69.01 Total (ac-ft) 37.46
45962000 72494000141.05 222.48
1st Qtr Total (gal) = 2nd Qtr Total (gal) =1st Qtr Total (ac-ft) = 2nd Qtr Total (ac-ft) =
Meter ID: Fm-C2Year: 2018
January February March April May June
USF DAILY FLOWMETER READINGS AND VOLUMESMarana High Plains Recharge Facility
USF Permit No. 71-563876.0008

Day 12345678910111213141516171819202122232425262728293031
TotalizerReading Gallons Totalizer
Reading Gallons TotalizerReading Gallons Totalizer
Reading Gallons TotalizerReading Gallons Totalizer
Reading Gallons
118456000 133792000 133792000 133792000 149044900 149044900
118707000 251000 133792000 0 133792000 0 133792000 0 149044900 0 149044900 0
118950000 243000 133792000 0 133792000 0 133792000 0 149044900 0 149044900 0
119295000 345000 133792000 0 133792000 0 133792000 0 149044900 0 149044900 0
119675000 380000 133792000 0 133792000 0 133792000 0 149044900 0 149044900 0
120097000 422000 133792000 0 133792000 0 133792000 0 149044900 0 149044900 0
120490000 393000 133792000 0 133792000 0 133792000 0 149044900 0 149044900 0
120883000 393000 133792000 0 133792000 0 133792000 0 149044900 0 149044900 0
121274000 391000 133792000 0 133792000 0 133792000 0 149044900 0 149044900 0
121713000 439000 133792000 0 133792000 0 133792000 0 149044900 0 149044900 0
122135000 422000 133792000 0 133792000 0 133792000 0 149044900 0 149044900 0
122204000 69000 133792000 0 133792000 0 133792000 0 149044900 0 149044900 0
122204000 0 133792000 0 133792000 0 133792000 0 149044900 0 149044900 0
122204000 0 133792000 0 133792000 0 133792000 0 149044900 0 149044900 0
122204000 0 133792000 0 133792000 0 133792000 0 149044900 0 149044900 0
122204000 0 133792000 0 133792000 0 133792000 0 149044900 0 149044900 0
122597000 393000 133792000 0 133792000 0 133792000 0 149044900 0 149044900 0
123446000 849000 133792000 0 133792000 0 133792000 0 149044900 0 149044900 0
124195000 749000 133792000 0 133792000 0 133792000 0 149044900 0 149044900 0
125003000 808000 133792000 0 133792000 0 133792000 0 149044900 0 149044900 0
125790000 787000 133792000 0 133792000 0 133792000 0 149044900 0 149044900 0
126573000 783000 133792000 0 133792000 0 133792000 0 149044900 0 149044900 0
127366000 793000 133792000 0 133792000 0 133792000 0 149044900 0 149044900 0
128192000 826000 133792000 0 133792000 0 133792000 0 149044900 0 149044900 0
128957000 765000 133792000 0 133792000 0 133792000 0 149044900 0 149044900 0
129691000 734000 133792000 0 133792000 0 133792000 0 149044900 0 149044900 0
130414000 723000 133792000 0 133792000 0 133792000 0 149044900 0 149044900 0
131151000 737000 133792000 0 133792000 0 133792000 0 149044900 0 149044900 0
132017000 866000 133792000 0 133792000 0 133792000 0 149044900 0 149044900 0
132663000 646000 133792000 0 133792000 0 133792000 0 149044900 0 149044900 0
133414000 751000 133792000 0 133792000 0 133792000 0 149044900 0 149044900 0133792000 378000 133792000 0 133792000 0 149044900 0
Total (gal) 15336000 Total (gal) 0 Total (gal) 0 Total (gal) 0 Total (gal) 0 Total (gal) 0Total (ac-ft) 47.06 Total (ac-ft) 0.00 Total (ac-ft) 0.00 Total (ac-ft) 0.00 Total (ac-ft) 0.00 Total (ac-ft) 0.00
15336000 047.06 0.00
410.59Annual Total Del. Vol for FM-eq (ac-ft) =
3rd Qtr Total (gal) = 4th Qtr Total (gal) =3rd Qtr Total (ac-ft) = 4th Qtr Total (ac-ft) =
July August September October November December
Meter ID: Fm-C2Year: 2018
USF DAILY FLOWMETER READINGS AND VOLUMESMarana High Plains Recharge Facility
USF Permit No. 71-563876.0008
FM-eq Delivered Volumes
(ac-ft)
FM-C2 Delivered Volumes
(ac-ft)
Evaporation Losses (ac-ft)
Evapotranspiration Losses (ac-ft)
Net Recharge Volumes
(ac-ft)
Quarterly Net Recharge Totals
(ac-ft)
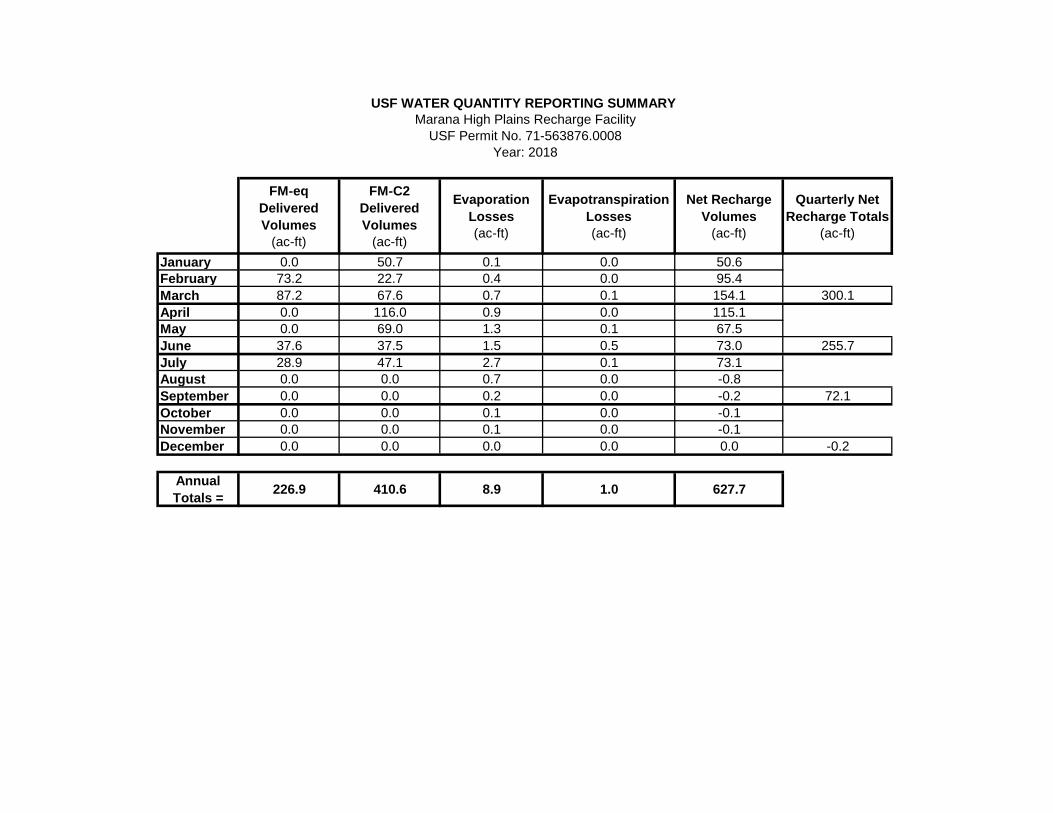
January 0.0 50.7 0.1 0.0 50.6February 73.2 22.7 0.4 0.0 95.4March 87.2 67.6 0.7 0.1 154.1 300.1April 0.0 116.0 0.9 0.0 115.1May 0.0 69.0 1.3 0.1 67.5June 37.6 37.5 1.5 0.5 73.0 255.7July 28.9 47.1 2.7 0.1 73.1August 0.0 0.0 0.7 0.0 -0.8September 0.0 0.0 0.2 0.0 -0.2 72.1October 0.0 0.0 0.1 0.0 -0.1November 0.0 0.0 0.1 0.0 -0.1December 0.0 0.0 0.0 0.0 0.0 -0.2
Annual Totals = 226.9 410.6 8.9 1.0 627.7
USF WATER QUANTITY REPORTING SUMMARY Marana High Plains Recharge Facility
USF Permit No. 71-563876.0008Year: 2018

APPENDIX B Evaporation Calculations & Cooley Method Description
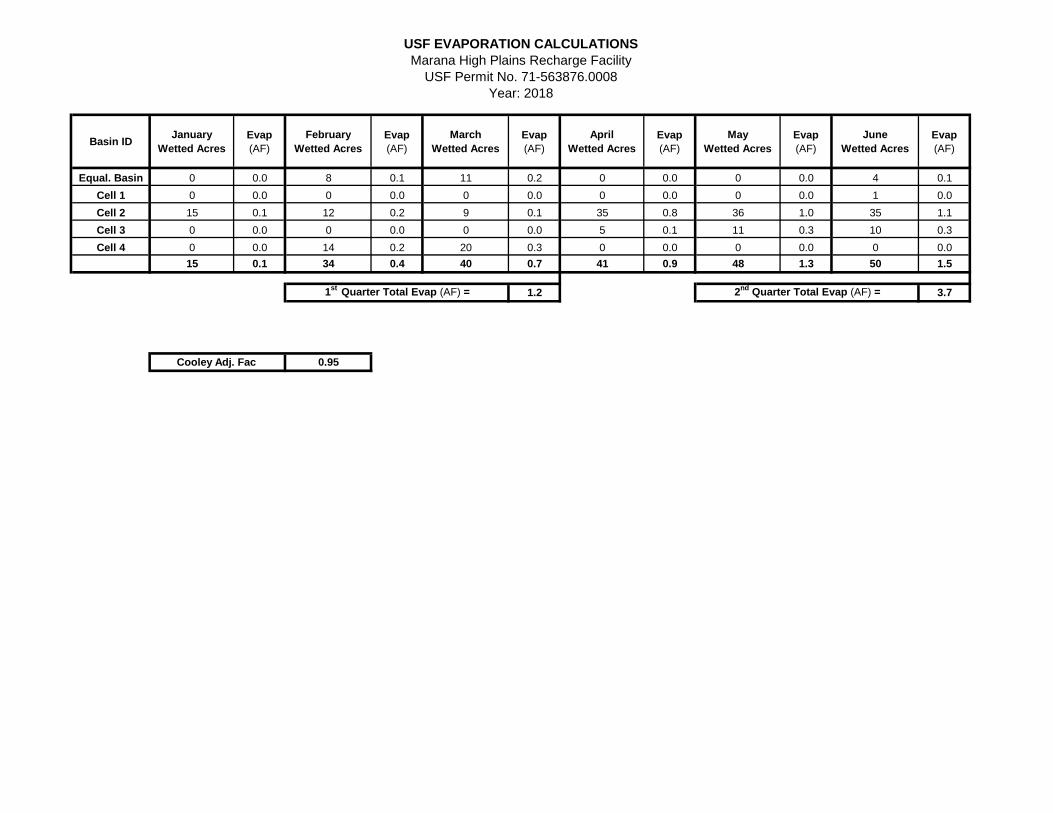
Basin ID January Wetted Acres
Evap (AF)
February Wetted Acres
Evap (AF)
March Wetted Acres
Evap (AF)
April Wetted Acres
Evap (AF)
May Wetted Acres
Evap (AF)
June Wetted Acres
Evap (AF)
Equal. Basin 0 0.0 8 0.1 11 0.2 0 0.0 0 0.0 4 0.1Cell 1 0 0.0 0 0.0 0 0.0 0 0.0 0 0.0 1 0.0Cell 2 15 0.1 12 0.2 9 0.1 35 0.8 36 1.0 35 1.1Cell 3 0 0.0 0 0.0 0 0.0 5 0.1 11 0.3 10 0.3Cell 4 0 0.0 14 0.2 20 0.3 0 0.0 0 0.0 0 0.0
15 0.1 34 0.4 40 0.7 41 0.9 48 1.3 50 1.5
1.2 3.7
0.95
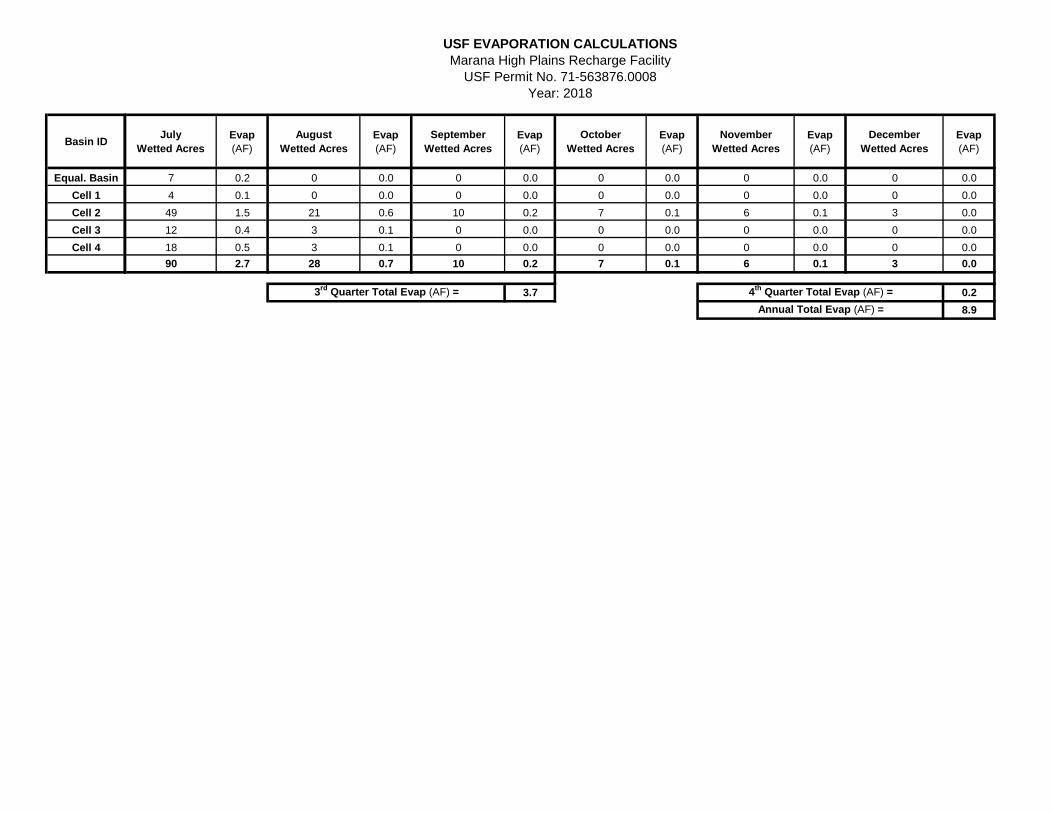
USF EVAPORATION CALCULATIONS
USF Permit No. 71-563876.0008Year: 2018
1st Quarter Total Evap (AF) = 2nd Quarter Total Evap (AF) =
Cooley Adj. Fac
Marana High Plains Recharge Facility
Basin ID
Equal. BasinCell 1Cell 2Cell 3Cell 4
July Wetted Acres
Evap (AF)
August Wetted Acres
Evap (AF)
September Wetted Acres
Evap (AF)
October Wetted Acres
Evap (AF)
November Wetted Acres
Evap (AF)
December Wetted Acres
Evap (AF)
7 0.2 0 0.0 0 0.0 0 0.0 0 0.0 0 0.04 0.1 0 0.0 0 0.0 0 0.0 0 0.0 0 0.049 1.5 21 0.6 10 0.2 7 0.1 6 0.1 3 0.012 0.4 3 0.1 0 0.0 0 0.0 0 0.0 0 0.018 0.5 3 0.1 0 0.0 0 0.0 0 0.0 0 0.090 2.7 28 0.7 10 0.2 7 0.1 6 0.1 3 0.0
3.7 0.28.9
USF EVAPORATION CALCULATIONSMarana High Plains Recharge Facility
USF Permit No. 71-563876.0008Year: 2018
3rd Quarter Total Evap (AF) = 4th Quarter Total Evap (AF) =Annual Total Evap (AF) =
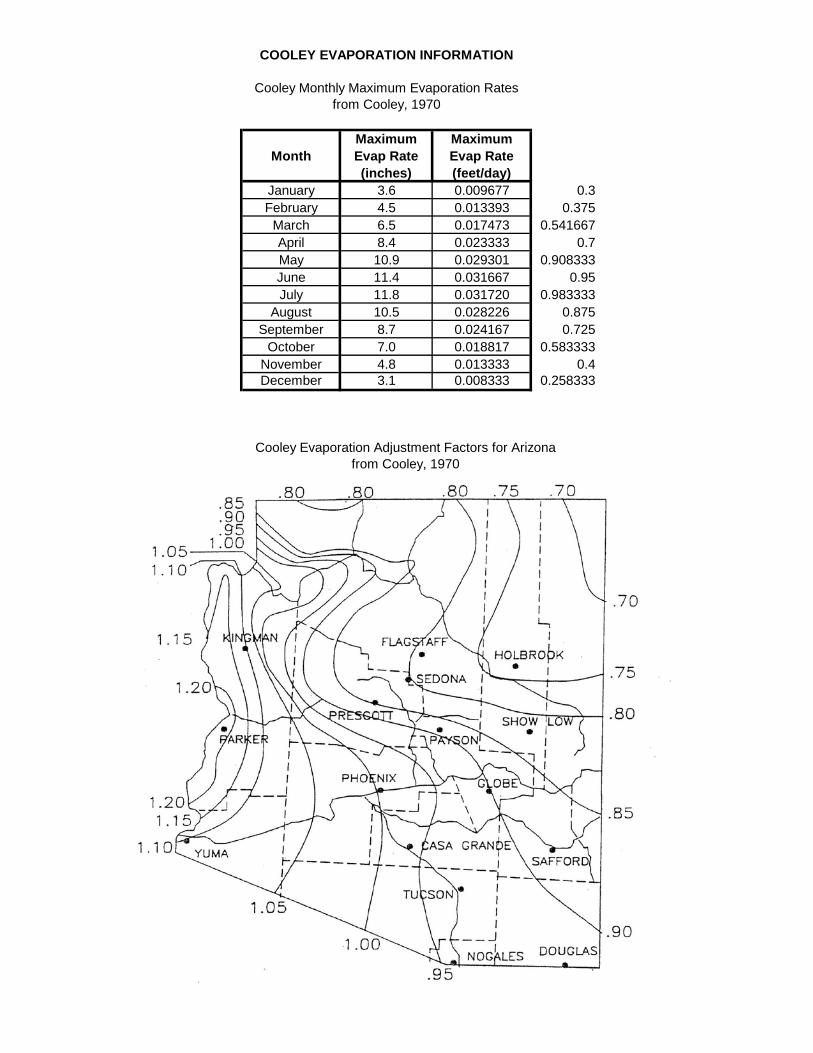
MonthMaximum Evap Rate (inches)
Maximum Evap Rate (feet/day)
January 3.6 0.009677 0.3February 4.5 0.013393 0.375
March 6.5 0.017473 0.541667April 8.4 0.023333 0.7May 10.9 0.029301 0.908333June 11.4 0.031667 0.95July 11.8 0.031720 0.983333
August 10.5 0.028226 0.875September 8.7 0.024167 0.725
October 7.0 0.018817 0.583333November 4.8 0.013333 0.4December 3.1 0.008333 0.258333
from Cooley, 1970
COOLEY EVAPORATION INFORMATION
Cooley Monthly Maximum Evaporation Ratesfrom Cooley, 1970
Cooley Evaporation Adjustment Factors for Arizona


APPENDIX C Daily Wetted Acreages
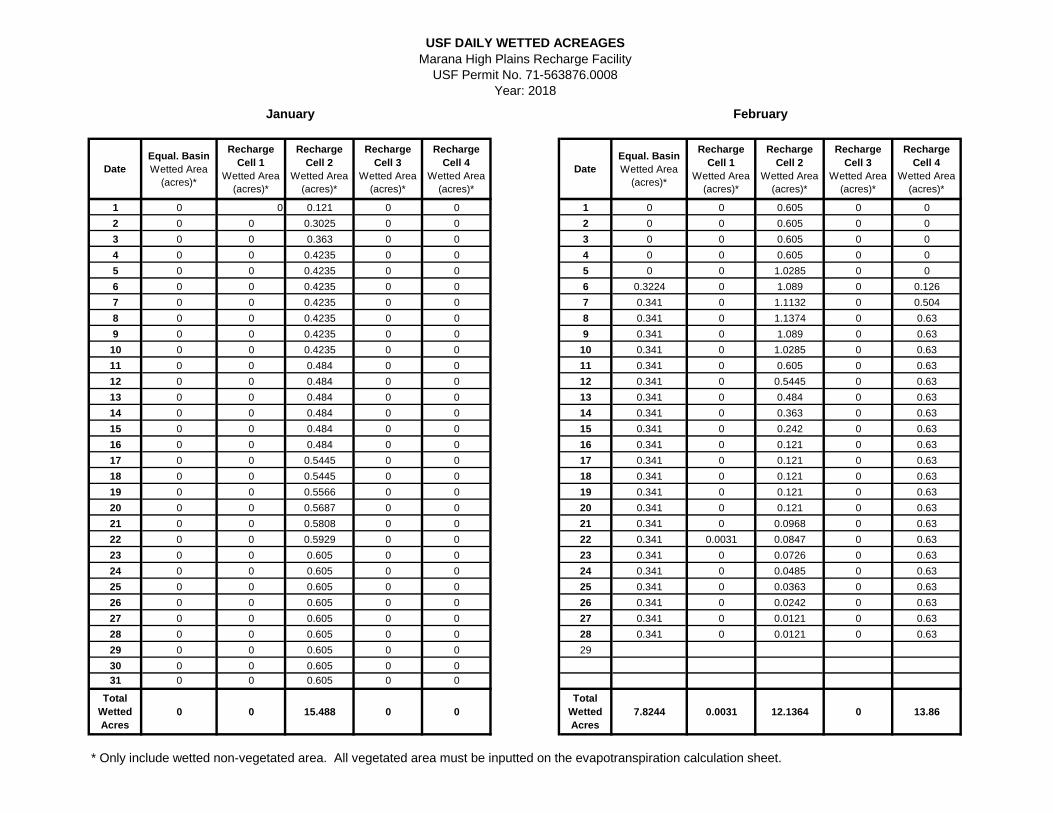
DateEqual. Basin Wetted Area
(acres)*
Recharge Cell 1
Wetted Area (acres)*
Recharge Cell 2
Wetted Area (acres)*
Recharge Cell 3
Wetted Area (acres)*
Recharge Cell 4
Wetted Area (acres)*
DateEqual. Basin Wetted Area
(acres)*
Recharge Cell 1
Wetted Area (acres)*
Recharge Cell 2
Wetted Area (acres)*
Recharge Cell 3
Wetted Area (acres)*
Recharge Cell 4
Wetted Area (acres)*
1 0 0 0.121 0 0 1 0 0 0.605 0 02 0 0 0.3025 0 0 2 0 0 0.605 0 03 0 0 0.363 0 0 3 0 0 0.605 0 04 0 0 0.4235 0 0 4 0 0 0.605 0 05 0 0 0.4235 0 0 5 0 0 1.0285 0 06 0 0 0.4235 0 0 6 0.3224 0 1.089 0 0.1267 0 0 0.4235 0 0 7 0.341 0 1.1132 0 0.5048 0 0 0.4235 0 0 8 0.341 0 1.1374 0 0.639 0 0 0.4235 0 0 9 0.341 0 1.089 0 0.63
10 0 0 0.4235 0 0 10 0.341 0 1.0285 0 0.6311 0 0 0.484 0 0 11 0.341 0 0.605 0 0.6312 0 0 0.484 0 0 12 0.341 0 0.5445 0 0.6313 0 0 0.484 0 0 13 0.341 0 0.484 0 0.6314 0 0 0.484 0 0 14 0.341 0 0.363 0 0.6315 0 0 0.484 0 0 15 0.341 0 0.242 0 0.6316 0 0 0.484 0 0 16 0.341 0 0.121 0 0.6317 0 0 0.5445 0 0 17 0.341 0 0.121 0 0.6318 0 0 0.5445 0 0 18 0.341 0 0.121 0 0.6319 0 0 0.5566 0 0 19 0.341 0 0.121 0 0.6320 0 0 0.5687 0 0 20 0.341 0 0.121 0 0.6321 0 0 0.5808 0 0 21 0.341 0 0.0968 0 0.6322 0 0 0.5929 0 0 22 0.341 0.0031 0.0847 0 0.6323 0 0 0.605 0 0 23 0.341 0 0.0726 0 0.6324 0 0 0.605 0 0 24 0.341 0 0.0485 0 0.6325 0 0 0.605 0 0 25 0.341 0 0.0363 0 0.6326 0 0 0.605 0 0 26 0.341 0 0.0242 0 0.6327 0 0 0.605 0 0 27 0.341 0 0.0121 0 0.6328 0 0 0.605 0 0 28 0.341 0 0.0121 0 0.6329 0 0 0.605 0 0 2930 0 0 0.605 0 031 0 0 0.605 0 0
Total Wetted Acres
0 0 15.488 0 0Total
Wetted Acres
7.8244 0.0031 12.1364 0 13.86
* Only include wetted non-vegetated area. All vegetated area must be inputted on the evapotranspiration calculation sheet.
February
USF DAILY WETTED ACREAGESMarana High Plains Recharge Facility
USF Permit No. 71-563876.0008Year: 2018
January
DateEqual. Basin Wetted Area
(acres)*
Recharge Cell 1
Wetted Area (acres)*
Recharge Cell 2
Wetted Area (acres)*
Recharge Cell 3
Wetted Area (acres)*
Recharge Cell 4
Wetted Area (acres)*
DateEqual. Basin Wetted Area
(acres)*
Recharge Cell 1
Wetted Area (acres)*
Recharge Cell 2
Wetted Area (acres)*
Recharge Cell 3
Wetted Area (acres)*
Recharge Cell 4
Wetted Area (acres)*
1 0.341 0 0 0 0.63 1 0.248 0 1.1737 0.0585 0.2522 0.341 0 0 0 0.63 2 0.155 0 1.1737 0.039 03 0.341 0 0 0 0.63 3 0.062 0 1.1737 0.0468 04 0.341 0 0 0 0.63 4 0.031 0 1.1737 0.0546 05 0.341 0 0 0 0.63 5 0 0 1.1737 0.0624 06 0.341 0 0 0 0.63 6 0 0 1.1737 0.0702 07 0.341 0 0 0 0.63 7 0 0 1.1737 0.078 08 0.341 0 0 0 0.63 8 0 0 1.1737 0.0858 09 0.341 0 0 0 0.63 9 0 0 1.1737 0.0936 0
10 0.341 0 0 0 0.63 10 0 0 1.1737 0.1014 011 0.341 0 0 0 0.63 11 0 0 1.1737 0.1092 012 0.341 0 0.0605 0 0.63 12 0 0 1.1737 0.117 013 0.341 0 0.121 0 0.63 13 0 0 1.1737 0.1248 014 0.341 0 0.242 0 0.63 14 0 0 1.1737 0.1326 015 0.341 0 0.4235 0 0.63 15 0 0 1.1737 0.1404 016 0.341 0 0.4235 0 0.63 16 0 0 1.1737 0.1482 017 0.341 0 0.4356 0 0.63 17 0 0 1.1737 0.156 018 0.341 0 0.4356 0 0.63 18 0 0 1.1737 0.1638 019 0.341 0 0.4477 0 0.63 19 0 0 1.1737 0.1716 020 0.341 0 0.4477 0 0.63 20 0 0 1.1737 0.1794 021 0.341 0 0.4598 0 0.63 21 0 0 1.1737 0.195 022 0.341 0 0.4598 0 0.63 22 0 0 1.1737 0.2106 023 0.341 0 0.4719 0 0.63 23 0 0 1.1737 0.2262 024 0.341 0 0.4719 0 0.63 24 0 0 1.1737 0.234 025 0.341 0 0.4719 0 0.63 25 0 0 1.1737 0.2496 026 0.341 0 0.484 0 0.819 26 0 0 1.1737 0.2652 027 0.341 0 0.484 0 0.819 27 0 0 1.1737 0.2808 028 0.341 0 0.484 0 0.819 28 0 0 1.1737 0.2886 029 0.341 0 0.5082 0 0.819 29 0 0 1.1737 0.2964 030 0.3224 0 0.605 0 0.63 30 0 0 1.1737 0.3042 031 0.31 0 1.0648 0.0078 0.504
Total Wetted Acres
10.5214 0 9.0024 0.0078 20.16Total
Wetted Acres
0.496 0 35.211 4.6839 0.252
* Only include wetted non-vegetated area. All vegetated area must be inputted on the evapotranspiration calculation sheet.
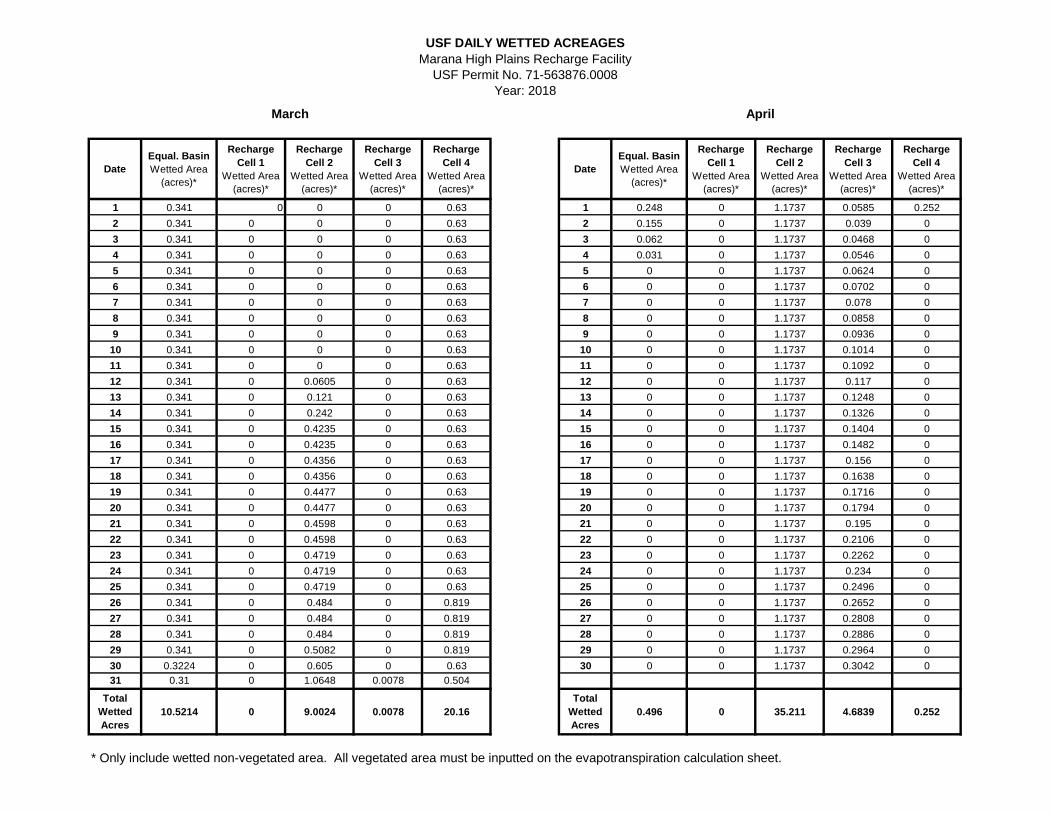
March
USF DAILY WETTED ACREAGESMarana High Plains Recharge Facility
USF Permit No. 71-563876.0008Year: 2018
April
DateEqual. Basin Wetted Area
(acres)*
Recharge Cell 1
Wetted Area (acres)*
Recharge Cell 2
Wetted Area (acres)*
Recharge Cell 3
Wetted Area (acres)*
Recharge Cell 4
Wetted Area (acres)*
DateEqual. Basin Wetted Area
(acres)*
Recharge Cell 1
Wetted Area (acres)*
Recharge Cell 2
Wetted Area (acres)*
Recharge Cell 3
Wetted Area (acres)*
Recharge Cell 4
Wetted Area (acres)*
1 0 0 1.1737 0.312 0 1 0 0 1.1495 0.273 02 0 0 1.1737 0.312 0 2 0 0 1.1495 0.234 03 0 0 1.1737 0.312 0 3 0 0 1.1495 0.2418 04 0 0 1.1737 0.312 0 4 0 0 1.1495 0.2496 05 0 0 1.1737 0.312 0 5 0 0 1.1495 0.2574 06 0 0 1.1737 0.312 0 6 0 0 1.1495 0.273 07 0 0 1.1737 0.312 0 7 0 0 1.1495 0.2886 08 0 0 1.1737 0.39 0 8 0 0 1.1737 0.2964 09 0 0 1.1737 0.39 0 9 0 0 1.1737 0.3042 0
10 0 0 1.1737 0.39 0 10 0 0 1.1737 0.312 011 0 0 1.1737 0.39 0 11 0 0 1.1737 0.3276 012 0 0 1.1737 0.39 0 12 0 0 1.1737 0.351 013 0 0 1.1737 0.39 0 13 0 0 1.1737 0.351 014 0 0 1.1737 0.39 0 14 0 0 1.1737 0.3276 015 0 0 1.1495 0.39 0 15 0 0 1.1737 0.3276 016 0 0 1.1495 0.39 0 16 0 0 1.1737 0.312 017 0 0 1.1737 0.39 0 17 0 0 1.1737 0.312 018 0 0 1.1737 0.39 0 18 0 0 1.1495 0.2925 019 0 0 1.1737 0.39 0 19 0.31 0.00315 1.1495 0.273 020 0 0 1.1737 0.39 0 20 0.341 0.0063 1.1495 0.3744 021 0 0 1.1737 0.39 0 21 0.3844 0.0189 1.1737 0.3744 022 0 0 1.1737 0.39 0 22 0.3844 0.0252 1.1737 0.3432 023 0 0 1.1737 0.39 0 23 0.3844 0.0378 1.1737 0.3588 024 0 0 1.1737 0.39 0 24 0.3844 0.0441 1.1737 0.3666 025 0 0 1.1737 0.39 0 25 0.3844 0.0504 1.1737 0.3744 026 0 0 1.1737 0.39 0 26 0.3844 0.0567 1.1737 0.39 027 0 0 1.1737 0.366 0 27 0.3844 0.063 1.1737 0.39 028 0 0 1.1737 0.351 0 28 0.3844 0.0693 1.1737 0.39 029 0 0 1.1737 0.351 0 29 0.3844 0.0756 1.1737 0.39 030 0 0 1.1737 0.3315 0 30 0.3844 0.126 1.1737 0.39 031 0 0 1.1495 0.312 0
Total Wetted Acres
0 0 36.3121 11.3055 0Total
Wetted Acres
4.495 0.57645 34.969 9.7461 0
* Only include wetted non-vegetated area. All vegetated area must be inputted on the evapotranspiration calculation sheet.
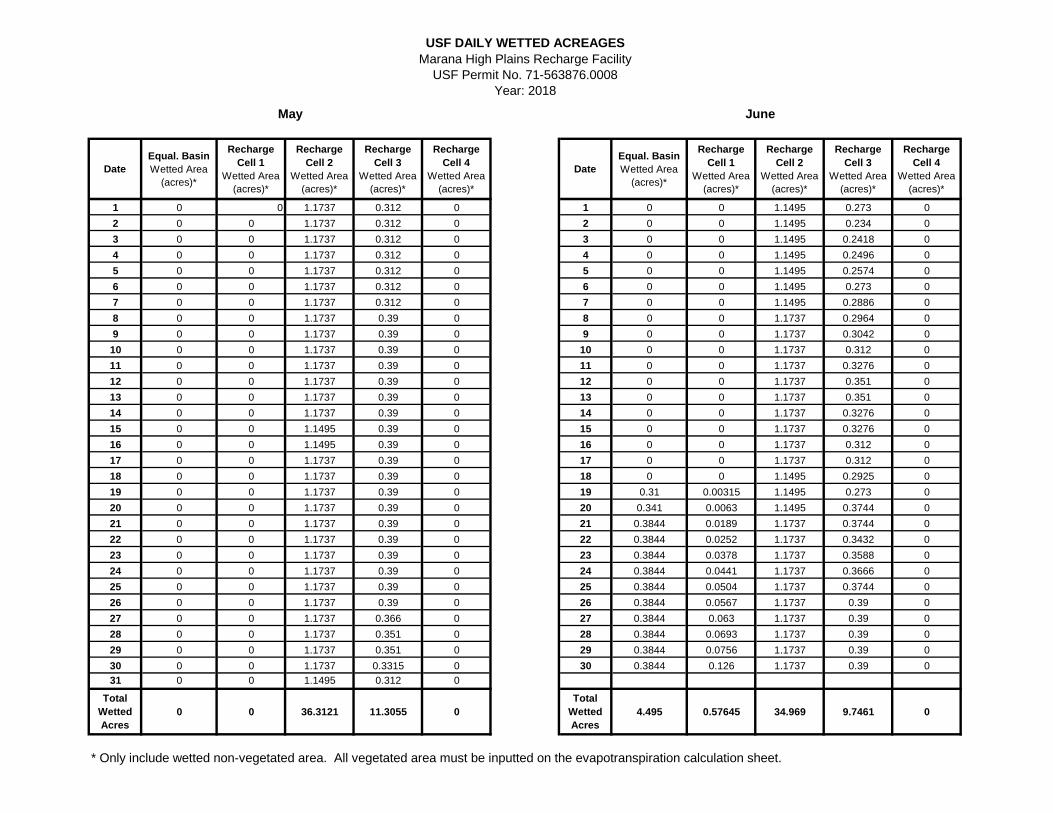
May June
USF DAILY WETTED ACREAGESMarana High Plains Recharge Facility
USF Permit No. 71-563876.0008Year: 2018

DateEqual. Basin Wetted Area
(acres)*
Recharge Cell 1
Wetted Area (acres)*
Recharge Cell 2
Wetted Area (acres)*
Recharge Cell 3
Wetted Area (acres)*
Recharge Cell 4
Wetted Area (acres)*
DateEqual. Basin Wetted Area
(acres)*
Recharge Cell 1
Wetted Area (acres)*
Recharge Cell 2
Wetted Area (acres)*
Recharge Cell 3
Wetted Area (acres)*
Recharge Cell 4
Wetted Area (acres)*
1 0.3844 0.1323 1.737 0.39 0.63 1 0 0.1827 1.737 0.39 0.632 0.3844 0.1386 1.737 0.39 0.819 2 0 0.126 1.1495 0.39 0.5043 0.3844 0.1512 1.737 0.39 0.819 3 0 0.063 1.1495 0.39 0.5044 0.3844 0.1575 1.737 0.39 0.819 4 0 0 1.1374 0.312 0.5045 0.3844 0.1638 1.737 0.39 0.819 5 0 0 1.1132 0.312 0.45996 0.3844 0.1701 1.737 0.39 0.819 6 0 0 1.0648 0.312 0.41587 0.3844 0.1827 1.737 0.39 0.819 7 0 0 1.0285 0.2836 0.26468 0.3844 0.1953 1.737 0.39 0.819 8 0 0 0.605 0.234 0.11349 0.3844 0.2079 1.737 0.39 0.819 9 0 0 0.605 0.195 0
10 0.3844 0.2268 1.737 0.663 0.819 10 0 0 0.605 0.1014 011 0.3844 0.2268 1.1495 0.39 0.819 11 0 0 0.605 0.078 012 0.3844 0.1764 1.1495 0.39 0.819 12 0 0 0.605 0.0702 013 0.3844 0.126 1.1495 0.39 0.63 13 0 0 0.605 0.0624 014 0.3844 0.0189 1.1495 0.312 0.504 14 0 0 0.5445 0.0546 015 0.3844 0.0945 1.1374 0.312 0.378 15 0 0 0.5445 0.0468 016 0.3844 0 1.1374 0.312 0.252 16 0 0 0.5445 0.039 017 0.3844 0.0063 1.1495 0.312 0.315 17 0 0 0.5445 0.0234 018 0 0.0252 1.1495 0.312 0.3276 18 0 0 0.5324 0.0156 019 0 0.0378 1.737 0.312 0.3402 19 0 0 0.5203 0.0078 020 0 0.0504 1.737 0.312 0.3654 20 0 0 0.5082 0 021 0 0.063 1.737 0.39 0.3906 21 0 0 0.4961 0 022 0 0.0756 1.737 0.39 0.4095 22 0 0 0.48 0 023 0 0.0882 1.737 0.39 0.4284 23 0 0 0.48 0 024 0 0.1008 1.737 0.39 0.4536 24 0 0 0.48 0 025 0 0.1134 1.737 0.39 0.4788 25 0 0 0.48 0 026 0 0.126 1.737 0.39 0.504 26 0 0 0.4719 0 027 0 0.1386 1.737 0.39 0.504 27 0 0 0.4598 0 028 0 0.1449 1.737 0.39 0.504 28 0 0 0.4477 0 029 0 0.189 1.737 0.39 0.504 29 0 0 0.4356 0 030 0 0.2205 1.737 0.39 0.504 30 0 0 0.4235 0 031 0 0.252 1.737 0.39 0.63 31 0 0 0.4235 0 0
Total Wetted Acres
6.5348 4.0005 49.1228 11.817 18.0621Total
Wetted Acres
0 0.3717 20.8269 3.3178 3.3957
* Only include wetted non-vegetated area. All vegetated area must be inputted on the evapotranspiration calculation sheet.
July August
USF DAILY WETTED ACREAGESMarana High Plains Recharge Facility
USF Permit No. 71-563876.0008Year: 2018
DateEqual. Basin Wetted Area
(acres)*
Recharge Cell 1
Wetted Area (acres)*
Recharge Cell 2
Wetted Area (acres)*
Recharge Cell 3
Wetted Area (acres)*
Recharge Cell 4
Wetted Area (acres)*
DateEqual. Basin Wetted Area
(acres)*
Recharge Cell 1
Wetted Area (acres)*
Recharge Cell 2
Wetted Area (acres)*
Recharge Cell 3
Wetted Area (acres)*
Recharge Cell 4
Wetted Area (acres)*
1 0 0 0.4235 0 0 1 0 0 0.2662 0 02 0 0 0.4235 0 0 2 0 0 0.2662 0 03 0 0 0.4114 0 0 3 0 0 0.2662 0 04 0 0 0.3993 0 0 4 0 0 0.2541 0 05 0 0 0.3872 0 0 5 0 0 0.2541 0 06 0 0 0.3751 0 0 6 0 0 0.2541 0 07 0 0 0.363 0 0 7 0 0 0.2541 0 08 0 0 0.363 0 0 8 0 0 0.2541 0 09 0 0 0.363 0 0 9 0 0 0.2541 0 0
10 0 0 0.363 0 0 10 0 0 0.2541 0 011 0 0 0.3509 0 0 11 0 0 0.242 0 012 0 0 0.3388 0 0 12 0 0 0.242 0 013 0 0 0.3267 0 0 13 0 0 0.242 0 014 0 0 0.3146 0 0 14 0 0 0.242 0 015 0 0 0.3025 0 0 15 0 0 0.242 0 016 0 0 0.3025 0 0 16 0 0 0.242 0 017 0 0 0.3025 0 0 17 0 0 0.242 0 018 0 0 0.3025 0 0 18 0 0 0.2299 0 019 0 0 0.2904 0 0 19 0 0 0.2299 0 020 0 0 0.2904 0 0 20 0 0 0.2299 0 021 0 0 0.2904 0 0 21 0 0 0.2299 0 022 0 0 0.2904 0 0 22 0 0 0.2299 0 023 0 0 0.2904 0 0 23 0 0 0.2299 0 024 0 0 0.2783 0 0 24 0 0 0.2299 0 025 0 0 0.2783 0 0 25 0 0 0.2178 0 026 0 0 0.2783 0 0 26 0 0 0.2178 0 027 0 0 0.2783 0 0 27 0 0 0.2178 0 028 0 0 0.2783 0 0 28 0 0 0.2178 0 029 0 0 0.2662 0 0 29 0 0 0.2178 0 030 0 0 0.2662 0 0 30 0 0 0.2178 0 0
31 0 0 0.2178 0 0
Total Wetted Acres
0 0 9.7889 0 0Total
Wetted Acres
0 0 7.4052 0 0
* Only include wetted non-vegetated area. All vegetated area must be inputted on the evapotranspiration calculation sheet.
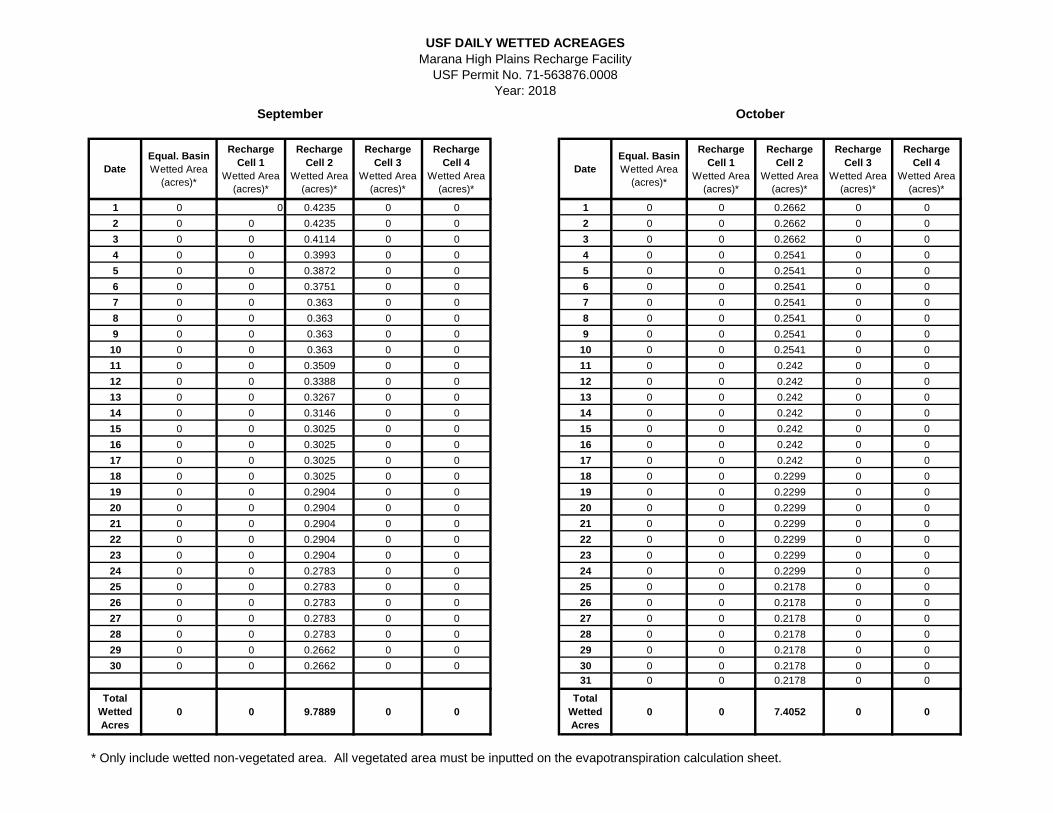
September October
USF DAILY WETTED ACREAGESMarana High Plains Recharge Facility
USF Permit No. 71-563876.0008Year: 2018
DateEqual. Basin Wetted Area
(acres)*
Recharge Cell 1
Wetted Area (acres)*
Recharge Cell 2
Wetted Area (acres)*
Recharge Cell 3
Wetted Area (acres)*
Recharge Cell 4
Wetted Area (acres)*
DateEqual. Basin Wetted Area
(acres)*
Recharge Cell 1
Wetted Area (acres)*
Recharge Cell 2
Wetted Area (acres)*
Recharge Cell 3
Wetted Area (acres)*
Recharge Cell 4
Wetted Area (acres)*
1 0 0 0.2057 0 0 1 0 0 0.1573 0 02 0 0 0.2057 0 0 2 0 0 0.1573 0 03 0 0 0.2057 0 0 3 0 0 0.1573 0 04 0 0 0.2057 0 0 4 0 0 0.1452 0 05 0 0 0.2057 0 0 5 0 0 0.1452 0 06 0 0 0.2057 0 0 6 0 0 0.1452 0 07 0 0 0.2057 0 0 7 0 0 0.1452 0 08 0 0 0.1936 0 0 8 0 0 0.1452 0 09 0 0 0.1936 0 0 9 0 0 0.1331 0 0
10 0 0 0.1936 0 0 10 0 0 0.1331 0 011 0 0 0.1936 0 0 11 0 0 0.1331 0 012 0 0 0.1936 0 0 12 0 0 0.121 0 013 0 0 0.1936 0 0 13 0 0 0.121 0 014 0 0 0.1936 0 0 14 0 0 0.121 0 015 0 0 0.1815 0 0 15 0 0 0.1089 0 016 0 0 0.1815 0 0 16 0 0 0.1089 0 017 0 0 0.1815 0 0 17 0 0 0.1089 0 018 0 0 0.1815 0 0 18 0 0 0.0968 0 019 0 0 0.1815 0 0 19 0 0 0.0968 0 020 0 0 0.1815 0 0 20 0 0 0.0968 0 021 0 0 0.1815 0 0 21 0 0 0.0847 0 022 0 0 0.1694 0 0 22 0 0 0.0847 0 023 0 0 0.1694 0 0 23 0 0 0.0847 0 024 0 0 0.1694 0 0 24 0 0 0.0726 0 025 0 0 0.1694 0 0 25 0 0 0.0726 0 026 0 0 0.1694 0 0 26 0 0 0.0726 0 027 0 0 0.1694 0 0 27 0 0 0.0605 0 028 0 0 0.1573 0 0 28 0 0 0.0605 0 029 0 0 0.1573 0 0 29 0 0 0.0605 0 030 0 0 0.1573 0 0 30 0 0 0.0605 0 0
31 0 0 0.0605 0 0
Total Wetted Acres
0 0 5.5539 0 0Total
Wetted Acres
0 0 3.3517 0 0
* Only include wetted non-vegetated area. All vegetated area must be inputted on the evapotranspiration calculation sheet.
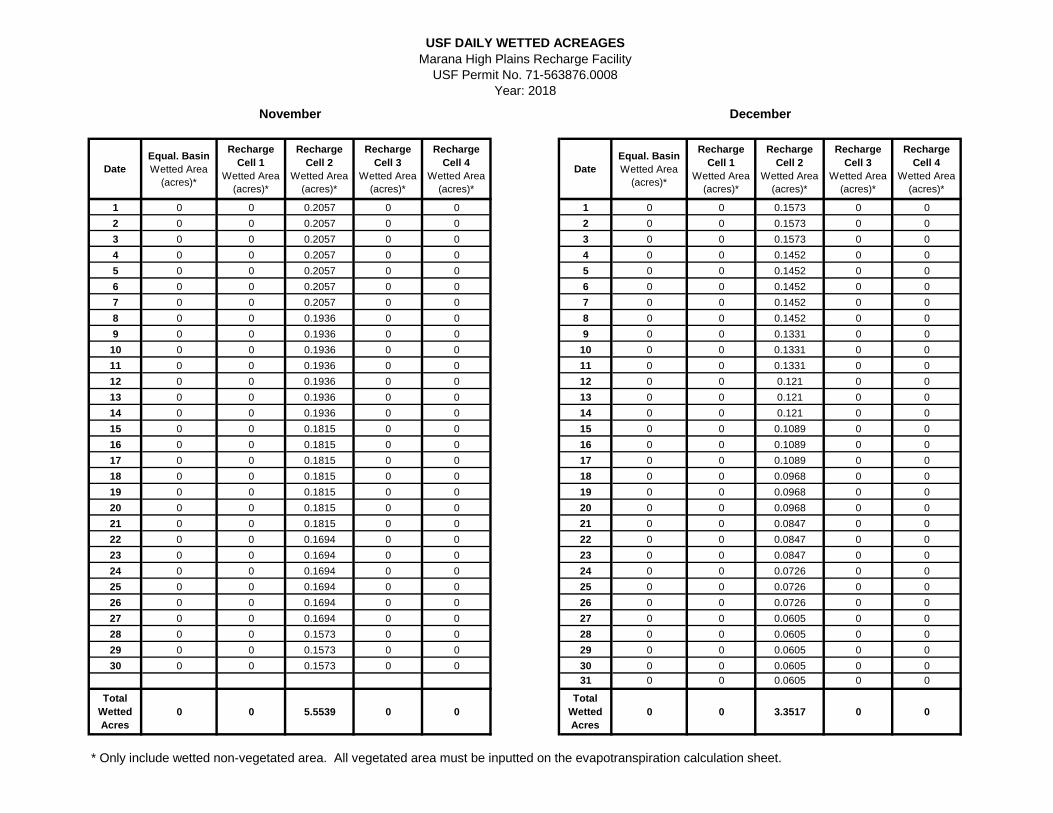
November December
USF DAILY WETTED ACREAGESMarana High Plains Recharge Facility
USF Permit No. 71-563876.0008Year: 2018
APPENDIX D Evapotranspiration Calculations &
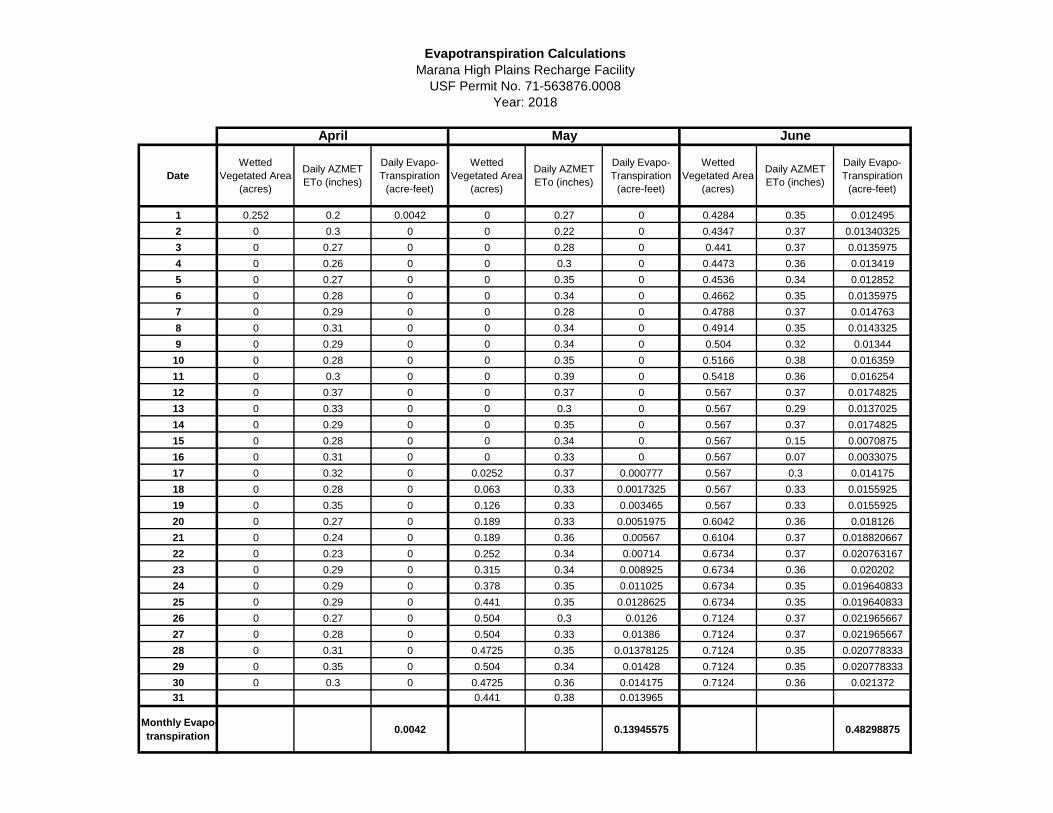
AZMET Method Description
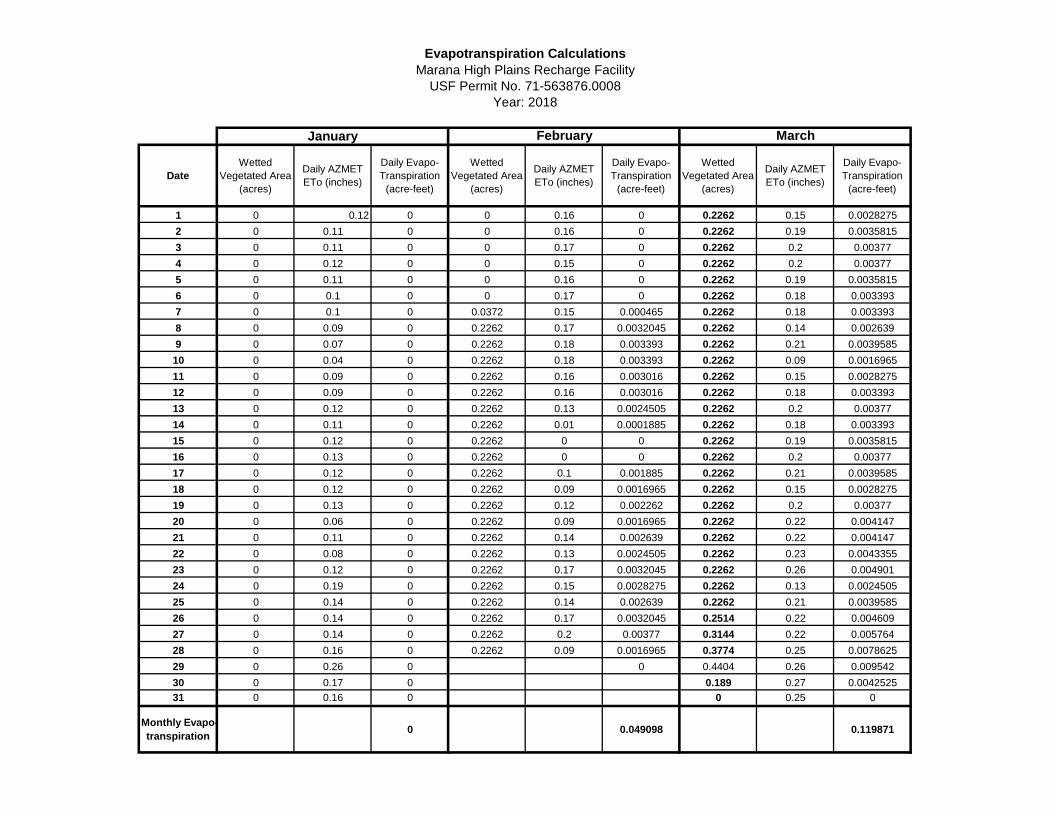
DateWetted
Vegetated Area (acres)
Daily AZMET ETo (inches)
Daily Evapo-Transpiration
(acre-feet)
Wetted Vegetated Area
(acres)
Daily AZMET ETo (inches)
Daily Evapo-Transpiration
(acre-feet)
Wetted Vegetated Area
(acres)
Daily AZMET ETo (inches)
Daily Evapo-Transpiration
(acre-feet)
1 0 0.12 0 0 0.16 0 0.2262 0.15 0.00282752 0 0.11 0 0 0.16 0 0.2262 0.19 0.00358153 0 0.11 0 0 0.17 0 0.2262 0.2 0.003774 0 0.12 0 0 0.15 0 0.2262 0.2 0.003775 0 0.11 0 0 0.16 0 0.2262 0.19 0.00358156 0 0.1 0 0 0.17 0 0.2262 0.18 0.0033937 0 0.1 0 0.0372 0.15 0.000465 0.2262 0.18 0.0033938 0 0.09 0 0.2262 0.17 0.0032045 0.2262 0.14 0.0026399 0 0.07 0 0.2262 0.18 0.003393 0.2262 0.21 0.003958510 0 0.04 0 0.2262 0.18 0.003393 0.2262 0.09 0.001696511 0 0.09 0 0.2262 0.16 0.003016 0.2262 0.15 0.002827512 0 0.09 0 0.2262 0.16 0.003016 0.2262 0.18 0.00339313 0 0.12 0 0.2262 0.13 0.0024505 0.2262 0.2 0.0037714 0 0.11 0 0.2262 0.01 0.0001885 0.2262 0.18 0.00339315 0 0.12 0 0.2262 0 0 0.2262 0.19 0.003581516 0 0.13 0 0.2262 0 0 0.2262 0.2 0.0037717 0 0.12 0 0.2262 0.1 0.001885 0.2262 0.21 0.003958518 0 0.12 0 0.2262 0.09 0.0016965 0.2262 0.15 0.002827519 0 0.13 0 0.2262 0.12 0.002262 0.2262 0.2 0.0037720 0 0.06 0 0.2262 0.09 0.0016965 0.2262 0.22 0.00414721 0 0.11 0 0.2262 0.14 0.002639 0.2262 0.22 0.00414722 0 0.08 0 0.2262 0.13 0.0024505 0.2262 0.23 0.004335523 0 0.12 0 0.2262 0.17 0.0032045 0.2262 0.26 0.00490124 0 0.19 0 0.2262 0.15 0.0028275 0.2262 0.13 0.002450525 0 0.14 0 0.2262 0.14 0.002639 0.2262 0.21 0.003958526 0 0.14 0 0.2262 0.17 0.0032045 0.2514 0.22 0.00460927 0 0.14 0 0.2262 0.2 0.00377 0.3144 0.22 0.00576428 0 0.16 0 0.2262 0.09 0.0016965 0.3774 0.25 0.007862529 0 0.26 0 0 0.4404 0.26 0.00954230 0 0.17 0 0.189 0.27 0.004252531 0 0.16 0 0 0.25 0
Monthly Evapo-transpiration 0 0.049098 0.119871
Evapotranspiration CalculationsMarana High Plains Recharge Facility
USF Permit No. 71-563876.0008Year: 2018
January February March
DateWetted
Vegetated Area (acres)
Daily AZMET ETo (inches)
Daily Evapo-Transpiration
(acre-feet)
Wetted Vegetated Area
(acres)
Daily AZMET ETo (inches)
Daily Evapo-Transpiration
(acre-feet)
Wetted Vegetated Area
(acres)
Daily AZMET ETo (inches)
Daily Evapo-Transpiration
(acre-feet)
1 0.252 0.2 0.0042 0 0.27 0 0.4284 0.35 0.0124952 0 0.3 0 0 0.22 0 0.4347 0.37 0.013403253 0 0.27 0 0 0.28 0 0.441 0.37 0.01359754 0 0.26 0 0 0.3 0 0.4473 0.36 0.0134195 0 0.27 0 0 0.35 0 0.4536 0.34 0.0128526 0 0.28 0 0 0.34 0 0.4662 0.35 0.01359757 0 0.29 0 0 0.28 0 0.4788 0.37 0.0147638 0 0.31 0 0 0.34 0 0.4914 0.35 0.01433259 0 0.29 0 0 0.34 0 0.504 0.32 0.0134410 0 0.28 0 0 0.35 0 0.5166 0.38 0.01635911 0 0.3 0 0 0.39 0 0.5418 0.36 0.01625412 0 0.37 0 0 0.37 0 0.567 0.37 0.017482513 0 0.33 0 0 0.3 0 0.567 0.29 0.013702514 0 0.29 0 0 0.35 0 0.567 0.37 0.017482515 0 0.28 0 0 0.34 0 0.567 0.15 0.007087516 0 0.31 0 0 0.33 0 0.567 0.07 0.003307517 0 0.32 0 0.0252 0.37 0.000777 0.567 0.3 0.01417518 0 0.28 0 0.063 0.33 0.0017325 0.567 0.33 0.015592519 0 0.35 0 0.126 0.33 0.003465 0.567 0.33 0.015592520 0 0.27 0 0.189 0.33 0.0051975 0.6042 0.36 0.01812621 0 0.24 0 0.189 0.36 0.00567 0.6104 0.37 0.01882066722 0 0.23 0 0.252 0.34 0.00714 0.6734 0.37 0.02076316723 0 0.29 0 0.315 0.34 0.008925 0.6734 0.36 0.02020224 0 0.29 0 0.378 0.35 0.011025 0.6734 0.35 0.01964083325 0 0.29 0 0.441 0.35 0.0128625 0.6734 0.35 0.01964083326 0 0.27 0 0.504 0.3 0.0126 0.7124 0.37 0.02196566727 0 0.28 0 0.504 0.33 0.01386 0.7124 0.37 0.02196566728 0 0.31 0 0.4725 0.35 0.01378125 0.7124 0.35 0.02077833329 0 0.35 0 0.504 0.34 0.01428 0.7124 0.35 0.02077833330 0 0.3 0 0.4725 0.36 0.014175 0.7124 0.36 0.02137231 0.441 0.38 0.013965
Monthly Evapo-transpiration 0.0042 0.13945575 0.48298875
Evapotranspiration CalculationsMarana High Plains Recharge Facility
USF Permit No. 71-563876.0008Year: 2018
April May June

DateWetted
Vegetated Area (acres)
Daily AZMET ETo (inches)
Daily Evapo-Transpiration
(acre-feet)
Wetted Vegetated Area
(acres)
Daily AZMET ETo (inches)
Daily Evapo-Transpiration
(acre-feet)
Wetted Vegetated Area
(acres)
Daily AZMET ETo (inches)
Daily Evapo-Transpiration
(acre-feet)
1 0.2714 0.36 0.008142 0.228 0.3 0.0057 0 0.14 02 0.3596 0.37 0.011087667 0.039 0.27 0.0008775 0 0.22 03 0.3596 0.36 0.010788 0.039 0.32 0.00104 0 0.22 04 0.4226 0.38 0.013382333 0 0.34 0 0 0.2 05 0.4856 0.28 0.011330667 0 0.35 0 0 0.24 06 0.4856 0.46 0.018614667 0 0.39 0 0 0.27 07 0.4856 0.33 0.013354 0 0.33 0 0 0.27 08 0.4856 0.33 0.013354 0 0.24 0 0 0.26 09 0.4856 0.22 0.008902667 0 0.19 0 0 0.3 010 0.5372 0.13 0.005819667 0 0.17 0 0 0.28 011 0.4794 0.15 0.0059925 0 0.24 0 0 0.28 012 0.2904 0.28 0.006776 0 0.3 0 0 0.27 013 0.2652 0.26 0.005746 0 0.29 0 0 0.26 014 0 0.07 0 0 0.3 0 0 0.28 015 0 0.11 0 0 0.17 0 0 0.26 016 0 0.24 0 0 0.22 0 0 0.26 017 0 0.28 0 0 0.26 0 0 0.28 018 0 0.3 0 0 0.29 0 0 0.28 019 0 0.28 0 0 0.3 0 0 0.03 020 0 0.22 0 0 0.29 0 0 0.2 021 0.039 0.32 0.00104 0 0.16 0 0 0.23 022 0.039 0.36 0.00117 0 0.2 0 0 0.31 023 0.039 0.36 0.00117 0 0.11 0 0 0.24 024 0.039 0.32 0.00104 0 0.2 0 0 0.18 025 0.039 0.34 0.001105 0 0.2 0 0 0.2 026 0.039 0.34 0.001105 0 0.23 0 0 0.24 027 0.039 0.32 0.00104 0 0.27 0 0 0.24 028 0.039 0.26 0.000845 0 0.27 0 0 0.23 029 0.039 0.3 0.000975 0 0.28 0 0 0.24 030 0.039 0.32 0.00104 0 0.25 0 0 0.19 031 0.228 0.3 0.0057 0 0.27 0
Monthly Evapo-transpiration 0.149520167 0.0076175 0
Evapotranspiration CalculationsMarana High Plains Recharge Facility
USF Permit No. 71-563876.0008
August September
Year: 2018
July

DateWetted
Vegetated Area (acres)
Daily AZMET ETo (inches)
Daily Evapo-Transpiration
(acre-feet)
Wetted Vegetated Area
(acres)
Daily AZMET ETo (inches)
Daily Evapo-Transpiration
(acre-feet)
Wetted Vegetated Area
(acres)
Daily AZMET ETo (inches)
Daily Evapo-Transpiration
(acre-feet)
1 0 0.01 0 0 0.13 0 0 0.04 02 0 0.07 0 0 0.14 0 0 0.06 03 0 0.16 0 0 0.15 0 0 0.08 04 0 0.2 0 0 0.14 0 0 0.07 05 0 0.2 0 0 0.14 0 0 0.05 06 0 0.21 0 0 0.14 0 0 0.06 07 0 0.08 0 0 0.14 0 0 0.01 08 0 0.16 0 0 0.16 0 0 0.08 09 0 0.17 0 0 0.14 0 0 0.08 010 0 0.16 0 0 0.15 0 0 0.09 011 0 0.11 0 0 0.15 0 0 0.06 012 0 0.1 0 0 0.14 0 0 0.1 013 0 0.02 0 0 0.26 0 0 0.09 014 0 0.12 0 0 0.16 0 0 0.07 015 0 0.15 0 0 0.12 0 0 0.03 016 0 0.14 0 0 0.13 0 0 0.07 017 0 0.21 0 0 0.13 0 0 0.09 018 0 0.18 0 0 0.12 0 0 0.1 019 0 0.15 0 0 0.11 0 0 0.08 020 0 0.23 0 0 0.11 0 0 0.1 021 0 0.18 0 0 0.11 0 0 0.04 022 0 0.14 0 0 0.02 0 0 0.11 023 0 0.03 0 0 0.09 0 0 0.1 024 0 0.14 0 0 0.1 0 0 0.09 025 0 0.15 0 0 0.11 0 0 0.09 026 0 0.15 0 0 0.1 0 0 0.03 027 0 0.15 0 0 0.11 0 0 0.06 028 0 0.15 0 0 0.11 0 0 0.08 029 0 0.14 0 0 0.1 0 0 0.07 030 0 0.13 0 0 0.04 0 0 0.07 031 0 0.17 0 0 0.04 0
Monthly Evapo-transpiration 0 0 0
Evapotranspiration Calculations
October November December
Marana High Plains Recharge FacilityUSF Permit No. 71-563876.0008
Year: 2018
Cooperative Extension
Issued in furtherance of Cooperative Extension work, acts of May 8 and June 30, 1914, in cooperation with the U.S. Department of Agri-culture, James A. Christenson, Director, Cooperative Extension, College of Agriculture & Life Sciences, The University of Arizona. The University of Arizona is an equal opportunity, affirmative action institution. The University does not discriminate on the basis of race, color, religion, sex, national origin, age, disability, veteran status, or sexual orientation in its programs and activities.
STANDARDIZED REFERENCE EVAPOTRANSPIRATION
11/2005 AZ1324THE UNIVERSITY OF ARIZONA
COLLEGE OF AGRICULTURE AND LIFE SCIENCES
TUCSON, ARIZONA 85721
PAUL W. BROWN Extension Specialist, Biometeorology
This information has been reviewed by university faculty.
cals.arizona.edu/pubs/water/az1324.pdf
A NEW PROCEDURE FOR ESTIMATING REFERENCE EVAPOTRANSPIRATION IN ARIZONA
IntroductionThe Arizona Meteorological Network (AZMET) has provided daily values of reference evapotranspiration (ETo) for a number of southern Arizona locations for more than 15 years. ETo is a computed meteorological parameter that provides an estimate of environmental evaporative demand and serves as a critical input vari-able for most scientifically based irrigation scheduling systems. ETo is also used to estimate evaporation from water bodies and evapotranspiration (ET) from rain-fed ecosystems. While there is general agreement among agronomists, irrigation engineers and meteorologists that ETo is a useful environmental parameter, there has been less agreement on how to compute ETo. And all too often the computational procedure for ETo varies from region to region and sometimes within a region. Use of mul-tiple ETo computation procedures within a region can generate biases in ETo that result from the computation process, not any true differences in environmental evapo-rative demand. Figure 1 provides graphic evidence of this computational bias by presenting the total ETo for Tucson in 1996 as computed using the published ETo procedures for the public weather networks operating in Arizona (Brown, 1998), California (Snyder and Pruitt, 1985), and New Mexico (Sammis, 1996). It is important to note that the same meteorological data were used to generate the ETo data in Figure 1; only the computational procedures differed. These results provide clear evidence that lack of a standardized computational procedure for ETo can lead to confusion and perhaps serious mistakes when one is involved in activities such as irrigation scheduling, estimating consumptive use of vegetation, water rights litigation (especially across state lines), and development of crop coefficients (adjustment factors that convert ETo to crop ET).
Over the past decade, scientists have recognized the problems and frustrations associated with non-stan-dardized ETo computation and have formed national and international committees to address this issue. The American Society of Civil Engineers (ASCE) developed
Figure 1. Reference ET (ETo) for Tucson for calendar year 1996 as computed using the published procedures for the public weather networks in Arizona, California, and New Mexico.
1000
1200
1400
1600
1800
2000
2200
2400
2600
ry/
mm ,
oT
E
AZ CA NM
2The University of Arizona Cooperative Extension
Standardized Reference ET Equation
Generalized Form of Standardized Equation
The ASCE TC standardized procedure for comput-ing reference evapotranspiration is based on the Penman-Monteith Equation and more specifically on simplifying the version of the Penman Monteith Equation recommended by ASCE (Jensen et al., 1990). The recommended general computation procedure is provided below:
Where:ETsz = standardized reference crop evapotranspiration (mm d-1 or mm h-1)Δ = slope of the saturation vapor pressure- temperature curve (kPa oC-1)Rn = Calculated net radiation at the crop surface (MJ m-2 d-1 or MJ m-2 h-1 )G = Soil heat flux density at the soil surface (MJ m-2 d-1 or MJ m-2 h-1)
a special Task Committee (TC) in 1999 to develop a standardized procedure for computing ETo. The ASCE TC has issued its recommendations (Walter et al., 2004) which are to be published in 2005. AZMET participated in the ASCE TC and began generating ETo values using this ASCE Standardized ETo procedure in 2003. The purpose of this report is to first review the computation procedure recommended by the ASCE TC; second, provide specifics on the computation procedure AZMET will employ; and third, summarize how the new standardized ETo procedure and the original AZMET ETo (EToa) procedure compare across months and locations.
Standardized Reference Evapotranspiration Definition
The ASCE TC defined reference evapotranspiration as “the ET rate from a uniform surface of dense actively growing vegetation having specified height and sur-face resistance (to transfer of water vapor), not short of soil water, and representing an expanse of at least 100 m of the same or similar vegetation.” This definition leaves open the option of having more than one refer-ence surface (differing height and surface resistance) and reflects the view of the TC that standardized com-putation procedures were necessary for two reference surfaces: 1) a short crop similar to clipped grass and 2) a tall crop similar to full-cover alfalfa. The recom-mended abbreviations for ETo computed for the short and tall crops using the standardized procedures are ETos and ETrs, respectively (see Table 1 for list of ET abbreviations used in this report).
The need to have procedures for two reference surfaces reflects the history of ET research in the U.S. Two crops — cool-season grass and alfalfa — have been used as reference surfaces for ET estimation for several decades. The TC recommendations allow us-ers with a strong preference for one reference surface or another to continue using their preferred surface. An important reason for recommending two surfaces pertains to crop coefficients (Kcs) — the adjustment factors used to convert ETo to estimates of ET for a specific type of vegetation. Kcs will differ for the two reference surfaces since alfalfa typically uses more water than grass when both are grown under reference conditions. Over the past 30+ years, Kcs have been developed for use with ETo computed for both grass and alfalfa reference surfaces. The TC recommenda-tion to allow for two reference surfaces allows local users to continue using the Kcs and reference surface they are most comfortable with.
(1)
Table 1. Abbreviations related to evapotranspiration that are contained in this report.
ABBREVIATION EXPLANATION
ET Evapotranspiration
ETcEvapotranspiration of aparticular crop or vegetationtype
ETo Reference Evapotranspirationin general
ETosStandardized ReferenceEvapotranspiration for ShortReference Crop
ETrsStandardized ReferenceEvapotranspiration for TallReference Crop
ETsz Standardized ReferenceEvapotranspiration in general
EToaReference Evapotranspirationas computed by AZMET inpast years
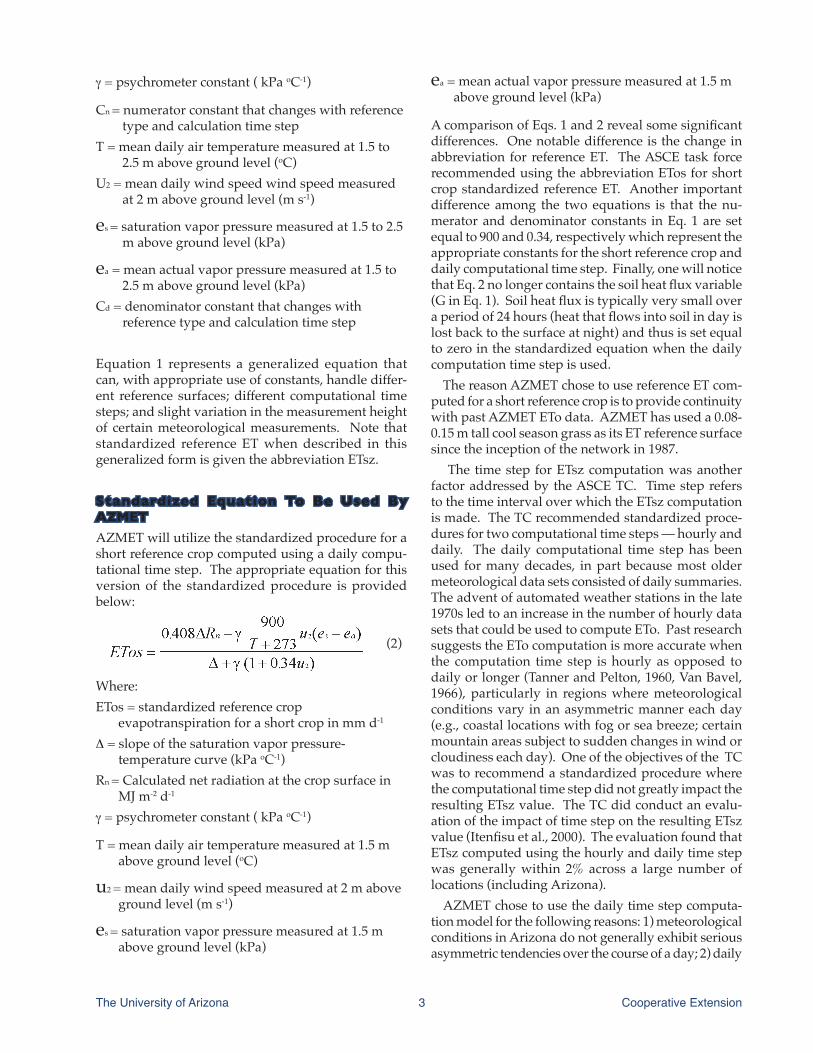
3The University of Arizona Cooperative Extension
γ = psychrometer constant ( kPa oC-1)
Cn = numerator constant that changes with reference type and calculation time stepT = mean daily air temperature measured at 1.5 to 2.5 m above ground level (oC)U2 = mean daily wind speed wind speed measured at 2 m above ground level (m s-1)
es = saturation vapor pressure measured at 1.5 to 2.5 m above ground level (kPa)
ea = mean actual vapor pressure measured at 1.5 to 2.5 m above ground level (kPa)Cd = denominator constant that changes with reference type and calculation time step
Equation 1 represents a generalized equation that can, with appropriate use of constants, handle differ-ent reference surfaces; different computational time steps; and slight variation in the measurement height of certain meteorological measurements. Note that standardized reference ET when described in this generalized form is given the abbreviation ETsz.
Standardized Equation To Be Used By AZMET
AZMET will utilize the standardized procedure for a short reference crop computed using a daily compu-tational time step. The appropriate equation for this version of the standardized procedure is provided below:
Where:ETos = standardized reference crop evapotranspiration for a short crop in mm d-1
Δ = slope of the saturation vapor pressure- temperature curve (kPa oC-1)Rn = Calculated net radiation at the crop surface in MJ m-2 d-1
γ = psychrometer constant ( kPa oC-1)
T = mean daily air temperature measured at 1.5 m above ground level (oC)
u2 = mean daily wind speed measured at 2 m above ground level (m s-1)
es = saturation vapor pressure measured at 1.5 m above ground level (kPa)
(2)
ea = mean actual vapor pressure measured at 1.5 m above ground level (kPa)
A comparison of Eqs. 1 and 2 reveal some significant differences. One notable difference is the change in abbreviation for reference ET. The ASCE task force recommended using the abbreviation ETos for short crop standardized reference ET. Another important difference among the two equations is that the nu-merator and denominator constants in Eq. 1 are set equal to 900 and 0.34, respectively which represent the appropriate constants for the short reference crop and daily computational time step. Finally, one will notice that Eq. 2 no longer contains the soil heat flux variable (G in Eq. 1). Soil heat flux is typically very small over a period of 24 hours (heat that flows into soil in day is lost back to the surface at night) and thus is set equal to zero in the standardized equation when the daily computation time step is used.
The reason AZMET chose to use reference ET com-puted for a short reference crop is to provide continuity with past AZMET ETo data. AZMET has used a 0.08-0.15 m tall cool season grass as its ET reference surface since the inception of the network in 1987.
The time step for ETsz computation was another factor addressed by the ASCE TC. Time step refers to the time interval over which the ETsz computation is made. The TC recommended standardized proce-dures for two computational time steps — hourly and daily. The daily computational time step has been used for many decades, in part because most older meteorological data sets consisted of daily summaries. The advent of automated weather stations in the late 1970s led to an increase in the number of hourly data sets that could be used to compute ETo. Past research suggests the ETo computation is more accurate when the computation time step is hourly as opposed to daily or longer (Tanner and Pelton, 1960, Van Bavel, 1966), particularly in regions where meteorological conditions vary in an asymmetric manner each day (e.g., coastal locations with fog or sea breeze; certain mountain areas subject to sudden changes in wind or cloudiness each day). One of the objectives of the TC was to recommend a standardized procedure where the computational time step did not greatly impact the resulting ETsz value. The TC did conduct an evalu-ation of the impact of time step on the resulting ETsz value (Itenfisu et al., 2000). The evaluation found that ETsz computed using the hourly and daily time step was generally within 2% across a large number of locations (including Arizona).
AZMET chose to use the daily time step computa-tion model for the following reasons: 1) meteorological conditions in Arizona do not generally exhibit serious asymmetric tendencies over the course of a day; 2) daily
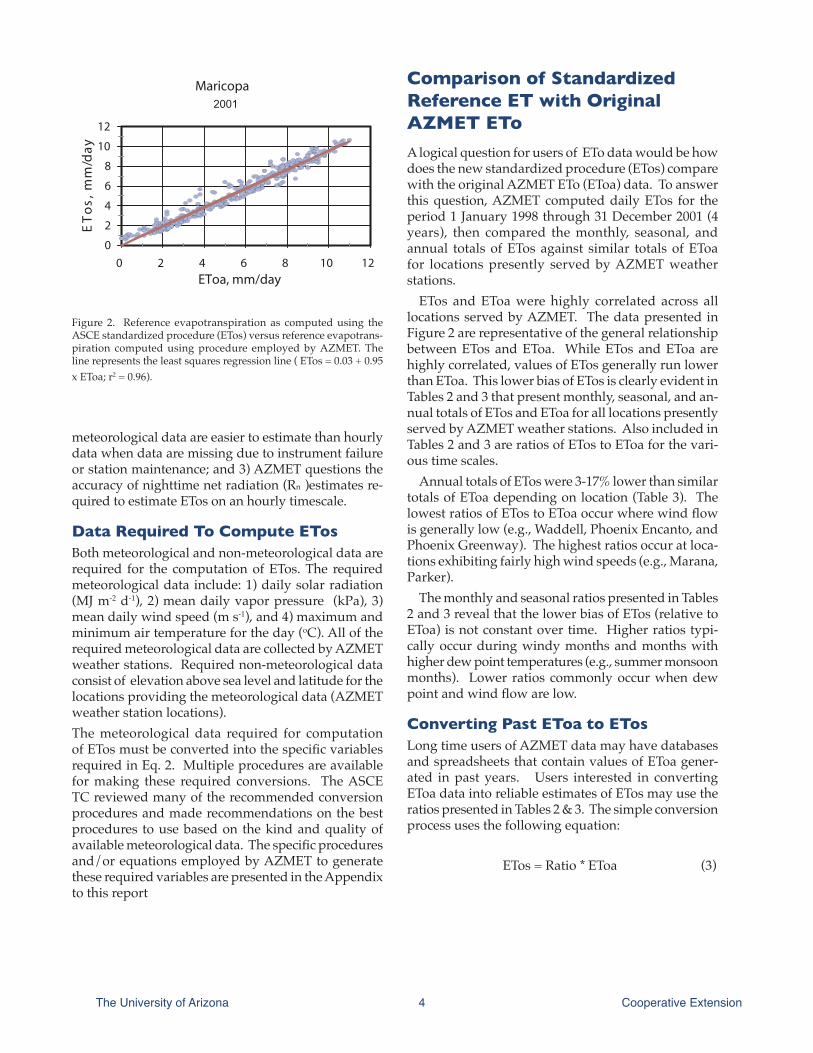
4The University of Arizona Cooperative Extension
Comparison of Standardized Reference ET with Original AZMET ETo
A logical question for users of ETo data would be how does the new standardized procedure (ETos) compare with the original AZMET ETo (EToa) data. To answer this question, AZMET computed daily ETos for the period 1 January 1998 through 31 December 2001 (4 years), then compared the monthly, seasonal, and annual totals of ETos against similar totals of EToa for locations presently served by AZMET weather stations.
ETos and EToa were highly correlated across all locations served by AZMET. The data presented in Figure 2 are representative of the general relationship between ETos and EToa. While ETos and EToa are highly correlated, values of ETos generally run lower than EToa. This lower bias of ETos is clearly evident in Tables 2 and 3 that present monthly, seasonal, and an-nual totals of ETos and EToa for all locations presently served by AZMET weather stations. Also included in Tables 2 and 3 are ratios of ETos to EToa for the vari-ous time scales.
Annual totals of ETos were 3-17% lower than similar totals of EToa depending on location (Table 3). The lowest ratios of ETos to EToa occur where wind flow is generally low (e.g., Waddell, Phoenix Encanto, and Phoenix Greenway). The highest ratios occur at loca-tions exhibiting fairly high wind speeds (e.g., Marana, Parker).
The monthly and seasonal ratios presented in Tables 2 and 3 reveal that the lower bias of ETos (relative to EToa) is not constant over time. Higher ratios typi-cally occur during windy months and months with higher dew point temperatures (e.g., summer monsoon months). Lower ratios commonly occur when dew point and wind flow are low.
Converting Past EToa to ETosLong time users of AZMET data may have databases and spreadsheets that contain values of EToa gener-ated in past years. Users interested in converting EToa data into reliable estimates of ETos may use the ratios presented in Tables 2 & 3. The simple conversion process uses the following equation:
ETos = Ratio * EToa (3)
meteorological data are easier to estimate than hourly data when data are missing due to instrument failure or station maintenance; and 3) AZMET questions the accuracy of nighttime net radiation (Rn )estimates re-quired to estimate ETos on an hourly timescale.
Data Required To Compute ETos
Both meteorological and non-meteorological data are required for the computation of ETos. The required meteorological data include: 1) daily solar radiation (MJ m-2 d-1), 2) mean daily vapor pressure (kPa), 3) mean daily wind speed (m s-1), and 4) maximum and minimum air temperature for the day (oC). All of the required meteorological data are collected by AZMET weather stations. Required non-meteorological data consist of elevation above sea level and latitude for the locations providing the meteorological data (AZMET weather station locations). The meteorological data required for computation of ETos must be converted into the specific variables required in Eq. 2. Multiple procedures are available for making these required conversions. The ASCE TC reviewed many of the recommended conversion procedures and made recommendations on the best procedures to use based on the kind and quality of available meteorological data. The specific procedures and/or equations employed by AZMET to generate these required variables are presented in the Appendix to this report
Figure 2. Reference evapotranspiration as computed using the ASCE standardized procedure (ETos) versus reference evapotrans-piration computed using procedure employed by AZMET. The line represents the least squares regression line ( ETos = 0.03 + 0.95 x EToa; r2 = 0.96).
0
2
4
6
8
10
12
ya
d/m
m ,s
oT
E
0 2 4 6 8 10 12EToa, mm/day
Maricopa2001
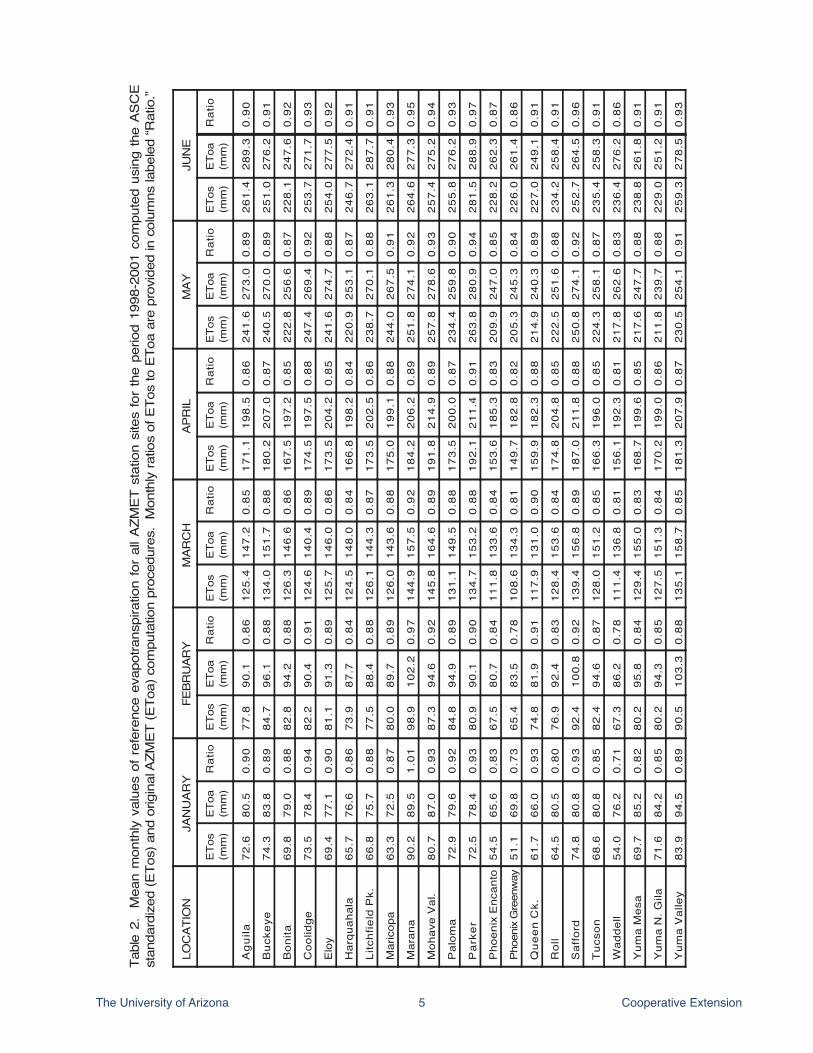
5The University of Arizona Cooperative Extension
Tabl
e 2.
M
ean
mon
thly
val
ues
of r
efer
ence
eva
potra
nspi
ratio
n fo
r al
l AZM
ET
stat
ion
site
s fo
r th
e pe
riod
1998
-200
1 co
mpu
ted
usin
g th
e A
SC
Est
anda
rdiz
ed (E
Tos)
and
orig
inal
AZM
ET
(ETo
a) c
ompu
tatio
n pr
oced
ures
. M
onth
ly ra
tios
of E
Tos
to E
Toa
are
prov
ided
in c
olum
ns la
bele
d “R
atio
.”
LOC
ATIO
NJA
NU
AR
YFE
BRU
ARY
MAR
CH
APR
ILM
AYJU
NE
ETo
s(m
m)
ETo
a(m
m)
Rat
ioE
Tos
(mm
)E
Toa
(mm
)R
atio
ETo
s(m
m)
ETo
a(m
m)
Rat
ioE
Tos
(mm
)E
Toa
(mm
)R
atio
ETo
s(m
m)
ETo
a(m
m)
Rat
ioE
Tos
(mm
)E
Toa
(mm
)R
atio
Agu
ila72
.680
.50.
9077
.890
.10.
8612
5.4
147.
20.
8517
1.1
198.
50.
8624
1.6
273.
00.
8926
1.4
289.
30.
90
Buc
keye
74.3
83.8
0.89
84.7
96.1
0.88
134.
015
1.7
0.88
180.
220
7.0
0.87
240.
527
0.0
0.89
251.
027
6.2
0.91
Bon
ita69
.879
.00.
8882
.894
.20.
8812
6.3
146.
60.
8616
7.5
197.
20.
8522
2.8
256.
60.
8722
8.1
247.
60.
92
Coo
lidge
73.5
78.4
0.94
82.2
90.4
0.91
124.
614
0.4
0.89
174.
519
7.5
0.88
247.
426
9.4
0.92
253.
727
1.7
0.93
Elo
y69
.477
.10.
9081
.191
.30.
8912
5.7
146.
00.
8617
3.5
204.
20.
8524
1.6
274.
70.
8825
4.0
277.
50.
92
Har
quah
ala
65.7
76.6
0.86
73.9
87.7
0.84
124.
514
8.0
0.84
166.
819
8.2
0.84
220.
925
3.1
0.87
246.
727
2.4
0.91
Litc
hfie
ld P
k.66
.875
.70.
8877
.588
.40.
8812
6.1
144.
30.
8717
3.5
202.
50.
8623
8.7
270.
10.
8826
3.1
287.
70.
91
Mar
icop
a63
.372
.50.
8780
.089
.70.
8912
6.0
143.
60.
8817
5.0
199.
10.
8824
4.0
267.
50.
9126
1.3
280.
40.
93
Mar
ana
90.2
89.5
1.01
98.9
102.
20.
9714
4.9
157.
50.
9218
4.2
206.
20.
8925
1.8
274.
10.
9226
4.6
277.
30.
95
Moh
ave
Val
.80
.787
.00.
9387
.394
.60.
9214
5.8
164.
60.
8919
1.8
214.
90.
8925
7.8
278.
60.
9325
7.4
275.
20.
94
Pal
oma
72.9
79.6
0.92
84.8
94.9
0.89
131.
114
9.5
0.88
173.
520
0.0
0.87
234.
425
9.8
0.90
255.
827
6.2
0.93
Par
ker
72.5
78.4
0.93
80.9
90.1
0.90
134.
715
3.2
0.88
192.
121
1.4
0.91
263.
828
0.9
0.94
281.
528
8.9
0.97
Pho
enix
Enc
anto
54
.565
.60.
8367
.580
.70.
8411
1.8
133.
60.
8415
3.6
185.
30.
8320
9.9
247.
00.
8522
8.2
262.
30.
87
Phoe
nix
Gre
enw
ay51
.169
.80.
7365
.483
.50.
7810
8.6
134.
30.
8114
9.7
182.
80.
8220
5.3
245.
30.
8422
6.0
261.
40.
86
Que
en C
k.61
.766
.00.
9374
.881
.90.
9111
7.9
131.
00.
9015
9.9
182.
30.
8821
4.9
240.
30.
8922
7.0
249.
10.
91
Rol
l64
.580
.50.
8076
.992
.40.
8312
8.4
153.
60.
8417
4.8
204.
80.
8522
2.5
251.
60.
8823
4.2
258.
40.
91
Saf
ford
74.8
80.8
0.93
92.4
100.
80.
9213
9.4
156.
80.
8918
7.0
211.
80.
8825
0.8
274.
10.
9225
2.7
264.
50.
96
Tuc
son
68.6
80.8
0.85
82.4
94.6
0.87
128.
015
1.2
0.85
166.
319
6.0
0.85
224.
325
8.1
0.87
235.
425
8.3
0.91
Wad
dell
54.0
76.2
0.71
67.3
86.2
0.78
111.
413
6.8
0.81
156.
119
2.3
0.81
217.
826
2.6
0.83
236.
427
6.2
0.86
Yum
a M
esa
69.7
85.2
0.82
80.2
95.8
0.84
129.
415
5.0
0.83
168.
719
9.6
0.85
217.
624
7.7
0.88
238.
826
1.8
0.91
Yum
a N
. Gila
71.6
84.2
0.85
80.2
94.3
0.85
127.
515
1.3
0.84
170.
219
9.0
0.86
211.
823
9.7
0.88
229.
025
1.2
0.91
Yum
a V
alle
y83
.994
.50.
8990
.510
3.3
0.88
135.
115
8.7
0.85
181.
320
7.9
0.87
230.
525
4.1
0.91
259.
327
8.5
0.93
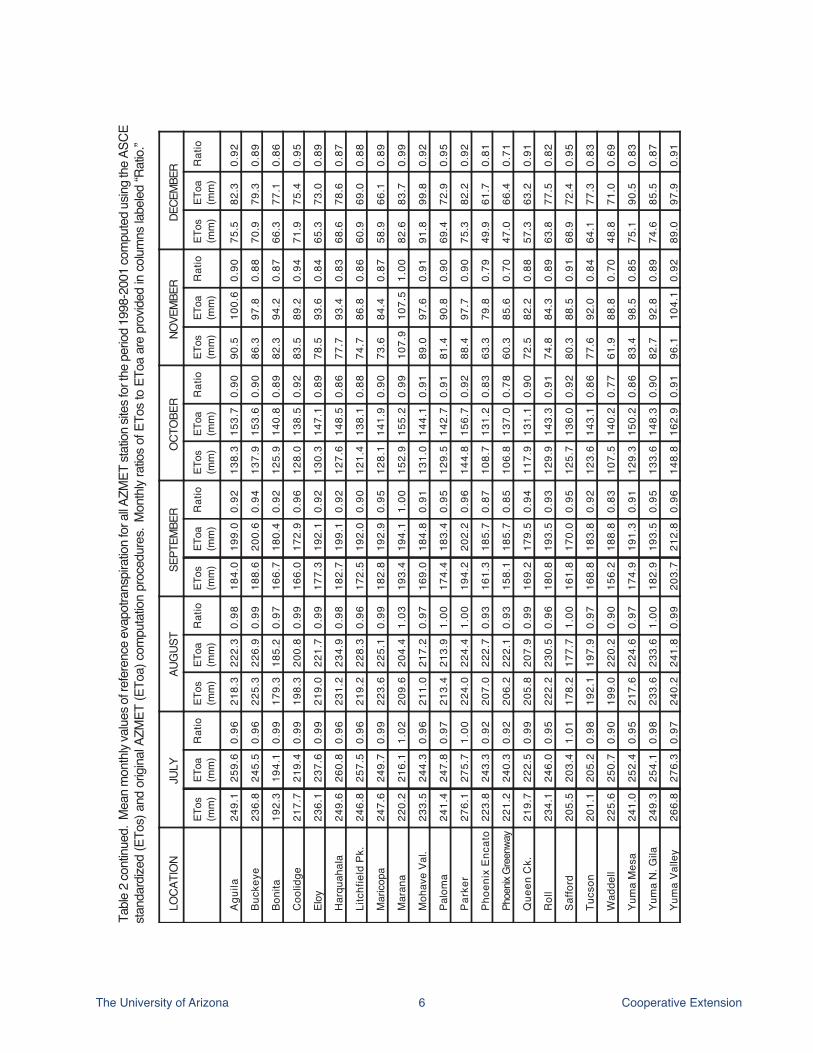
6The University of Arizona Cooperative Extension
Table
2 co
ntinu
ed. M
ean
mon
thly
value
s of r
efer
ence
eva
potra
nspir
ation
for a
ll AZM
ET st
ation
site
s for
the
perio
d 19
98-2
001
com
pute
d us
ing th
e AS
CEst
anda
rdize
d (E
Tos)
and
orig
inal
AZM
ET (E
Toa)
com
puta
tion
proc
edur
es.
M
onth
ly ra
tios
of E
Tos
to E
Toa
are
prov
ided
in co
lumns
labe
led “R
atio.
”
LOCA
TIO
NJU
LYAU
GUS
TSE
PTEM
BER
OCT
OBE
RNO
VEM
BER
DECE
MBE
R
ETos
(mm
)ET
oa(m
m)
Rat
ioET
os(m
m)
EToa
(mm
)R
atio
ETos
(mm
)ET
oa(m
m)
Rat
ioET
os(m
m)
EToa
(mm
)R
atio
ETos
(mm
)ET
oa(m
m)
Rat
ioET
os(m
m)
EToa
(mm
)R
atio
Agu
ila24
9.1
259.
60.
9621
8.3
222.
30.
9818
4.0
199.
00.
9213
8.3
153.
70.
9090
.510
0.6
0.90
75.5
82.3
0.92
Buck
eye
236.
824
5.5
0.96
225.
322
6.9
0.99
188.
620
0.6
0.94
137.
915
3.6
0.90
86.3
97.8
0.88
70.9
79.3
0.89
Boni
ta19
2.3
194.
10.
9917
9.3
185.
20.
9716
6.7
180.
40.
9212
5.9
140.
80.
8982
.394
.20.
8766
.377
.10.
86
Coo
lidge
217.
721
9.4
0.99
198.
320
0.8
0.99
166.
017
2.9
0.96
128.
013
8.5
0.92
83.5
89.2
0.94
71.9
75.4
0.95
Eloy
236.
123
7.6
0.99
219.
022
1.7
0.99
177.
319
2.1
0.92
130.
314
7.1
0.89
78.5
93.6
0.84
65.3
73.0
0.89
Har
quah
ala
249.
626
0.8
0.96
231.
223
4.9
0.98
182.
719
9.1
0.92
127.
614
8.5
0.86
77.7
93.4
0.83
68.6
78.6
0.87
Litc
hfie
ld P
k.24
6.8
257.
50.
9621
9.2
228.
30.
9617
2.5
192.
00.
9012
1.4
138.
10.
8874
.786
.80.
8660
.969
.00.
88
Mar
icop
a24
7.6
249.
70.
9922
3.6
225.
10.
9918
2.8
192.
90.
9512
8.1
141.
90.
9073
.684
.40.
8758
.966
.10.
89
Mar
ana
220.
221
6.1
1.02
209.
620
4.4
1.03
193.
419
4.1
1.00
152.
915
5.2
0.99
107.
910
7.5
1.00
82.6
83.7
0.99
Moh
ave
Val.
233.
524
4.3
0.96
211.
021
7.2
0.97
169.
018
4.8
0.91
131.
014
4.1
0.91
89.0
97.6
0.91
91.8
99.8
0.92
Palo
ma
241.
424
7.8
0.97
213.
421
3.9
1.00
174.
418
3.4
0.95
129.
514
2.7
0.91
81.4
90.8
0.90
69.4
72.9
0.95
Par
ker
276.
127
5.7
1.00
224.
022
4.4
1.00
194.
220
2.2
0.96
144.
815
6.7
0.92
88.4
97.7
0.90
75.3
82.2
0.92
Phoe
nix
Enca
to
223.
824
3.3
0.92
207.
022
2.7
0.93
161.
318
5.7
0.87
108.
713
1.2
0.83
63.3
79.8
0.79
49.9
61.7
0.81
Phoe
nix G
reen
way
221.
224
0.3
0.92
206.
222
2.1
0.93
158.
118
5.7
0.85
106.
813
7.0
0.78
60.3
85.6
0.70
47.0
66.4
0.71
Que
en C
k.21
9.7
222.
50.
9920
5.8
207.
90.
9916
9.2
179.
50.
9411
7.9
131.
10.
9072
.582
.20.
8857
.363
.20.
91
Rol
l23
4.1
246.
00.
9522
2.2
230.
50.
9618
0.8
193.
50.
9312
9.9
143.
30.
9174
.884
.30.
8963
.877
.50.
82
Saffo
rd20
5.5
203.
41.
0117
8.2
177.
71.
0016
1.8
170.
00.
9512
5.7
136.
00.
9280
.388
.50.
9168
.972
.40.
95
Tucs
on20
1.1
205.
20.
9819
2.1
197.
90.
9716
8.8
183.
80.
9212
3.6
143.
10.
8677
.692
.00.
8464
.177
.30.
83
Wad
dell
225.
625
0.7
0.90
199.
022
0.2
0.90
156.
218
8.8
0.83
107.
514
0.2
0.77
61.9
88.8
0.70
48.8
71.0
0.69
Yum
a M
esa
241.
025
2.4
0.95
217.
622
4.6
0.97
174.
919
1.3
0.91
129.
315
0.2
0.86
83.4
98.5
0.85
75.1
90.5
0.83
Yum
a N
. Gila
249.
325
4.1
0.98
233.
623
3.6
1.00
182.
919
3.5
0.95
133.
614
8.3
0.90
82.7
92.8
0.89
74.6
85.5
0.87
Yum
a Va
lley
266.
827
6.3
0.97
240.
224
1.8
0.99
203.
721
2.8
0.96
148.
816
2.9
0.91
96.1
104.
10.
9289
.097
.90.
91
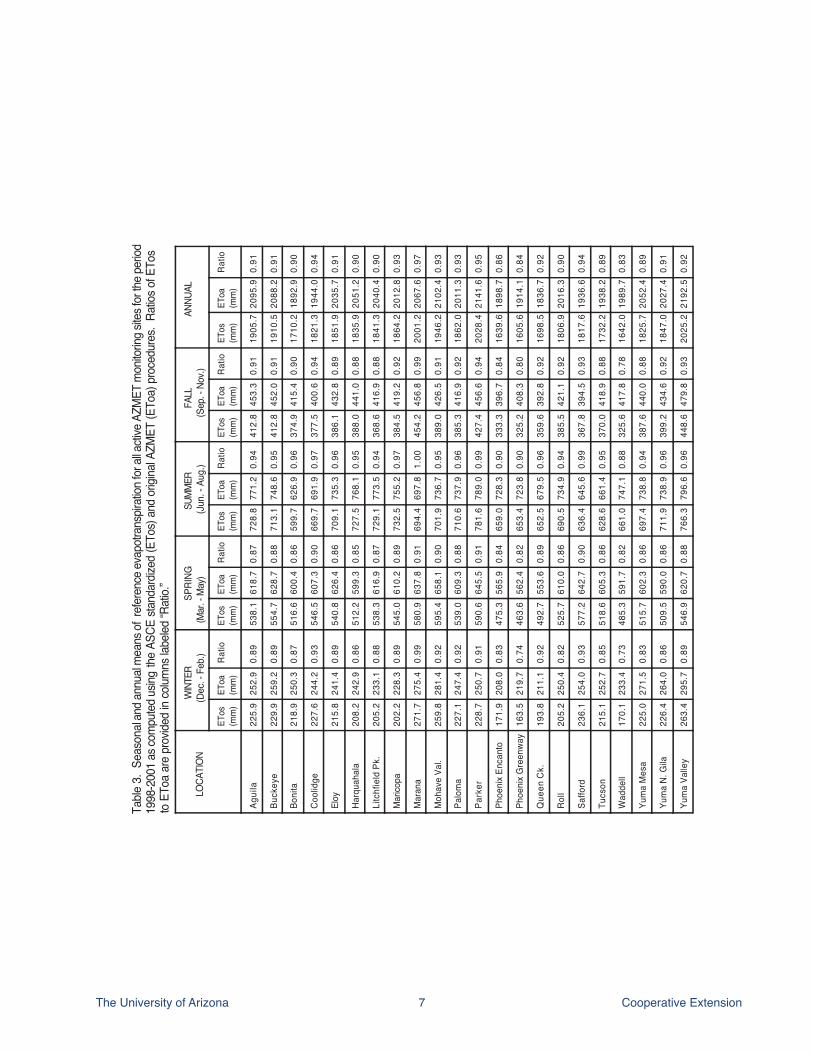
7The University of Arizona Cooperative Extension
Table
3.
Seas
onal
and a
nnua
l mea
ns of
refer
ence
evap
otran
spira
tion f
or al
l acti
ve A
ZMET
mon
itorin
g site
s for
the p
eriod
th
e AS
CE st
anda
rdize
d (E
Tos)
and
orig
inal A
ZMET
(ETo
a) p
roce
dure
s. R
atios
of E
Tos
LOCA
TION
WIN
TER
(Dec
. - F
eb.)
SPRI
NG (M
ar. -
May
)SU
MMER
(J
un. -
Aug
.)FA
LL
(Sep
. - N
ov.)
ANNU
AL
ETos
(mm
)ET
oa(m
m)
Ratio
ETos
(mm
)ET
oa(m
m)
Ratio
ETos
(mm
)ET
oa(m
m)
Ratio
ETos
(mm
)ET
oa(m
m)
Ratio
ETos
(mm
)ET
oa(m
m)
Ratio
Agui
la22
5.9
252.
90.
8953
8.1
618.
70.
8772
8.8
771.
20.
9441
2.8
453.
30.
9119
05.7
2095
.90.
91
Buck
eye
229.
925
9.2
0.89
554.
762
8.7
0.88
713.
174
8.6
0.95
412.
845
2.0
0.91
1910
.520
88.2
0.91
Boni
ta21
8.9
250.
30.
8751
6.6
600.
40.
8659
9.7
626.
90.
9637
4.9
415.
40.
9017
10.2
1892
.90.
90
Cool
idge
227.
624
4.2
0.93
546.
560
7.3
0.90
669.
769
1.9
0.97
377.
540
0.6
0.94
1821
.319
44.0
0.94
Eloy
215.
824
1.4
0.89
540.
862
6.4
0.86
709.
173
5.3
0.96
386.
143
2.8
0.89
1851
.920
35.7
0.91
Harq
uaha
la20
8.2
242.
90.
8651
2.2
599.
30.
8572
7.5
768.
10.
9538
8.0
441.
00.
8818
35.9
2051
.20.
90
Litc
hfie
ld P
k.20
5.2
233.
10.
8853
8.3
616.
90.
8772
9.1
773.
50.
9436
8.6
416.
90.
8818
41.3
2040
.40.
90
Mar
icopa
202.
222
8.3
0.89
545.
061
0.2
0.89
732.
575
5.2
0.97
384.
541
9.2
0.92
1864
.220
12.8
0.93
Mar
ana
271.
727
5.4
0.99
580.
963
7.8
0.91
694.
469
7.8
1.00
454.
245
6.8
0.99
2001
.220
67.6
0.97
Moh
ave
Val.
259.
828
1.4
0.92
595.
465
8.1
0.90
701.
973
6.7
0.95
389.
042
6.5
0.91
1946
.221
02.4
0.93
Palo
ma
227.
124
7.4
0.92
539.
060
9.3
0.88
710.
673
7.9
0.96
385.
341
6.9
0.92
1862
.020
11.3
0.93
Park
er22
8.7
250.
70.
9159
0.6
645.
50.
9178
1.6
789.
00.
9942
7.4
456.
60.
9420
28.4
2141
.60.
95
Phoe
nix
Enca
nto
171.
920
8.0
0.83
475.
356
5.9
0.84
659.
072
8.3
0.90
333.
339
6.7
0.84
1639
.618
98.7
0.86
Phoe
nix
Gre
enwa
y16
3.5
219.
70.
7446
3.6
562.
40.
8265
3.4
723.
80.
9032
5.2
408.
30.
8016
05.6
1914
.10.
84
Que
en C
k.19
3.8
211.
10.
9249
2.7
553.
60.
8965
2.5
679.
50.
9635
9.6
392.
80.
9216
98.5
1836
.70.
92
Roll
205.
225
0.4
0.82
525.
761
0.0
0.86
690.
573
4.9
0.94
385.
542
1.1
0.92
1806
.920
16.3
0.90
Saffo
rd23
6.1
254.
00.
9357
7.2
642.
70.
9063
6.4
645.
60.
9936
7.8
394.
50.
9318
17.6
1936
.60.
94
Tucs
on21
5.1
252.
70.
8551
8.6
605.
30.
8662
8.6
661.
40.
9537
0.0
418.
90.
8817
32.2
1938
.20.
89
Wad
dell
170.
123
3.4
0.73
485.
359
1.7
0.82
661.
074
7.1
0.88
325.
641
7.8
0.78
1642
.019
89.7
0.83
Yum
a M
esa
225.
027
1.5
0.83
515.
760
2.3
0.86
697.
473
8.8
0.94
387.
644
0.0
0.88
1825
.720
52.4
0.89
Yum
a N.
Gila
226.
426
4.0
0.86
509.
559
0.0
0.86
711.
973
8.9
0.96
399.
243
4.6
0.92
1847
.020
27.4
0.91
Yum
a Va
lley
263.
429
5.7
0.89
546.
962
0.7
0.88
766.
379
6.6
0.96
448.
647
9.8
0.93
2025
.221
92.5
0.92
1998
-200
1 as c
ompu
ted us
ingto
ETo
a ar
e pr
ovide
d in
colum
ns la
beled
“Rat
io.”
8The University of Arizona Cooperative Extension
where Ratio represents the appropriate annual, sea-sonal or monthly ratio from Tables 2 and 3. Annual ratios should be used only to adjust annual totals of EToa. Monthly ratios provide the best means of converting short term data sets (e.g., daily, weekly or monthly totals of EToa). Users wishing to obtain ac-tual computed values of ETos for past years should contact AZMET. As part of the move to adopt ETos, AZMET will generate ETos for its entire database which extends back to 1987 at some locations.
Crop Coefficients and ETos Crop coefficients (Kcs) are used to convert ETo data into estimates of crop evapotranspiration (ETc). The simple conversion procedure is as follows:
It is important to note that Kcs need to be matched to the ETo procedure in order to obtain reliable estimates of ETc from Eq. 4. To help clarify this point, suppose one has a turf Kc of 0.75 that is appropriate for use with AZMET ETo (EToa). To obtain an estimate of turf water use in Tucson for May one would multiply the Kc (0.75) times the May EToa value for Tucson (258.1 mm from Table 2):
ETc = Kc * EToa
ETc = 0.75 * 258.1 mm
ETc = 193.6 mm (7.62”)
If, however, this same Kc is erroneously applied to values of ETos, the same May turf water use estimate in Tucson would be:
ETc = Kc * ETos
ETc = 0.75 * 224.3 mm
ETc = 168.2 mm (6.62”)
or 25.4 mm (1.0”) less than the correct value. It is clear from this example that failure to match Kcs with ETo procedure can lead to significant errors when estimat-ing water use from vegetation.
Very few Kcs have been validated for use with ETos in Arizona with the notable exception of turfgrass (Brown and Kopec, 2000). While a number of research studies are presently underway (University of Arizona and USDA-ARS) that should provide validated Kcs for a number of Arizona crops in the near future, indi-viduals interested in applying Kcs to ETos must either
ETc = Kc * ETo (4)
use published Kcs developed in another location, or adjust existing AZMET Kcs. A good place to locate Kcs for use with ETos is the publication entitled Crop Evapotranspiration: Guidelines for computing crop water requirements which is listed in the Reference section of this report.
Adjusting AZMET Kcs is a simple process that re-quires the use of the ratio data in Tables 2 and 3:
Kcos = Kcaz / Ratio (5)
where Kcos and Kcaz are the crop coefficient values appropriate for use with ETos and EToa, respectively; and Ratio is the ratio of ETos to EToa provided in Tables 2 and 3. In the previous example pertaining to turfgrass water use for Tucson in May, one would correct the Kcaz value of 0.75 by dividing by the May ratio presented in Table 2 (0.87):
Kcos= 0.75 / 0.87 = 0.86
Seasonal ratios of ETos to EToa are provided in Table 3 to assist with adjusting Kcaz for row crops. For ex-ample, AZMET has recommended using a Kc of 1.12 for full cover cotton when using EToa. The process of adjusting this Kc for use with ETos at Maricopa would proceed as follows:
Kcos= 1.12 / 0.97 = 1.15
The value of 0.97 is the summer ratio for Maricopa (see Table 3).On a practical note it is important to recognize that ex-isting Kcaz values will require only minor adjustments (if any) when used during the summer months. Larger adjustments will be required in winter where the ratios of ETos to EToa are generally much less than 1.0.
ReferencesAllen, R.G., L.S. Pereira, D. Raes, and M. Smith. 1998.
Crop evapotranspiration: Guidelines for comput-ing crop water requirements. Irrigation & Drain-age Paper 56. Food and Agriculture Organization, United Nations. Rome, IT.
Brown, P.W. 1998. AZMET computation of reference crop evapotranspiration. Arizona Meteorological Network [Online]. Available at cals.arizona.edu/azmet/et2.htm (verified 1 Nov. 2002).
9The University of Arizona Cooperative Extension
Brown, P. and D. Kopec. 2000. Converting Refer-ence Evapotranspiration Into Turf Water Use. Turf Irrigation Management Series: II. Extension Report AZ1195. College of Agriculture, University of Arizona.
Itenfisu, D., R.L. Elliott, R.G. Allen, and I.A. Walter. 2000. Comparison of reference evapotranspiration calculations across a range of climates. p. 216-227. Proc., 4th Decennial National Irrig. Symp. Phoenix, AZ. ASAE, St. Joseph, MI.
Jensen, M.E., R.D. Burman, and R.G. Allen (ed.). 1990. Evapotranspiration and Irrigation Water Requirements. ASCE Manuals and Reports on Engineering Practice No. 70., New York.
Sammis, T. 1996. Penman’s Equation Referenced to Grass [Online]. Available at weather.nmsu.edu/math/penmans.html (verified 1 Nov. 2002).
Snyder, R. and W. Pruitt. 1985. Estimating refer-ence evapotranspiration with hourly data. Chpt. VII. In R. Snyder et al. (ed.) California Irrigation Management Information System Final Report. Univ. of California-Davis. Land, Air and Water Resources Paper #10013.
Tanner, C.B. and W.L. Pelton. 1960. Potential evapotranspiration estimates by the approximate energy balance method of Penman. J. Geophysical Research. 65:3391-3413.
Walter, I.A., R.G. Allen, R. Elliott, D. Itenfisu, P. Brown, M.E. Jensen, B. Mecham, T.A. Howell, R. Snyder, S. Eching, T. Spofford, M. Hattendorf, D. Martin, R.H. Cuenca, and J.L. Wright. 2004. The ASCE Standardized Reference Evapotranspiration Equation. Final Draft. Envir. Water Resources Institute, ASCE.
Van Bavel, C.H.M. 1966. Potential evaporation: the combination concept and its experimental verifica-tion. Water Resource Research 2(3):455-467.
10The University of Arizona Cooperative Extension
Appendix
The procedures and equations used to compute the variables presented in Equation 2 are described in this Appendix. The variables are presented in the order they are encountered in Eq. 2.Δ: Slope of Saturation Vapor Pressure vs. Temperature Relationship
The slope of the saturation vapor pressure versus temperature relationship, Δ (kPa o C-1), is computed using:
Δ = 2503 exp((17.27T)/(T + 237.3))/(T + 237.3)2 (A1)
where T is the mean temperature for the day (o C).
Rn: Net Radiation
Net radiation is the net amount of radiant energy available at the surface for evaporating water. Rn includes both short and long wave radiation and is computed using:
Rn = Rns - Rn1 (A2)
where Rns = net shortwave radiation (MJ m-2 d-1) defined as positive in the downward direction (toward earth) and Rnl = net longwave radiation (MJ m-2 d-1) defined as positive in the upward direction (toward sky).
Net shortwave radiation (Rns) is computed as the difference between incoming and reflected shortwave radiation:
Rns = Rs - αRs = (1 - α)Rs (A3)
where α = albedo or canopy reflection coefficient which is fixed at 0.23 and Rs = incoming solar radiation (MJ m-2 d-1).
Net longwave radiation (Rnl) is the difference between upward longwave radiation (Rlu) and downward longwave radiation from the sky (Rld):
Rnl = Rlu - Rld (A4)
The daily value of Rnl is computed using:
Rnl=σ[(TK4max+TK4min)/2]*(0.34-0.14 √ea)[1.35(Rs/Rso) - 0.35] (A5)
where Rnl is net long-wave radiation in MJ m-2 d-1, σ is the Stefan-Boltzman constant [= 4.901 x 10⁻⁹ MJ K-4 m-2 d-1], TK4max is the maximum absolute temperature for the day (K), TK4min is the minimum absolute temperatures for the day (K), ea is the actual vapor pressure (kPa), Rs is solar radiation (MJ m-2 d-1), and Rso is calculated clear-sky solar radiation (MJ m-2 d-1). The ratio Rs/Rso indicates the relative level of cloudiness must be limited to 0.3 < Rs/Rso < 1.0. Rs/Rso values <0.30 are set = 0.30; Rs/Rso values > 1.0 are set = 1.0.
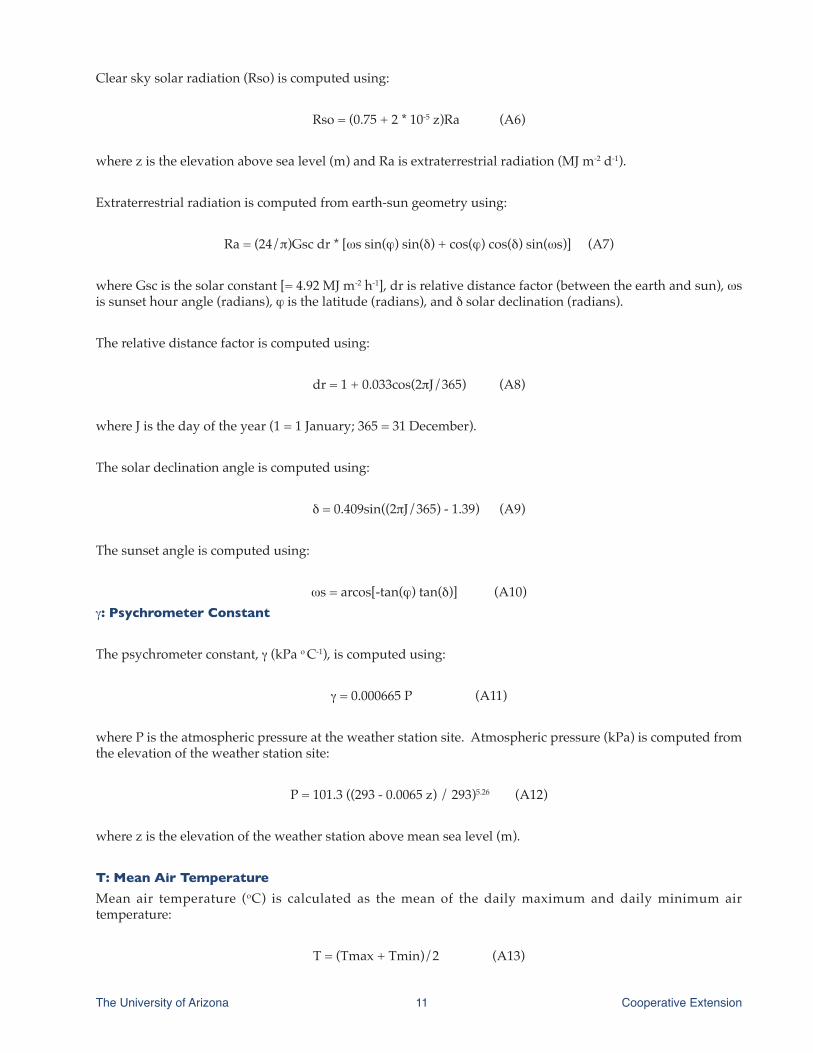
11The University of Arizona Cooperative Extension
Clear sky solar radiation (Rso) is computed using:
Rso = (0.75 + 2 * 10-5 z)Ra (A6)
where z is the elevation above sea level (m) and Ra is extraterrestrial radiation (MJ m-2 d-1).
Extraterrestrial radiation is computed from earth-sun geometry using:
Ra = (24/π)Gsc dr * [ωs sin(ϕ) sin(δ) + cos(ϕ) cos(δ) sin(ωs)] (A7)
where Gsc is the solar constant [= 4.92 MJ m-2 h-1], dr is relative distance factor (between the earth and sun), ωs is sunset hour angle (radians), ϕ is the latitude (radians), and δ solar declination (radians).
The relative distance factor is computed using:
dr = 1 + 0.033cos(2πJ/365) (A8)
where J is the day of the year (1 = 1 January; 365 = 31 December).
The solar declination angle is computed using:
δ = 0.409sin((2πJ/365) - 1.39) (A9)
The sunset angle is computed using:
ωs = arcos[-tan(ϕ) tan(δ)] (A10)γ: Psychrometer Constant
The psychrometer constant, γ (kPa o C-1), is computed using:
γ = 0.000665 P (A11)
where P is the atmospheric pressure at the weather station site. Atmospheric pressure (kPa) is computed from the elevation of the weather station site:
P = 101.3 ((293 - 0.0065 z) / 293)5.26 (A12)
where z is the elevation of the weather station above mean sea level (m).
T: Mean Air Temperature
Mean air temperature (oC) is calculated as the mean of the daily maximum and daily minimum air temperature:
T = (Tmax + Tmin)/2 (A13)
12The University of Arizona Cooperative Extension
where Tmax and Tmin are the maximum and minimum air temperatures (oC) as obtained from the weather station data logger.
U2:Wind Speed
The standardized equation requires the mean daily wind speed measured at 2 m above ground level (agl). Because AZMET measures wind speed at 3 m agl, wind speed is adjusted to an equivalent value at 2 m agl using the following:
u2 = u3 (4.87/ln(67.8 zw - 5.42) (A14)
where u3 is the wind speed measured at 3 m agl and zw is the height of the wind speed measurement (3 m).
es: Saturation Vapor Pressure
Saturation vapor pressure is computed using:
es = (es(Tmax) + es(Tmin)) / 2 (A15)where es(Tmax) and es(Tmin) are the saturation vapor pressures (kPa) computed using the maximum and minimum air temperatures, respectively. Saturation vapor pressure is computed using the following:
es = 0.6108 exp((17.27Tex) / (Tex + 237.3)) (A16)
where Tex is either Tmax or Tmin (oC) .
ea: Actual Vapor Pressure
The mean actual vapor pressure for the day is computed by the weather station datalogger using simultaneous measurements of relative humidity (RH; %) and air temperature (Ta; oC ) using:
ea = (RH/100) [0.6108 exp((17.27Ta)/(Ta + 237.3))] (A17)
Values of ea are computed by the datalogger every 10 s and averaged for the day.
Any products, services, or organizations that are mentioned, shown, or indirectly implied in this publication do not imply endorsement by The University of Arizona.

APPENDIX E Water Level Measurements
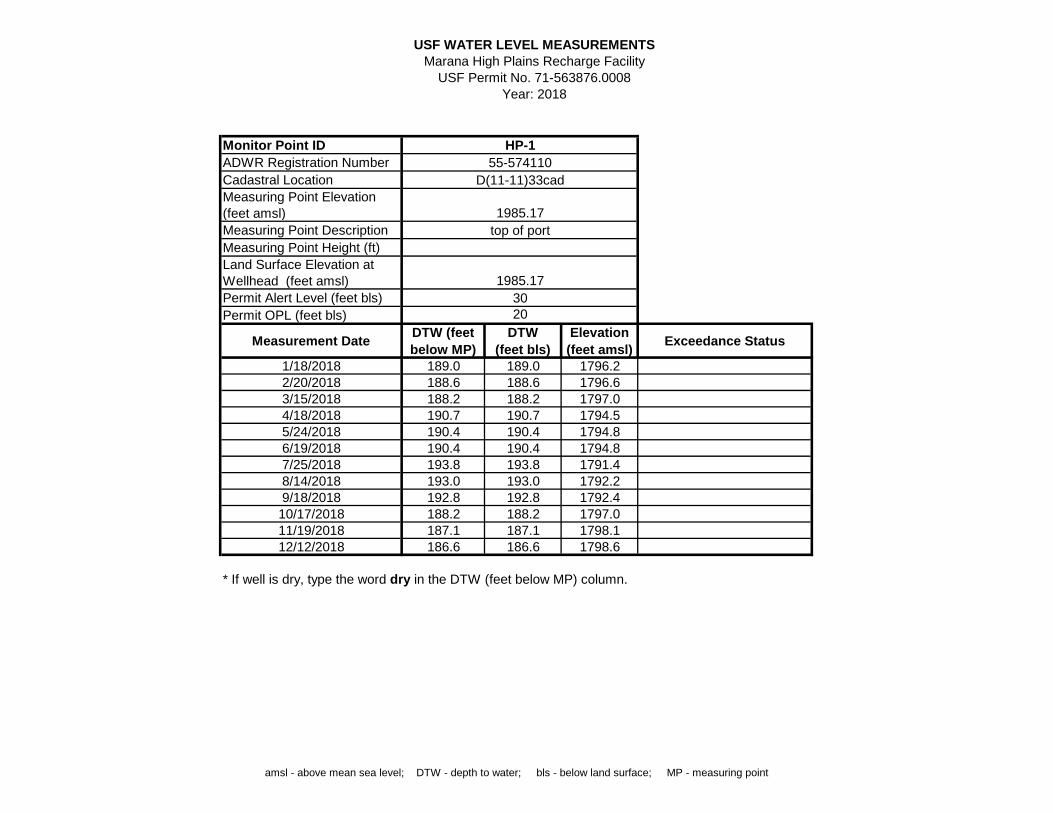
Monitor Point IDADWR Registration NumberCadastral LocationMeasuring Point Elevation (feet amsl)Measuring Point DescriptionMeasuring Point Height (ft)Land Surface Elevation at Wellhead (feet amsl)Permit Alert Level (feet bls)Permit OPL (feet bls)
Measurement Date DTW (feet below MP)
DTW(feet bls)
Elevation(feet amsl) Exceedance Status
1/18/2018 189.0 189.0 1796.22/20/2018 188.6 188.6 1796.63/15/2018 188.2 188.2 1797.04/18/2018 190.7 190.7 1794.55/24/2018 190.4 190.4 1794.86/19/2018 190.4 190.4 1794.87/25/2018 193.8 193.8 1791.48/14/2018 193.0 193.0 1792.29/18/2018 192.8 192.8 1792.410/17/2018 188.2 188.2 1797.011/19/2018 187.1 187.1 1798.112/12/2018 186.6 186.6 1798.6
* If well is dry, type the word dry in the DTW (feet below MP) column.
D(11-11)33cad
1985.17
30
top of port
1985.17
20
HP-155-574110
amsl - above mean sea level; DTW - depth to water; bls - below land surface; MP - measuring point
USF WATER LEVEL MEASUREMENTSMarana High Plains Recharge Facility
USF Permit No. 71-563876.0008Year: 2018
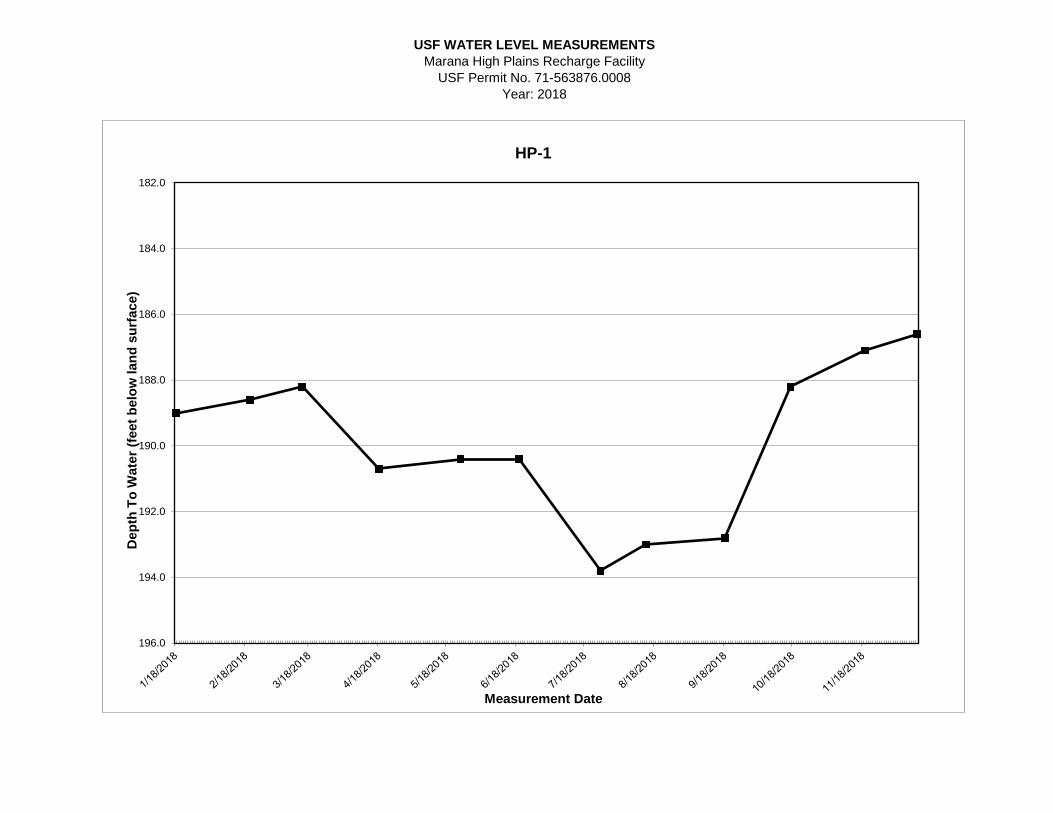
Marana High Plains Recharge FacilityUSF WATER LEVEL MEASUREMENTS
Year: 2018USF Permit No. 71-563876.0008
182.0
184.0
186.0
188.0
190.0
192.0
194.0
196.0
Dep
th T
o W
ater
(fee
t bel
ow la
nd s
urfa
ce)
Measurement Date
HP-1
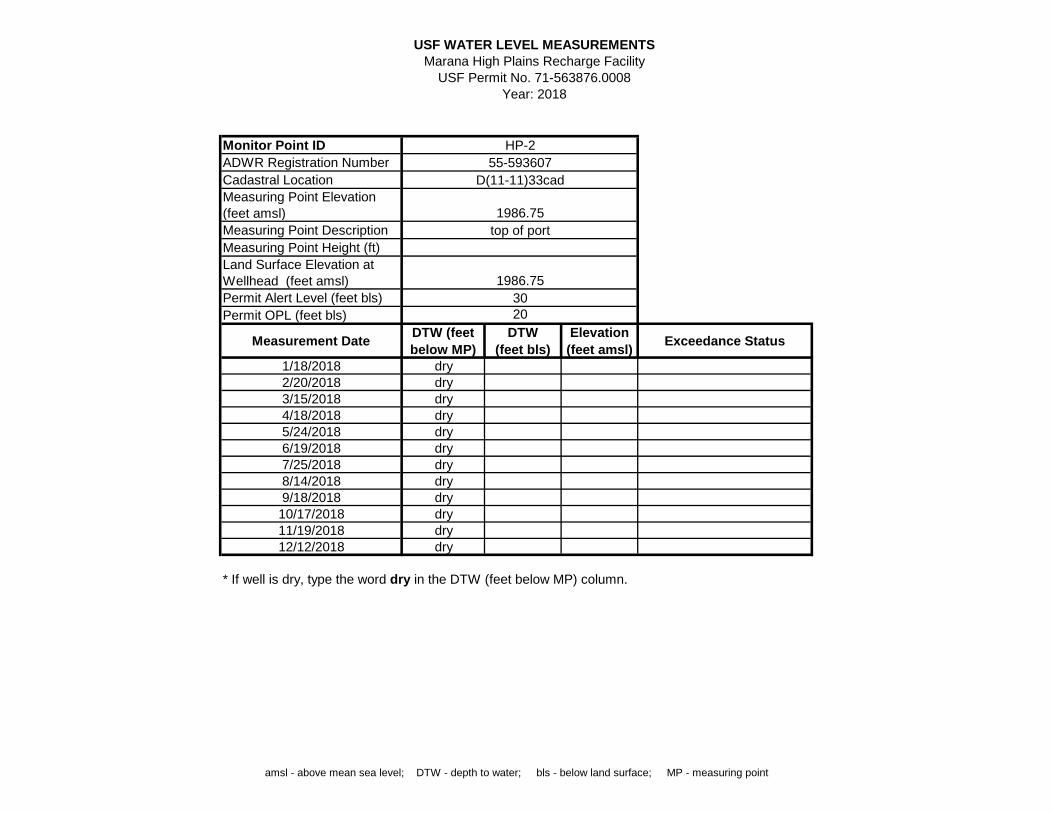
Monitor Point IDADWR Registration NumberCadastral LocationMeasuring Point Elevation (feet amsl)Measuring Point DescriptionMeasuring Point Height (ft)Land Surface Elevation at Wellhead (feet amsl)Permit Alert Level (feet bls)Permit OPL (feet bls)
Measurement Date DTW (feet below MP)
DTW(feet bls)
Elevation(feet amsl) Exceedance Status
1/18/2018 dry2/20/2018 dry3/15/2018 dry4/18/2018 dry5/24/2018 dry6/19/2018 dry7/25/2018 dry8/14/2018 dry9/18/2018 dry10/17/2018 dry11/19/2018 dry12/12/2018 dry
* If well is dry, type the word dry in the DTW (feet below MP) column.
20
amsl - above mean sea level; DTW - depth to water; bls - below land surface; MP - measuring point
Year: 2018
30
HP-255-593607
1986.75
top of port
D(11-11)33cad
1986.75
USF WATER LEVEL MEASUREMENTSMarana High Plains Recharge Facility
USF Permit No. 71-563876.0008
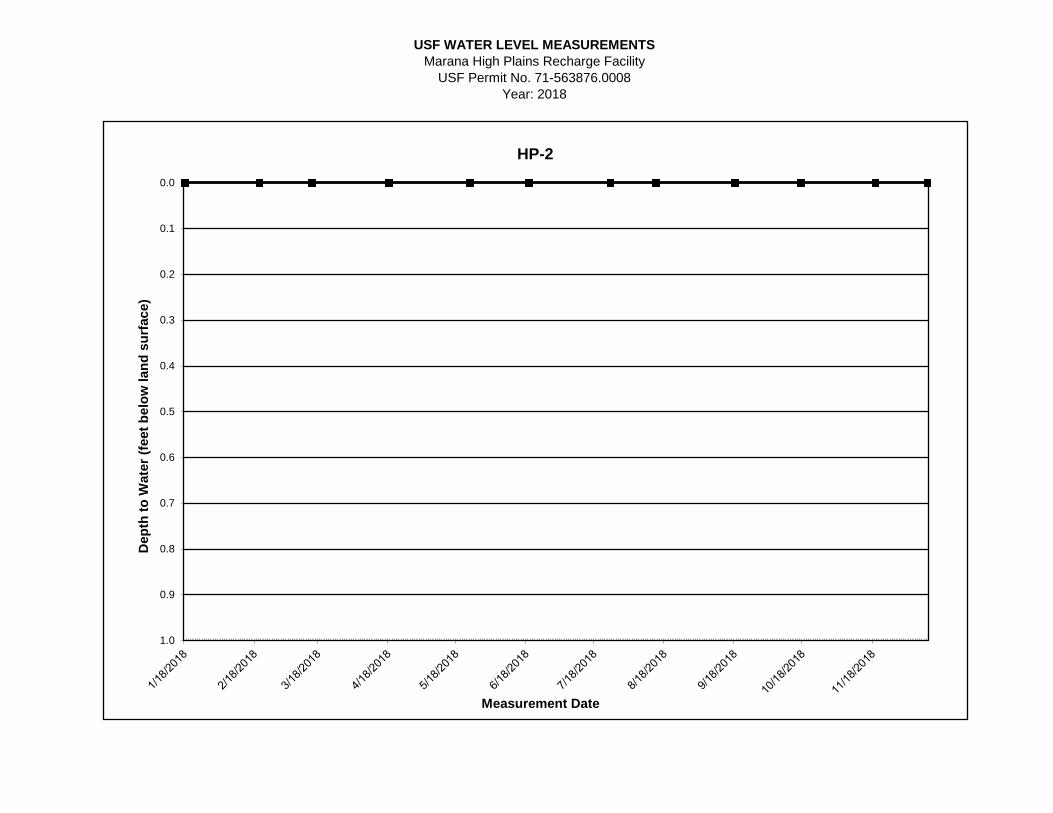
USF WATER LEVEL MEASUREMENTSMarana High Plains Recharge Facility
USF Permit No. 71-563876.0008Year: 2018
0.0
0.1
0.2
0.3
0.4
0.5
0.6
0.7
0.8
0.9
1.0
Dep
th to
Wat
er (f
eet b
elow
land
sur
face
)
Measurement Date
HP-2
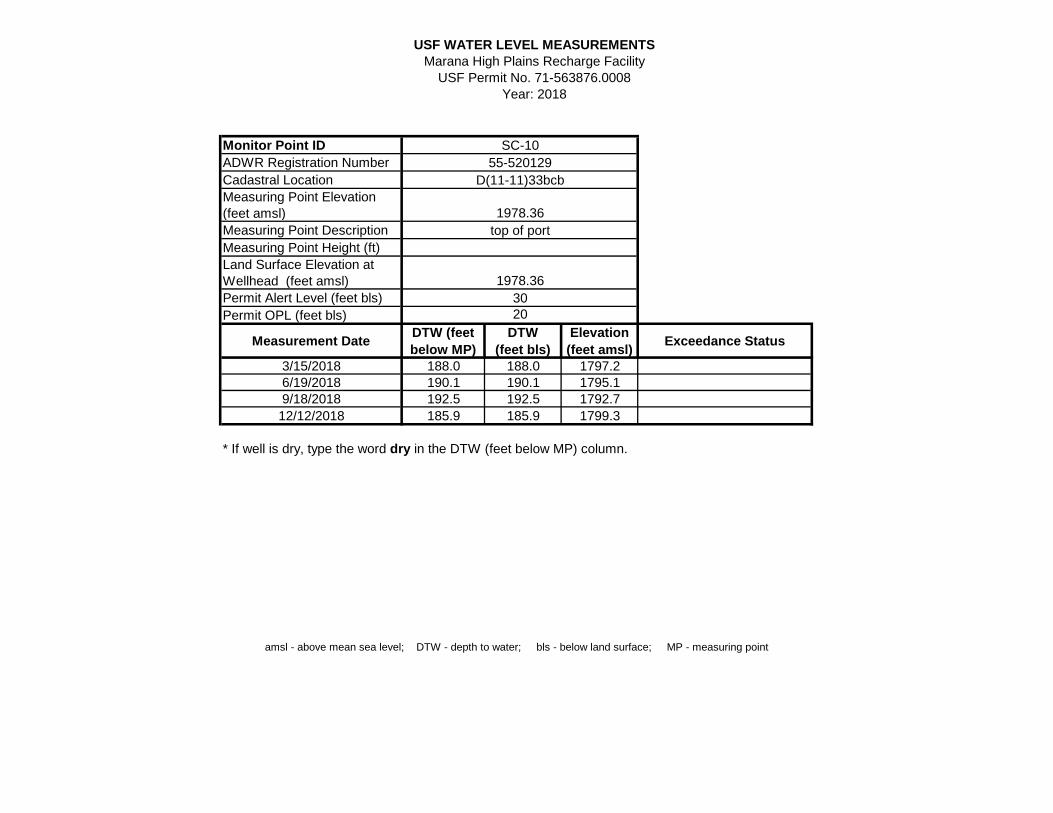
Monitor Point IDADWR Registration NumberCadastral LocationMeasuring Point Elevation (feet amsl)Measuring Point DescriptionMeasuring Point Height (ft)Land Surface Elevation at Wellhead (feet amsl)Permit Alert Level (feet bls)Permit OPL (feet bls)
Measurement Date DTW (feet below MP)
DTW(feet bls)
Elevation(feet amsl) Exceedance Status
3/15/2018 188.0 188.0 1797.26/19/2018 190.1 190.1 1795.19/18/2018 192.5 192.5 1792.712/12/2018 185.9 185.9 1799.3
* If well is dry, type the word dry in the DTW (feet below MP) column.
20
55-520129D(11-11)33bcb
1978.36
SC-10
USF WATER LEVEL MEASUREMENTSMarana High Plains Recharge Facility
1978.3630
amsl - above mean sea level; DTW - depth to water; bls - below land surface; MP - measuring point
USF Permit No. 71-563876.0008Year: 2018
top of port
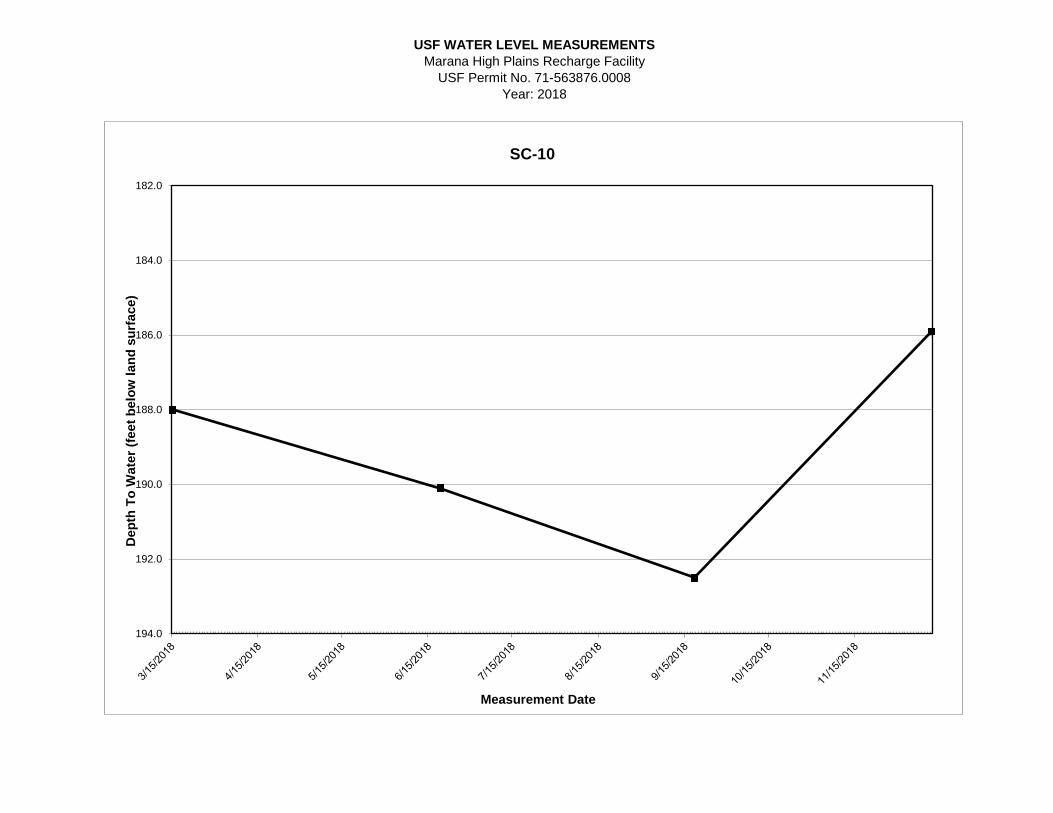
USF WATER LEVEL MEASUREMENTSMarana High Plains Recharge Facility
USF Permit No. 71-563876.0008Year: 2018
182.0
184.0
186.0
188.0
190.0
192.0
194.0
Dep
th T
o W
ater
(fee
t bel
ow la
nd s
urfa
ce)
Measurement Date
SC-10
APPENDIX F Infiltration Rate Data &
Calculations

Net Recharge Volumes
(ac-ft)
Total Wetted Acreages (ac-days)
Infiltration Rate (ft/day)
Quarterly Average Infiltration Rate
(ft/day)
January 50.6 15.5 3.27February 95.4 33.8 2.82March 154.1 39.7 3.88 3.37April 115.1 40.6 2.83May 67.5 47.6 1.42June 73.0 49.8 1.47 1.85July 73.1 89.5 0.82August -0.8 27.9September -0.2 9.8 0.57October -0.1 7.4November -0.1 5.6December 0.0 3.4
Totals 627.7 370.6 1.69
INFILTRATION RATE DATA AND CALCULATIONSMarana High Plains Recharge Facility
USF Permit No. 71-563876.0008Year: 2018